Species-Rich National Forests Experience More Intense Human Modification, but Why?

The Wilderness Society, Bozeman, MT 59715, USA
Forests 2018, 9(12), 753; https://doi.org/10.3390/f9120753
Submission received: 6 November 2018
/
Revised: 28 November 2018
/
Accepted: 30 November 2018
/
Published: 4 December 2018
(This article belongs to the Special Issue Causes and Consequences of Species Diversity in Forest Ecosystems)
Abstract
:Ecologists have studied geographic gradients in biodiversity for decades and recently mapped the intensity of the “human footprint” around the planet. The combination of these efforts have identified some global hotspots of biodiversity that are heavily impacted by human-caused land cover change and infrastructure. However, other hotspots of biodiversity experience less intense modifications from humans. Relationships between species diversity and the human footprint may be driven by covarying factors, like climate, soils, or topography, that coincidentally influence patterns of biodiversity and human land use. Here, I investigated relationships between tree species richness and the degree of human modification among Forest Service ranger districts within the contiguous US. Ranger districts with more tree species tended to experience greater human modification. Using data on climate, soils, and topography, I explored mechanisms explaining the positive relationship between tree richness and human modification. I found that climate is related to both tree richness and human modification, which may be indirectly mediated through climate’s role governing productivity. Ranger districts with more productive climates support more species and greater human modification. To explore potential conservation consequences of these relationships, I also investigated whether the amount of area designated within highly protected conservation lands were related to climate, productivity, and topography. Less productive ranger districts with steeper slopes tended to experience the greatest relative amounts of conservation protection. Combined, these results suggest that complex relationships explain the geographic patterns of biodiversity and the human footprint, but that climate and topography partially govern patterns of each.
1. Introduction
Some forests on Earth support hundreds of different species of trees within a given-sized area (e.g., wet tropical forests), while others only support one species within the same-sized area (e.g., boreal forests) [1]. This variability in the geography of species diversity has intrigued biologists for at least two centuries, and various hypotheses have been proposed to explain gradients in diversity [2]. At more local scales, ecologists also have been studying the consequences of variability in species diversity among sites. Do sites rich with species diversity function differently than sites with fewer species? Are more diverse forests more resistant or resilient to disturbance and drought compared to less diverse forests (e.g., [3,4])? These kinds of questions form the basis of active research programs and have resulted in important insights into the effects of species diversity on ecosystem functions [5]. Acknowledging the role species diversity plays in the functioning of ecosystems influences policy and management of wildland and agricultural ecosystems. For instance, the very mission of the United States Department of Agriculture Forest Service (USFS), which manages 780,000 km2 of land, is “to sustain the health, diversity, and productivity of the Nation’s forests and grasslands to meet the needs of present and future generations” (emphasis added).
Human use of forests to harvest food, fuel, and fiber, as well as the transportation and infrastructure needed to support economies, has altered forested landscapes around the globe [6]. Collectively, human alteration of ecosystems has been described as the “human footprint” [7]. Use of this concept has allowed geographers and ecologists to map the degree of human footprint and by converse—wildlands [8] or wildness [9]. In most regions of the globe, the human footprint has expanded resulting in loss of the planet’s wildlands at accelerating rates [10]. In some cases the human footprint is concentrated in global biodiversity hotspots [7], leaving less diverse regions more wild and undeveloped [10]. The circumboreal taiga forests and tundra, for instance, are relatively wild, but with fewer overall species compared to some places on Earth. Central America, parts of Africa, and Southeast Asia are rich with species and also subjected to an increasing human footprint. Some species-rich regions retain a relatively minimal human footprint (e.g., the Amazon River Basin), but have—in recent years—experienced an increase in human impact [7]. These patterns are concerning and indicate regions in need of conservation to monitor and mitigate human impacts to the most diverse places. The collective impacts of the human footprint on species populations and overall biodiversity result from individual and combined effects of habitat fragmentation, direct harvesting of individuals, vectors for invasive species, among others [11,12].
While relationships between gradients of biodiversity and the human footprint are clear in some regions, the reasons why species rich areas tend to experience a greater degree of human impact are intriguing and somewhat equivocal [13]. Climates favorable to many species tend to be agriculturally productive, but given the limitations of soil resource availability—this is not always the case [13]. Hot humid tropical environments rich in species also can have highly weathered soils that limit potential agricultural productivity [14]. Moreover, actual productivity of biomass and species diversity are sometimes—but not always—positively correlated within and across regions [15]. Therefore, the relationships between climate, species diversity, and the composite human footprint are complex and require further study. This is especially true given the potential conservation implications of biodiversity hotspots being more heavily modified by humans [16].
With these questions in mind, I acquired spatial data on the degree of human modification, species diversity (tree richness), climate, and soils to investigate patterns among ranger districts of USFS lands in the contiguous United States. First, I asked whether USFS ranger districts with the greatest tree species richness experience more intense impacts by humans. Or, is the human footprint randomly distributed among ranger districts with respect to richness of tree species? I then assessed relationships among climate, potential soil productivity, net primary productivity, and topography to investigate environmental conditions that may give rise to observed patterns between tree species richness and human impacts. For instance, are relationships between patterns of species richness and human impacts driven by covarying factors like climate, soils, and topography, or potentially mediated by gradients in forest productivity? Humans may tend to more intensively modify areas rich in species if climatic and topographic conditions that support species-rich areas are also more sought after for agricultural production or other human infrastructure. Finally, I investigated how ranger districts varied in their degree of conservation protection (e.g., wilderness areas) and whether the amount of protection varied along gradients in productivity and topography. I was interested in whether the percentage of ranger districts protected was related to topography or productivity. I predicted that ranger districts with steeper slopes and less productive forests may experience the greatest amount of conservation protection, as these lands are less politically contested for resource extraction (e.g., timber) than highly productive forests with gentler topography [17].
2. Materials and Methods
I focus attention on the 492 USFS ranger districts because their management is governed by a consistent set of laws and regulations, and they are distributed across varying gradients of climate, forest types, and regions (Figure 1). Understanding variability in human modification and species diversity among national forests provides a geographically dispersed and convenient case study for assessing patterns of climate, human modification, and species richness (Figure 1). Results from such a study could also help place local ranger districts into a broader national context when implementing conservation plans within and among national forests.
I obtained data from various sources and brought them into a geographic information system (GIS) to calculate average values of tree richness, human modification, climate, and protected areas for each ranger district (Figure 1). Data on the spatial location and distribution of administrative boundaries of ranger districts were obtained from the USFS geodata clearinghouse (https://data.fs.usda.gov/geodata/). I obtained tree richness estimates from Jenkins et al. (2015) [18], which represents a 10-km resolution mapped gridded dataset representing the number of overlapping tree species based on distribution maps of Little (1971) [19]. Non-native tree species were not included in this dataset. I obtained human modification data from Theobald 2013 [20], which is similar to the global human footprint data [21] but is higher resolution and available for the contiguous US. This data layer is a 270-m resolution composite gridded dataset that ranges from 0 to 1 representing mapped impacts to ecosystems, including developed land cover, land use (including recent timber harvests), roads, transmission lines, and structures. Climate data were obtained from Dobrowski et al. (2013) [22]. I used estimates of average actual evapotranspiration (AET) and annual water deficit, as they integrate temperature and precipitation with topography and latitude to represent climate gradients important for plant growth and the distribution of vegetation types [23]. Net primary productivity data representing modeled annual average g C m−2 year−1 between the years 2000 and 2012 were obtained from the Numerical Terradynamic Simulation Group (NTSG) at the University of Montana [24]. Predicted soil productivity data were developed by Scott et al. (2001) [25] and used by Aycrigg et al. (2013) [26]. The dataset is an ordinal composite score based on five soil factors that influences fertility. I also used a mapped layer of estimated steepness of topography (slope in degrees) that was calculated from a 30-m resolution digital elevation model. Protected area data were obtained from the Conservation Biology Institute [27].
After bringing data into a GIS, I calculated the mean values of tree richness, human modification, AET, soil productivity, and slope steepness for each ranger district (N = 492). I also calculated the percentage of each ranger district that is protected in Gap Analysis Program (GAP) 1 or 2 status lands of conservation areas. GAP status values range from 1 to 4 and represent the degree of conservation protections. GAP 1 and 2 are the highest degrees of protections and include designated wilderness areas and national parks, or other designations that mandate protection of biodiversity, prevention of land cover conversion, and with strict limitations on commercial extractive activities (mining and timber harvests).
I began the analysis by producing a scatterplot of average tree richness and human modification for each ranger district and running a simple linear model to describe the relationship among ranger districts. After finding a significant positive relationship where the ranger districts with the greatest species richness tended to also be the most impacted by humans, I developed a path diagram with hypothesized relationships between climate, soils, topography, productivity, tree richness, and human impacts (Figure 2) to describe possible mechanisms explaining patterns. I considered relationships between exogenous variables (climate, soils, and topography) and endogenous variables (productivity, human modification, and species richness). I purposefully left out the connection between tree richness and human modification in the path diagram, to instead explore potential underlying explanations for the positive relationship between tree richness and human modification. I also included the percentage of land within a protected area in the path diagram to test my predictions concerning conservation protections on ranger districts with varying topographic steepness and productivity. I did not include linkages among all variables. In some cases, variables could be hypothetically linked at finer spatial scales than considered in my assessment. Human modification may, for instance, influence species richness, but I did not include this because of the coarse resolution of the species data. At stand-scales human land use via timber harvesting may influence species composition and diversity [28], but I was interested in broader biogeographic patterns and was limited to coarse data based on continental range maps of trees.
After developing the path diagram, I standardized variables by converting them to z-scores based on their distribution [29] and subjected the path diagram to a structural equation model using the R package “lavaan” [30], relying on fit metrics and parameter estimates to interpret relationships among variables. Specifically, I evaluated the Χ2 model fit test statistic (where p-value > 0.05 suggest goodness of fit), comparative fit index (CFI) and Tucker-Lewis Index (TFI), the root mean square error of approximation (RMSEA), and the standardized root mean square residual (SRMS) [31]. I also evaluated the parameter estimates for each path in the model and plotted the significant results in an updated path diagram highlighting positive and negative relationships and their relative values. I first included both AET and water deficit in a latent variable “climate”, which did not improve overall model fit. Instead, for my final model, I used AET alone, which is correlated with water deficit (r = −0.62, p < 0.001) and resulted in a better overall model fit.
3. Results
Ranger districts with more predicted tree species tended to be more heavily modified by humans compared to ranger districts with fewer species (Figure 3). For instance, the predicted degree of human modification roughly doubles from ranger districts with 30 estimated species to those with 90 species (i.e., slope of relationship = 0.0034, p < 0.0001).
The proposed path model fit well the structure of the data (Χ2 = 1.48; p-value = 0.687; d.f. = 3; RMSEA = 0 with 90% confidence intervals of 0 and 0.058; SRMR = 0.009; CFI = 1.0; TLI = 1.0; Figure 4; Table 1). A p-value > 0.05 from the Χ2 test provides support for the proposed structure in the path model [29]. Endogenous modeled relationships varied in their degree of explanatory power with models of tree richness and human modification having the highest R2 values of 0.815 and 0.621, respectively. R2 values for paths to productivity and conservation protection were lower at 0.286 and 0.170, respectively.
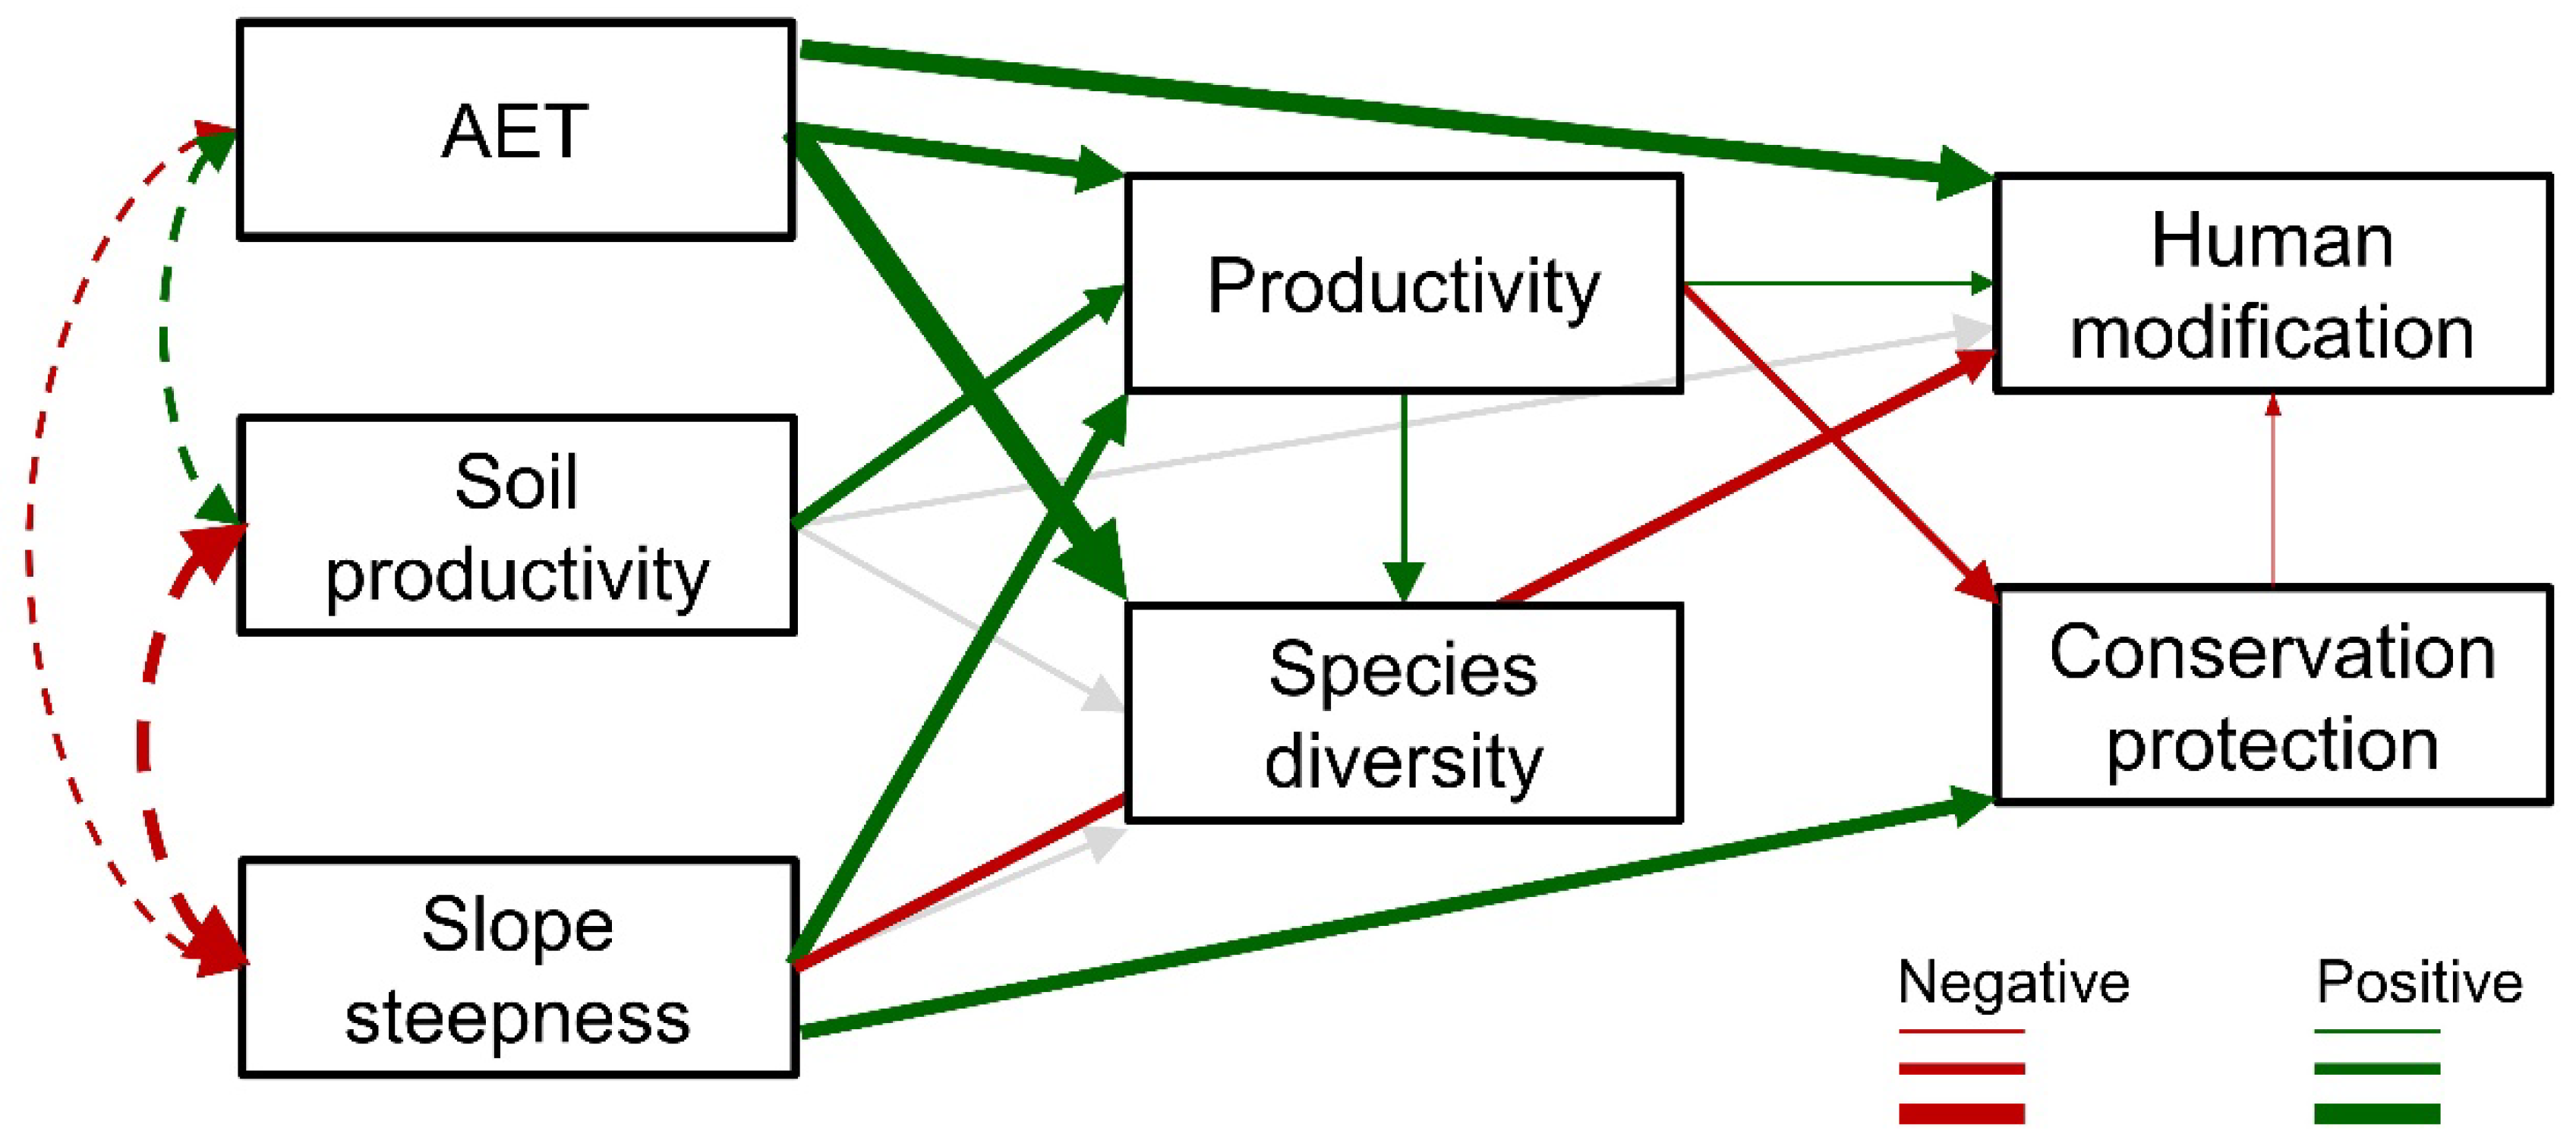
The strength and nature (positive or negative) of relationships in the proposed path model varied from non-significant, positive, and negative (Figure 4; Table 1). For instance, AET was positively related to productivity, species richness, and the degree of human modification. Specifically, ranger districts with higher AET were more productive, species rich, and heavily modified. Not surprisingly, estimated soil productivity was positively related to observed productivity. Perhaps more surprisingly, the path coefficient between soil productivity and human modification was not related among ranger districts. Steepness of slope was positively related to productivity and conservation protection, but negatively related to human modification. Ranger districts with steeper slopes tended to be more productive. In general more mountainous districts captured more carbon. However, more topographically steep ranger districts also have more of their area in GAP 1 or 2 lands. Productivity was positively associated with species diversity and human modification, but negatively related to conservation protection. More productive ranger districts tended to be more diverse and more heavily modified and have less relative area in GAP 1 or 2 lands.
4. Discussion
Why some places are more biologically diverse than others and why some places are more heavily impacted by humans than others are two important questions explored by ecologists, geographers, and conservation scientists. USFS ranger districts richest in tree species tended to be more modified by humans. Species-rich ranger districts are closer to concentrations of high human population density, developed lands, and infrastructure like roads and utility transmission lines compared to less species rich forests. This relationship—where the most diverse lands are most modified by humans—seems to be most strongly driven by climate. Climatic conditions related to high species richness are also associated with lands more heavily modified by humans. However, soils and topography, in some cases via their influence on productivity, also seem to partially explain the relationship.
The most species rich and modified ranger districts occur in the Southeastern US. Most of the eastern national forests were obtained by the US federal government from private land in the early 1900s after having been subjected to intensive and widespread tree harvesting by private individuals and timber companies [32]. In contrast, most western forest service lands were established from existing federal lands [33]. Therefore, the history of land use and management tenure differs between species-rich eastern and less-rich western forests. The indirect role that climate played in the history of land use is more difficult to investigate, but climate likely plays a role in geographic patterns of land use and settlement [34]. Areas with climates more favorable for crop production are typically more intensively managed with greater land cover conversions to agriculture and resulting human settlement and development of infrastructure [35]. Climate thus seems to at least partially influence patterns of human modification.
Climate also governs geographic gradients in species diversity [36]. Climate as a common variable influencing both patterns of land use and species diversity results in an indirect relationship between tree richness and the degree of human modification. The relationship between biodiversity and human footprint has been observed globally, with striking exceptions that reveal other limiting factors on human land use, namely topographic and soil-based limitations. At a global scale, climatic conditions favorable to tree diversity also have resulted in weathered soils that can be unproductive for agricultural use [13,14]. Therefore, in some areas on Earth, climate favorable to plant production and high species diversity are relatively unmodified by humans. In the case of ranger districts of national forests studied here, soil productivity—at least based on the dataset I used—was not directly related to human modification and species richness. Rather, soil productivity was indirectly related to tree richness and human modification via observed vegetation productivity. The most productive soils were more productive in terms of biomass accumulation, which has a positive relationship with tree richness and human modification. Not surprisingly, slope steepness was also related to human modification. Ranger districts with steeper slopes were less impacted by human modification. Similar patterns are observed globally, where the human footprint tends to be lower in areas characterized by soils with limited agricultural suitability [7].
Steepness of slope also predicted how much of each ranger district was protected in conservation reserves classified under GAP 1 or 2 status. The steeper the slopes across ranger districts, the higher proportion of land that was protected. This is also not surprising and has been observed in other studies [26], as steep slopes may be politically less contentious for legislative or administrative conservation protections that limit commercial resource extractions, like timber harvests. Forests with steeper slopes are more difficult and costly to harvest, and therefore represent lands more easily set-aside in reserves [17]. Interestingly, more productive ranger districts tend to have lower relative amounts of lands protected in GAP 1 or 2 conservation reserves. This pattern could be driven by the fact that less productive forests—like steep slopes—are less economically viable for commercial timber harvests. Productive forests are more likely to be sought after for active timber harvesting programs [17], making limitations to commercial extraction of those forests more politically difficult. An important area of ongoing conservation research seeks to identify lands rich with species that are currently under-represented in protected areas or areas that could serve to maintain large resilient landscapes [37,38]. There may be such opportunities in the species-rich and less well protected forests of the southeastern US [18,39].
While I have tried to uncover some biogeographic patterns of tree richness, human modification, climate, and topography, the conservation consequences of these patterns are less clear. Across national forests of the contiguous US, humans seem to have preferentially modified lands rich in species over less species rich lands. How the consequences of these modifications and their associated impacts to ecological composition, structure, and function also vary across gradients of productivity, diversity, climate, and topography may form the core of future research questions. If humans modify species-rich areas more than species poor areas, are more species exposed to detrimental impacts of human modifications, resulting in greater conservation concern? Alternatively, because species rich areas tend to be more productive, could these human-modified ecosystems have more capacity to absorb impacts and recover? Evidence supports both alternatives, depending on the metric used to assess the questions. Species-rich areas of the Southeastern US have functionally lost foundational species, like the American chestnut (Castanea dentata (Marshall) Borkh.), the result of an introduced fungus from Asia [40]. Tree species composition throughout the region continues to be altered by mortality from pests and pathogens, and the introduction of non-native trees [41,42]. Human pressures have also resulted in the regional extirpation of many vertebrate species [43]. The eastern forests have also shown high capacity to recover following widespread, intensive timber clearing and subsequent high-grade logging [44,45]. However, land use demands in recent years has reduced forest cover within ecoregions of the eastern US via increased development or forest harvesting [46].
While less species-rich ranger districts of the western US experience less human modification, these patterns could be the result of the history of land use that accompanied Euro-American settlement patterns, in addition to climatic influences of land use. Because western forests have not already been as modified as the eastern forests does not mean that they will not be modified if development of human infrastructure is left unmitigated. The expansion of the human footprint continues to increase across the west [47], including into climates and topographies that may have once limited development. Data presented here provide a national perspective on public forests, their degree of modification (and therefore their degree of wildness [38]), tree richness, and proportion protected in conservation reserves. Data summarized here could be used to identify valuable (wild and/or diverse) forests that may be priorities for additional conservation based on their limited levels of conservation areas. In other words, these data could identify valuable but insufficiently protected ranger districts (sensu [46]). In some cases, the most species rich ranger districts may be priorities for additional conservation protection [18,48]. In other cases, the least human modified (wildest) forests with minimal protection may be priorities for designating future conservation reserves [49,50]. The data summarized here can be used to identify the wildest remaining forests with relatively low levels of protections.
There are several important limitations and caveats with this analysis. First, data were summarized within USFS ranger districts, which are large (median area of ranger districts was 154,884 hectares). My aim was to explore broad biogeographic gradients in human modification, biodiversity, soils, topography, and climate among ranger districts. However, finer-scaled gradients of these factors could reveal important patterns and insights. Second, geographic patterns reflecting relationships between people and nature (i.e., social-ecological systems) are almost certainly more complex than what I investigated. Research using other data, including individual variables used to create composite scores of human modifications could yield interesting insights into which components of human modification (e.g., roads, human population density, etc.) are related to which climatic or topo-edaphic patterns. Third, I worked with the boundaries of ranger districts available through the USFS geodata clearinghouse. However, these maps represent administrative boundaries that do not always reflect ownership boundaries. Across all ranger districts, over 93% of administrative boundaries are also owned and managed by the USFS, but in the eastern US inholdings and land not yet purchased occur throughout the administrative boundaries. In some cases, private roads or homes are included in the administrative boundary for the ranger district. To explore the consequences of the different areas representing USFS lands, I produced the scatterplot between tree richness and human modification for ownership boundaries of ranger districts (from the protected areas database of the Conservation Biology Institute [27]), and found patterns matched those presented in Figure 2. Finally, I used relatively coarse estimates of tree richness based on maps of overlapping distributions of species. However, plot-level data (e.g., from the Forest Inventory and Analysis (FIA) program) could be used to estimate local to regional gradients in diversity, and whether patterns change depending on the scale that tree diversity is sampled [2,51].
5. Conclusions
I explored broad patterns of tree richness, human modification, climate, topography, soils, and conservation protection to try and uncover potential properties explaining why the most species diverse USFS ranger districts are most impacted by humans. Climate and other geophysical factors seem to simultaneously govern both tree richness and intensity of the degree of human modification. Understanding these kinds of geographic patterns in the biogeography of ecosystems and land use may provide important perspectives into the nature of social-ecological systems and insights into conservation of species-rich and relatively wild, unmodified places. The threats to biodiversity caused by intensive human modification in species-rich areas should form the basis of future global- and local-scale research. Areas rich with species that are relatively free of human modification, which I have found to be uncommon in the contiguous US, may be regarded as high priorities for additional conservation protections [18].
Funding
This research received no external funding beyond The Wilderness Society.
Acknowledgments
Thanks to Clinton Jenkins, Dave Theobald, Solomon Dobrowski, Jocelyn Aycrigg, Steve Running and NTSG, and others for making spatial data publicly available. Thanks to Aaron Ellison and Frank Gilliam for the invitation to contribute to this special issue. Finally, thanks to Greg Aplet for inspiration to explore these questions.
Conflicts of Interest
The author declares no conflict of interest.
References
- Fine, P.V.A.; Ree, R.H. Evidence for a time-integrated species-area effect on the latitudinal gradient in tree diversity. Am. Nat. 2006, 168, 796–804. [Google Scholar] [CrossRef]
- Keil, P.; Chase, J. Integrating global patterns and drivers of tree diversity across a continuum of spatial grains. bioRxiv 2018. [Google Scholar] [CrossRef]
- Anderegg, W.R.L.; Konings, A.G.; Trugman, A.T.; Yu, K.; Bowling, D.R.; Gabbitas, R.; Karp, D.S.; Pacala, S.; Sperry, J.S.; Sulman, B.N.; et al. Hydraulic diversity of forests regulates ecosystem resilience during drought. Nature 2018, 561, 538–541. [Google Scholar] [CrossRef] [PubMed]
- Naeem, S.; Wright, J.P. Disentangling biodiversity effects on ecosystem functioning: Deriving solutions to a seemingly insurmountable problem. Ecol. Lett. 2003, 6, 567–579. [Google Scholar] [CrossRef]
- Loreau, M.; Naeem, S.; Inchausti, P.; Bengtsson, J.; Grime, J.P.; Hector, A.; Hooper, D.U.; Huston, M.A.; Raffaelli, D.; Schmid, B.; et al. Biodiversity and ecosystem functioning: Current knowledge and future challenges. Science 2001, 294, 804–808. [Google Scholar] [CrossRef] [PubMed]
- Haddad, N.M.; Brudvig, L.A.; Clobert, J.; Davies, K.F.; Gonzalez, A.; Holt, R.D.; Lovejoy, T.E.; Sexton, J.O.; Austin, M.P.; Collins, C.D.; et al. Habitat fragmentation and its lasting impact on Earth’s ecosystems. Sci. Adv. 2015, 1, e1500052. [Google Scholar] [CrossRef]
- Venter, O.; Sanderson, E.W.; Magrach, A.; Allan, J.R.; Beher, J.; Jones, K.R.; Possingham, H.P.; Laurance, W.F.; Wood, P.; Fekete, B.M.; et al. Sixteen years of change in the global terrestrial human footprint and implications for biodiversity conservation. Nat. Commun. 2016, 7, 1–11. [Google Scholar] [CrossRef]
- Sanderson, E.W.; Jaiteh, M.; Levy, M.; Redford, K.H.; Wannebo, A.V.; Woolmer, G. The human footprint and the last of the wild. Bioscience 2002, 52, 891–904. [Google Scholar] [CrossRef]
- Aplet, G.; Thomson, J.; Wilbert, M. Indicators of wildness: Using attributes of the land to assess the context of wilderness. In Proceedings of the Wilderness Science in a Time of Change, Missoula, MT, USA, 23–27 May 1999; McCool, S.F., Cole, D.N., Borrie, W.T., O’Laughlin, J., Eds.; 2000; RMRS-P-15, pp. 89–98. [Google Scholar]
- Watson, J.E.M.; Shanahan, D.F.; Marco, M.D.; Allan, J.; Laurance, W.F.; Sanderson, E.W.; Mackey, B.; Venter, O. Catastrophic declines in wilderness areas undermine global environment targets. Curr. Biol. 2016, 26, 1–6. [Google Scholar] [CrossRef]
- Pimm, S.L.; Jenkins, C.N.; Abell, R.; Brooks, T.M.; Gittleman, J.L.; Joppa, L.N.; Raven, P.H.; Roberts, C.M.; Sexton, J.O. The biodiversity of species and their rates of extinction, distribution, and protection. Science 2014, 344, 1246752. [Google Scholar] [CrossRef]
- Wilcove, D.S.; Rothstein, D.; Dubow, J.; Phillips, A.; Losos, E. Quantifying threats to imperiled species in the United States. Bioscience 1998, 48, 607–615. [Google Scholar] [CrossRef]
- Huston, M. Biological and Diversity, Economics, and Soils. Science 1993, 262, 1676–1680. [Google Scholar] [CrossRef] [PubMed]
- Huston, M.A.; Wolverton, S. The global distribution of net primary production: Resolving the paradox. Ecol. Monogr. 2009, 79, 343–377. [Google Scholar] [CrossRef]
- Belote, R.T.; Prisley, S.; Jones, R.H.; Fitzpatrick, M.; de Beurs, K. Forest productivity and tree diversity relationships depend on ecological context within mid-Atlantic and Appalachian forests (USA). For. Ecol. Manag. 2011, 261, 1315–1324. [Google Scholar] [CrossRef]
- Jenkins, C.N.; Pimm, S.L.; Joppa, L.N. Global patterns of terrestrial vertebrate diversity and conservation. Proc. Natl. Acad. Sci. USA 2013, 110, E2602–E2610. [Google Scholar] [CrossRef] [PubMed]
- Belote, R.T.; Aplet, G.H. Land protection and timber harvesting along productivity and diversity gradients in the Northern Rocky Mountains. Ecosphere 2014, 5. [Google Scholar] [CrossRef]
- Jenkins, C.N.; Van Houtan, K.S.; Pimm, S.L.; Sexton, J.O. US protected lands mismatch biodiversity priorities. Proc. Natl. Acad. Sci. USA 2015, 112, 5081–5086. [Google Scholar] [CrossRef] [PubMed] [Green Version]
- Little, E.L. Atlas of United States Trees; U.S. Department of Agriculture Forest Service: Washington, DC, USA, 1971.
- Theobald, D.M. A general model to quantify ecological integrity for landscape assessments and US application. Landsc. Ecol. 2013, 28, 1859–1874. [Google Scholar] [CrossRef]
- Venter, O.; Sanderson, E.W.; Magrach, A.; Allan, J.R.; Beher, J.; Jones, K.R.; Possingham, H.P.; Laurance, W.F.; Wood, P.; Fekete, B.M.; et al. Global terrestrial Human Footprint maps for 1993 and 2009. Sci. Data 2016, 160067. [Google Scholar] [CrossRef]
- Dobrowski, S.Z.; Abatzoglou, J.; Swanson, A.K.; Greenberg, J.A.; Mynsberge, A.R.; Holden, Z.A.; Schwartz, M.K. The climate velocity of the contiguous United States during the 20th century. Glob. Chang. Biol. 2013, 19, 241–251. [Google Scholar] [CrossRef]
- Stephenson, N.L. Climatic control of vegetation distribution: The role of the water balance. Am. Nat. 1990, 135, 649–670. [Google Scholar] [CrossRef]
- Zhao, M.; Heinsch, F.A.; Nemani, R.R.; Running, S.W. Improvements of the MODIS terrestrial gross and net primary production global data set. Remote Sens. Environ. 2005, 95, 164–176. [Google Scholar] [CrossRef]
- Scott, J.M.; Davis, F.W.; McGhie, R.G.; Wright, R.G.; Groves, C.; Estes, J. Nature reserves: Do they capture the full range of America’s biological diversity? Ecol. Appl. 2001, 11, 999–1007. [Google Scholar] [CrossRef]
- Aycrigg, J.L.; Davidson, A.; Svancara, L.K.; Gergely, K.J.; McKerrow, A.; Scott, J.M. Representation of ecological systems within the protected areas network of the continental United States. PLoS ONE 2013, 8, e54689. [Google Scholar] [CrossRef] [PubMed]
- The Conservation Biology Institute. PAD-US (CBI Edition) Version 2.1; The Conservation Biology Institute: Corvallis, OR, USA, 2015. [Google Scholar]
- Belote, R.T.; Jones, R.H.; Hood, S.M.; Wender, B.W. Diversity-invasibility across an experimental disturbance gradient in Appalachian forests. Ecology 2008, 89. [Google Scholar] [CrossRef]
- Grace, J.B. Structural Equation Modeling and Natural Systems; Cambridge University Press: Cambridge, UK, 2006. [Google Scholar]
- Rosseel, Y. lavaan: An R package for structural equation modeling. J. Stat. Softw. 2012, 48, 1–36. [Google Scholar] [CrossRef]
- Barrett, P. Structural equation modelling: Adjudging model fit. Pers. Individ. Differ. 2007, 42, 815–824. [Google Scholar] [CrossRef]
- Shands, W.E.; Healy, R.G. The Lands Nobody Wanted: Policy for National Forests in the Eastern United States; Conservation Foundation: Washington, DC, USA, 1977. [Google Scholar]
- Hessburg, P.F.; Agee, J.K. An Environmental Narrative of Inland Northwest United States Forests, 1800–2000. For. Ecol. Manag. 2003, 178, 23–59. [Google Scholar] [CrossRef]
- Lieberman, B.; Gordan, E. Climate Change in Human History: Prehistory to the present; Bloomsbury Academic: London, UK, 2018; ISBN 9781472598493. [Google Scholar]
- Diamond, J.M. Guns, Germs and Steel: A Short History of Everybody for the Last 13,000 Years; Random House: New York, NY, USA, 1998; ISBN 0099302780. [Google Scholar]
- Francis, A.P.; Currie, D.J. A globally consistent richness-climate relationship for angiosperms. Am. Nat. 2003, 161, 523–536. [Google Scholar] [CrossRef]
- Dietz, M.S.; Belote, R.T.; Aplet, G.H.; Aycrigg, J.L. The world’s largest wilderness protection network after 50 years: An assessment of ecological system representation in the U.S. National Wilderness Preservation System. Biol. Conserv. 2015, 184, 431–438. [Google Scholar] [CrossRef]
- Belote, R.T.; Dietz, M.S.; Jenkins, C.N.; McKinley, P.S.; Irwin, G.H.; Fullman, T.J.; Leppi, J.C.; Aplet, G.H. Wild, connected, and diverse: Building a more resilient system of protected areas. Ecol. Appl. 2017, 27, 1050–1056. [Google Scholar] [CrossRef] [PubMed]
- Noss, R.F.; Platt, W.J.; Sorrie, B.A.; Weakley, A.S.; Means, D.B.; Costanza, J.; Peet, R.K. How global biodiversity hotspots may go unrecognized: Lessons from the North American Coastal Plain. Divers. Distrib. 2015, 21, 236–244. [Google Scholar] [CrossRef]
- Ellison, A.M.; Bank, M.S.; Clinton, B.D.; Colburn, E.A.; Elliott, K.; Ford, C.R.; Foster, D.R.; Kloeppel, B.D.; Knoepp, J.D.; Lovett, G.M.; et al. Loss of foundation species: Consequences for the structure and dynamics of forested ecosystems. Front. Ecol. Environ. 2005, 3, 479–486. [Google Scholar] [CrossRef]
- Lovett, G.M.; Canham, C.D.; Arthur, M.A.; Weathers, K.C.; Fitzhugh, R.D. Forest Ecosystem Responses to Exotic Pests and Pathogens in Eastern North America. Bioscience 2006, 56, 395–405. [Google Scholar] [CrossRef]
- Riitters, K.; Potter, K.; Iannone, B.; Oswalt, C.; Guo, Q.; Fei, S.; Riitters, K.; Potter, K.M.; Iannone, B.V.; Oswalt, C.; et al. Exposure of protected and unprotected forest to plant invasions in the eastern United States. Forests 2018, 9, 723. [Google Scholar] [CrossRef]
- Faurby, S.; Svenning, J.C. Historic and prehistoric human-driven extinctions have reshaped global mammal diversity patterns. Divers. Distrib. 2015, 21, 1155–1166. [Google Scholar] [CrossRef] [Green Version]
- Houghton, R.A.; Hackler, J.L. Changes in terrestrial carbon storage in the United States. 1: The roles of agriculture and forestry. Glob. Ecol. Biogeogr. 2000, 9, 125–144. [Google Scholar] [CrossRef]
- Belote, R.T.; Jones, R.H.; Wieboldt, T.F. Compositional stability and diversity of vascular plant communities following logging disturbance in Appalachian forests. Ecol. Appl. 2012, 22. [Google Scholar] [CrossRef]
- Drummond, M.A.; Loveland, T.R. Land-use pressure and a transition to forest-cover loss in the Eastern United States. Bioscience 2010, 60, 286–298. [Google Scholar] [CrossRef]
- Theobald, D.M.; Zachmann, L.J.; Dickson, B.G.; Gray, M.E.; Albano, C.M.; Landau, V.; Harrison-Atlas, D. The Disappearing West: Description of the Approach, Data, and Analytical Methods Used to Estimate Natural Land Loss in the Western U.S.; Conservation Science Partners: Truckee, CA, USA, 2016. [Google Scholar]
- Belote, R.T.; Irwin, G.H. Quantifying the national significance of local areas for regional conservation planning: North Carolina’s Mountain Treasures. Land 2017, 6, 35. [Google Scholar] [CrossRef]
- Kareiva, P.; Marvier, M. Conserving biodiversity coldspots. Am. Sci. 2003, 91, 344–351. [Google Scholar] [CrossRef]
- Watson, J.E.M.; Venter, O.; Lee, J.; Jones, K.R.; Robinson, J.G.; Possingham, H.P.; Allan, J.R. Protect the last of the wild. Nature 2018, 563, 27–30. [Google Scholar] [CrossRef] [PubMed]
- LaManna, J.A.; Belote, R.T.; Burkle, L.A.; Catano, C.P.; Myers, J.A. Negative density dependence mediates biodiversity-productivity relationships across scales. Nat. Ecol. Evol. 2017, 1. [Google Scholar] [CrossRef] [PubMed]
Figure 1.
Spatial data used to analyze relationships between tree species richness, the degree of human modification, climate, vegetation productivity, soil productivity, and topography. Forest cover is shown for reference.
Figure 1.
Spatial data used to analyze relationships between tree species richness, the degree of human modification, climate, vegetation productivity, soil productivity, and topography. Forest cover is shown for reference.

Figure 2.
Hypothetical path diagram depicting relationships between climate, soils, topography and their direct or indirect influence on productivity, species diversity (tree richness), the degree of human modification, and conservation protection of United States Department of Agriculture Forest Service (USFS) ranger districts.

Figure 3.
Relationship between average tree richness (predicted number of species based on overlapping species within mapped 10-km grid cells) and the average degree of human modification of USFS ranger districts located in the contiguous US (N = 492). I added vegetation net primary productivity (NPP; g C m−2 year−1) as a color ramp to illustrate additional patterns.

Figure 4.
Results of path analysis from the hypothetical path model presented in Figure 2. Significant relationships in path coefficients are highlighted in either red (negative estimates) or green (positive estimates) with the weight of the line varying with the size of the estimates (Table 1). Grey lines represent non-significant paths. Dashed lines show correlations between exogenous variables. AET = actual evapotranspiration, an estimate of climates favorable to plant growth; NPP = net primary productivity.

Table 1.
Estimates of coefficients for relationships between factors in the proposed path diagram shown in Figure 1. Results are plotted in Figure 4.
| Estimate | Standard Error | z-Value | p-Value | |
|---|---|---|---|---|
| Human modification | ||||
| Conservation protection | −0.069 | 0.028 | −2.425 | 0.015 |
| Slope steepness | −0.248 | 0.045 | −5.54 | <0.001 |
| Productivity | 0.096 | 0.033 | 2.892 | 0.004 |
| AET | 0.594 | 0.034 | 17.274 | <0.001 |
| Soil productivity | −0.004 | 0.042 | −0.095 | 0.925 |
| Conservation protection | ||||
| Productivity | −0.194 | 0.041 | −4.719 | <0.001 |
| Slope steepness | 0.375 | 0.041 | 9.118 | <0.001 |
| Productivity | ||||
| AET | 0.472 | 0.042 | 11.175 | <0.001 |
| Slope steepness | 0.489 | 0.055 | 8.82 | <0.001 |
| Soil productivity | 0.339 | 0.056 | 6.081 | <0.001 |
| Species richness | ||||
| Productivity | 0.133 | 0.023 | 5.79 | <0.001 |
| AET | 0.843 | 0.024 | 35.066 | <0.001 |
| Soil productivity | 0.007 | 0.029 | 0.227 | 0.82 |
| Slope steepness | 0.019 | 0.03 | 0.617 | 0.537 |
© 2018 by the author. Licensee MDPI, Basel, Switzerland. This article is an open access article distributed under the terms and conditions of the Creative Commons Attribution (CC BY) license (http://creativecommons.org/licenses/by/4.0/).
Share and Cite
MDPI and ACS Style
Belote, R.T. Species-Rich National Forests Experience More Intense Human Modification, but Why? Forests 2018, 9, 753. https://doi.org/10.3390/f9120753
AMA Style
Belote RT. Species-Rich National Forests Experience More Intense Human Modification, but Why? Forests. 2018; 9(12):753. https://doi.org/10.3390/f9120753
Chicago/Turabian StyleBelote, R. Travis. 2018. "Species-Rich National Forests Experience More Intense Human Modification, but Why?" Forests 9, no. 12: 753. https://doi.org/10.3390/f9120753
Note that from the first issue of 2016, this journal uses article numbers instead of page numbers. See further details here.