Article

Plant Community Diversity and Tree Growth Following Single and Repeated Glyphosate Herbicide Applications to a White Spruce Plantation

1
Department of Renewable Resources, University of Alberta, Edmonton, AB T6G 2H1, Canada
2
Forest Management Branch, Alberta Agriculture and Forestry, Edmonton, AB T5K 2M4, Canada
*
Author to whom correspondence should be addressed.
Forests 2018, 9(3), 107; https://doi.org/10.3390/f9030107
Submission received: 2 February 2018 / Revised: 19 February 2018 / Accepted: 26 February 2018 / Published: 28 February 2018
(This article belongs to the Section Forest Ecology and Management)

Abstract

:
Glyphosate herbicide is widely used to control bluejoint reedgrass (Calamagrostis canadensis (Michx.) Beauv.), trembling aspen (Populus tremuloides Michx.), and other competing species in regenerating white spruce (Picea glauca (Moench) Voss) plantations in Alberta, Canada. In 2004, we initiated a study to examine the effects of the aerial application of glyphosate herbicide on plant community diversity and tree growth near Calling Lake, Alberta. Four treatments were applied: (a) no treatment (control); (b) herbicide application in the first growing season after harvesting; (c) herbicide application in the third growing season after harvesting; and (d) herbicide application in the second and fourth growing seasons after harvesting (two treatments). After 11 growing seasons, species richness was not significantly affected by treatment, while Shannon and Simpson index values were highest in areas treated with herbicide in the first growing season. Herbicide treatment did not have a significant effect on the cover of bluejoint reedgrass after 11 growing seasons, but did significantly reduce trembling aspen and paper birch cover and height. Application of glyphosate in the second and fourth growing seasons resulted in the greatest reductions to aspen cover and height, as well as significant increases in spruce diameter at age 11. Simulations with the Mixedwood Growth Model indicate that all tested herbicide treatments will reduce aspen volume while increasing spruce volume at age 90, with the largest impacts evident where two treatments were applied.

1. Introduction

Management of competing vegetation is widely practiced in regenerating Canadian forests because it has been repeatedly shown to improve survival and growth of planted and naturally regenerated coniferous trees [1]. Mechanical treatments, herbicide application, cutting or pulling, and livestock grazing are all commonly used to provide vegetation control in Canadian forests [1]. Aerial herbicide treatments are often the least expensive option [2] and herbicide treatments generally have been shown to provide more effective reductions in competition and longer duration of control than alternatives [3]. Glyphosate-based herbicides in particular are used widely in many regions of Canada because they provide effective control of a range of shrubs, forbs, and grasses, and can be applied over regenerating and residual conifers at moderate to low rates without causing damage. However, use of a broad-spectrum herbicide such as glyphosate that has the potential to kill or suppress many plant species has given rise to concern about potential impacts on plant community diversity and composition in treated forests, as well as possible larger scale impacts to other organisms, the ecological services provided by the forest, and long-term forest productivity [4].
In Alberta’s boreal forests, bluejoint reedgrass (Calamagrostis canadensis (Michx.) Beauv.), trembling aspen (Populus tremuloides Michx.), and other vegetation are often considered barriers to optimal growth and survival of white spruce (Picea glauca (Moench) Voss) plantations. Glyphosate herbicide is a common vegetation management tool that has been demonstrated to improve survival and growth of young conifers and increase the chances of successfully achieving the province’s mandatory regeneration standards. In Alberta, a total of 470,000 ha received chemical release treatments during the 15-year period ending in 2015 [5]. These release treatments primarily involved aerial application of glyphosate herbicides. In some cases, two treatments, timed 2 or 3 years apart, have been applied to cutover areas to control competing vegetation in young spruce plantations.
For forestry use in Canada, glyphosate herbicide is currently sold under tradenames such as Vision® and Vantage®. It is a broad-spectrum herbicide that is absorbed primarily through leaf surfaces and kills plants by interfering with the synthesis of certain amino acids [6]. Damage to coniferous species such as white spruce, Douglas-fir, and lodgepole pine is avoided by applying glyphosate in late summer when active growth of leaves and buds has ceased and the leaves have developed a waxy cuticle, and also by applying the herbicide at appropriate rates. Broadleaf trees and shrubs, herbs, and grasses, however, are still effectively controlled by treatment at this time of year and at these rates. Optimal timing and rates of application have been determined through local field experiments. Its relatively low toxicity to animals and people, the fact that it does not persist or move in the environment [6], and its effectiveness have led to the widespread use of glyphosate for vegetation management in some regions of Canada [7].
While short-term reductions in total vegetation cover are typically observed following herbicide treatments, several studies show that a single application of glyphosate in boreal spruce plantations can either increase or have no effect on plant community diversity [8,9,10,11,12,13]. However, these studies generally report decreases in woody cover and increases in herbaceous cover following herbicide treatments. This trend has generally been attributed to the initial reduction in abundance of the dominant competitive species, such as bluejoint reedgrass and trembling aspen [12,13], which provides the other species on site a period with low levels of competition.
The timing of herbicide application also appears to affect plant community diversity and composition, as well as growth of coniferous tree species. Results from studies in eastern Canada indicate that conifers generally show greater growth responses to early (e.g., site preparation before tree planting) treatments than to delayed treatments [14,15]. However, a study in Manitoba, Canada, showed no effects of age of treatment (between 1 and 5 years after planting) on growth of white spruce, black spruce, or jack pine resulting from a single aerial application [16]. In this experiment, the response was attributed to the replacement of woody vegetation by herbs and grasses following a single herbicide treatment [16]. Information on potential impacts of herbicide application timing or frequency (one vs. two applications) on plant community diversity and conifer survival and growth in the boreal forests of western Canada is limited, and there are no published studies dealing with herbicide treatment effects on plant community diversity in Alberta spruce plantations.
In 2004, we initiated this study to examine: (1) the effects of timing of a single glyphosate treatment on vegetation cover, plant community diversity, and spruce growth; and (2) the effects of two treatments compared to a single treatment on vegetation cover, plant community diversity, and spruce growth. Our working hypotheses were that: (1) a single herbicide treatment would cause a temporary reduction in vegetation cover, but would not reduce plant community diversity, and would increase spruce growth; (2) two herbicide treatments would provide longer-term reductions in vegetation cover, would reduce plant community diversity, and would result in larger increases in spruce growth compared to a single treatment; and (3) timing (age) of treatments would result in different densities of aspen, with treatments at later ages resulting in lower aspen densities.

2. Materials and Methods

2.1. Study Site

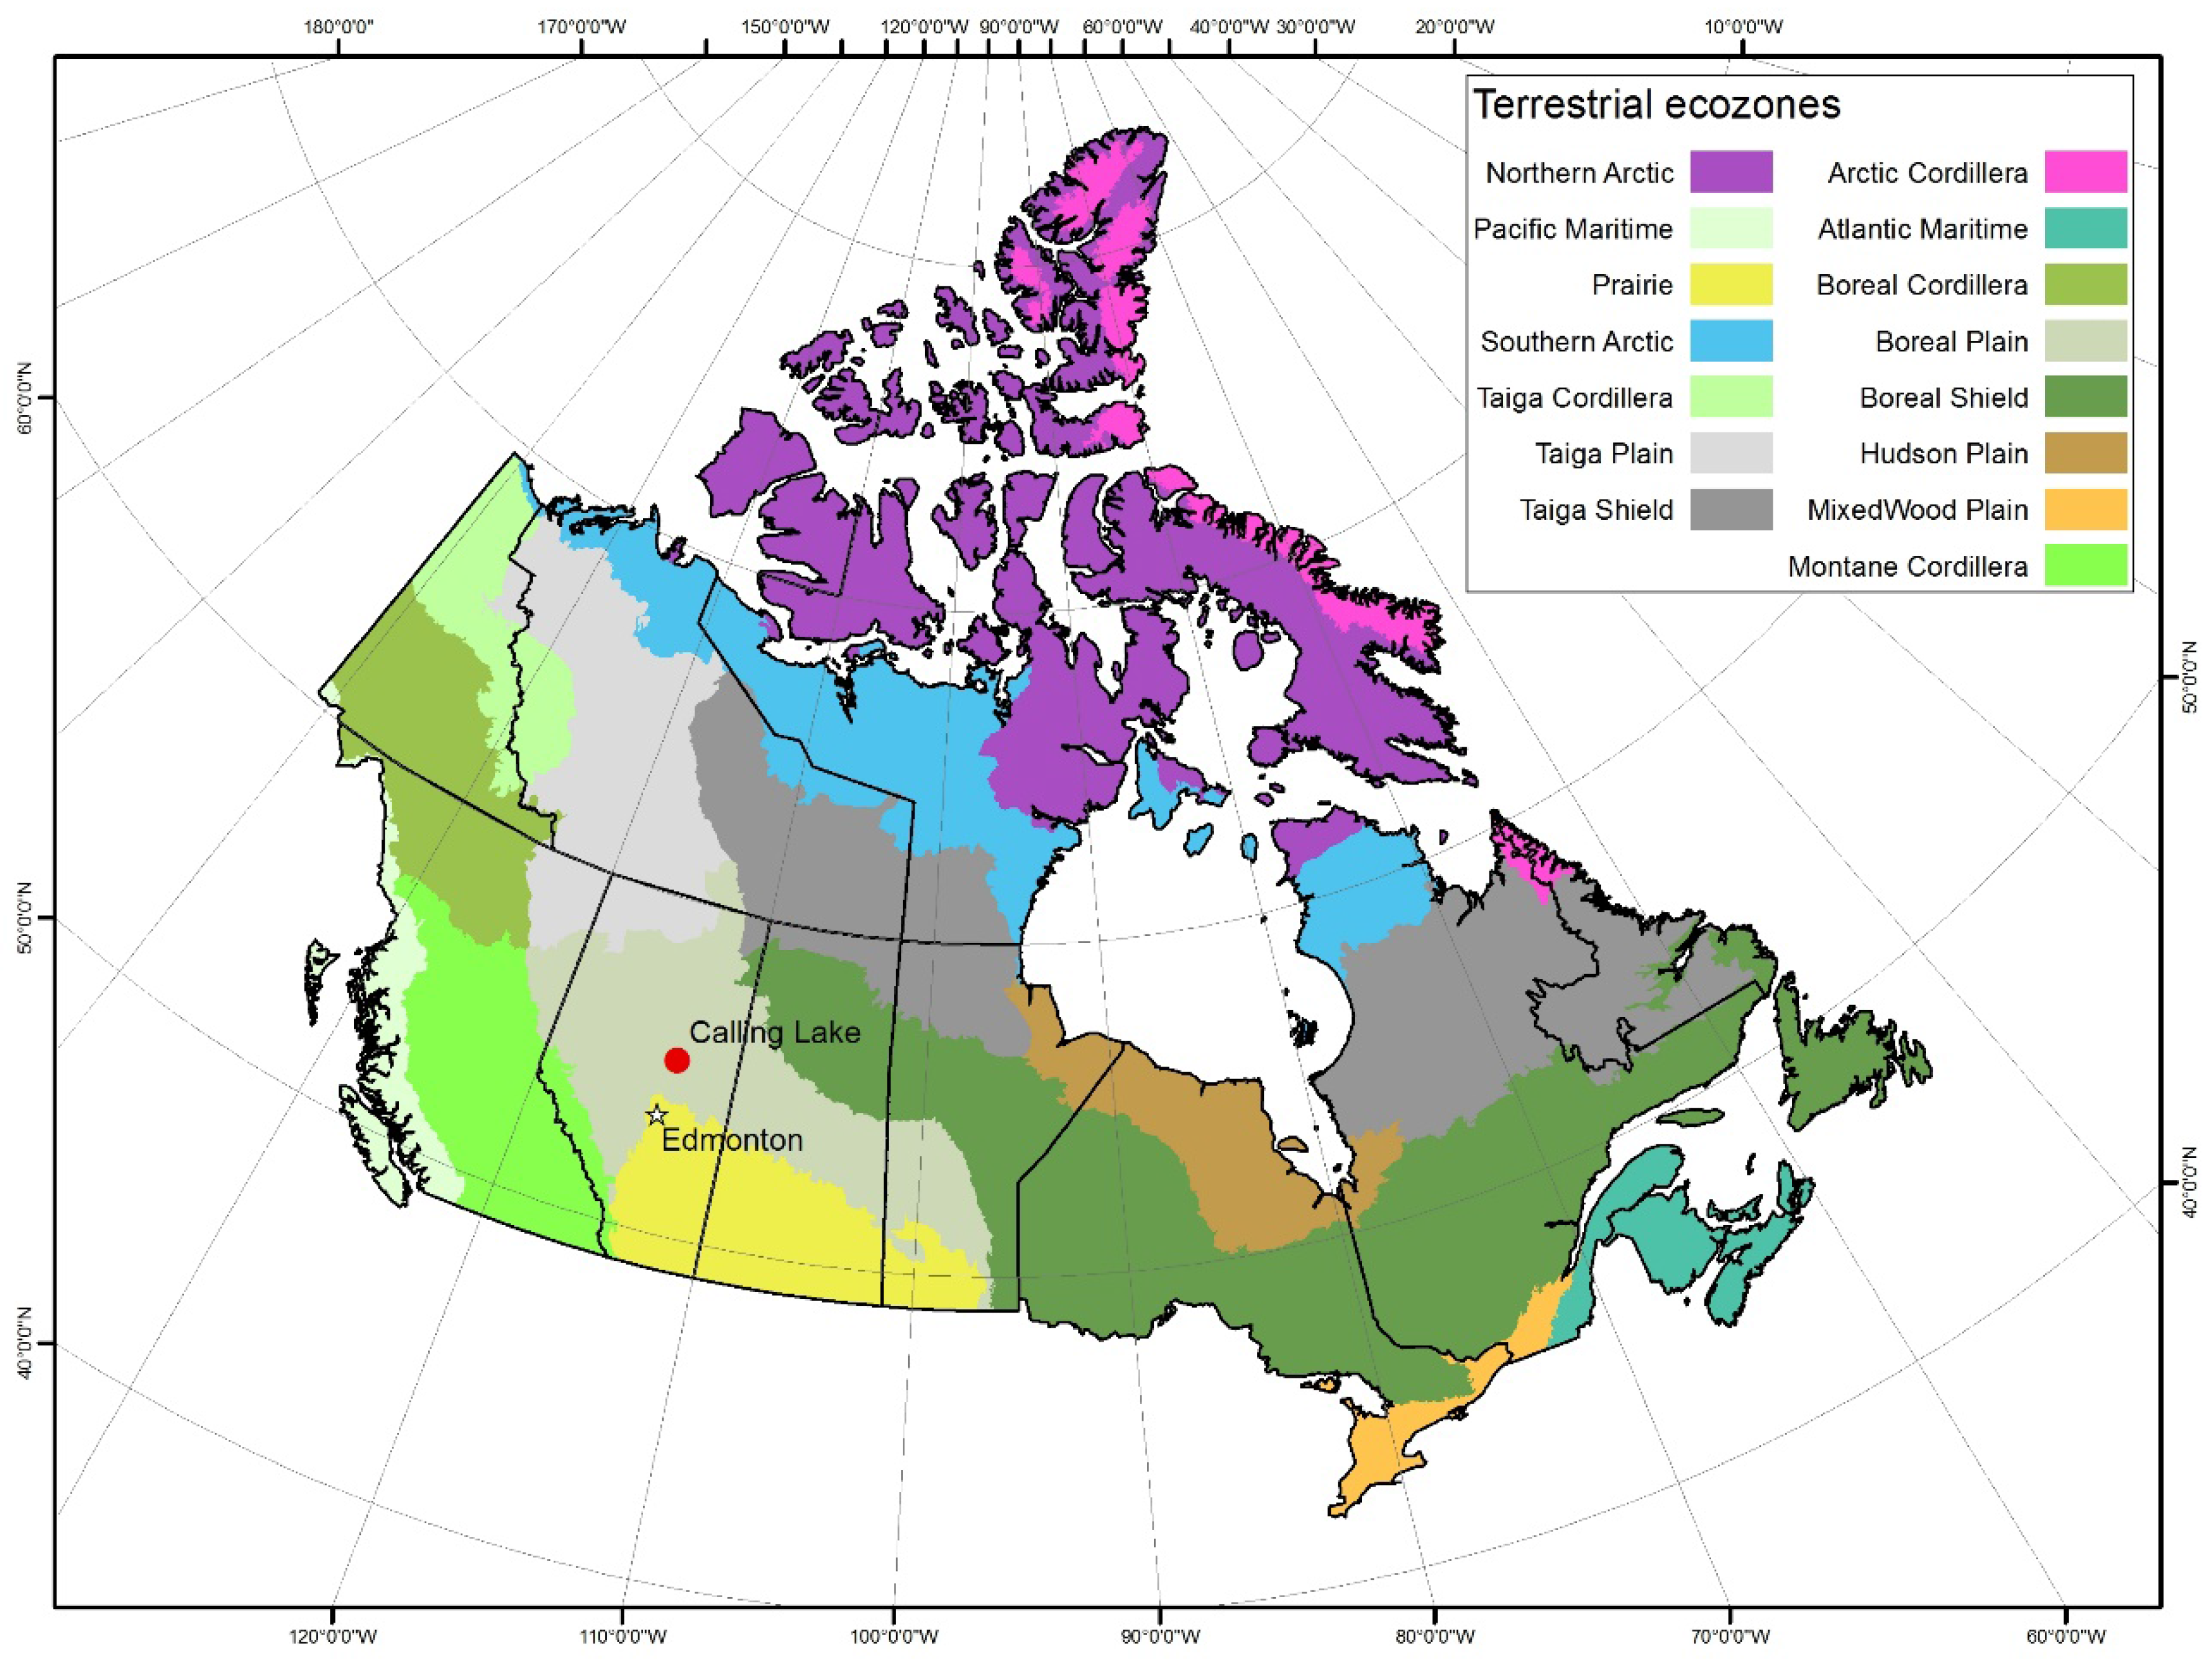
This study used a randomized block design with each of four treatments replicated between three and six times across five sites. Five recently harvested areas located west of Calling Lake, Alberta, (55°27’36” N 113°15’0” W) were selected for the study (Figure 1). The five sites are ecologically similar (with mesic (5) to subhygric (6) soil moisture regimes, medium (C) to rich (D) nutrient regimes) and located in the Central Mixedwood Natural Subregion. The areas were all characterized as belonging to the lowbush cranberry Sw (d3) ecosite phase [17] based on preharvest assessments (Table 1). Soils in all plots are Brunisolic Grey Luvisols.
In order to evaluate the impacts of operational aerial herbicide treatments, a minimum treatment plot size of 2.0 hectares (100 m × 200 m) was required. As a consequence, achieving the desired levels of replication (minimum of three replicates of each treatment) within a single block was not feasible. Sites selected for this study were harvested between February 2003 and March 2004. The layout and assignment of treatment plots was completed in May 2004, and white spruce (1600 stems per hectare (SPH)) was planted in July of the same year. A single stock type and local seedlot (1 + 0 PSB 412 summer planted stock) was used in all blocks.

2.2. Treatments

We evaluated four treatments: (a) untreated (control); (b) aerial application of glyphosate in 2004; (c) aerial application of glyphosate in 2006; and (d) aerial application of glyphosate in 2005 and 2007 (two applications). Due to flooding of some plots after establishment of the study and some plots receiving patchy treatments, we had three replications for treatments b and d, four replications for treatment c, and five replications for treatment a.
All treatments involved the application of Vision® (glyphosate) herbicide at a rate of 6.0 L/ha of product, diluted in 44.0 L of water for a total spray volume of 50.0 L/ha, which is equivalent to 2.1 kg active ingredient per ha. The herbicide treatment was completed by Western Aerial Applicators using a Lama helicopter with spray booms fitted with Accuflow nozzles.

2.3. Measurements

We established one 30 m × 30 m monitoring plot near the center of each treatment plot in May of 2004. Each 30 m × 30 m plot was divided into four 15 m × 15 m quadrants. Thirty-six grid points were established within each plot with 5.0 m between grid points.
Vegetation assessments (ocular estimates of % cover and modal height estimates for each vascular plant species) were completed in the northeastern 15 m × 15 m quadrant of each monitoring plot in midsummer of 2014. Species, % cover, distribution, and modal height were recorded for all species found within the quadrant, including trees (A), tall shrubs (B1), low shrubs (B2), forbs (C), and graminoids (grasses, sedges, and rushes) (G). All plants except Salix and Carex species were identified to species. Species richness (number of species present in each plot), Shannon’s H’, and Simpsons index were calculated from these quadrants as described by McCune and Grace [18].
To provide data on density and height of all tree species, four 3.99 m radius subplots plots were established in each plot, with plot centers located at the center of each of the four quadrants of the main plot. Modal height and number of stems were recorded for germinants, seedlings, and saplings of each tree species.
At each of the 36 grid points within each monitoring plot (5 m spacing), the closest planted white spruce seedling was selected and marked in 2004 for measurement. Height, ground level diameter (GLD), and vigor were measured and recorded for each marked tree in midsummer 2014.

2.4. Data Analysis

Data were analyzed assuming a randomized block design using univariate Analysis of Variance in SAS V9.3 (SAS Institute, Cary, NC, USA). We used α = 0.10 to indicate statistical significance. Tree and vegetation responses were analyzed using block and plot as random factors and treatment as a fixed factor. Normality of data was evaluated graphically prior to analysis, with results indicating that data transformations were not required. Where analysis of variance indicated significant treatment effects (p < 0.10), Tukey’s multiple comparisons for differences (HSD; honestly significant difference test) were used to group treatments. In addition, MRPP (multi-response permutation procedures) was used to test for differences in species composition between treatments, and indicator species analysis (ISA) was used to determine the indicator value of each species. These multivariate analyses (MRPP and ISA) were completed using PC-Ord 6 [19] using Sorensen distance and following Peck [20]. Natural weight was used for MRPP. For ISA, indicator values were calculated following Equation (1) in Dufrene and Legendre [21].

2.5. Mixedwood Growth Model Simulations of Potential Yield

To estimate the longer-term outcomes of these treatments, we used the Mixedwood Growth Model (MGM) [22] to predict aspen and spruce volumes in the study plots 90 years post-harvest. We used number of trees per hectare, average tree height, and standard deviations of height for each species in each plot to initialize the model. Aspen site index (base age 50) was set to 22 m and spruce site index (base age 50) was set to 20 m based on average site index values for these ecosites [17].

3. Results

3.1. Plant Community Responses

In 2014, 77 vascular plant species were observed in the study plots. While small amounts (<1% cover) of two non-native species (dandelion (Taraxacum officinale L.) and white clover (Trifolium repens L.)) were found in four and two plots, respectively, all other recorded species were native to forests of the region.
Species richness ranged from 27.8 (untreated) to 32.7 (2004 treatment) but was not significantly affected by treatment (Table 2). The 2004 treatment had significantly higher Shannon index values than the untreated and had significantly higher values for Simpson’s index than the 2006 or 2005 + 2007 treatments. The 2006 treatment had a significantly lower value for Simpson’s index than the untreated, but did not differ significantly for the Shannon index. The 2005 + 2007 treatment had significantly lower values for the Shannon and Simpson’s indexes compared to the 2004 treatment, but did not differ significantly from the untreated or the 2006 treatment.
MRPP results (Table 3) indicated significant differences in species composition between the untreated and the 2004 treatment but not between the untreated and other treatments. No differences were evident between the 2004 and 2006 treatments, however, the 2005 + 2007 treatment differed from both the 2004 and 2006 treatments.
Indicator species analysis (Table 4) suggests that the major differences between treatments were in cover of paper birch (BETUPAP; Betula papyrifera), cover and frequency of trembling aspen (POPUTRE; Populus tremuloides), and cover and frequency of woodland horsetail (EQUISYL; Equisetum sylvaticum). Paper birch abundance was higher in the 2004 treatment than in the other treatments. Trembling aspen abundance was highest in the untreated, lower in the 2004 treatment, and substantially lower in the 2006 and 2005 + 2007 treatments. While aspen frequency was 100 percent in the untreated and the 2004 treatment, it was reduced by the 2006 and the 2005 + 2007 treatments. Woodland horsetail abundance and frequency was higher in the 2004 treatment compared to other treatments.

3.2. Vegetation Cover

None of the herbicide treatments had a significant effect on cover of bluejoint reedgrass (p = 0.632) or woodland horsetail (p = 0.239) in 2014 (Table 5). Paper birch cover was significantly (p < 0.01) higher in the 2004 treatment compared to the untreated, 2006, and 2005 + 2007 treatments. Aspen cover was significantly (p < 0.01) reduced by the 2006 and 2005 + 2007 treatments compared to the untreated and the 2004 treatment, and aspen cover in the 2004 treatment was significantly lower than in the untreated. This is consistent with results from the indicator species analysis for aspen.
Treatment effects on percent cover of each growth form (assessed in four 3.99 m radius subplots established in each 30 × 30 m monitoring plot) are summarized in Table 6. Significant treatment effects are evident for deciduous tree cover (A_DEC), and low shrub (B2) cover, but not for the tall shrub (B1), forb (C), or graminoid (G) cover. The 2006 and the 2005 + 2007 treatments caused significant reductions in cover of deciduous trees (A_DEC), with mean deciduous cover of 36% in the untreated compared to 7% in the 2006 and 2% in the 2005 + 2007 treatment. For low shrubs (B2), only the 2005 + 2007 (11%) treatment had significantly lower cover than the untreated (29%). Treatments did not have significant effects on the cover of herbs (C) or graminoids (G; grasses, sedges, and rushes).

3.3. Aspen Height and Density

Aspen height in 2014 was significantly lower in the 2006 and 2005 + 2007 treatments compared to the untreated (Table 7). Modal aspen height was approximately 4.5 m in the untreated, compared to only 1.8 m in the 2005 + 2007 treatment. The 2004 and 2006 treatments resulted in heights that were intermediate between these treatments. At age 11, aspen densities were significantly lower in the 2004 treatment than the untreated, and the 2006 and 2005 + 2007 treatments had significantly lower aspen densities than the untreated and 2004 treatment (Table 7).

3.4. Spruce Growth and Survival

There were no significant effects of treatments on spruce height (Table 8). However, ground level diameter (GLD) was significantly larger for white spruce in the 2005 + 2007 treatment compared to those in the untreated and the 2004 treatments. Spruce HDR (height to diameter ratio) was significantly lower for the 2006 and 2005 + 2007 treatments compared to the untreated and the 2004 treatment. Spruce survival averaged 73% across all treatments and there were no significant differences among treatments.

3.5. Yield Implications

MGM predictions of yield at age 90 (Table 9) showed that there was a significant treatment effect on both spruce and aspen volumes, but not on total (both species) stand volume. Spruce volume was predicted to be lowest in the untreated, intermediate in the 2004 and 2006 treatments, and largest in the 2005 + 2007 treatment. In contrast, aspen volume was predicted to be highest in the untreated and significantly smaller in the 2005 + 2007 treatment than in the untreated and 2004 treatment. Predicted total volume did not differ significantly (p = 0.1491) between treatments.

4. Discussion

Herbicide treatments significantly reduced trembling aspen cover, height, and density, as well as low shrub cover in this boreal ecosystem. Similar reductions in broadleaf tree cover have been reported for other northern forests [9,23,24,25,26]. Other studies [9,11,27] have also reported reductions in shrub cover following glyphosate application. In our study, a single application of glyphosate resulted in a non-significant reduction in low shrub cover, while two glyphosate applications significantly reduced low shrub cover relative to untreated areas.
The effects of herbicide treatments on trembling aspen increased with age of the regenerating stand at the time of treatment. Our study showed that one glyphosate application in the third growing season after harvesting reduced aspen density by 89% and deciduous tree cover by 81% compared to untreated areas, while application in the first year following timber harvesting resulted in a 52% reduction in aspen densities and a 25% reduction in deciduous tree cover relative to untreated areas. Two herbicide treatments reduced aspen density by 99% and deciduous tree cover by 94%. Newton et al. [23] reported similar results indicating substantial reductions in hardwood tree cover following application of glyphosate 2 years after harvesting. Results shown in Fu et al. [16] from two sites in northern Manitoba, Canada, also illustrate similar outcomes. Our study also suggests that two treatments, spaced 2 years apart, should result in the almost complete removal of aspen in treated areas and will likely lead to early development of a pure spruce stand. This finding is consistent with results from other studies where repeated herbicide applications reduced the volume of aspen and other deciduous tree species while increasing spruce volume [28]. Where two or more herbicide treatments are being applied, it may be desirable to plan intentional leave areas that do not receive any treatment (skips and patches) in order to retain some aspen within treated stands. While care should be exercised in the extent of conversion of regenerating mixed forests to pure young spruce stands due to the potential benefits of deciduous species on nutrient availability [29] and diversity of habitats, it is also important to prevent the complete loss of pure spruce types. While planting spruce and applying herbicides offers one successful and effective approach for achieving this outcome, alternatives that more closely emulate natural succession, such as leaving significant green tree retention following timber harvesting or carrying out group shelterwood or selection harvesting, including understory protection [30], should be considered as potential forest management alternatives for many mixedwood forest sites.
Species richness and the Shannon index did not differ between treated and untreated areas, indicating the small potential for impacts to plant community diversity resulting from operationally applied herbicide treatments, which is consistent with findings of several other studies [12,27,31]. Haeussler et al. [13] report the potential for increases in species richness and other diversity indexes following herbicide treatment, which was also evident in our study when the single treatment applied in 2004 was compared to untreated areas. Our study further indicates that later herbicide treatments or two herbicide applications does not result in significant changes in diversity compared to untreated areas. Increases in the Shannon index resulting from the single early (2004) treatment over values observed for the untreated and the 2005 + 2007 treatment are consistent with the intermediate disturbance hypothesis [4,32], while richness showed a neutral effect. Simpsons’ index had an intermediate response with no difference between the untreated and the single early treatments, and a decrease in Simpsons’ index observed with repeated or later treatment.
Overall, survival of the planted white spruce was reasonably high across the study. The slow diameter response to removal of competition is typical for white spruce in a boreal environment. However, the benefits of two herbicide treatments were evident, as diameter in this treatment was nearly double that of the untreated areas 11 years after planting. Other studies have reported consistent findings; for instance, Comeau [33] reported that spruce diameter increment following triclopyr herbicide treatment was 1.8 times that of control plots, while triclopyr treatment increased stem volume index by 1.7 times. Bell et al. [28] reported similar increases in spruce volume ten years after aerial triclopyr treatment. On similar sites to those examined in this study, Pitt et al. [25] observed 43% gains in diameter 5 years after herbicide treatment.
The lack of a height growth response for white spruce is consistent with other studies that indicate reductions in height growth of this moderately shade tolerant species are only likely when levels of overtopping competition are very high [34]. Pitt et al. [25] also observed no significant increase in average spruce height when treated and untreated sites were compared 5 years after herbicide treatment. While early herbicide treatments can often lead to stronger growth responses of coniferous tree species due to an increase in the period of competition-free growth [15], the effects of treatment timing on deciduous densities and on herbaceous competition may confound this outcome.
Reductions in aspen density following herbicide application are likely to have long-term impacts on spruce growth. At age 11, aspen were about 150% of the height of spruce in the 2004 treatment, slightly taller than spruce in the 2006 treatment, and shorter than spruce in the 2005 + 2007 treatment. In untreated areas, aspen were over 2.5 times the height of white spruce seedlings. The shorter aspen heights in areas treated with herbicide, in conjunction with lower aspen densities in the 2006 and the 2005 + 2007 treatments, are expected to lead to greater differences in spruce growth over the ensuing decades. This expectation was confirmed by the results of the Mixedwood Growth Model, which predicted spruce volume in the 2005 + 2007 treatment to be over twice that of the untreated areas (326.5 m3/ha vs. 159.4 m3/ha) at age 90 (Table 9).
The projected effects of glyphosate treatments on aspen yields are consistent with results from the Fallingsnow experiment [32], with repeated treatments increasing spruce and decreasing aspen volumes beyond those achieved by a single aerial herbicide treatment. Based on the results of our study, as well as the work of others, it is evident that, if the forest management objectives are to replace harvested conifer volumes and restore a conifer-dominated stand by age 90 while maintaining a component of trembling aspen in the mature stand, treatment in the third year may be ideal, while two herbicide applications (e.g., in the second and fourth years) creates conditions where spruce can grow at levels that are close to full potential.

5. Conclusions

Application of glyphosate herbicide did not reduce vegetation species richness or diversity 11 years after planting this boreal site. However, herbicide treatments did result in some changes to vegetation community composition. Applying glyphosate in the third year after harvesting or in the second and fourth growing seasons resulted in substantial reductions to trembling aspen cover and height. Applying glyphosate in the year after harvesting had less impact on aspen than later treatments, although this treatment did generally result in higher species richness and diversity.
Our results show that glyphosate application can accelerate growth of a regenerating spruce stand, with two treatments resulting in the best spruce growth. Simulations with the Mixedwood Growth Model indicate that all herbicide treatments will reduce aspen volume in year 90, with the delayed and double treatments having the largest impacts. These treatments also resulted in the greatest increases to estimated spruce volume at year 90. Further studies examining the effects of other treatment timings and ongoing monitoring of this, and other similar studies, are needed to document the long-term impacts of herbicide treatments on plant community diversity and conifer seedling growth and survival.

Acknowledgments

We gratefully acknowledge assistance provided by Ron Sparrow with site selection and Richard Chemago with site selection, supervision of herbicide application, and project management. Susan Humphries and Rachel Keglowitsch assisted with field work. Financial support for the establishment of this study was provided by the Silviculture Subcommittee of the Alberta Forest Products Association. Alberta Agriculture and Forestry provided funding for the 2014 measurements. We also appreciate input from two anonymous reviewers on the draft of this paper.

Author Contributions

P.G.C. conceived the study, analyzed the data, and wrote the paper with contributions from E.C.F.

Conflicts of Interest

The authors declare no conflict of interest.

Appendix A

Table A1. Full Species Names for All Species Recorded in 2014 (Nomenclature Follows [35]).
Species CodeSpecies Name
ABIEBALAbies balsamea (L.) Mill.
ACHIMILAchillea millefolium L.
ACHISIBAchillea sibirica Ledeb.
ACTARUBActaea rubra (Ait.) Willd.
AGROTRAAgropyron trachycaulum (Link) Malte
ALNUCRIAlnus crispa (Ait.) Pursh
AMELALNAmelanchier alnifolia Nutt.
ANEMRIPAnemone riparia Fern.
ARALNUDAralia nudicaulis L.
ASTECILAster ciliolatus Lindl.
ASTECONAster conspicuous Lindl.
BETUPAPBetula papyrifera Marsh.
BROMCILBromus ciliatus L.
CALACANCalamagrostis canadensis (Michx.) Beauv.
CAREXCarex L. species
CIRSARVCirsium arvense (L.) Scop.
CORNCANCornus canadensis L.
CORNSTOCornus stolonifera Michx.
DESCCESDeschampsia cespitosa (L.) Beauv
DISPTRADisporum trachycarpum (S. Wats.) B. & H.
ELYMGLAElymus glaucus Buckl.
ELYMINNElymus innovatus Beal
EPILANGEpilobium angustifolium L.
EQUIARVEquisetum arvense L.
EQUISYLEquisetum sylvaticum L.
FRAGVIRFragaria virginiana Duchesne
GALETETGaleopsis tetrahit L.
GALIBORGalium boreale L.
GALITRIGalium triflorum Michx.
GERABICGeranium bicknellii Britt.
HERALANHeracleum lanatum Michx.
HIERUMBHieracium umbellatum L.
LARILARLarix laricina (Du Roi) K.Koch
LATHOCHLathyrus ochroleucus Hook.
LEDUGROLedum groenlandicum
LINNBORLinnaea borealis L.
LONIDIOLonicera dioica L.
LONIINVLonicera involucrata (Richards.) Banks
LYCOOBSLycopodium obscurum L.
MAIACANMaianthemum canadense Desf.
MERTPANMertensia paniculata (Ait.) G. Don
MITENUDMitella nuda L.
PETAPALPetasites palmatus (Ait.) A. Gray
PICEGLAPicea glauca (Moench) Voss
PINUCONPinus contorta Loudon
POAPALPoa palustris L.
POPUBALPopulus balsamifera L.
POPUTREPopulus tremuloides Michx.
POTEANSPotentilla anserina L.
POTENORPotentilla norvegica L.
PYROASAPyrola asarifolia Michx.
RANUMACRanunculus macounii Britt.
RIBEGLARibes glandulosum Grauer
RIBEHUDRibes hudsonianum Richards.
RIBELACRibes lacustre (Pers.) Poir.
RIBEOXYRibes oxycanthoides L.
RIBETRIRibes triste Pall.
ROSAACIRosa acicularis Lindl.
RUBUIDARubus idaeus L.
RUBUPUBRubus pubescens Raf.
SALIXSalix L. species
TARAOFFTaraxacum officinale Weber
TRIEBORTrientalis borealis Raf.
TRIFHYBTrifolium hybridum L.
URTIDIOUrtica dioica L.
VACCCAEVaccinium caespitosum Michx.
VACCMYRVaccinium myrtilloides Michx.
VACCVITVaccinium vitis-idaea L.
VIBUEDUViburnum edule (Michx.) Raf.
VICIAMEVicia americana Muhl.
VIOLRENViola renifolia A. Gray

References

  1. Wiensczyk, A.; Swift, K.; Morneault, A.; Thiffault, N.; Szuba, K.; Bell, F.W. An overview of the efficacy of vegetation management alternatives for conifer regeneration in boreal forests. For. Chron. 2011, 87, 175–200. [Google Scholar] [CrossRef]
  2. Homagain, K.; Shahi, C.; Luckai, N.; Leitch, M.; Bell, F.W. Benefit-cost analysis of vegetation management alternatives: An Ontario case study. For. Chron. 2011, 82, 260–273. [Google Scholar] [CrossRef]
  3. Bell, F.W.; Thiffault, N.; Szuba, K.; Luckai, N.; Stinson, A. Synthesis of silviculture options, costs and consequences of alternative vegetation management practices relevant to boreal and temperate conifer forests: Introduction. For. Chron. 2011, 87, 155–160. [Google Scholar] [CrossRef]
  4. Swift, K.; Bell, F.W. What are the environmental consequences of using silviculturally effective forest vegetation management treatments? For. Chron. 2011, 87, 201–216. [Google Scholar] [CrossRef]
  5. CFS. National Forestry Database for Canada. Available online: http://nfdp.ccfm.org/index_e.php (accessed on 18 December 2017).
  6. Weed Science Society of America. Herbicide Handbook, 5th ed.; Weed Science Society of America: Champaign, IL, USA, 1983; pp. 258–263. [Google Scholar]
  7. Thompson, D.G.; Pitt, D.G. Frequently asked questions (FAQs) on the use of herbicides in Canadian Forestry; Technical Note No. 112; Canadian Forest Service: Sault Ste, Marie, ON, Canada, 2011; Available online: http://cfs.nrcan.gc.ca/pubwarehouse/pdfs/32344.pdf (accessed 20 July 2015).
  8. Freedman, B.; Morash, R.; MacKinnon, D. Short-term changes in vegetation after the silvicultural sparying of glyphosate herbicide onto regenerating clearcuts in Nova Scotia. Can. J. For. Res. 1993, 23, 2300–2311. [Google Scholar] [CrossRef]
  9. Boateng, J.O.; Haeussler, S.; Bedford, L. Boreal plant community diversity 10 years after glyphosate treatment. West. J. Appl. For. 2000, 15, 15–26. [Google Scholar] [CrossRef]
  10. Lindgren, P.M.F.; Sullivan, T. Influence of alternative vegetation management treatments on conifer plantation attributes: Abundance, species diversity, and structural stability. For. Ecol. Manag. 2001, 142, 163–182. [Google Scholar] [CrossRef]
  11. Bell, F.W.; Newmaster, S.G. The effects of silvicultural disturbance on the diversity of seed-producing plants in the boreal mixedwood forest. Can. J. For. Res. 2002, 32, 1180–1192. [Google Scholar] [CrossRef]
  12. Sullivan, T.P.; Sullivan, D.S. Vegetation management and ecosystem disturbance: Impact of glyphosate herbicide on plant and animal diversity in terrestrial systems. Environ. Rev. 2003, 11, 37–59. [Google Scholar] [CrossRef]
  13. Haeussler, S.; Bartemucci, P.; Bedford, L. Succession and resilience in boreal mixedwood plant communities 15–16 years after silvicultural site preparation. For. Ecol. Manag. 2004, 199, 349–370. [Google Scholar] [CrossRef]
  14. Wood, J.E.; von Althen, F.W. Establishment of white spruce and black spruce in Boreal Ontario: Effects of chemical site preparation and post-planting weed control. For. Chron. 1993, 69, 554–560. [Google Scholar] [CrossRef]
  15. Wagner, R.G.; Mohammed, G.H.; Noland, T.L. Critical periods of interspecific competition for northern conifers associated with herbaceous vegetation. Can. J. For. Res. 1999, 29, 890–897. [Google Scholar] [CrossRef]
  16. Fu, S.; Chen, H.Y.H.; Bell, F.W.; Sharma, M.; Delaney, J.; Peterson, G. Effects of timing of glyphosate application on jack pine, black spruce and white spruce plantations in Northern Manitoba. For. Chron. 2008, 84, 37–45. [Google Scholar] [CrossRef]
  17. Beckingham, J.D.; Archibald, J.H. Field Guide to Ecosites of Northern Alberta; Special Report 5; Canadian Forestry Service, Northern Forestry Centre: Edmonton, AB, Canada, 1996. [Google Scholar]
  18. McCune, B.; Grace, J.B. Analysis of Ecological Communities; MjM Software Design: Gleneden Beach, OR, USA, 2002; 300p. [Google Scholar]
  19. McCune, B.; Mefford, M.J. PC-Ord Multivariate Analysis of Ecological Data; Version 6.08; MjM Software: Gleneden Beach, OR, USA, 2011. [Google Scholar]
  20. Peck, J.E. Multivariate Analysis for Community Ecologists: Step-by Step Using PC-ORD; MjM Software Design: Gleneden Beach, OR, USA, 2010; 162p. [Google Scholar]
  21. Dufrene, M.; Legendre, P. Species assemblages and indicator species: The need for a flexible asymmetric approach. Ecol. Mon. 1997, 67, 356–366. [Google Scholar] [CrossRef]
  22. Bokalo, M.; Stadt, K.J.; Comeau, P.G.; Titus, S.J. The validation of the mixedwood growth model (MGM) for use in forest decision making. Forests 2013, 4, 1–27. [Google Scholar] [CrossRef]
  23. Newton, M.; Cole, E.C.; Lauteschlager, R.A.; White, D.E.; McCormack, M.L., Jr. Browse availability after conifer release in Maine’s spruce-fir forests. J. Wildl. Manag. 1989, 53, 643–649. [Google Scholar] [CrossRef]
  24. Gagné, N.; Bélanger, L.; Huot, J. Comparative responses of small mammals, vegetation, and food sources to natural regeneration and conifer release treatments in boreal balsam fir stands of Quebec. Can. J. For. Res. 1999, 29, 1128–1140. [Google Scholar] [CrossRef]
  25. Pitt, D.G.; Mihajlovich, M.; Proudfoot, L. Juvenile stand responses and potential outcomes of conifer release efforts on Alberta’s spruce-aspen mixedwood sites. For. Chron. 2004, 80, 583–597. [Google Scholar] [CrossRef]
  26. Simard, S.W.; Hagerman, S.M.; Sachs, D.L.; Heineman, J.L.; Mather, W.J. Conifer growth, Armillaria ostoyae root disease, and plant diversity responses to broadleaf competition reduction in mixed forests of southern interior British Columbia. Can. J. For. Res. 2005, 35, 843–859. [Google Scholar] [CrossRef]
  27. Sullivan, T.P.; Wagner, R.G.; Pitt, D.G.; Lautenschlager, R.A.; Chen, D.G. Changes in diversity of plant and small mammal communities after herbicide application in sub-boreal spruce forest. Can. J. For. Res. 1998, 28, 168–177. [Google Scholar] [CrossRef]
  28. Bell, F.W.; Dacosta, J.; Penner, M.; Morneault, A.; Stinson, A.; Towill, B.; Luckai, N.; Winters, J. Longer-term volume trade-offs in spruce and jack pine plantations following various conifer release treatments. For. Chron. 2011, 87, 235–250. [Google Scholar] [CrossRef]
  29. Légaré, S.; Bergeron, Y.; Leduc, A.; Paré, D. Comparison of the understory vegetation in boreal forest types of southwest Quebec. Can. J. Bot. 2001, 19, 1019–1027. [Google Scholar] [CrossRef]
  30. Grover, B.E.; Bokalo, M.; Greenway, K.J. White spruce understory protection: From planning to growth and yield. For Chron. 2014, 90, 35–43. [Google Scholar] [CrossRef]
  31. Hawkins, C.D.B.; Dhar, A.; Lange, J. Vegetation management with glyphosate has little impact on understory species diversity or tree growth in a sub boreal spruce plantation—A cases study. Plant Biosyst. 2013, 147, 105–114. [Google Scholar] [CrossRef]
  32. Bell, F.W.; Hunt, S.; Dacosta, J.; Sharma, M.; Larocque, G.R.; Winters, J.A.; Newmaster, S.G. Effects of silviculture intensity on plant diversity response patterns in young managed northern temperate and boreal forests. Ecoscience 2014, 21, 1–13. [Google Scholar] [CrossRef]
  33. Comeau, P. Effects of aerial strip spraying on mixedwood stand structure and tree growth. For. Chron. 2014, 90, 479–485. [Google Scholar] [CrossRef]
  34. Lieffers, V.J.; Stadt, K.J. Growth of understory Picea glauca, Calamagrostis canadensis, and Epilobium angustifolium in relation to overstory light transmission. Can. J. For. Res. 1994, 24, 1193–1198. [Google Scholar] [CrossRef]
  35. Moss, E.H. Flora of Alberta: A Manual of Flowering Plants, Conifers, Ferns and Fern Allies Found Growing without Cultivation in the Province of Alberta, Canada, 2nd ed.; University of Toronto Press: Toronto, ON, Canada, 1983. [Google Scholar]
Figure 1. Study site location in Canada.
Forests 09 00107 g001
Table 1. Description of the five blocks used for the study, based on preharvest assessment information for the blocks.
BlockElevation (m)Ecosite Phase 1Soil Moisture RegimeSoil Nutrient RegimeSoil DrainageHumus Form
175652lowbush cranberry SwSubhygricMediumImperfectlyModer
178650lowbush cranberry SwSubhygricRichImperfectlyModer
185667lowbush cranberry SwMesicMediumImperfectlyModer
187a638lowbush cranberry SwMesicMediumModerately WellModer
187b634lowbush cranberry SwMesicMediumImperfectlyModer
1 Ecosite classification and characterization follows Beckingham and Archibald [17].
Table 2. Effects of treatments on plant community diversity index values at age 11. Standard deviation is shown in brackets () beside each mean. Where Analysis of Variance indicates significant treatment effects (p < 0.10) (indicated in bold), letters are used to indicate differences between treatments determined using Tukey’s HSD test.
IndexOverall MeanpTreatment
Untreated200420062005 + 2007
Richness (S)30.80.176627.8 (3.8)32.7 (5.5)32.5 (3.1)31.3 (6.9)
Shannon (H’)2.610.03052.57 (0.18) b2.87 (0.04) a2.55 (0.22) b2.54 (0.19) b
Simpsons (D)0.860.00850.88 (0.04) ab0.91 (0.01) a0.82 (0.07) c0.83 (0.03) bc
Table 3. Results from multi-response permutation procedures (MRPP) analysis of plant community data collected in 2014 (* = significant at α = 0.05; ** = significant at α = 0.01).
Observed δExpected δVariance of δSkewness of δTpA
Overall0.47240.51170.0003447−0.5062−2.11980.028 *0.0769
Pairwise Comparisons
untreated (a) vs. 2004 (b) −1.99380.040 *0.1010
untreated (a) vs. 2006 (c) −0.75260.2040.0411
untreated (a) vs. 2005 + 2007 (d) −0.87560.1760.0320
2004 (b) vs. 2006 (c) 1.32670.935−0.0583
2004 (b) vs. 2005 + 2007 (d) −3.30400.005 **0.1156
2006 (c) vs. 2005 + 2007 (d) −2.22800.025 *0.0766
Table 4. Summary of results from indicator species analysis including only species with p < 0.2 for Monte Carlo test results. Full species names are provided in Appendix A. Species with significant (p < 0.1) indicator values are shown in bold.
Relative Abundance in GroupRelative Frequency in GroupIndicator Values for GroupMONTE CARLO Test Results
Treatment:un200420062005 + 2007un200420062005 + 2007un200420062005 + 2007Indicator Value (IV)IV from Randomized Groups
Number of Plots:534453445344MeanS. Dev.p
Species
ABIEBAL77401920670501490949.431.514.910.1494
BETUPAP14699810010010010014699869.446.68.040.0038
POPUTRE673021100100755067301167.138.18.850.0012
SALIX5502717401001002525027450.135.211.20.123
CORNSTO010000033000330033.324.84.520.176
RIBEGLA010000033000330033.3254.580.1886
ANEMRIP00010000050000505022.813.830.124
ASTECIL104533128010075100845251244.637.37.690.1902
EQUISYL18531711801007550155313653.237.89.840.046
HIERUMB00010000050000505022.813.830.124
LYCOOBS010000033000330033.3254.550.1832
MAIACAN294314148010075752443101042.938.38.970.1742
MERTPAN20442511601007575124419843.9368.90.1938
POAPAL00100000500005005022.713.830.1212
Relative Abundance in Group = average abundance of the species in a given group of plots divided by the average abundance of that species across all plots expressed as a %; Relative Frequency in Group = % of plots in each group where the species is present; Indicator Values for Group = combined values for relative abundance and relative frequency; MONTE CARLO Test Results = significance of observed maximum indicator value for response (4999 permutations).
Table 5. Effects of treatments on cover of selected species. Standard deviation is shown in brackets () beside each mean. Where Analysis of Variance indicates significant treatment effects (p < 0.10), p values are shown in bold and bold letters are used to indicate differences between treatments determined using Tukey’s HSD test (p < 0.10).
SpeciesOverall MeanpTreatment
Untreated200420062005 + 2007
Picea glauca7.20.7784.8 (2.3)6.7 (2.9)6.8 (6.9)11.2 (7.5)
Betula papyrifera5.7<0.013.6 (4.0) b18.3 (10.4) a2.5 (3.0) b2.0 (2.0) b
Populus balsamifera2.70.5516.0 (13.4)0.00.5 (0.6)3.0 (4.7)
Populus tremuloides11.0<0.0127.0 (5.7) a12.0 (9.8) b0.8 (0.5) c0.5 (0.6) c
Salix spp.1.60.1290.4 0.5)3.7 (2.3)2.0 (2.0)1.3 (2.5)
Cornus canadensis3.50.8134.4 (3.7)4.3 (3.1)3.3 (4.5)2.0 (2.0)
Calamagrostis canadensis27.80.63227.0 (7.6)21.7 (5.8)30.0 (16.8)31.2 (8.5)
Equisetum sylvaticum1.00.2390.8 (0.4)2.3 (2.3)0.8 (0.5)0.5 (0.6)
Table 6. Effects of treatments on the cover of each of the major growth forms for each year of measurement. Standard deviation is shown in brackets () beside each mean. Where Analysis of Variance indicates significant treatment effects (p < 0.10), p values are shown in bold and bold letters are used to indicate differences between treatments determined using Tukey’s HSD test (p < 0.10). Growth forms: A_Dec = deciduous tree layer; B1 = tall shrubs; B2 = low shrubs; C = Herbs and Forbs; G = grasses, sedges, and rushes.
Growth FormOverall MeanpTreatment
Untreated200420062005 + 2007
A_DEC200.001736 (12) a27 (8) a7 (8) b2 (1) b
B130.86124 (4)3 (3)2 (2)2 (3)
B2220.007129 (14) a22 (12) a20 (11) ab11 (6) b
C320.469029 (15)40 (24)35 (24)25 (13)
G290.776328 (7)27 (11)33 (14)30 (6)
Table 7. Effects of treatments on aspen modal height and density in 2014. Standard deviation is shown in brackets () beside each mean. Where Analysis of Variance indicates significant treatment effects (p < 0.10), p values are shown in bold and bold letters are used to indicate differences between treatments determined using Tukey’s HSD test (p < 0.10).
MeasurementOverall MeanpTreatment
Untreated200420062005 + 2007
Modal Height (cm)327.80.0078446.3 (128.0) a328.8 (129.3) ab210.0 (128.6) b181.0 (126.1) b
Density (stems/ha)5098<0.000111725 (3397) a5667 (3374) b1338 (1871) c150 (397) c
Table 8. Effects of treatments on spruce mean diameter (GLD), height, height:diameter ratio (HDR), and survival. Standard deviation is shown in brackets () beside each mean. Where Analysis of Variance indicates significant treatment effects (p < 0.10), p values are shown in bold and bold letters are used to indicate differences between treatments determined using Tukey’s HSD test (p < 0.10).
Overall MeanpTreatment
Untreated200420062005 + 2007
Spruce GLD (mm)37.030.053127.57 (12.34) b32.73 (13.87) b37.45 (16.55) ab 51.50 (15.85) a
Spruce Height (cm)193.10.7400173.8 (68.7)195.5 (66.4)182.9 (75.3)223.2 (69.4)
Spruce HDR56.20.000465.5 (12.2) a63.1 (14.2) a50.8 (10.8) b44.1 (7.6) b
Spruce Survival0.73090.24800.706 (0.097)0.833 (0.073)0.674 (0.092)0.743 (0.133)
Table 9. Merchantable volume of aspen and spruce (30 cm stump, 13 cm minimum DBH (Diameter at 1.3 m height), and 10 cm minimum top diameter) at age 90 for each treatment based on Mixedwood Growth Model (MGM) simulations run for each plot. Where Analysis of Variance indicates significant treatment effects (p < 0.05), bold letters are used to indicate differences between treatments determined using Tukey’s LSD test.
TreatmentSpruce Volume (m3/ha)Aspen Volume (m3/ha)Total Volume (m3/ha)
untreated159.4 c298.5 a457.8
2004234.2 b223.0 b458.2
2006273.3 b101.8 bc375.1
2005 + 2007326.5 a3.4 c329.9
p0.0010.02040.1491

