Article

Relationships between Tree Age and Climate Sensitivity of Radial Growth in Different Drought Conditions of Qilian Mountains, Northwestern China

1
School of Geography and Tourism, Shaanxi Normal University, 620 Western Changan Street, Changan District, Shaanxi, Xi’an 710119, China
2
Beijing Key Laboratory of Traditional Chinese Medicine Protection and Utilization, Faculty of Geography Science, Beijing Normal University, 19 Xinjiekouwai Street, Haidian District, Beijing 100875, China
3
College of Geography and Environment Science, Northwest Normal University, Lanzhou 730070, China
*
Author to whom correspondence should be addressed.
Forests 2018, 9(3), 135; https://doi.org/10.3390/f9030135
Submission received: 16 January 2018 / Revised: 4 March 2018 / Accepted: 6 March 2018 / Published: 12 March 2018

Abstract

:
The response of radial growth to climate and the climate sensitivity of tree growth at different ages in different drought conditions are essential for predicting forest dynamics and making correct forest management policies. In this study, we analyzed the growth responsiveness of Picea crassifolia Kom. to climate and explored the relationship between age and climate sensitivity of radial growth at the individual tree scale in the wetter eastern area and drier western area of the Qilian Mountains. Pearson correlation coefficients were calculated between the chronology of each tree and climatic factors to examine the climate-growth relationships. Linear fitting, quadratic polynomial fitting and exponential fitting were used to test the relationships between age and mean sensitivity, standard deviation and radial growth’s response to climate. Trees in the wetter eastern area showed a weaker response to climate than those in the drier western area and were significantly correlated with precipitation and mean temperature in the previous and current mid-late summer. Trees in the drier western area were mainly limited by precipitation of the previous August, the current May and June, as well as limited by temperature in the previous and current early-middle summer. In the wetter area, the younger trees were more sensitive to both precipitation and temperature than the older trees. In the drier area, younger/older trees showed a stronger sensitivity to precipitation in the current August and September/May, whereas trees 120–140 years old showed a stronger correlation with temperature factors in the summer. It was determined that mature trees in the drier area were more strongly influenced by the climate, especially in the context of increasing temperature. These trees should be paid special attention in forest management.

1. Introduction

The prediction of forest dynamics and policy-making about forest management and protection are often based on the analysis of radial growth-climate relationships [1,2]. The responses of radial growth to climate varied with the regional variability in moisture conditions [3]. A previous research carried out in western Oregon showed that the radial growth of Pseudotsuga taxifolia var. menziesii (Mirb.) Franco significantly correlated with summer temperatures in the warm and arid region and with winter temperatures in the cool region [4]. Precipitation exerted an increasingly positive influence on tree growth in the Qilian Mountains, northwest China, along the east-west drought gradient there [5]. In terms of Abies balsamea (L.) Mill. at its southern limit in New York, USA, trees positioned in the groundwater-fed fens were insensitive to the warming, whereas trees on the remnant upland showed an increasingly negative sensitivity to temperature rise in the summer [6]. Studies in Central Europe found that radial growth at the more humid sites was mainly influenced by low autumn precipitation in the previous year and low summer precipitation in the current year, but that at the more arid sites, it was limited by summer drought [7].
Climate sensitivity of tree growth at different ages also impacts forest composition and dynamics obviously [8]. Regional variability in hydro-thermal conditions affects the relationships between the growth response to climate and tree age to some extent [9,10,11]. By reviewing related literature, the phenomenon that almost all of the younger trees that were more sensitive to climate were in the humid and semi-humid regions was observed, whereas the phenomenon that older trees were more sensitive occurred more frequently in the relatively arid areas. For example, Abies georgei var. smithii (Viguie & Gaussen) W. C. Cheng & L. K. Fu in the Sygera Mountains [12], Picea mariana (Mill.) BSP in Northern Manitoba [13] and Juniperus thurifera L. in north-central Spain [14] all showed that the younger trees responded to climatic factors more strongly than the older trees. In contrast, studies on Qilian Juniper (Sabina przewalskii Kom.) in northwest China [15], Korean pine (Pinus koraiensis Sieb. et Zucc.) in the Changbai Mountain, Northeast China [16], and Pinus tabulaeformis Carr. and Picea purpurea Mast. in the arid region of the Kongtong Mountain, northwest China [17], found that older trees showed stronger response to climatic factors than younger trees.
There is a significant variation in wetness and dryness from east to west in the Qilian Mountains, northwest China [18], which provides conditions for studying different relationships between the age and climate sensitivity of growth in the different water stress environments. Picea crassifolia Kom. is a type of widespread conifer in northwest China [19]. Forests of Picea crassifolia are distributed in the entire region of the Qilian Mountains, and the trees are sensitive to climate. There have been many dendrochronological studies on Picea crassifolia carried out in the region [20,21,22]. In this study, we set up a series of sites to sample tree cores of Picea crassifolia along the moisture gradient in the Qilian Mountains. We explored the variability of climate-radial growth relationships at the individual tree scale [23,24] and its relationship with the age of individual trees. We hypothesized that: (1) trees in the more arid areas were more sensitive to climate than those in the wetter areas; and (2) younger trees responded more strongly to climate in the wetter areas, while older trees exhibited higher sensitivity to climate in the drier areas of the same region.

2. Materials and Methods

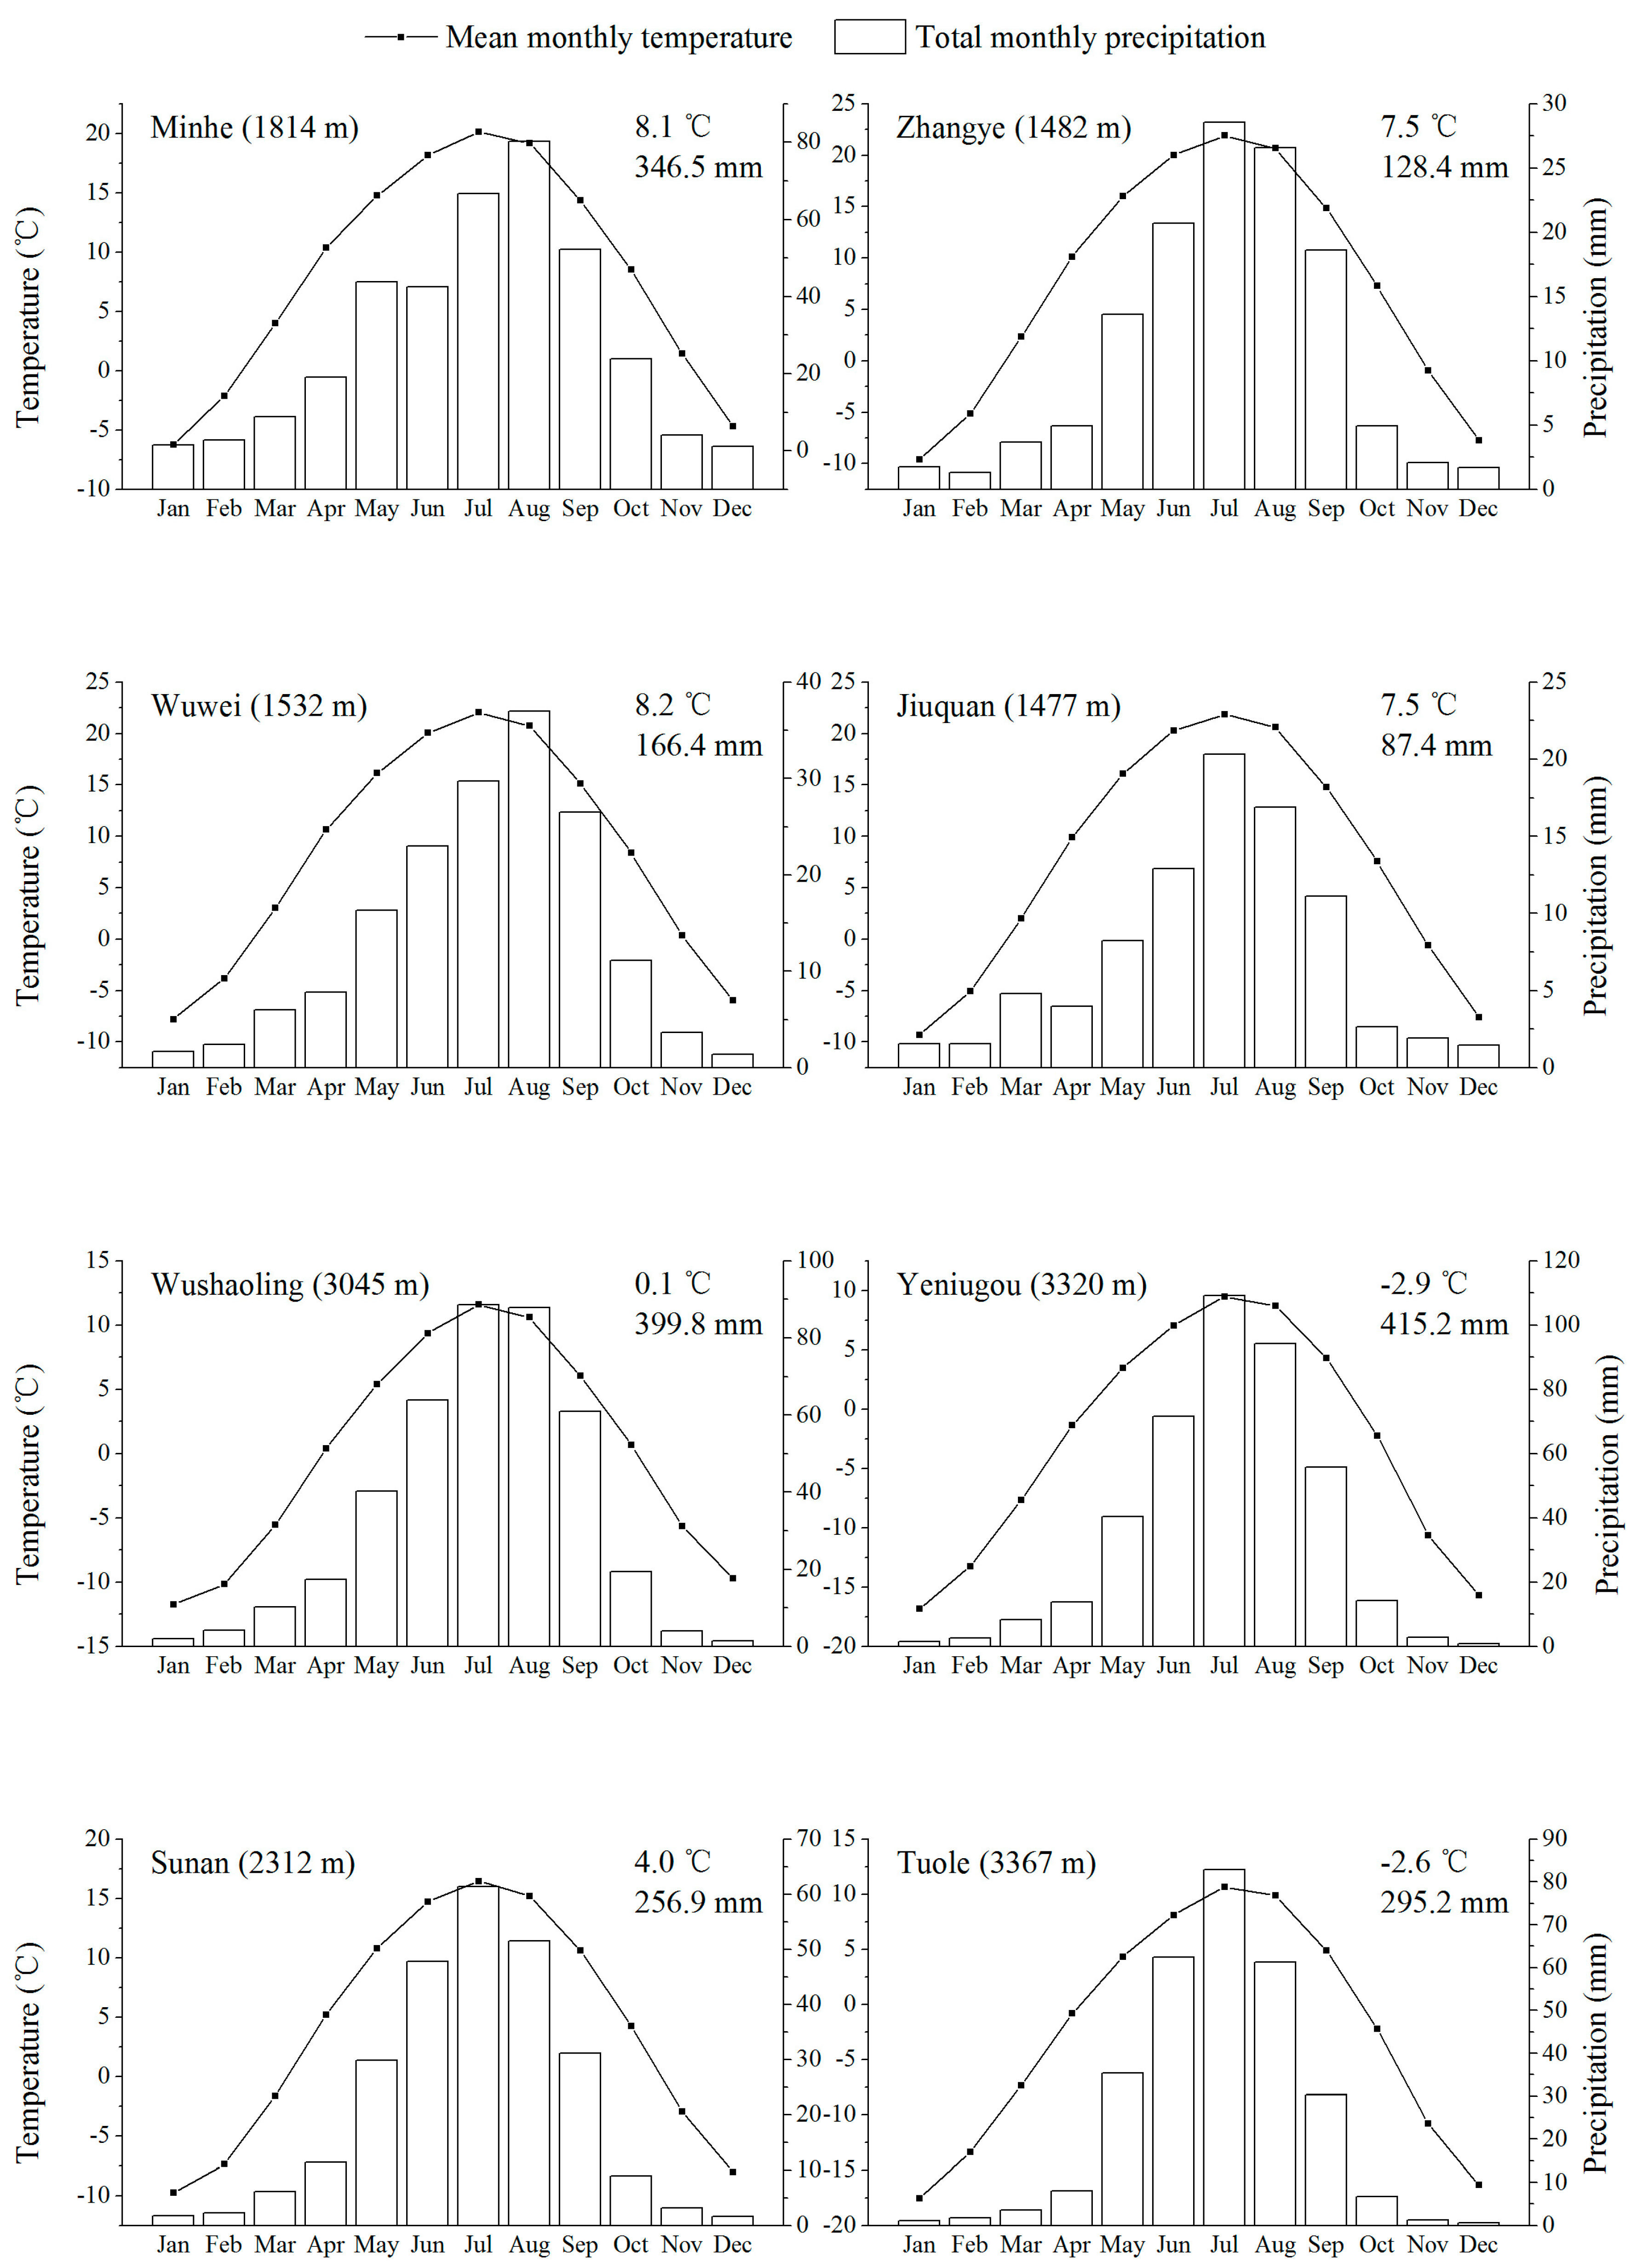
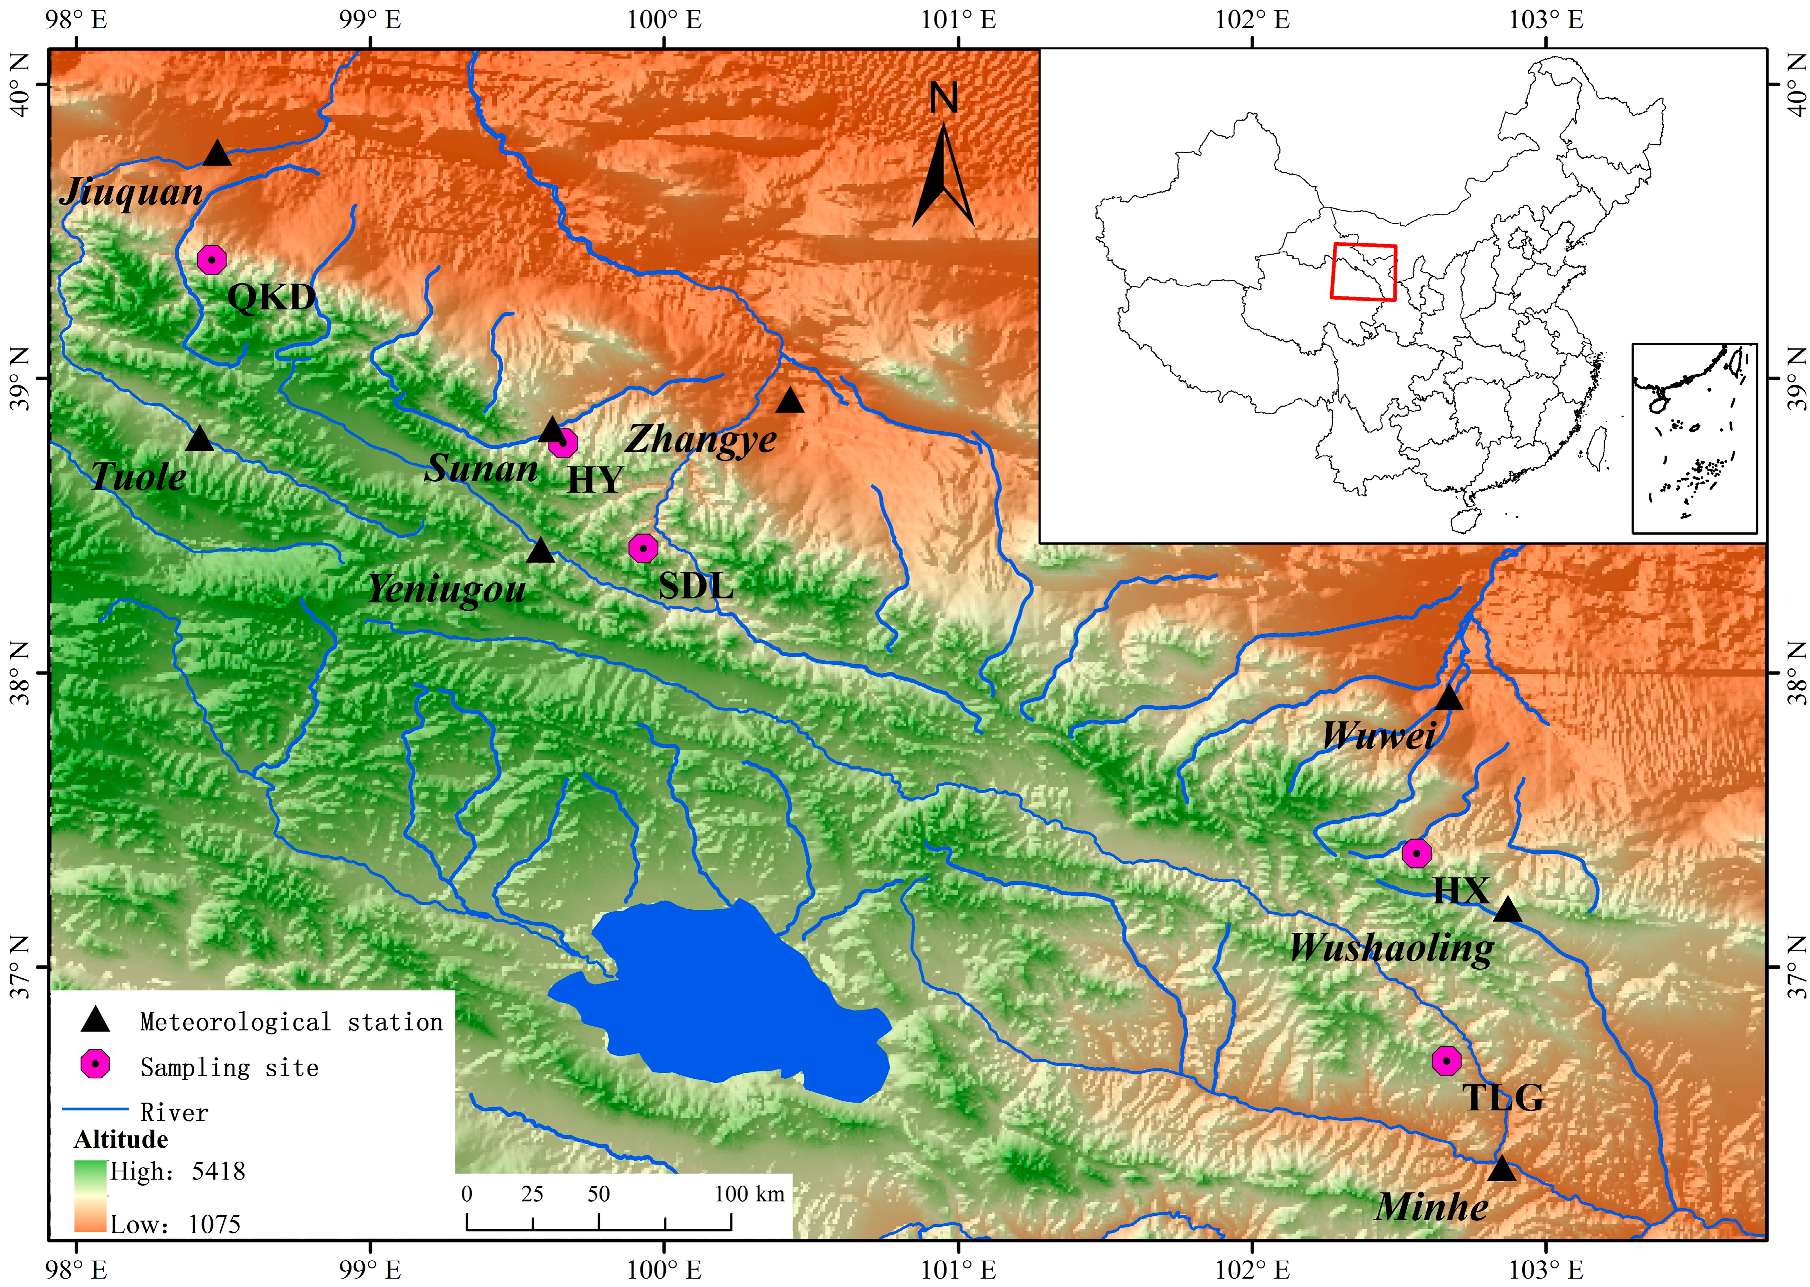
2.1. Study Area and Climate

The study area is located in the Qilian Mountains (36.433°–40.017° N, 94.867°–103.150° E), on the northeastern margin of the Tibet Plateau in northwest China (Figure 1). The topography is high in the northwest and low in the southeast. The altitude range is 2500–4500 m a.s.l. in the Qilian Mountains. Picea crassifolia and Sabina przewalskii are two dominant forest tree species that inhabit a wide biogeographical niche in the study area. Generally, Picea crassifolia grows at wetter sites and Sabina przewalskii grows at drier ones [25]. The region is influenced by the East Asian Monsoon and the Westerlies climates [5].
The study area lies in a transition zone between the East Asian Monsoon and the Westerlies. The East Asian Monsoon dominates in the east Shiyang River basin, whereas the Westerlies dominate in the west Shule River basin. A mix of the two dominant weather systems occurs in the middle Heihe River basin [26,27]. Total annual precipitation (1959–2013) drops from 346.5 mm at Minhe (36.32° N, 102.85° E; 1814 m a.s.l.) and 166.4 mm at Wuwei (37.92° N, 102.67° E; 1532 m a.s.l.) in the east, 128.4 mm at Zhangye (38.93° N, 100.43° E; 1482 m a.s.l.) in the middle and 87.4 mm at Jiuquan in the west (39.77° N, 98.48° E; 1477 m a.s.l.) of the study area (Figure 2). Total annual precipitation at high altitudes is much higher than at low altitudes. Total annual precipitation (1959–2013), as recorded by mountain meteorological stations, is 399.8 mm at Wushaoling (37.20° N, 102.87° E; 3045 m a.s.l.) in the east, 256.9 mm at Sunan (38.83° N, 99.62° E; 2312 m a.s.l.), 415.2 mm at Yeniugou (38.42° N, 99.58° E; 3320 m a.s.l.) in the middle and 295.2 mm at Tuole (38.8° N, 98.42° E; 3367 m a.s.l.) in the west, respectively (Figure 2). Mean annual temperature (1959–2013) in the study area ranges from 7.4–8.2 °C at low altitudes and from −2.9–0.1 °C at high altitudes. Overall, climate in the eastern Qilian Mountains shows a higher temperature and more precipitation than that in the west. Most of the precipitation occurs during May–September, and the high mean monthly temperatures emerge during June–August.

2.2. Sampling and Chronology Development

Five sampling areas were selected along a moisture gradient in the Qilian Mountains, where the forests were natural pure forests with little disturbance from felling, fire or insects and similar density (Figure 1). The five areas were named TLG (i.e., Tulugou), HX (i.e., Haxi), SDL (i.e., Sidalong), HYG (i.e., Heiyagou) and QKD (i.e., Qingkedi) along the southeast-northwest mountain range. Soil characteristics were similar among them [5]. One to three sampling sites with a slope from 25 to 35 degrees were set in each area (Table 1). We set a quadrat (20 m × 20 m) at each sampling site. All the quadrats within the area had similar stand density. Twenty-five healthy trees (with a >20 cm diameter at breast height) were randomly selected and sampled. Two cores from each tree were taken at approximately a 1.3-m height using increment borers (5.15 mm in diameter). The cores were treated according to the standard dendrochronological procedures [28]: fixed, sanded, cross-dated by matching patterns of wide or narrow rings [29] and measured with TSAP software package (WIN-PC) (Frank Ring Company, Heidelberg, Germany) [30].
Cross-dating and the quality of the tree-ring width series at each site were checked by using the COFECHA program [31]. A 50-year cubic smoothing spline or negative exponential function was used to detrend the tree-ring width series and get standard chronologies of each core in the ARSTAN program [32]. Mean sensitivity (MS) and standard deviation (SD) were calculated for each chronology within the common period (1960–2013) to assess the year-to-year variability of growth and allow comparisons among the chronologies at different sites [28].

2.3. Analytical Method

Hierarchical cluster analysis was used to divide all the cores into different groups. The cluster method selected Ward’s method and measures of distance selected Euclidean distance in the cluster analysis. The cluster analysis result finally divided all the cores into two groups, i.e., the east group and west group. The east group included TLG1 (Tulugou 1), TLG2 (Tulugou 2), HX1 (Haxi 1), HX2 (Haxi 2) and SDL1 (Sidalong 1), while the west group included SDL2 (Sidalong 2), HYG1 (Heiyagou 1), HYG2 (Heiyagou 2), HYG3 (Heiyagou 3) and QKD (Qingkedi). The east group represented trees growing in the relatively wetter environment, and the west group represented those in the relatively drier environment.
One-way ANOVA was used to examine the differences of MS and SD of chronologies belonging to different groups. Pearson correlations were calculated between the chronology of each core and climate factors within the common period (1960–2013). The climatic factors included mean monthly temperature and total monthly precipitation from the previous June to the current October of the year for tree-ring formation and the combination of several months. The Pearson correlation coefficients indicated the response sensitivity of radial growth to climate. Pearson correlations at TLG were calculated by using climate data from the Wushaoling meteorological station; those at HX were from the Wuwei and Wushaoling stations; those at SDL were from the Qilian and Yeniugou stations; those at HYG were from the Sunan and Yeniugou stations; and those at QKD were from the Jiuquan and Tuole stations. Climate data at each altitude were calculated according to the proportion of vertical distance to the two nearest meteorological stations, which was similar to the inverse distance weighted interpolation [33,34].
For example, vertical distance of site SDL1 (3200 m a.s.l) to Yeniugou station (3320 m a.s.l) was 120 m, and vertical distance to Qilian station (2787 m a.s.l) was 413 m. Precipitation of SDL1 was calculated according to the following equation:
Pre ( SDL 1 ) = 413 / ( 120 + 413 ) × Pre ( Yeniugou ) + 120 / ( 120 + 413 ) × Pre ( Qilian )
where Pre(SDL1) indicates precipitation at site HE, Pre(Yeniugou) indicates precipitation of Yeniugou station and Pre(Qilian) indicates precipitation of Qilian station.
We counted the tree rings to estimate tree age. Because the distance between the pith and first complete tree ring was less than 2.0 cm, we used a visual method to estimate the number of missing rings [35,36]. Linear fitting and quadratic polynomial fitting were used to test the relationships between the age and mean sensitivity, standard deviation and radial growth’s response to climate (i.e., the absolute value of correlation coefficients between tree-ring indexes and climate). The absolute values of coefficients could reflect the response intensity more accurately. We analyzed the data by using IBM SPSS (Version 20.0, SPSS Inc., Chicago, IL, USA). Because there was a different sample distribution in each age class, we calculated the percentages of significant correlation coefficients between climate and radial growth. The fitting lines of the percentages could add information to illustrate the relationships between tree age and radial growth’s response to climate.

3. Results

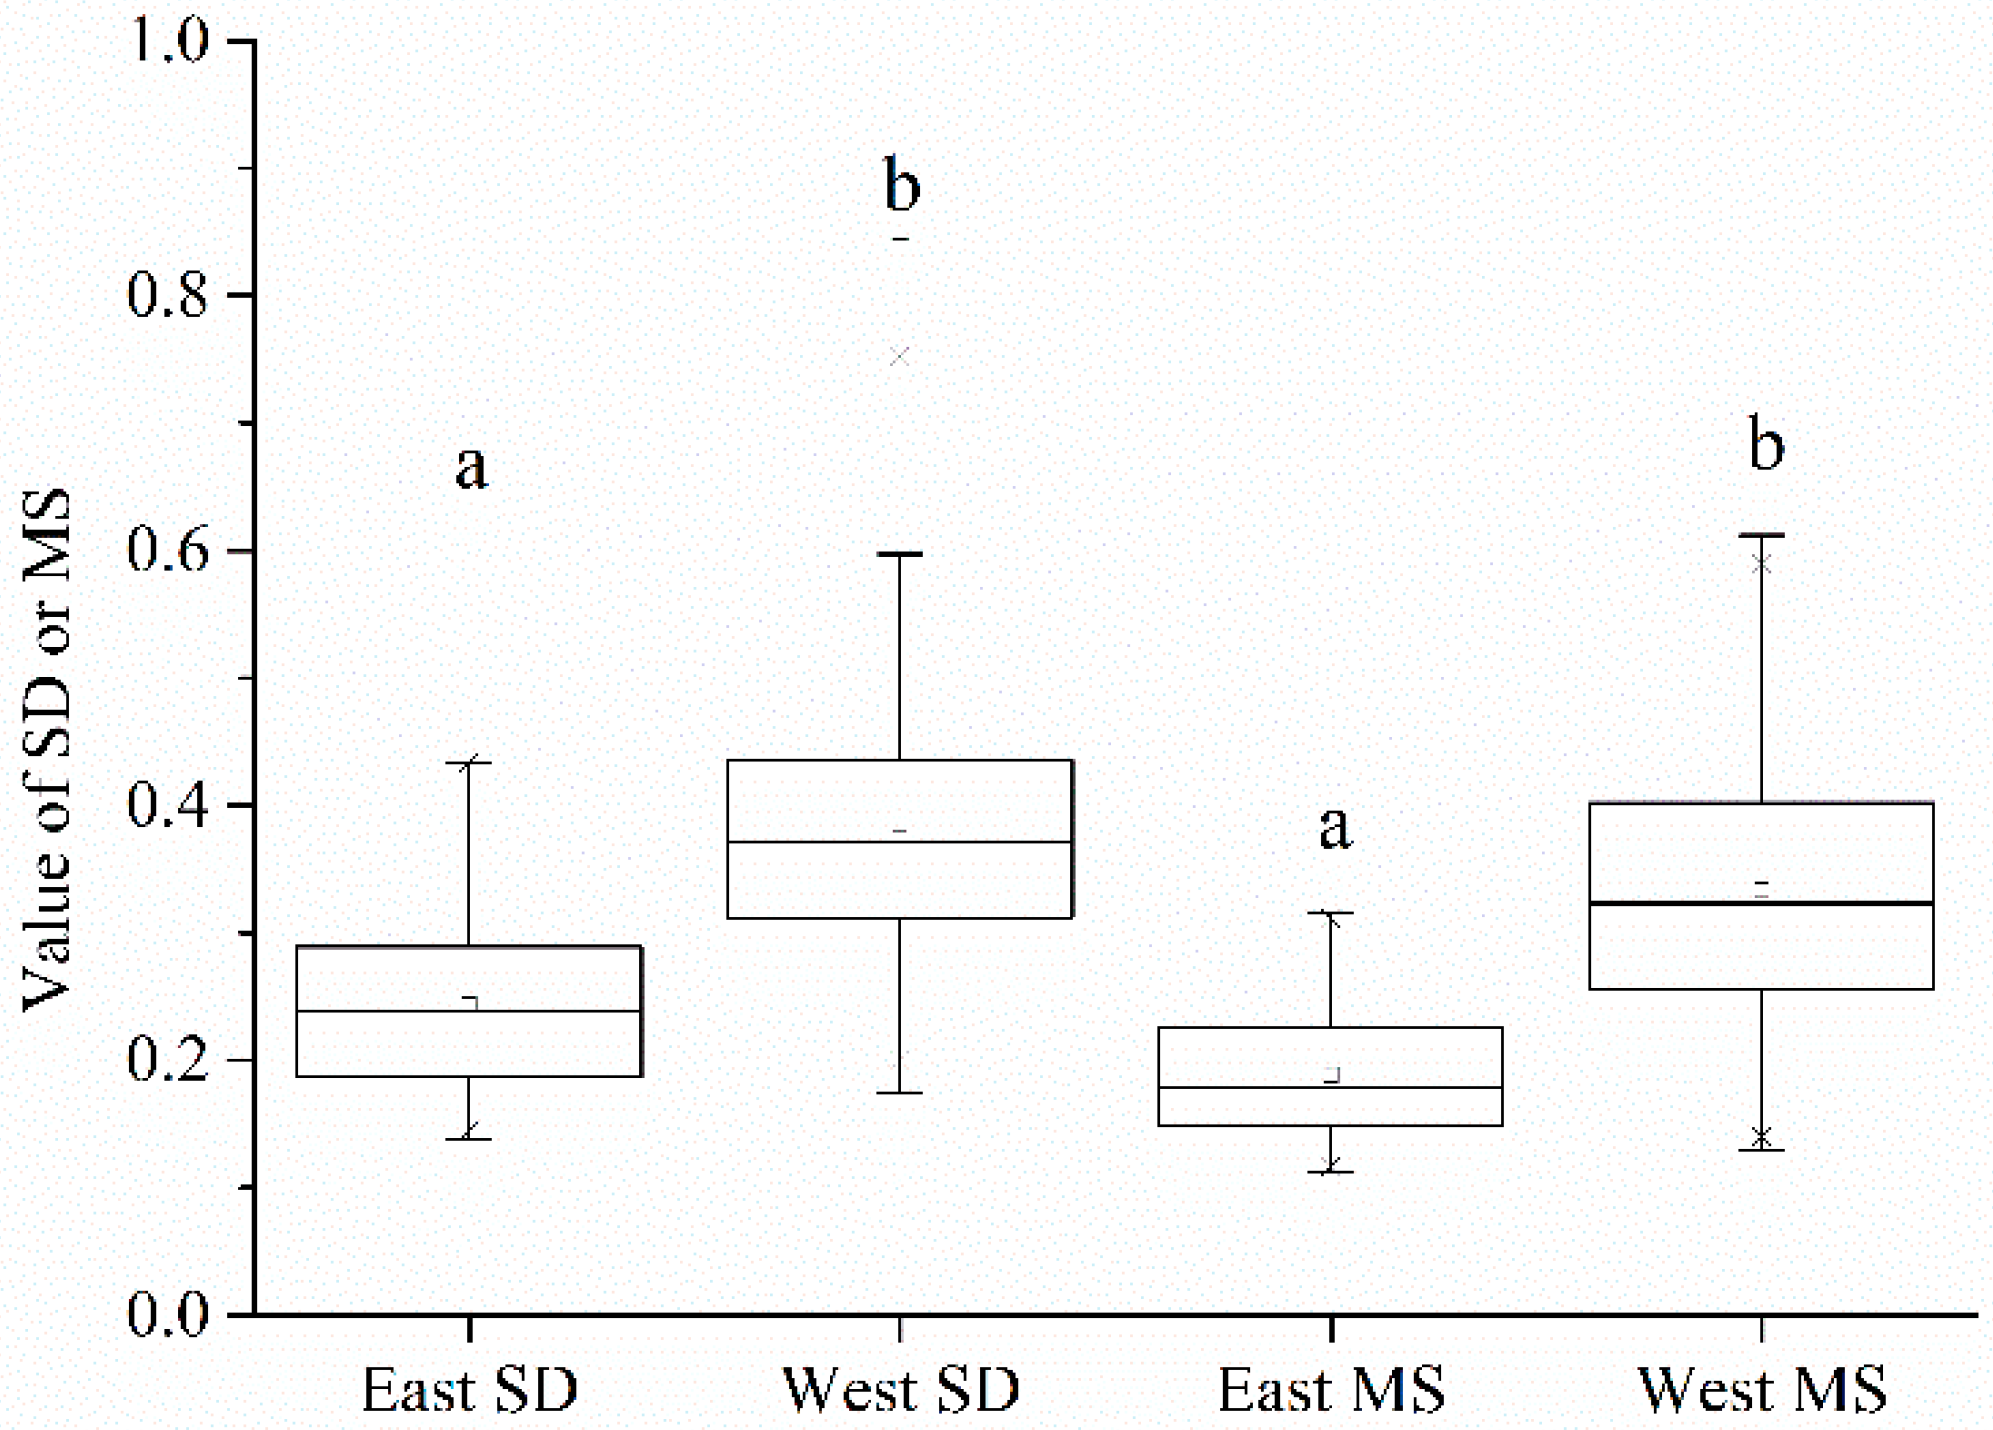
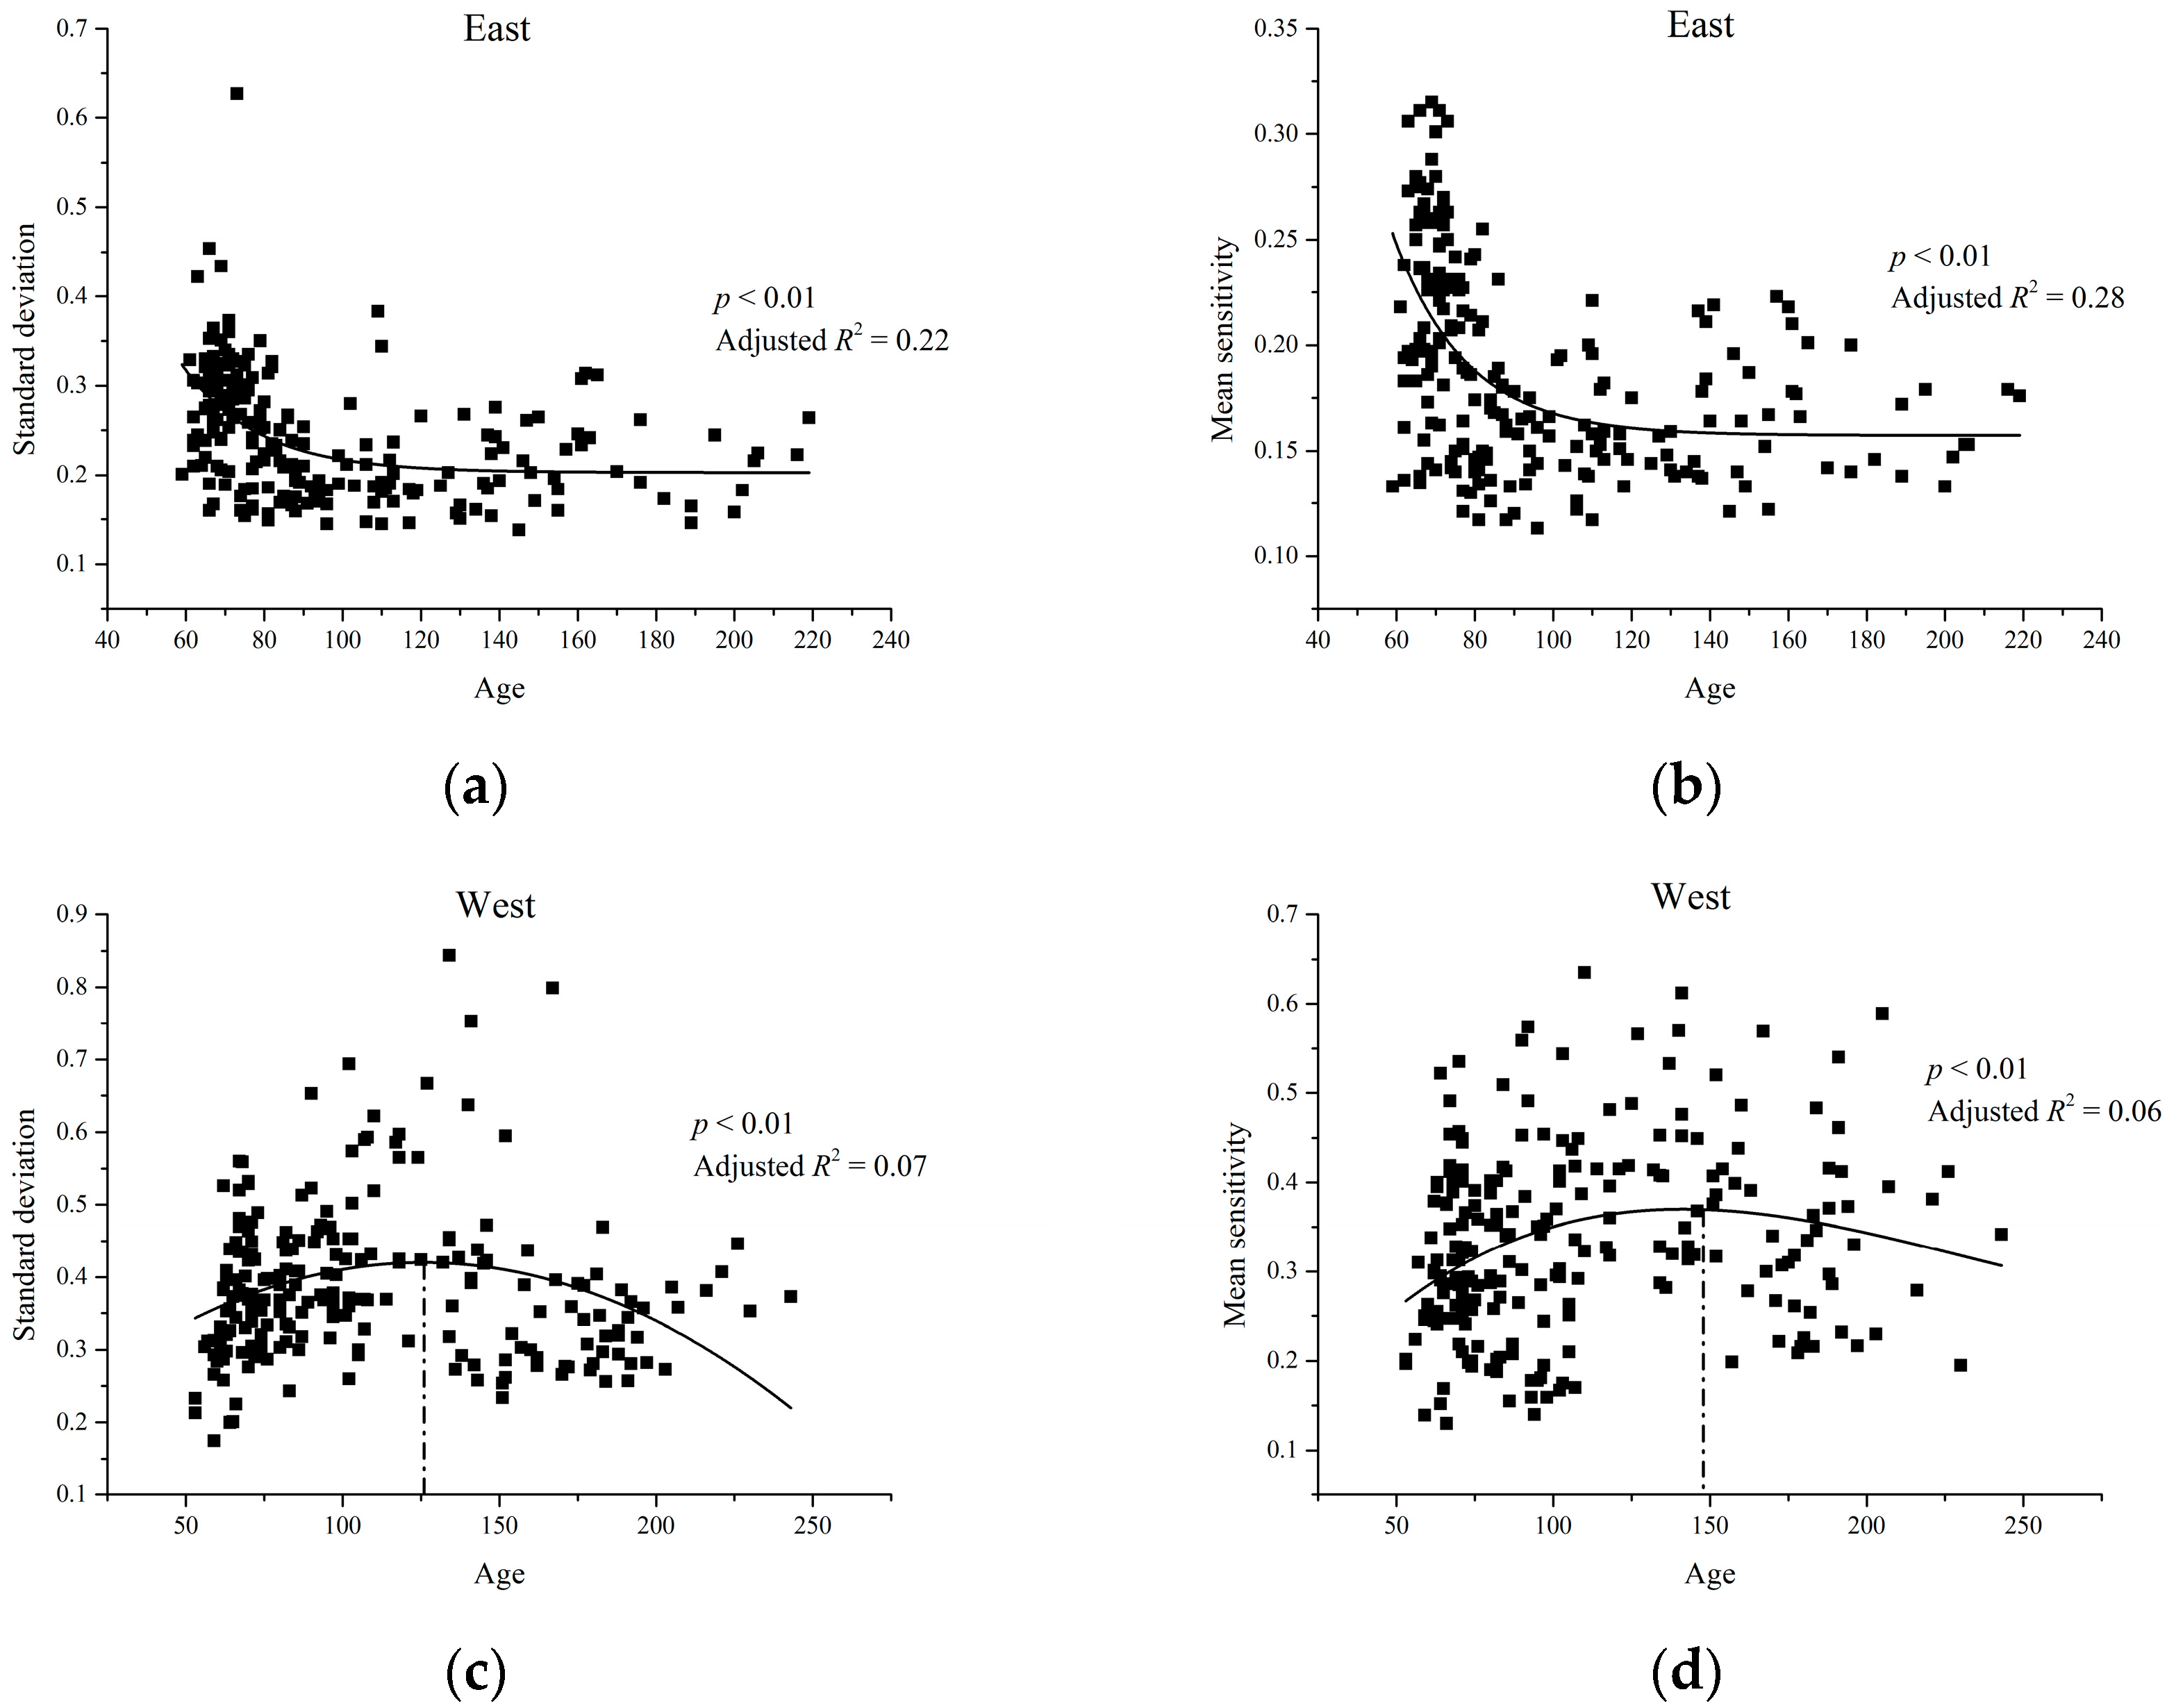
3.1. Chronology Parameters and Their Relationship with the Age of Trees in the East and West

Mean values of the standard deviation (SD) of the chronologies in the east and west were above 0.13, and those of mean sensitivity (MS) were above 0.11 (Figure 3). The numbers of MS and SD indicated that the chronologies were qualified for studying climate-radial growth relationships. The mean values of MS and SD in the west were significantly higher than those in the east, which indicates that the relative variability in tree-ring width was higher in the west.
There was a negative exponential relationship between age and SD (or MS) in the east (Table S1). Trees younger than 80 years tended to have higher SD and MS there (Figure 4a,b). There was also a type of quadratic function relationship between age and SD (or MS) in the west (Table S2). The maximum value of the quadratic polynomial curve fitting SD emerged when the age was 126 years, and that of the curve fitting MS emerged when the age was 148 years (Figure 4c,d).

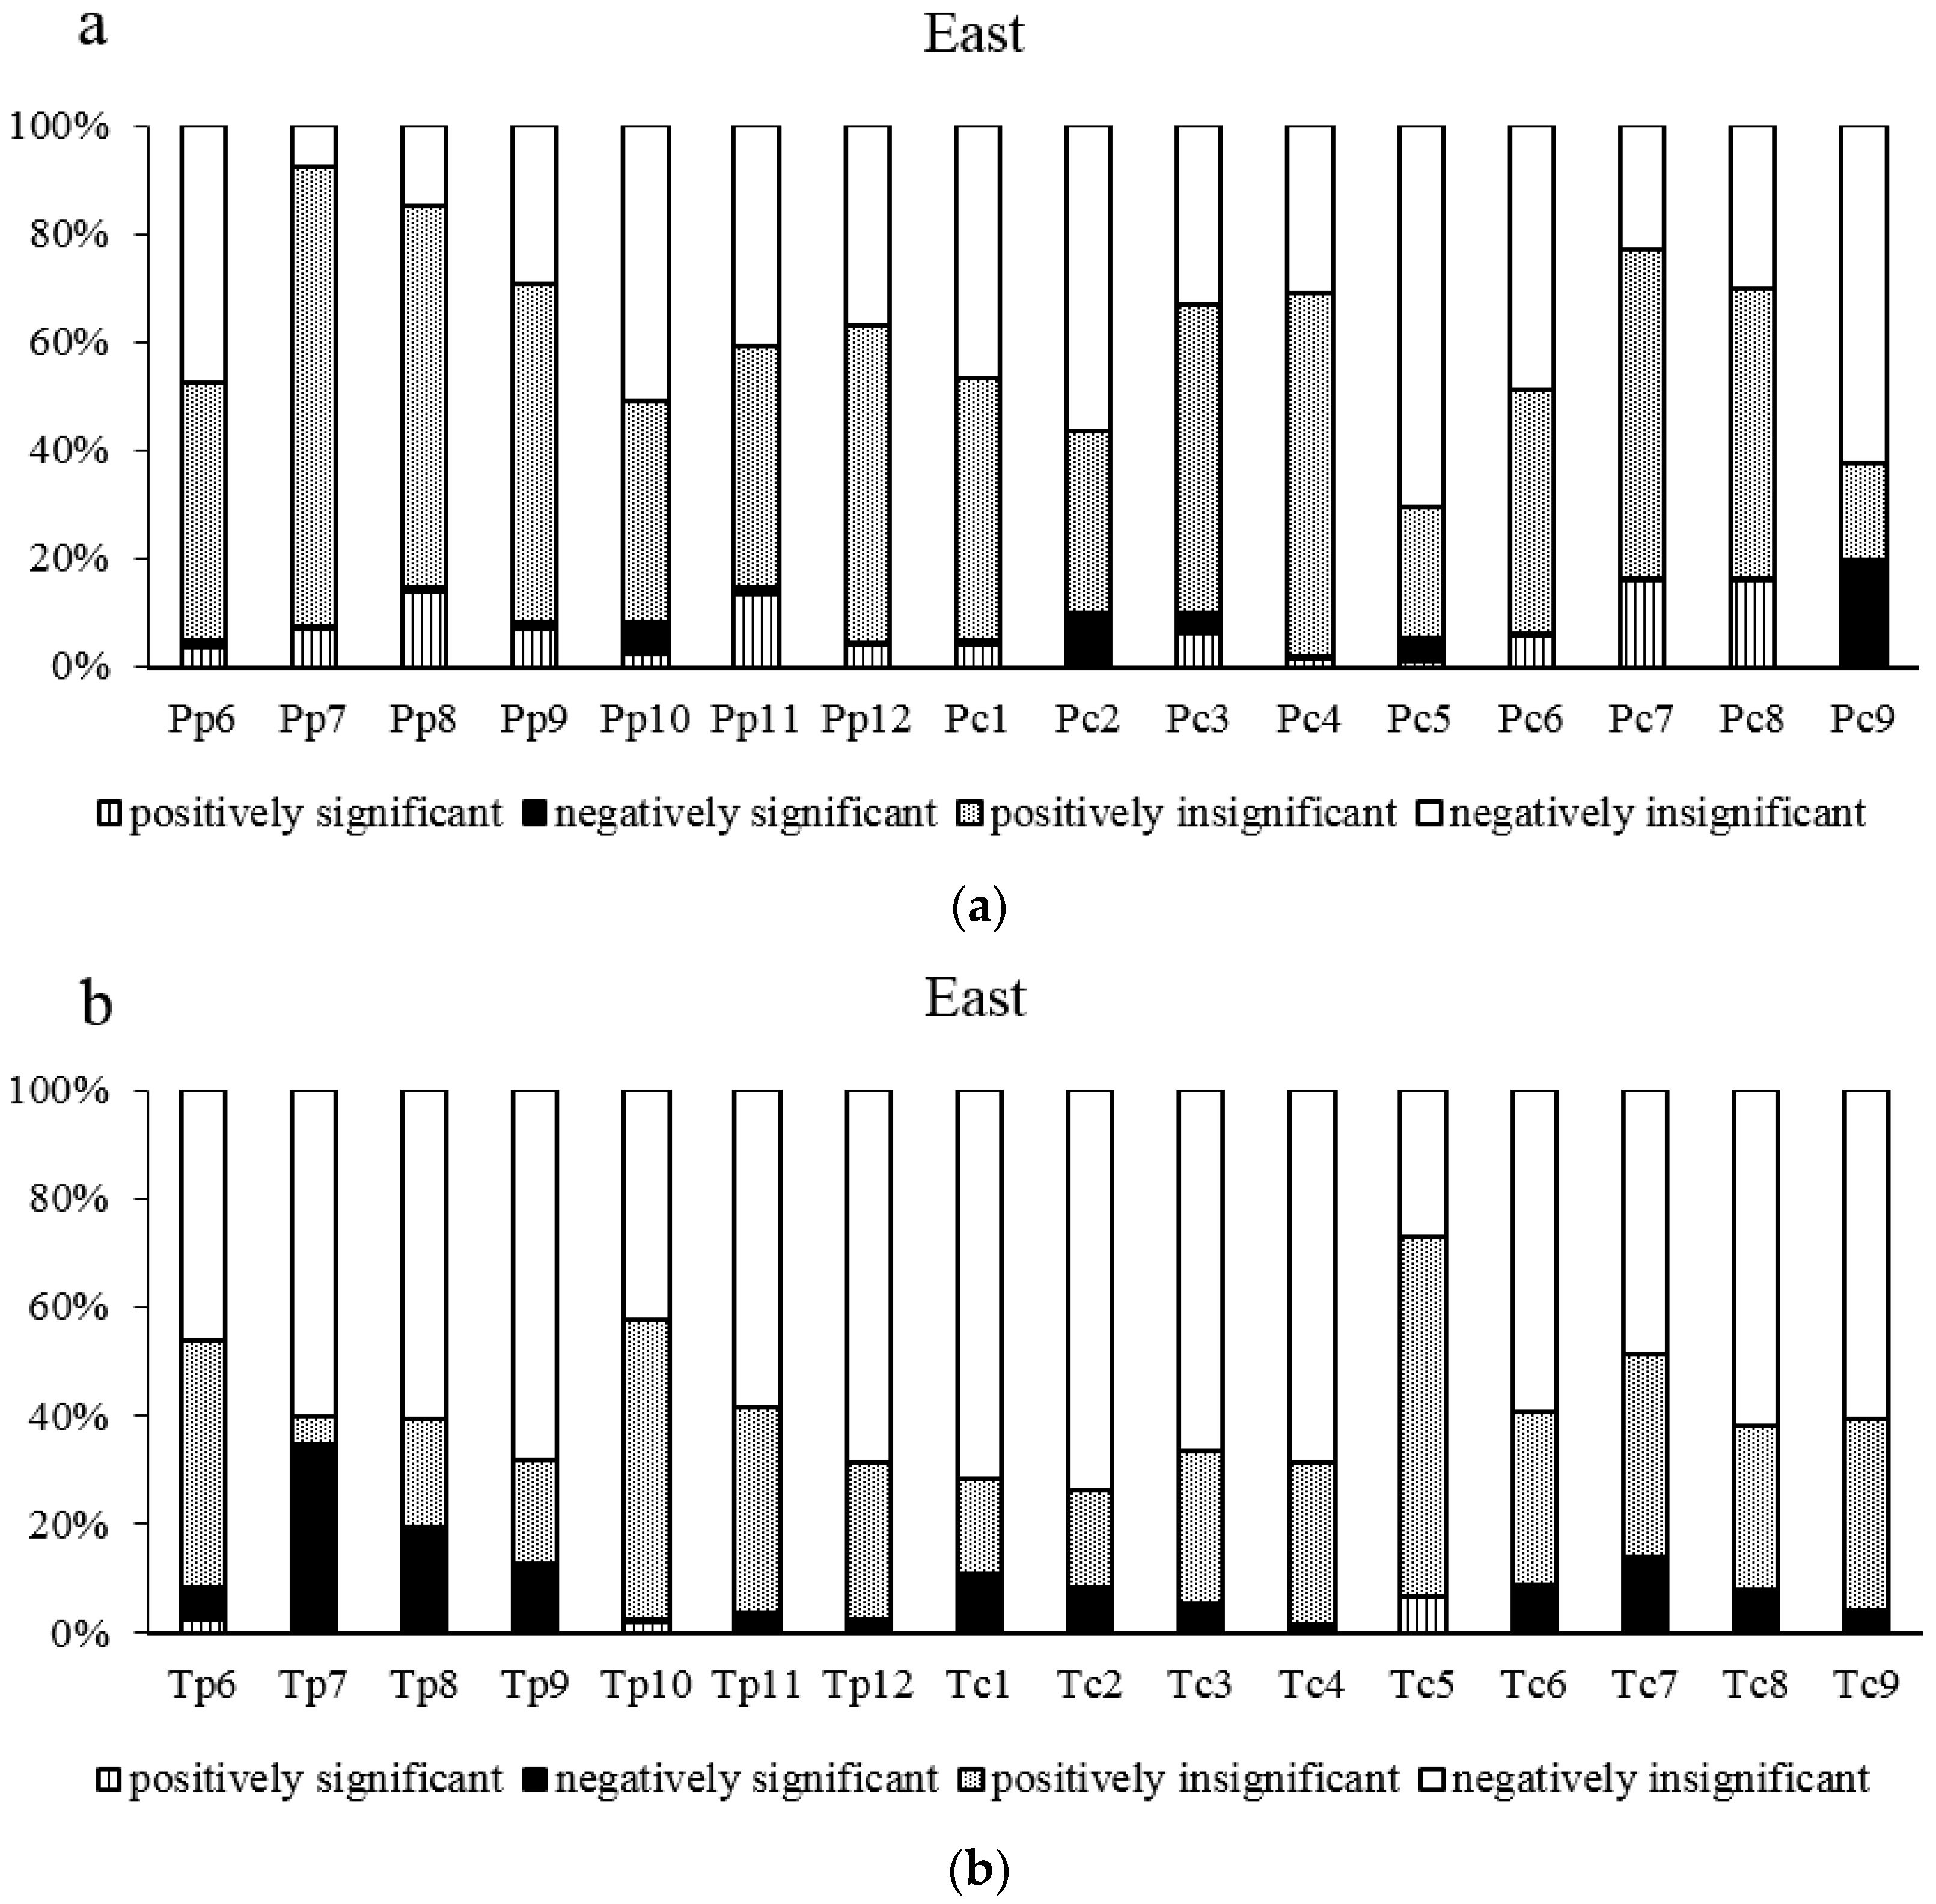
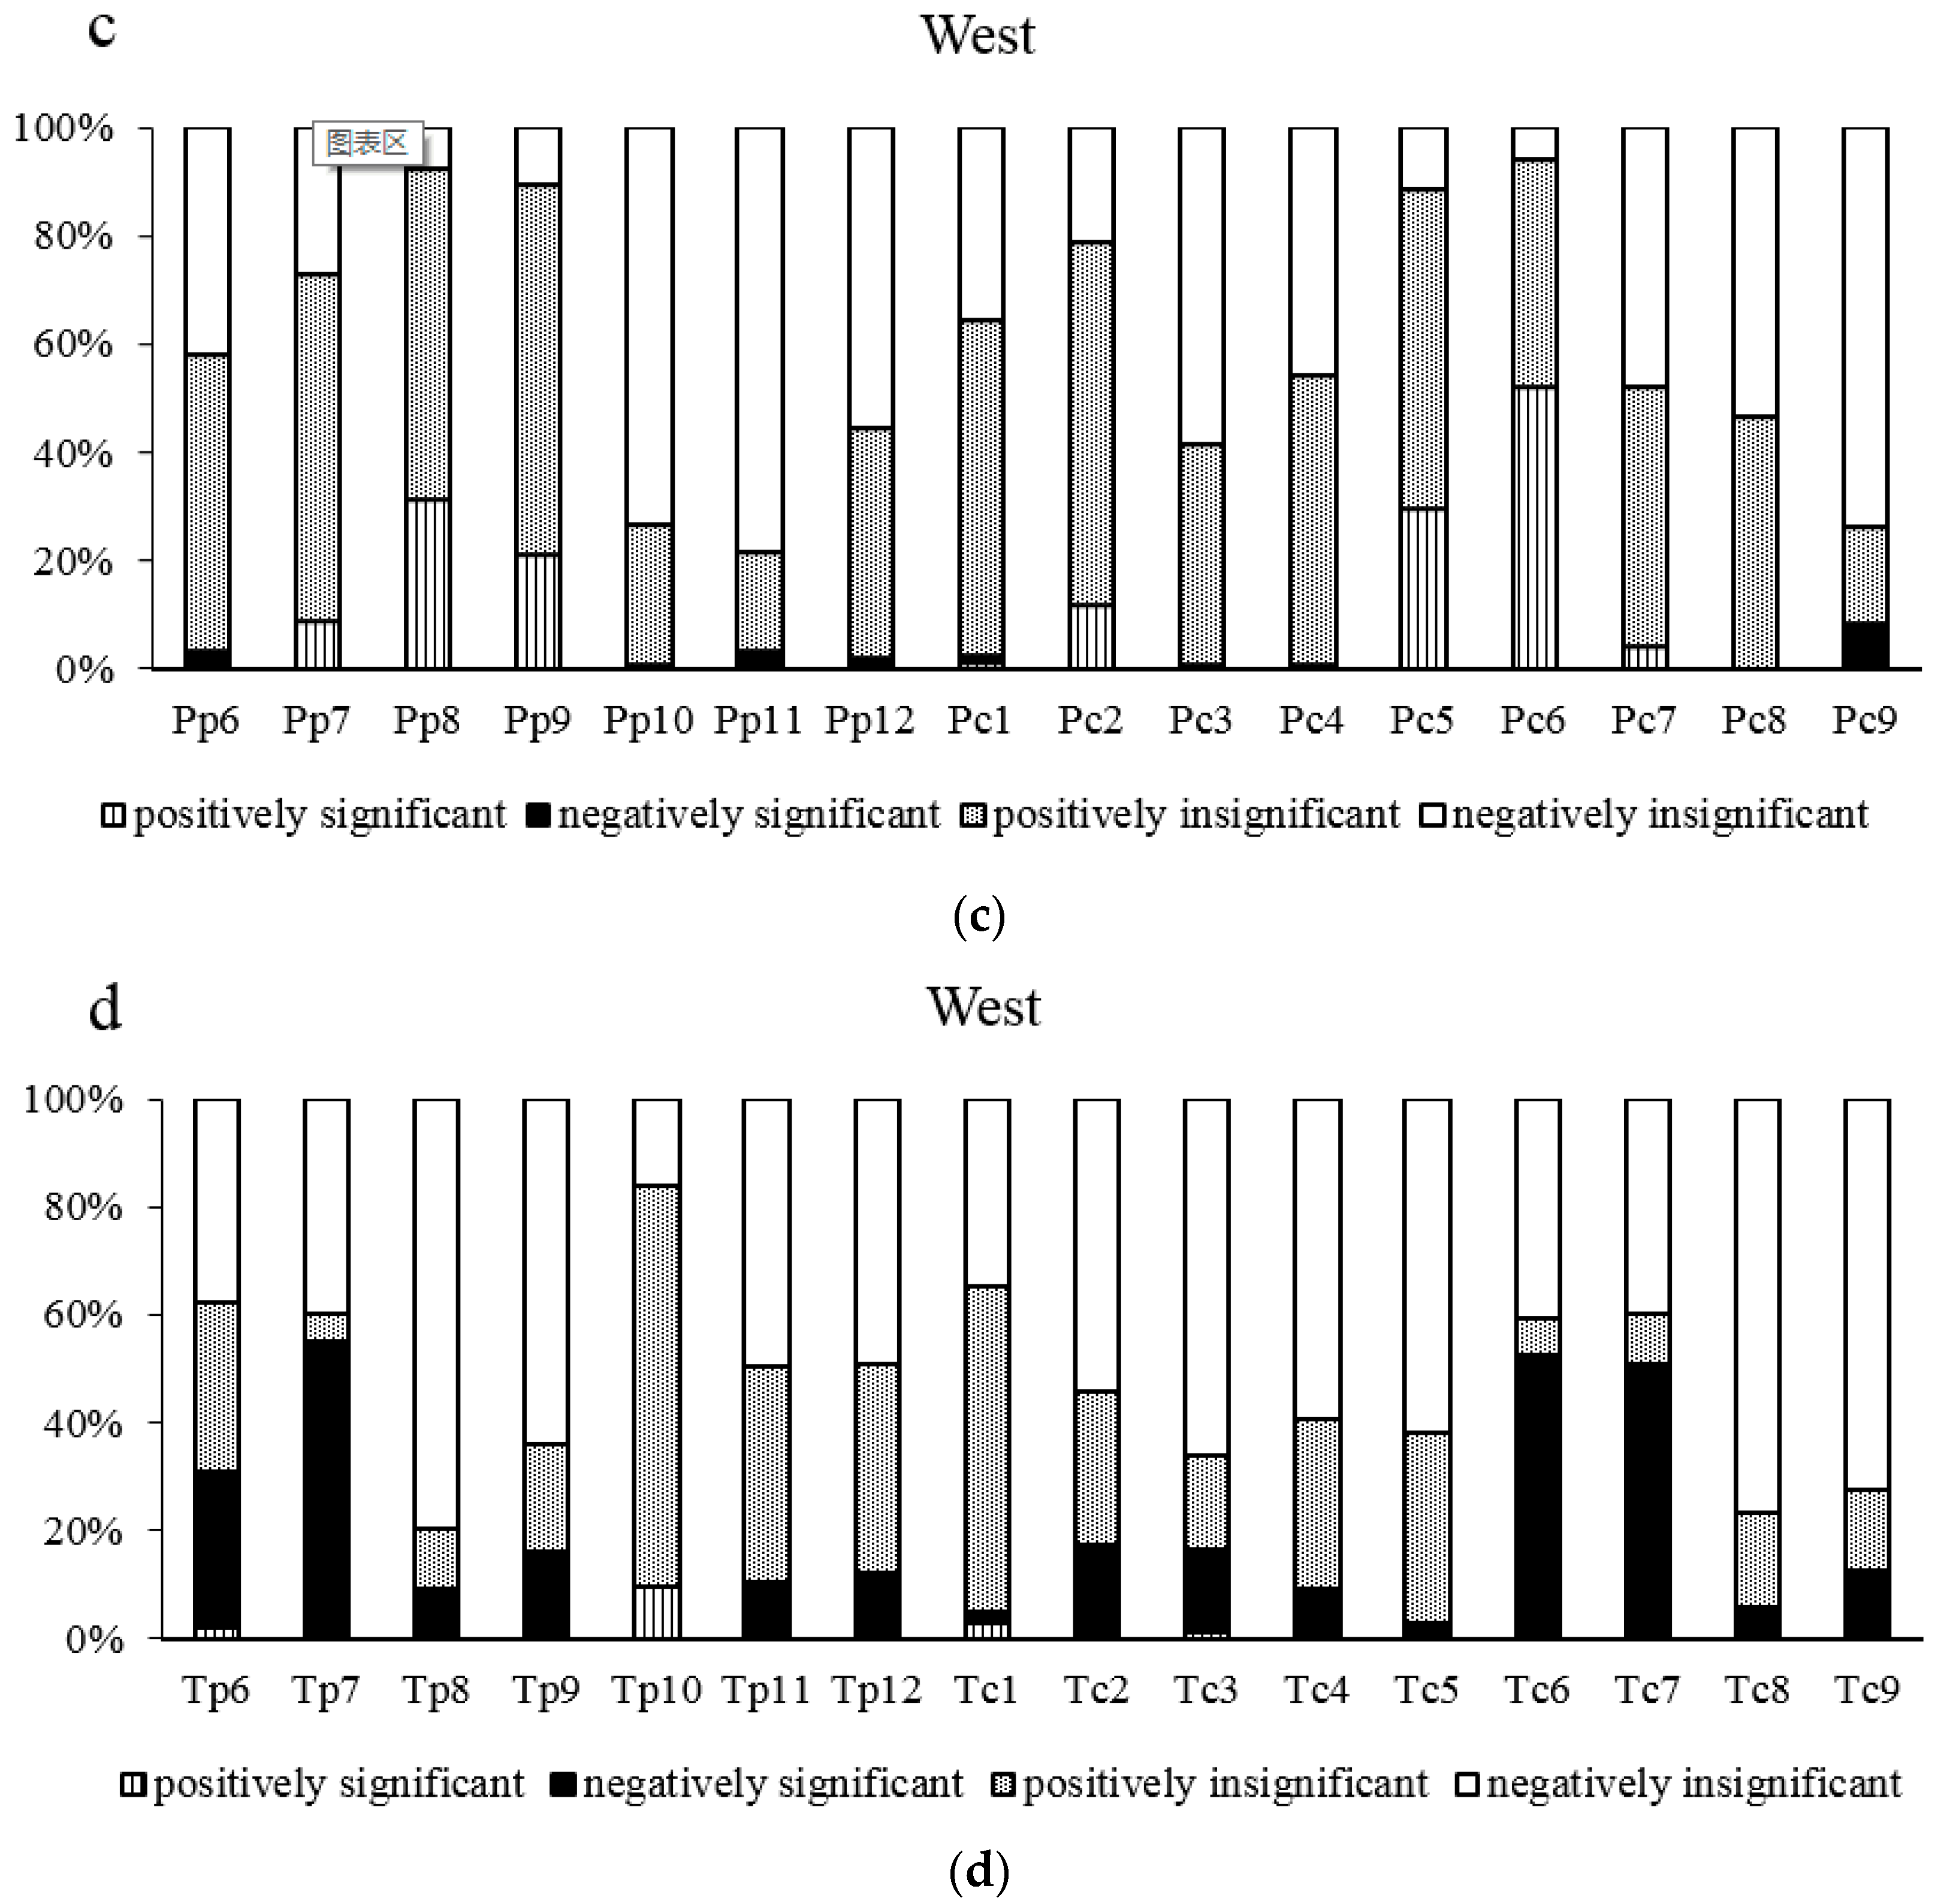
3.2. Analysis of Climate-Radial Growth Relationships in the East and West

Pearson correlation coefficients between the chronology of each core and climate factors from the previous June to the current September were calculated, and only part of the chronologies showed significant correlation with climate (Figure 5). More than ten percent of chronologies in the east significantly correlated with the total monthly precipitation of the previous August (14.3%), the current July (16.5%), the current August (16.1%) and the current September (19.2%) (Figure 5a). They also significantly correlated with the mean monthly temperature of the previous July (34.4%), the previous August (19.2%), the previous September (12.5%) and the current July (13.8%) (Figure 5b).
Chronologies in the west tended to show more significant correlation with climate factors than those in the east. More than twenty percent of chronologies in the west showed significant correlation with the total monthly precipitation of the previous August (32.3%), the previous September (21.3%), the current May (29.6%) and the current June (52.2%) (Figure 5c). Those in the west also showed significant correlation with the mean monthly temperature of the previous June (30.9%), the previous July (55.2%), the current June (52.6%) and the current July (50.0%) (Figure 5d).

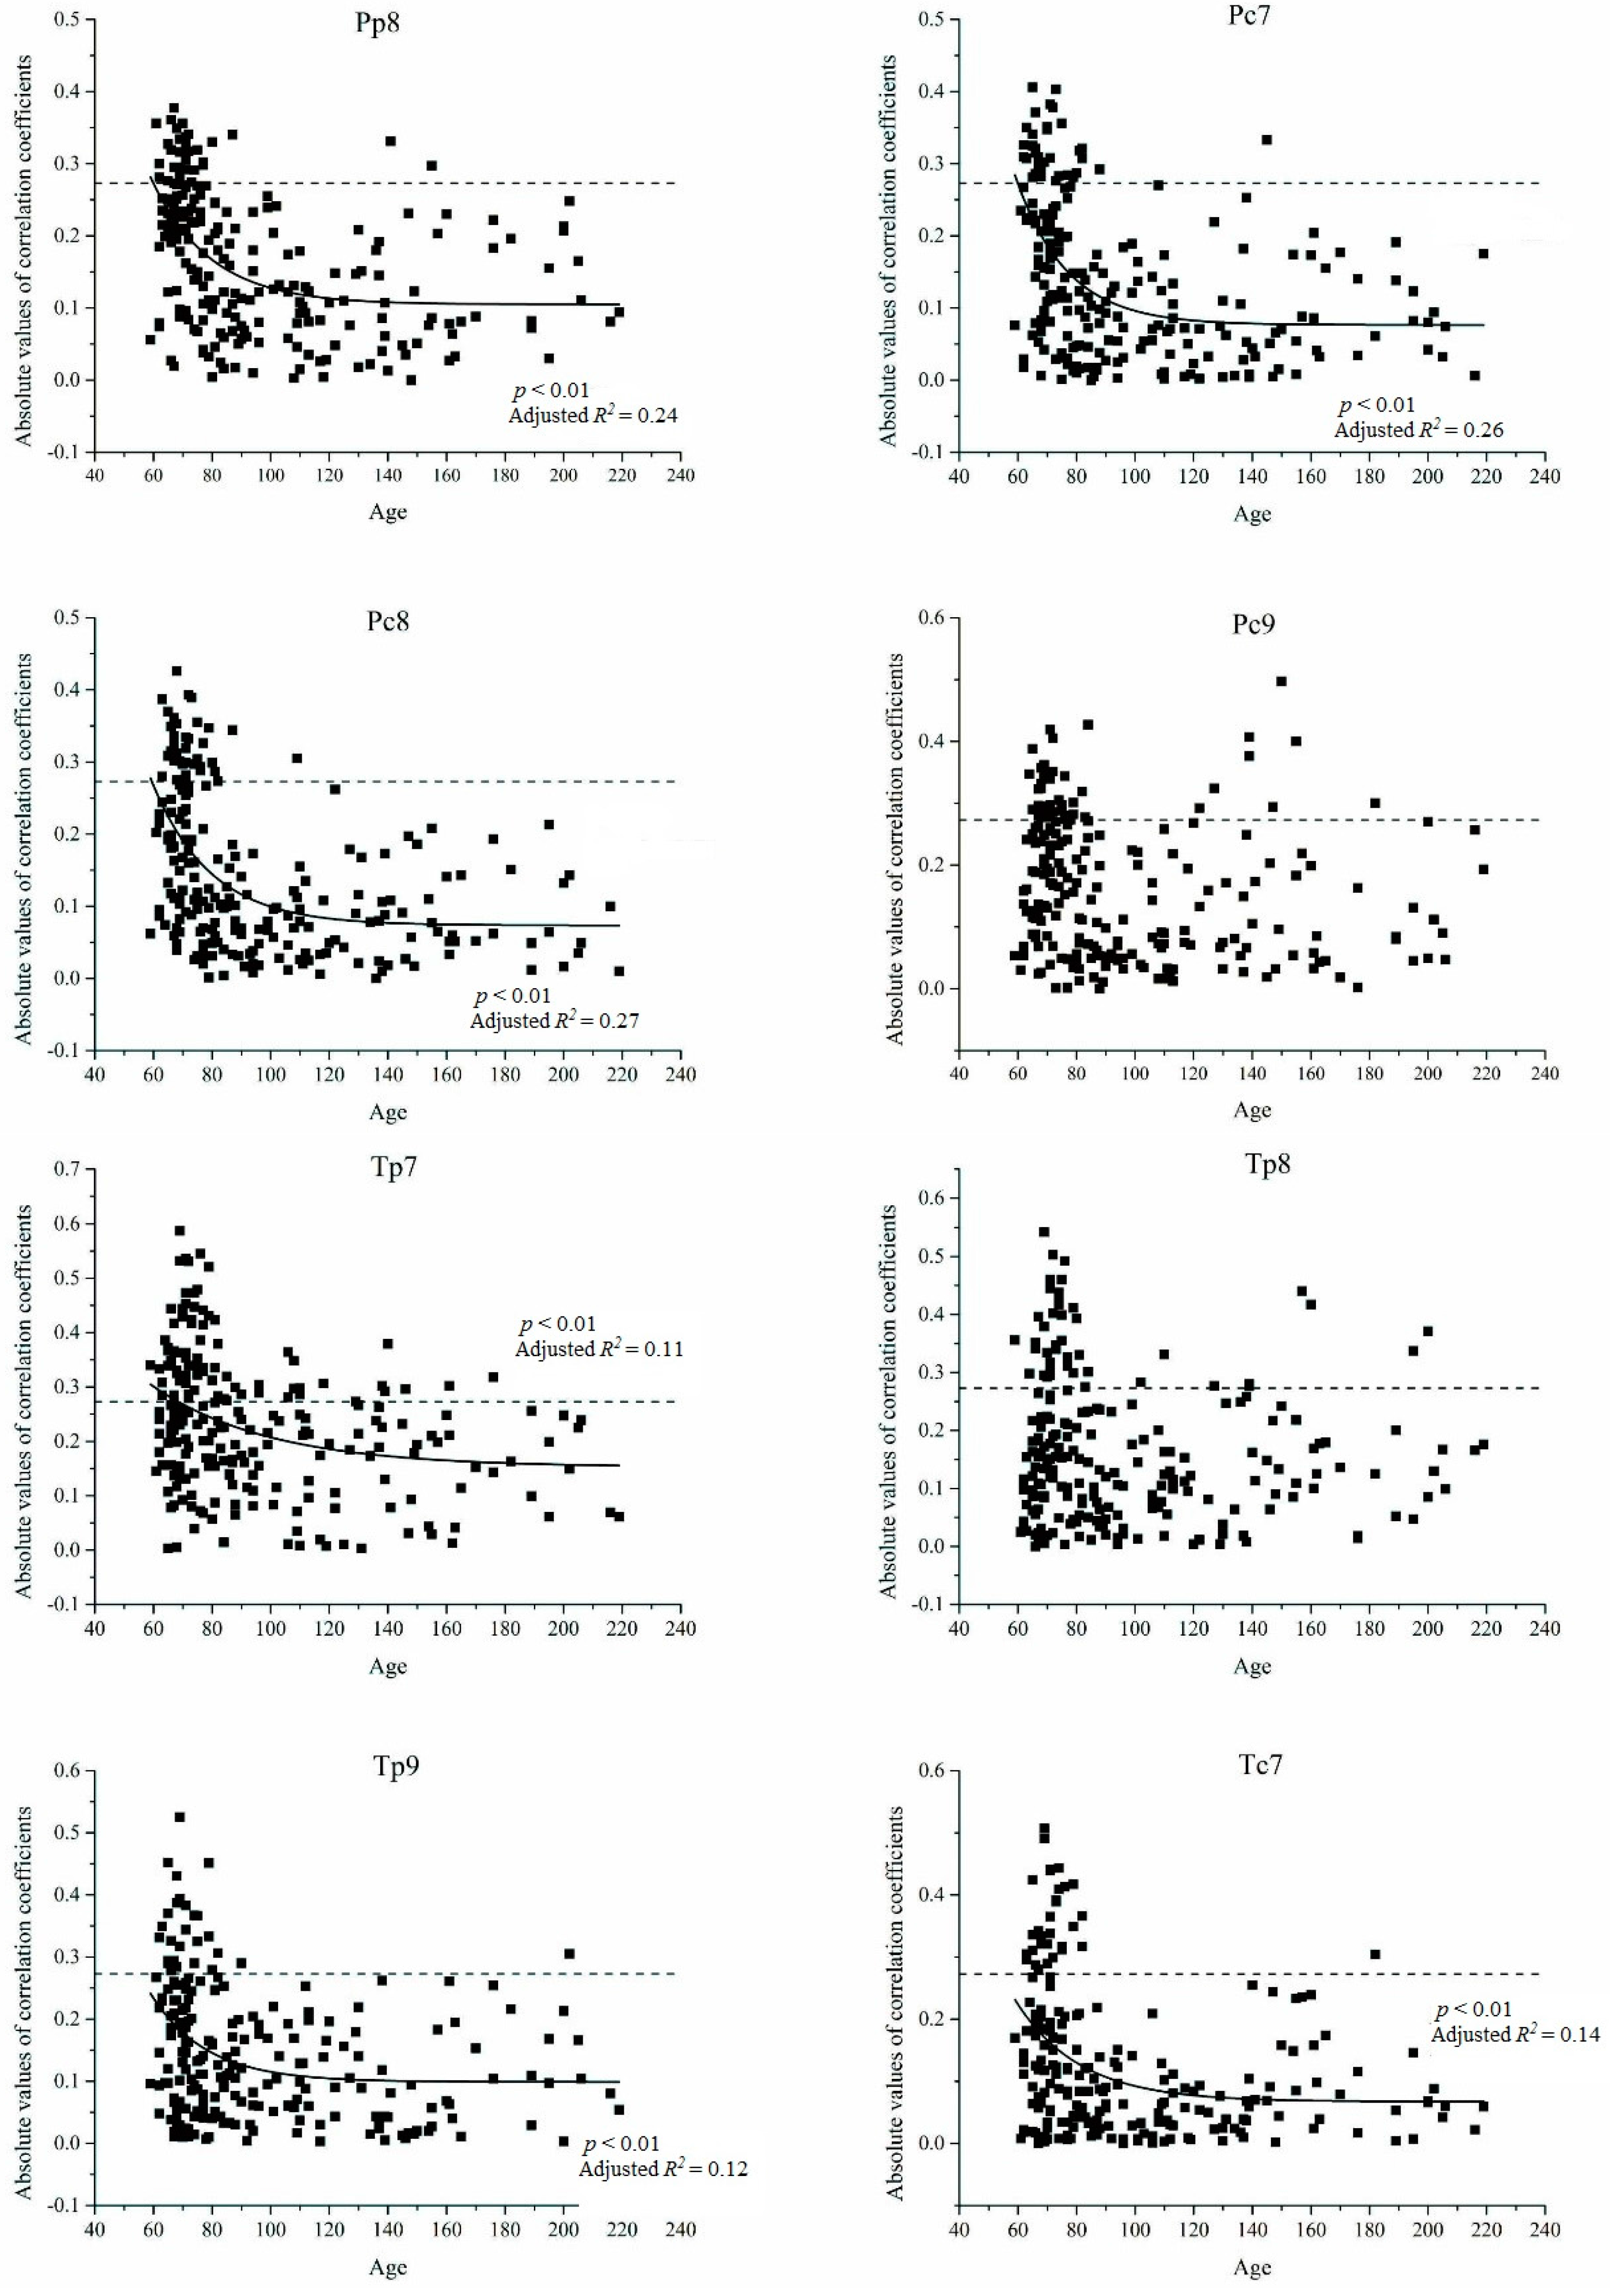
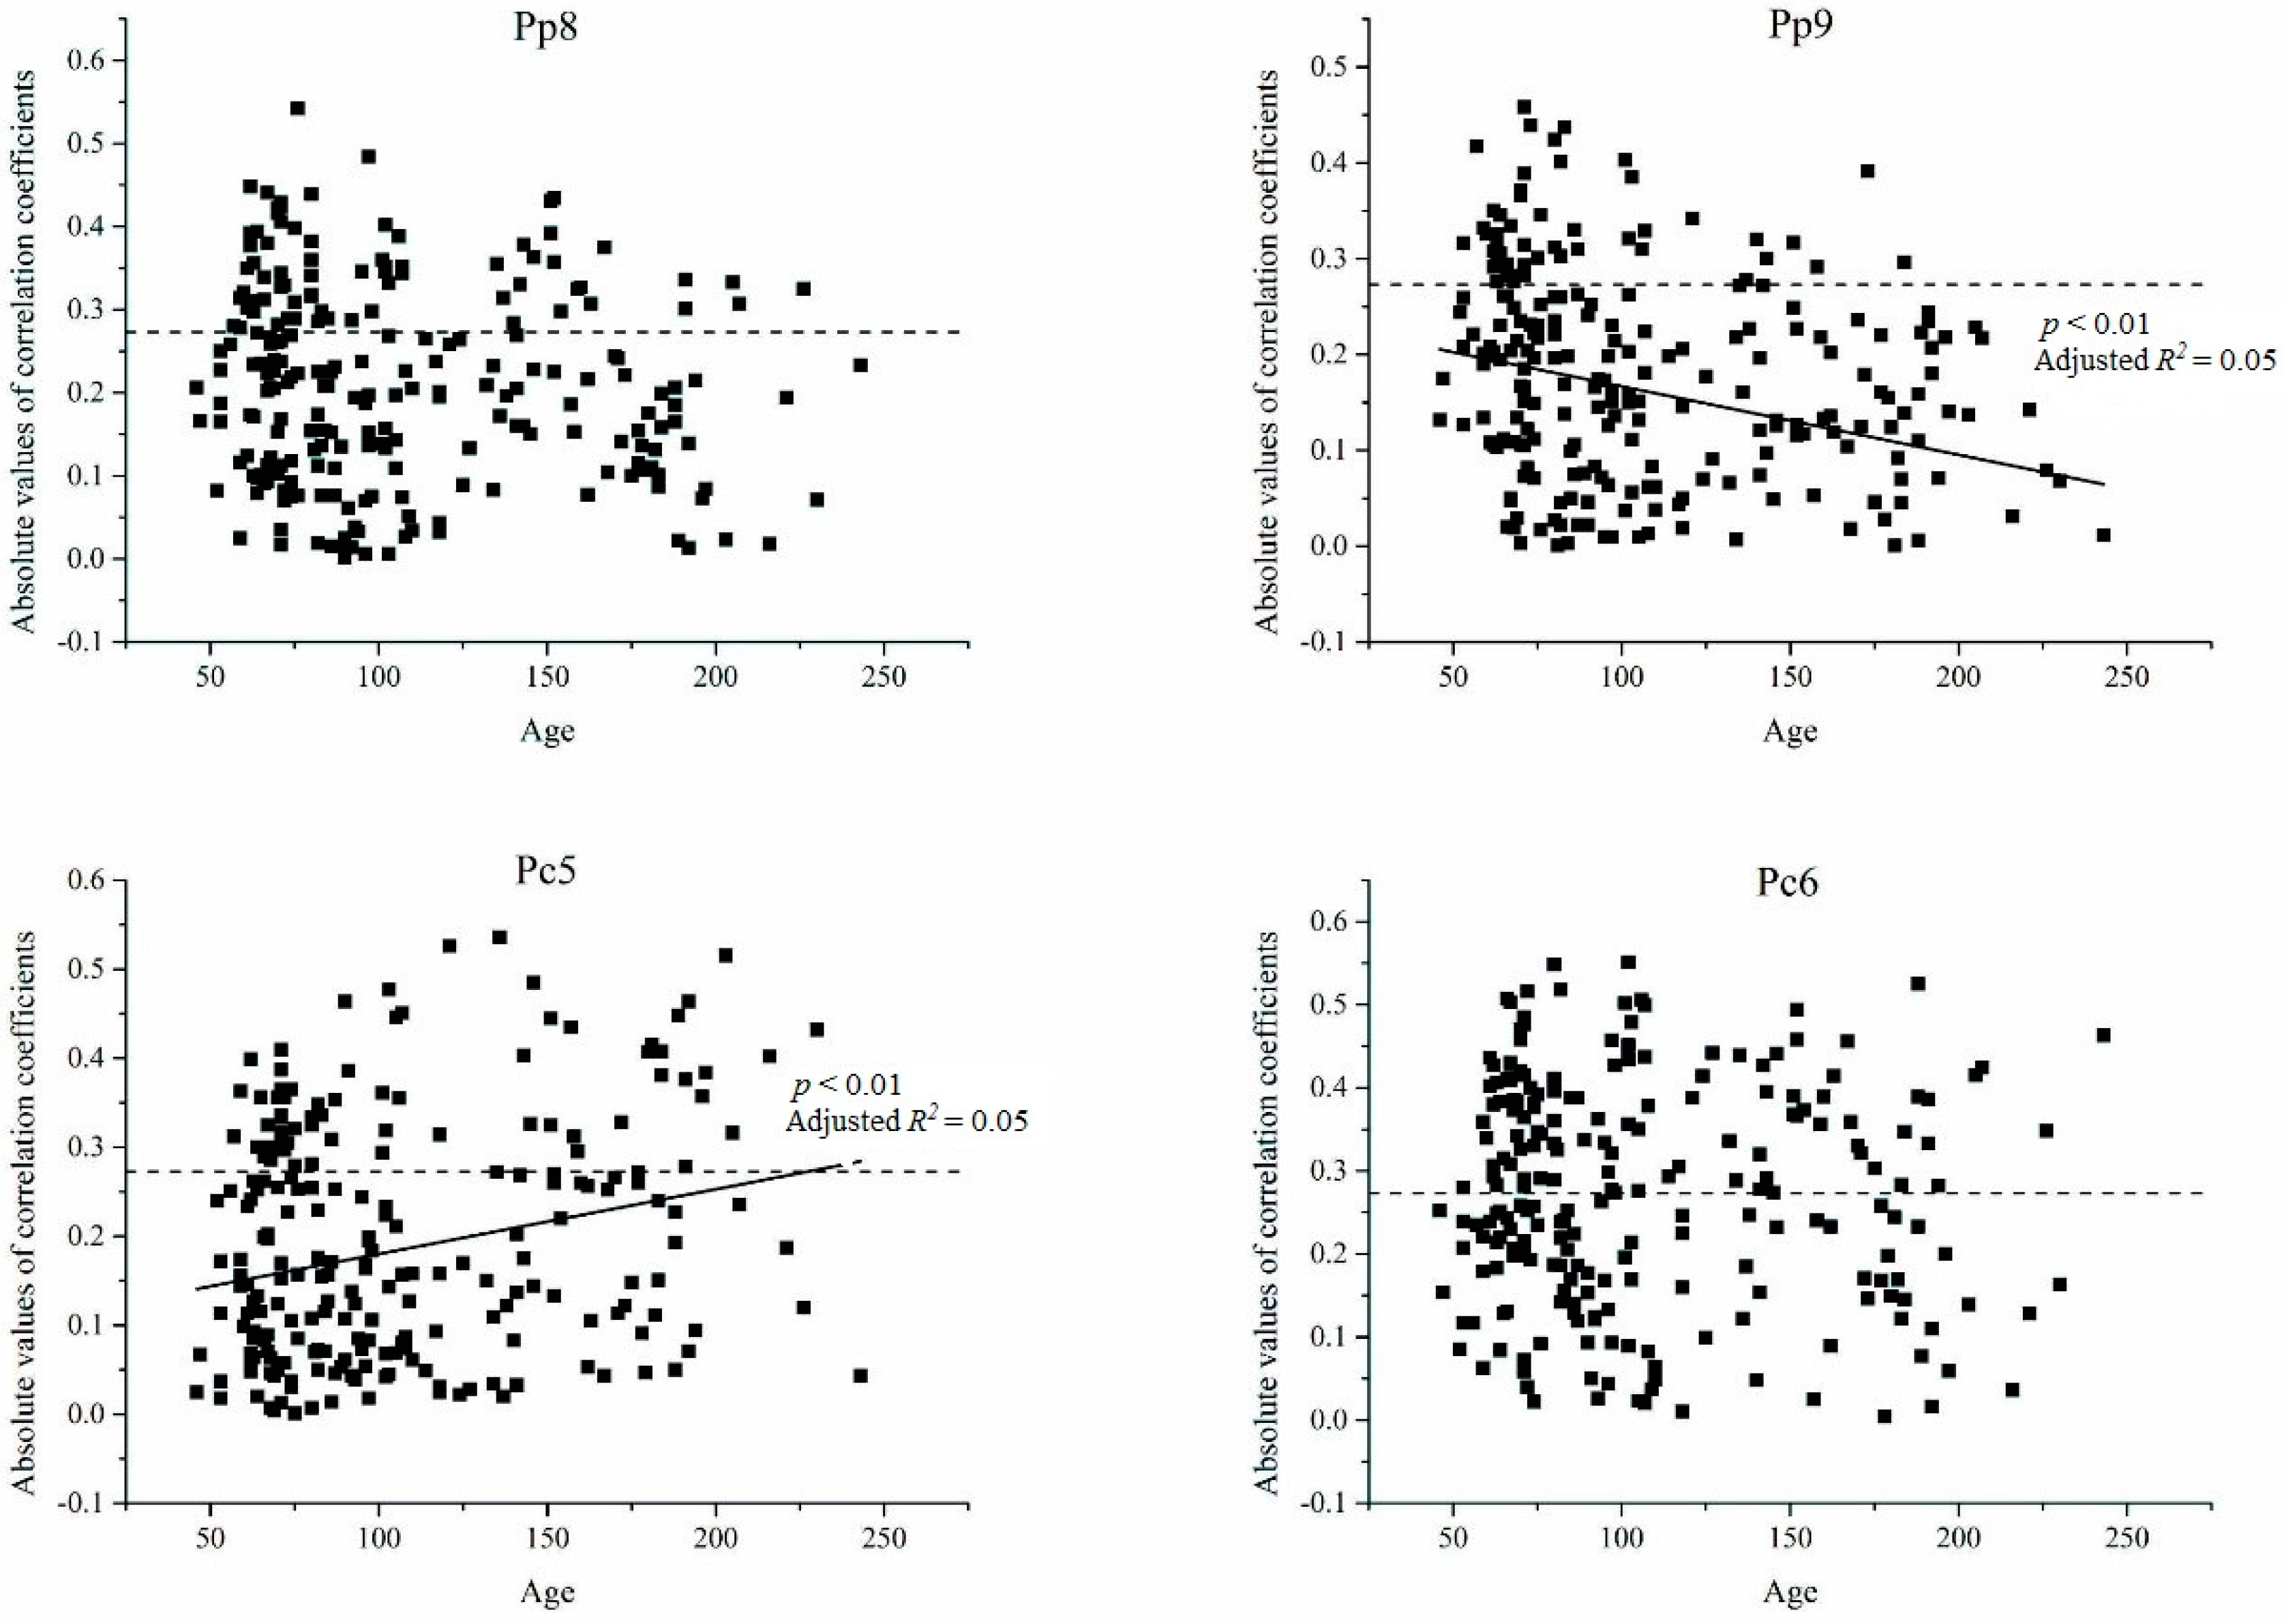
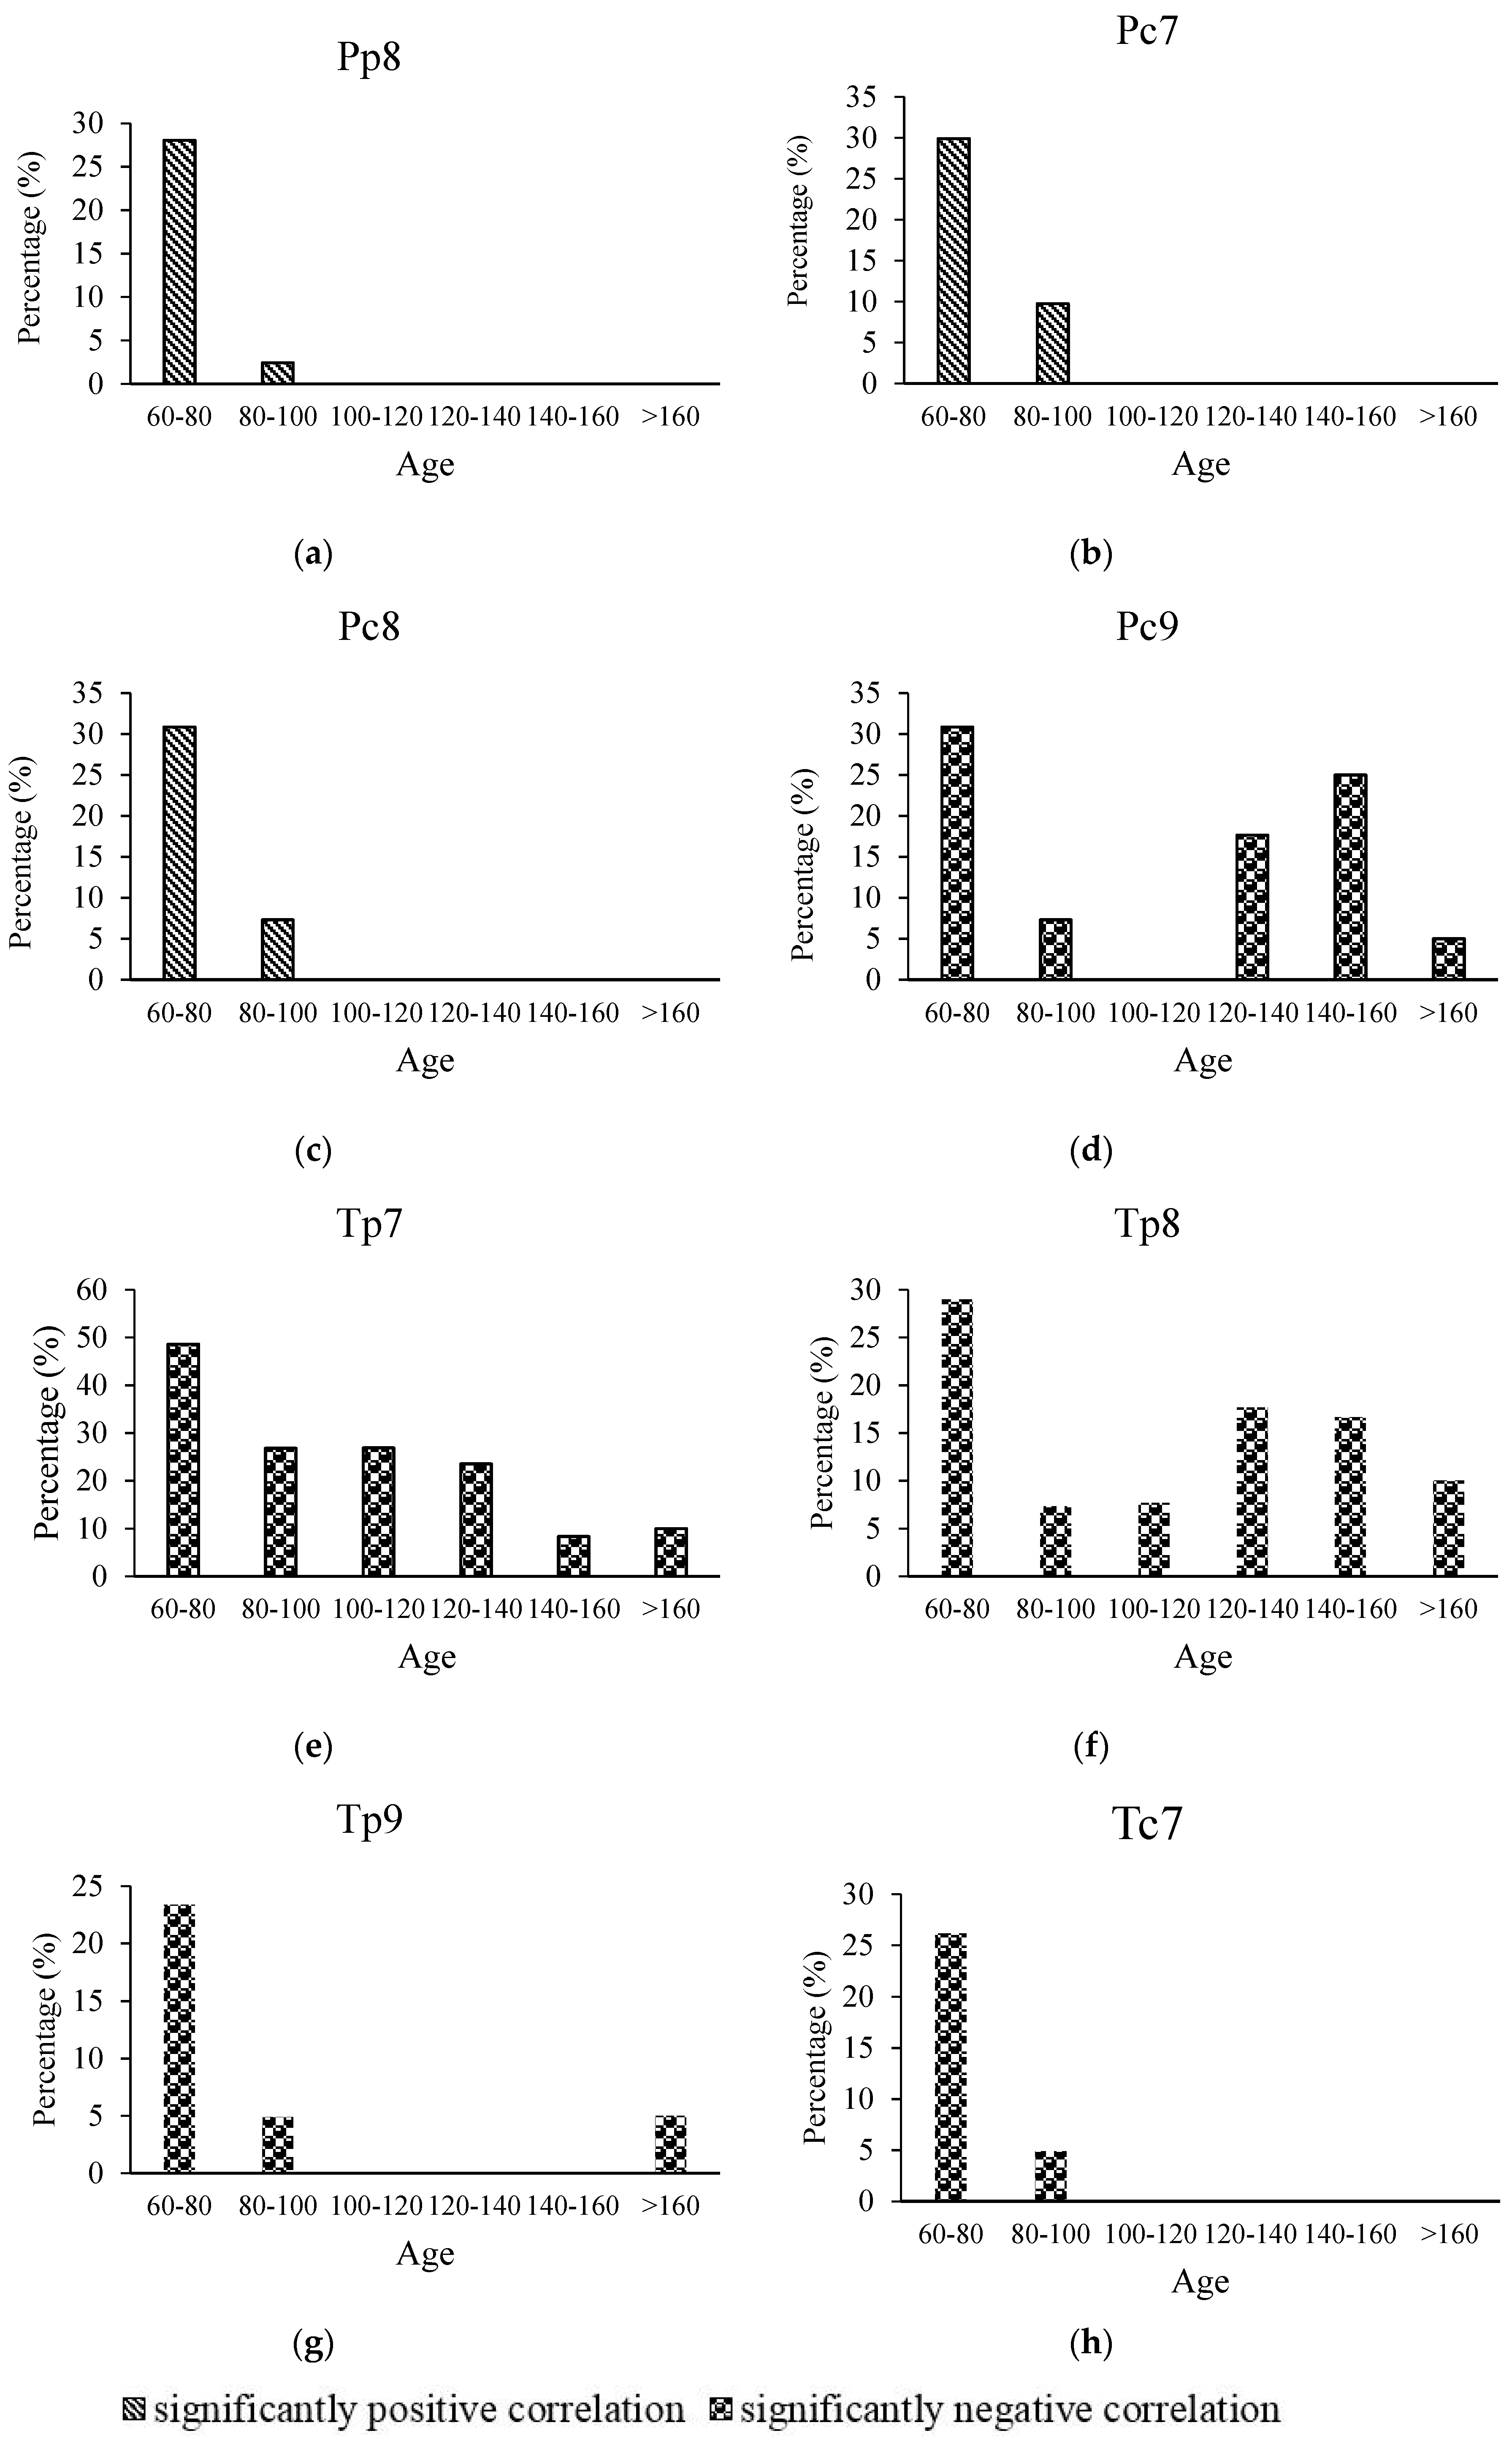
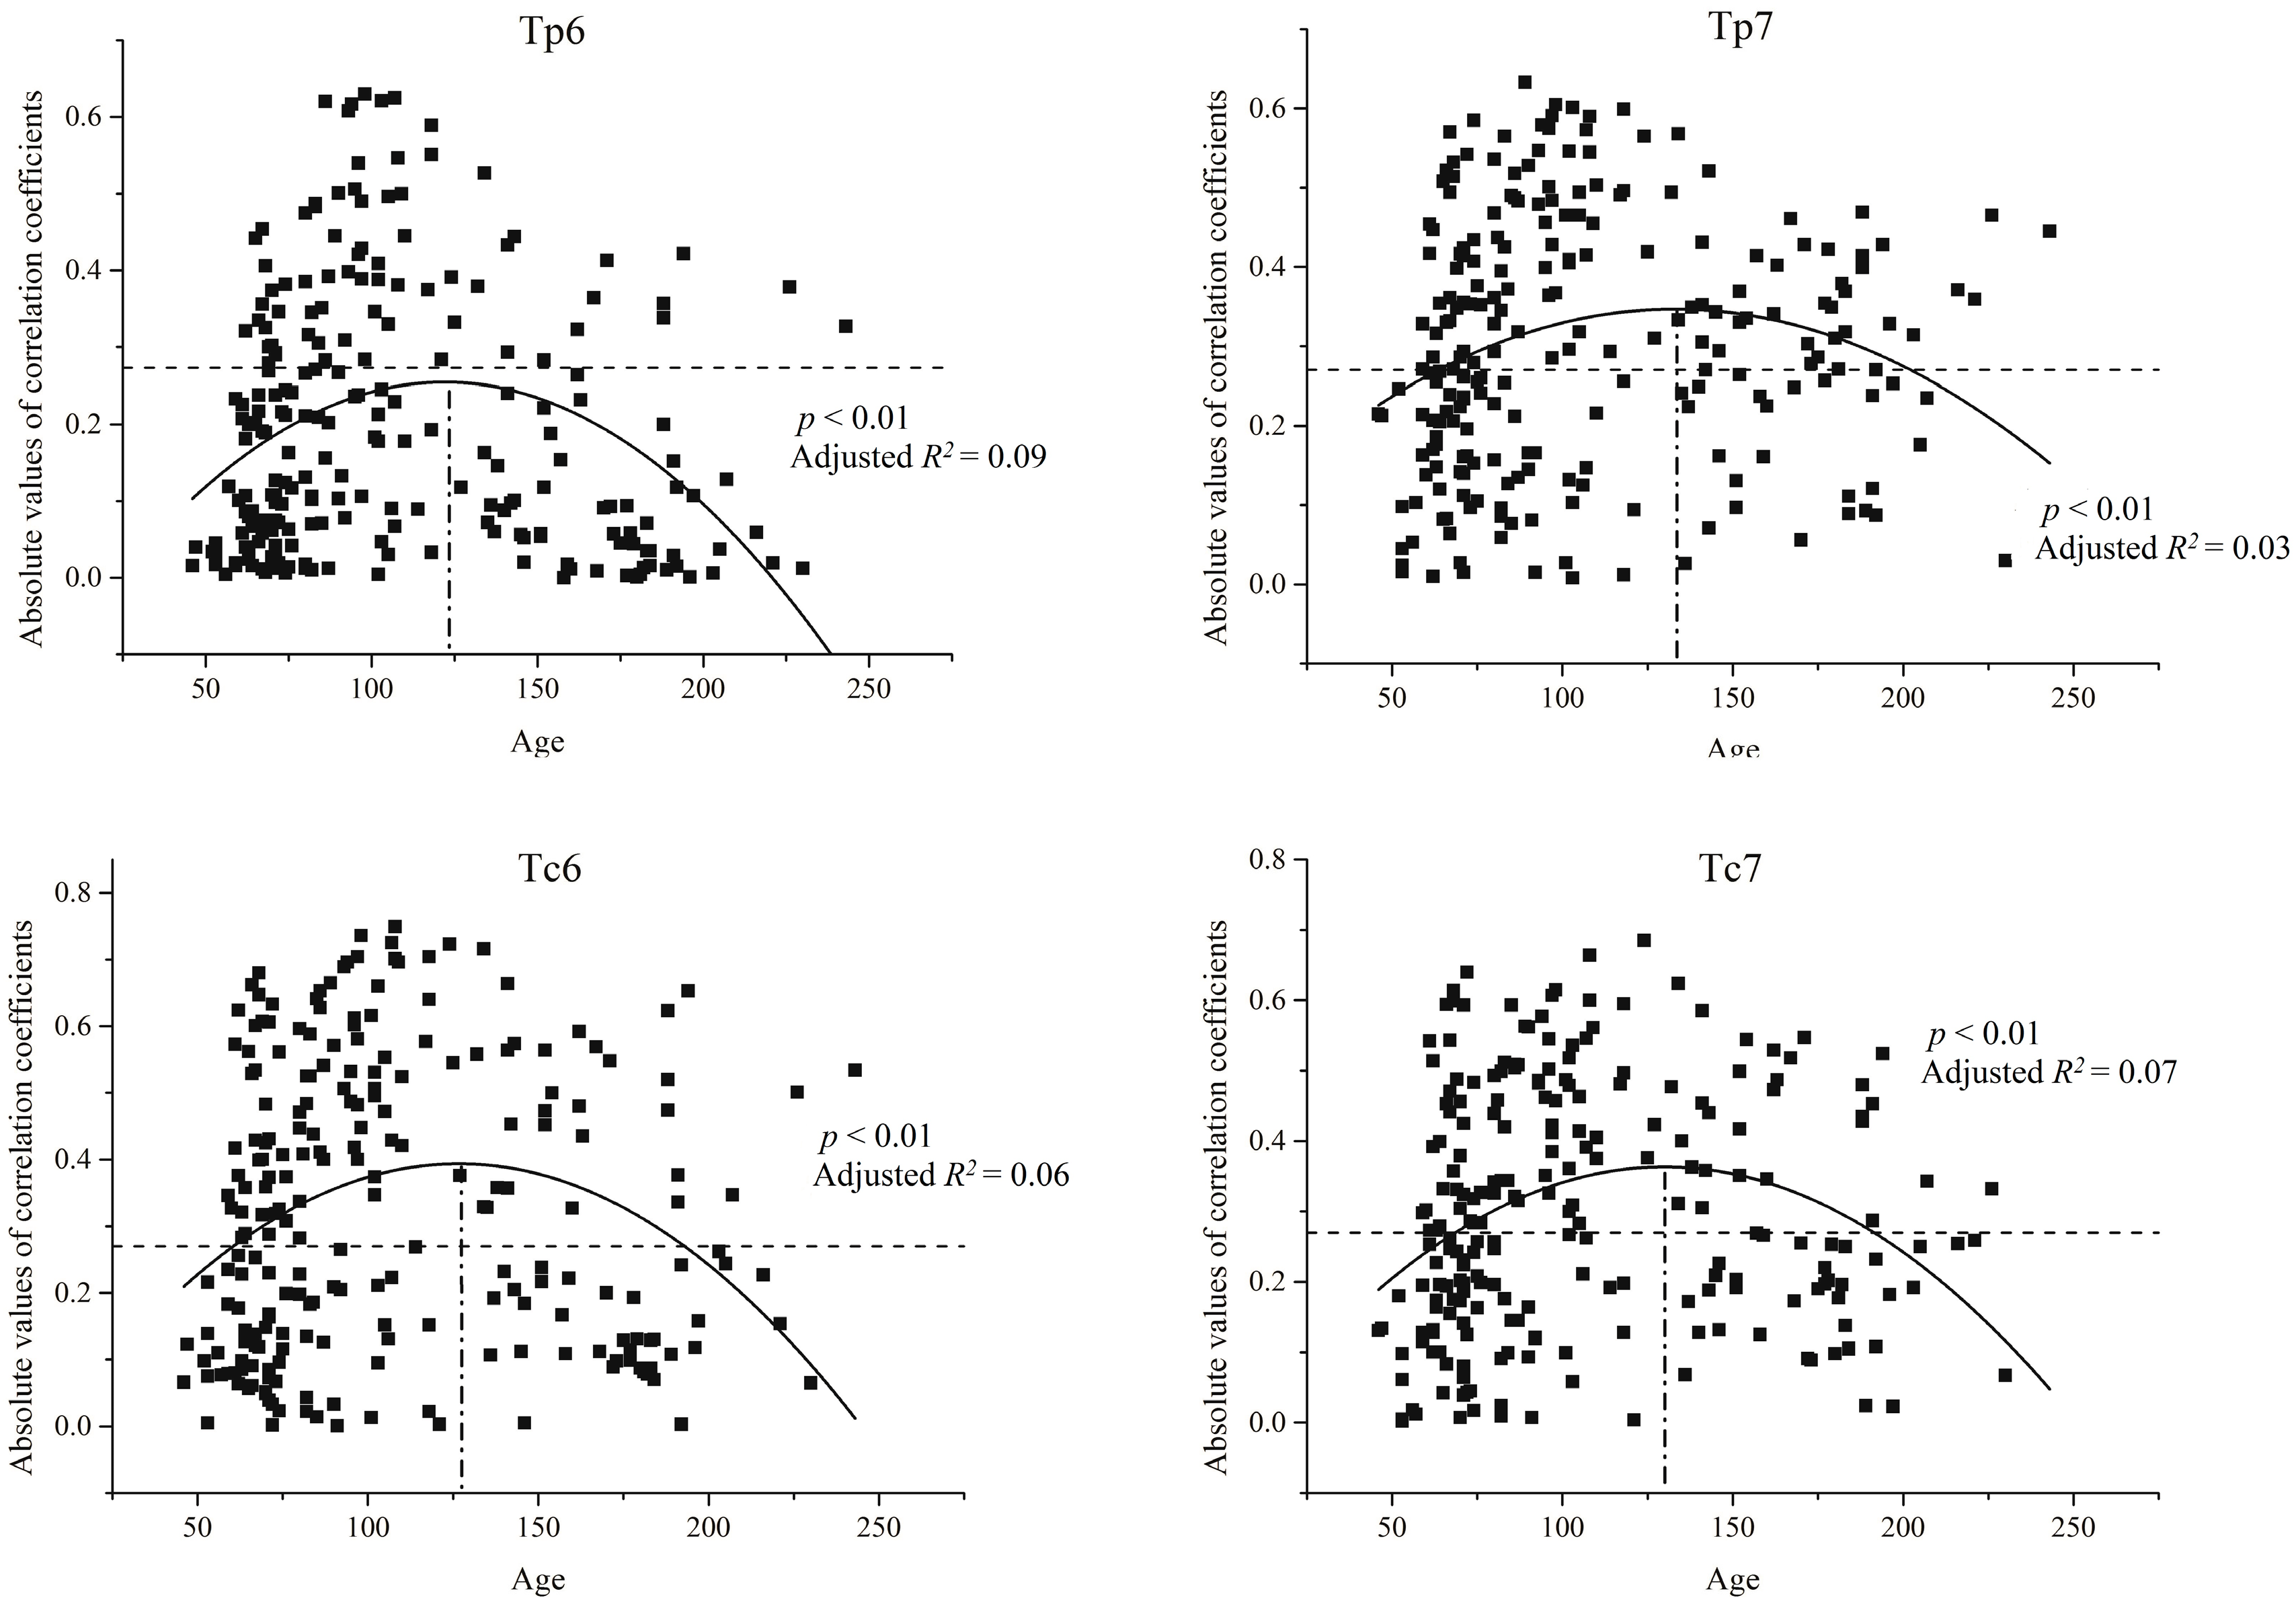
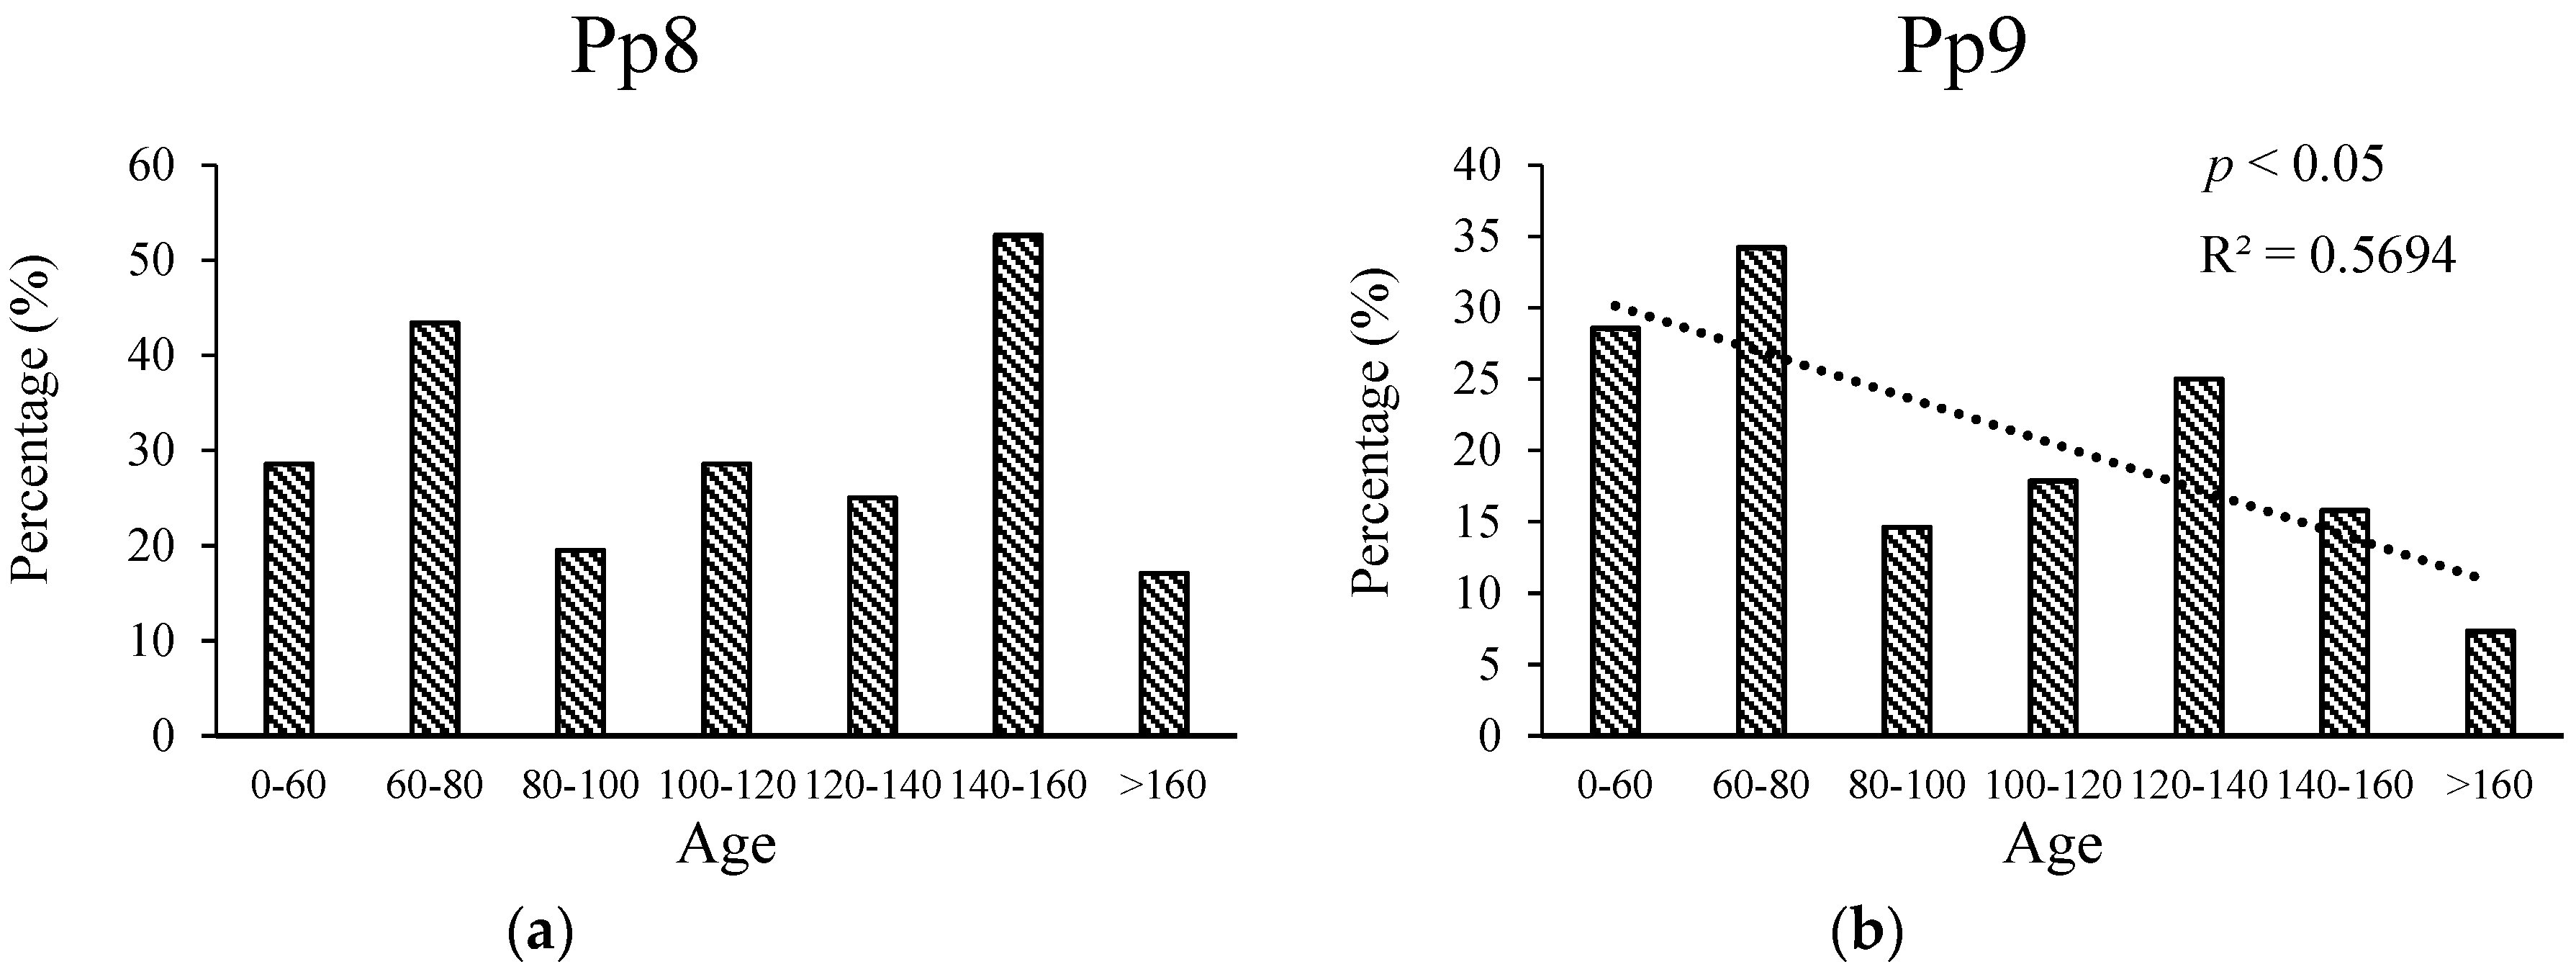
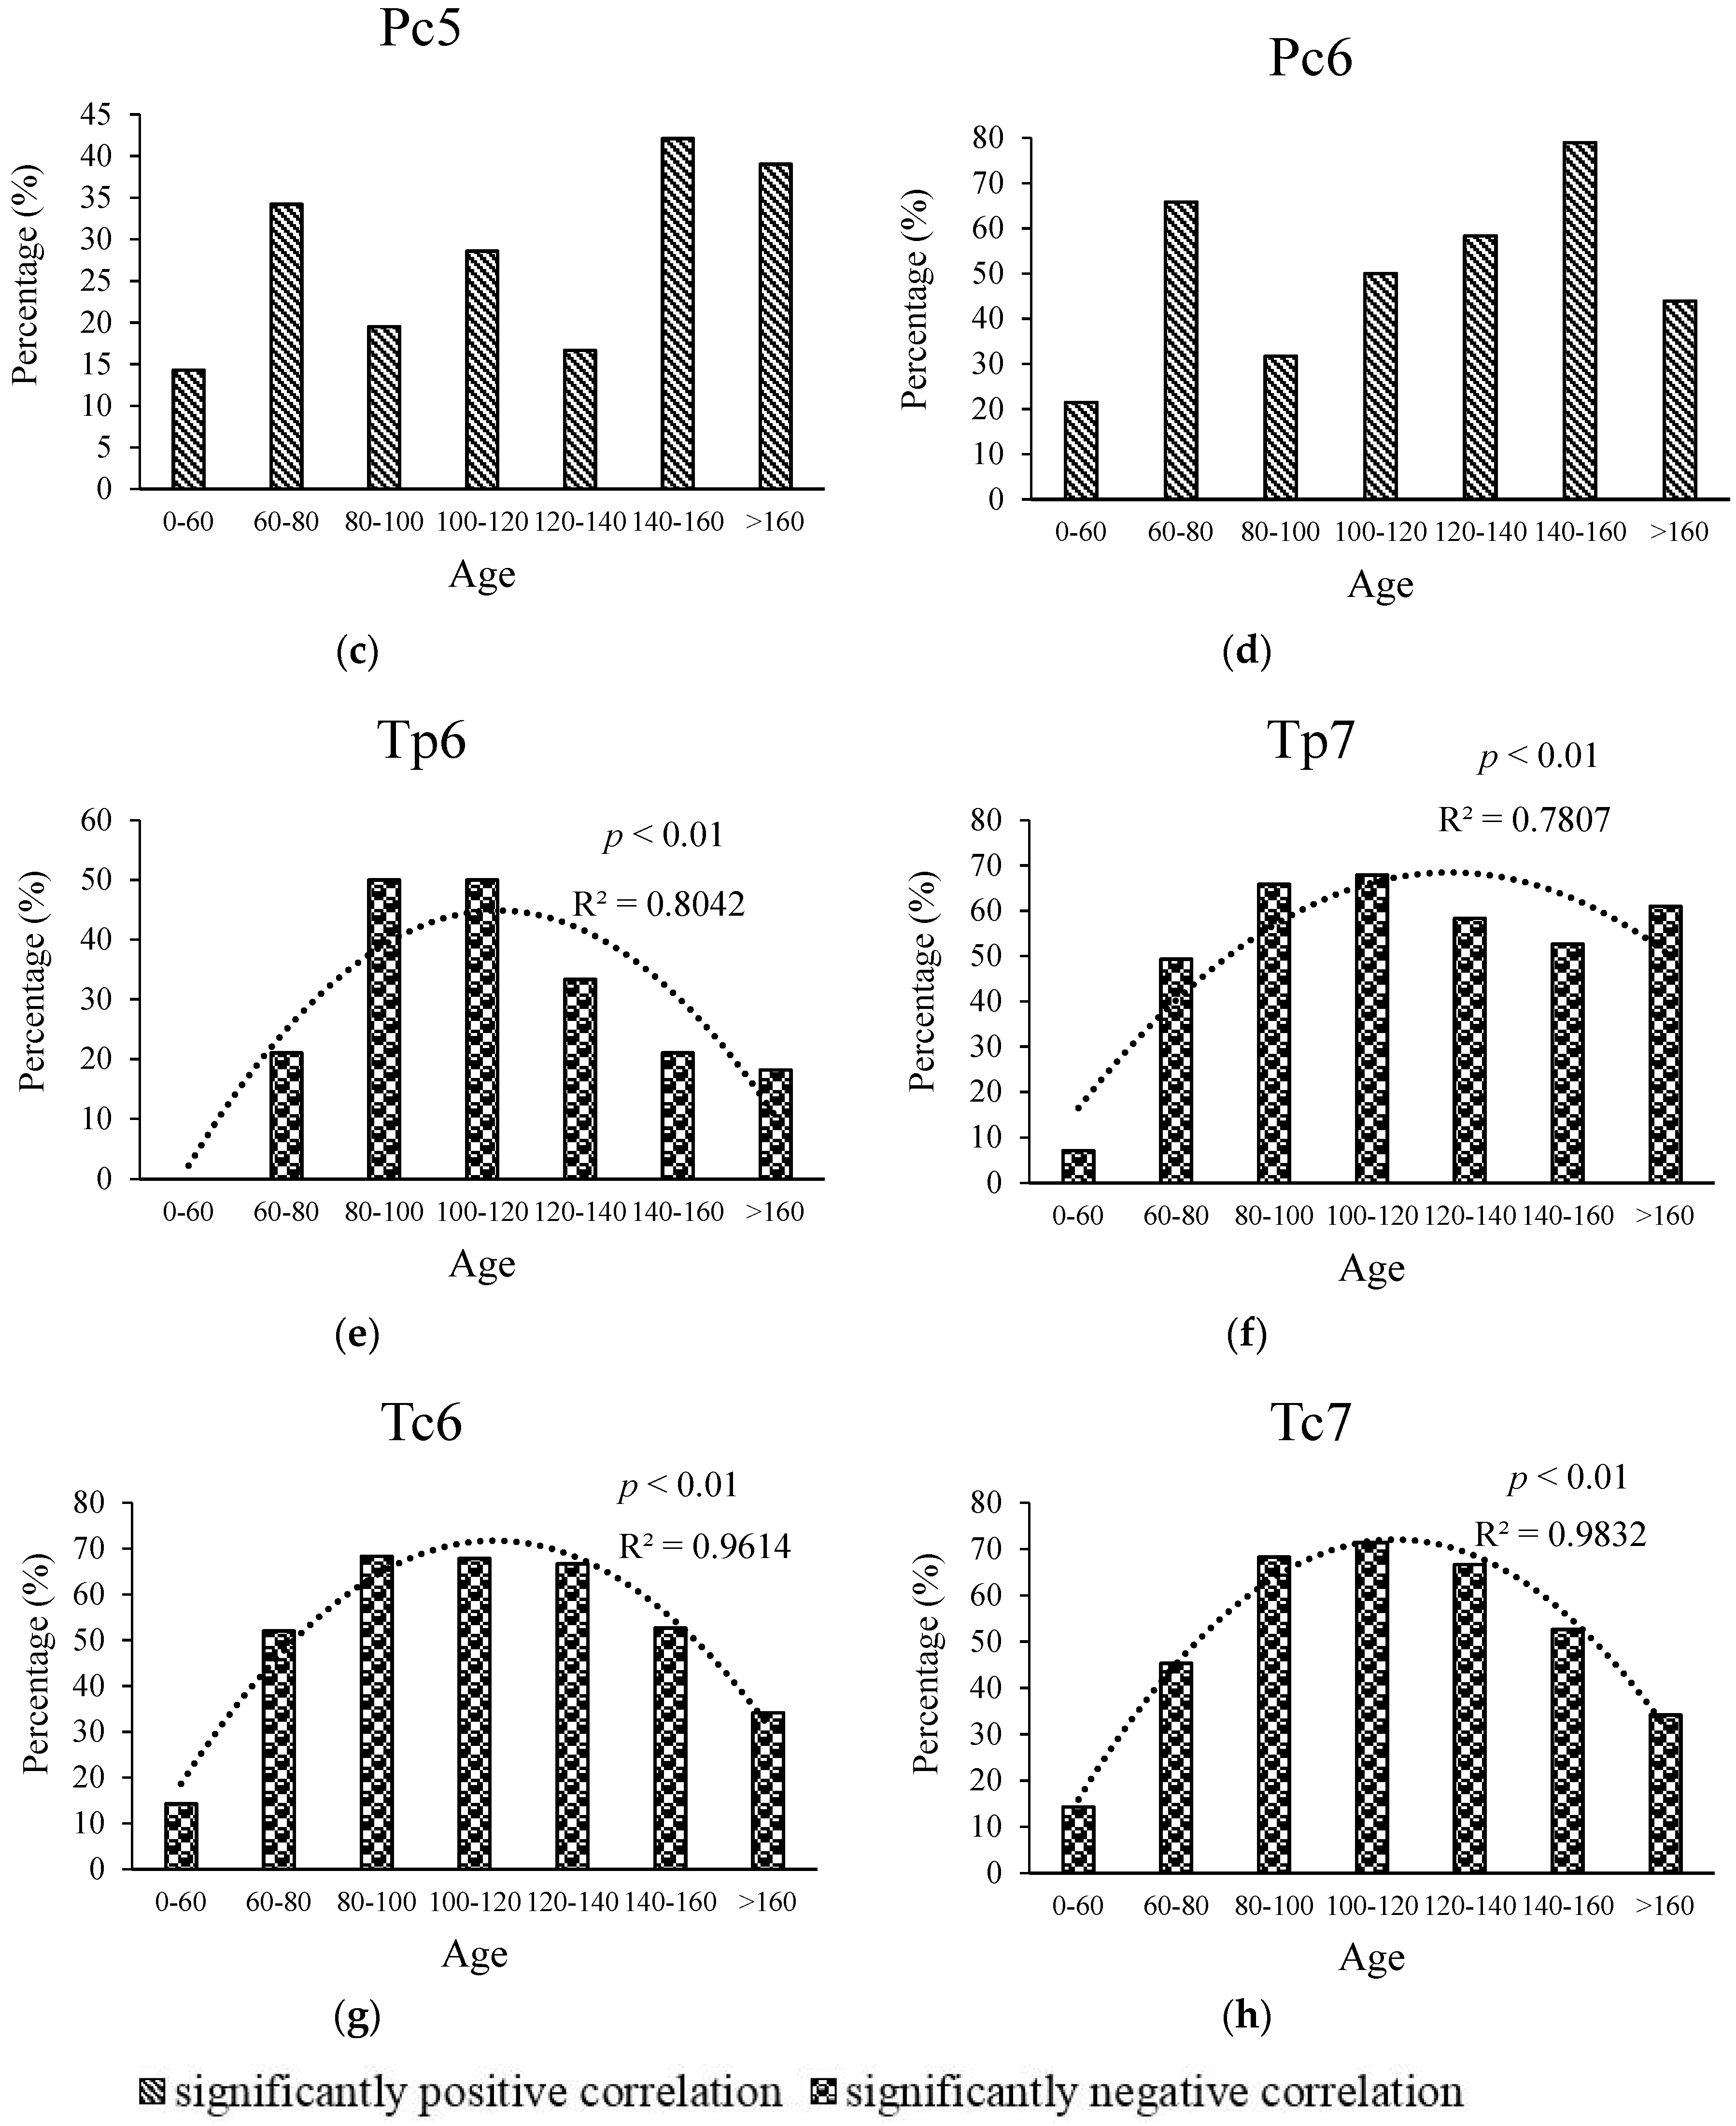
3.3. Relationship between Age and Radial Growth’s Response to Climate in the East and West

In the east, the ages of trees showed negative exponential relationships with the absolute values of correlation coefficients between radial growth and the total monthly precipitation of the previous August and the current July and August (Figure 6 and Table S1). The percentage of significant correlation coefficients between radial growth and climatic factors showed that 28.0% of cores of 60–80 years old showed significant positive correlations with the total precipitation of the previous August, while the percentages of cores in other age groups were very low. The percentages of significant correlation coefficients between radial growth and the total precipitation of the current July and August also showed similar characteristics. The percentage of significant correlation coefficients between radial growth and the total precipitation of the current September was 30.8% for cores of 60–80 years old, which was higher than cores in the other age groups (17.6% for 120–140 years old and 25.0% for 140–160 years old) (Figure 7).
In the east, ages also showed significant exponential relationships with absolute values of correlation coefficients between radial growth and the mean monthly temperature of the previous July and September and the current July (Figure 6 and Table S1). There was no significant relationship between age and absolute values of correlation coefficients with the total precipitation of the current September and mean temperature of the previous August (Figure 6). Forty-eight-point-six percent of cores of 60–80 years old showed significantly negative correlations with the mean temperature of the previous July, 29.0% with the mean temperature of the previous August, 23.4% with the mean temperature of the previous September and 26.2% with the mean temperature of the current July. These percentages of the 60–80-year-old age group were all higher than those of other age groups (Figure 7). All in all, trees younger than 80 years tended to have a stronger positive correlation with precipitation and negative correlation with temperature factors.
In the west, the ages of trees showed significant linear relationships with correlation coefficients between radial growth and the total monthly precipitation of the previous August and September and the current May and June (Table S2). Younger trees showed a stronger positive correlation with the total precipitation of the previous September, while older trees tended to have a stronger positive correlation with that of the current May (Figure 8). Forty-three-point-four percent of cores from 60–80-year-old trees and 52.6% of cores from 140–160-year-old tress showed significantly positive correlations with the total precipitation of the previous August. Thirty-four-point-two percent of cores from 60–80-year-old trees showed significantly positive correlations with the total precipitation of the previous September. Fifty-three-point-eight percent and 46.2% of cores from 140–160-year-old trees showed significantly positive correlations with total precipitation of the current May and June, respectively, and this percentage was the highest compared with the scores of other age groups (Figure 9).
In the west, ages have significant quadratic function relationships with correlation coefficients between radial growth and the mean temperature of the previous June and July and the current June and July. The extremum values of the quadratic polynomial curve fitting the correlation coefficients with the mean temperature of the previous June and July and the current June and July were 129, 137, 129 and 130, respectively (Figure 7). The quadratic polynomial curve fitting showed that the extremum values emerged in the groups of 100–120 and 120–140 years old for the percentages of significant correlation coefficients between growth and the mean temperature of the previous June and the current June and July. Meanwhile, the extremum values emerged in the group of 120–140 years old for the percentages of significant correlation coefficients between growth and the mean temperature of the previous July. All in all, trees from 120–140 years old showed a stronger correlation with the mean temperature factors.

4. Discussion

4.1. Different Response of Radial Growth to Climate in the Different Moisture Environments

The cluster analysis divided all the trees into two groups according to the growth characteristics. TLG1 (Tulugou 1), TLG2 (Tulugou 2), HX1 (Haxi 1), HX2 (Haxi 2) and SDL1 (Sidalong 1) were clustered in the east group. SDL2 (Sidalong 2), HYG1 (Heiyagou 1), HYG2 (Heiyagou 2), HYG3 (Heiyagou 3) and QKD (Qingkedi) were clustered in the west group. The cluster result was in accord with the geographical distribution of the trees. SDL1 and SDL2 were in the climatic transitional zone belonging to the Heihe River basin in the middle of Qilian Mountains [26,27]. There were more precipitation and a lower temperature at SDL1 (3200 m a.s.l.) than those at SDL2 (2649 m a.s.l.) [34]. The climate condition at SDL1 was similar to that in the wetter east region of Qilian Mountains, and the climate at SDL2 was similar to that in the drier west region of Qilian Mountains.
Radial growth in both the east and west showed significant and positive correlations with the total monthly precipitation in the previous and current summer. At the same time, they also negatively correlated with the mean monthly temperature in the previous and current summer. Water deficit could induce stomatal closure, weaken photosynthetic activity, reduce stored carbohydrates and decrease the rate of cambial activity, then causing growth reduction as a result of low precipitation and high temperature in the summer [37]. The water stress in summer was considered to play an important role in influencing radial growth. This seemed to be a common phenomenon for Picea crassifolia in the Qilian Mountains, because other studies in the study area obtained similar results where radial growth was significantly correlated with climatic factors in the previous July and August and the current June–August [25,38,39,40].
Some trees in the study area showed a positive correlation with precipitation in the previous September and a negative correlation with precipitation in the current September. This indicated the different roles of precipitation at the end of the previous and current growing seasons. Stomates of trees remained open, and the rates of transpiration and net photosynthesis were still relatively high in September [41,42]. Cloudy weather accompanied by precipitation could reduce light intensities and lower needle temperature, then weakening photosynthesis, which in part influenced the formation of latewood [43]. It was inferred that increased precipitation from the current September hindered the current radial growth, which reduced the loss of stored carbohydrates and then benefited the growth in the next year. Radial growth in the wetter eastern area showed a more significant negative correlation with precipitation in the current September, and that in the drier western area showed a more significant positive correlation with precipitation in the previous September. Furthermore, radial growth in the west was influenced by precipitation in the early growing season (May and June). To cope with the drought period in summer, trees activate cambial activity and begin tracheid production in the spring and early summer when the water condition is favorable [44]. As a result, precipitation in the early growing season is important to radial growth in the current year. Conifers (e.g., Pinus sylvestris L. and Picea abies (L.) Karst.) in the dry inner Alps also showed significantly positive correlations with the total monthly precipitation in May and June [7,45].
The result of variance analysis also indicated that the mean values of MS and SD in the west were higher than those in the east significantly (Figure 3). This indicated that the relative variability in tree-ring width in the drier area was higher than that in the wetter area. Radial growth in the drier west showed a stronger and more significant correlation with climatic factors than that in the wetter east according to the result of Pearson correlation, including the percentage of significant correlation coefficients. As a result, it could be inferred that radial growth in the drier area may be more sensitive to climate than that in the wetter area. A previous study in central Europe also found that chronologies at the dry sites had higher mean sensitivity values than those at the moist sites, especially those of trees in the dry conditions of the central Alps [7]. Radial growth of Picea glauca (Moench.) Voss in the drier northeastern parts of Alberta (Canada) was also more strongly affected by drought stress [46]. The growth response of Pinus resinosa Ait. to climate was more significant in the dry environment of northwestern Ontario (Canada) than that in northeastern Ontario [47]. The impacts that climate posed on Picea abies showed differences in the drier western and wetter eastern Estonia, because drought-induced physiological stress affected the trees more severely in the western part of the region [48].

4.2. Relationship between Age and Climate Sensitivity of Radial Growth in the Wetter Eastern Area

Chronologies of trees younger than 80 years had higher values of the standard deviation and mean sensitivity than those older than 80 years in the wetter eastern area. Similarly, these younger trees also showed higher correlation coefficients with both the total monthly precipitation and mean monthly temperature than the older ones, especially with climatic factors in the previous and current mid-late summer. Older trees rarely showed significant correlation with climate in the east. These results indicated that younger trees responded more strongly and were more sensitive to climate. This phenomenon may be attributed to the fact that older trees have a lower radial growth rate, which means that their demand for water and other resources was weaker than the younger trees [49]. Moreover, older trees have a more efficient and stronger root system accompanied by a higher water absorption capacity [19]. The moisture in the wetter east was relatively suitable for trees, so only the younger trees having poorer lateral roots suffered from exacerbated water stress, especially during the drier season (i.e., mid-late summer) [14,50].
Picea mariana and Pinus banksiana Lamb. in semi-humid Northern Manitoba, Canada [13], Quercus rubra L. in the humid Ozark and Ouachita Mountains, North America [51], and Quercus alba L. in humid Buffalo Mountain, America [11], all showed that younger trees were more sensitive to climatic factors than the older trees. Studies on Juniperus thurifera in semi-humid north-central Spain implied that the young trees tended to grow more in the favorable conditions of a wet summer and grow less in the unfavorable conditions of a dry summer than the older trees [14]. Abies georgei var. smithii in the semi-humid Sygera Mountains was found to have an earlier onset of xylogenesis, a longer growing season and higher radial growth rates than the older trees [12]. Begum et al. observed a more direct phenomenon, where the cambium of 55-year-old Cryptomeria japonica (L. f.) D. Don produced new cells one week earlier than that of 80-year-old trees after artificial heating, which implied that younger trees respond to temperature changes more sensitively [52]. We inferred that most of the phenomenon that the sensitivity to climate of the younger trees was stronger than the older ones occurred in the relatively humid areas by reviewing the previous relative studies, which was in accordance with our hypothesis.

4.3. Relationship between Age and Climate Sensitivity of Radial Growth in the Drier Western Area

The younger trees showed a stronger sensitivity to the total monthly precipitation in the previous August and September than the older trees in the drier western area, which is similar to the phenomenon in the wetter area. The main reason could be that the older trees developed a more efficient root system to cope with the water stress caused by less precipitation in the late summer and early autumn [14]. In contrast, older trees were more closely correlated with the precipitation in the current May. Rossi et al. [53,54] noticed that the larger diameters and thicker barks of older trees could affect the spring dynamics of stems. The precipitation in May played an important role in the radial growth of older trees, especially for the onset of cell production and differentiation at the beginning of the growing season. The response of Picea abies from a drought-prone mixed-coniferous forest to the current May–June precipitation increased with tree age in the Austrian Alps, which was similar to our result [8].
Chronologies of mature trees (especially trees between 125 and 150 years old) had higher values of the standard deviation and mean sensitivity than trees of other ages. These mature trees also showed higher correlation coefficients with the mean monthly temperature in the previous and current early-middle summer. The reason may be attributed to mature trees with peak wood production coincided with peak leaf area. High temperatures in the summer could cause stomatal closure, lower stomatal conductance and reduce the absorption of carbon dioxide, which weaken the efficiency of photosynthesis [41,55]. Over-mature trees experienced growth decline, defoliation and increased fine-root allocation. The effects of high temperatures in summer on trees older than 150 years were less significant because of the reduced leaf area and photosynthesis [55]. The relationship between age and chronological parameters (Figure 4) and that between age and correlation coefficients with temperature (Figure 7) were similar in the western area. We inferred that radial growth was more influenced by the temperature factors than the precipitation factors in the drier western area.
Studies on Pinus tabulaeformis and Sabina przewalskii in the eastern Qilian Mountains (northwest China) [15] and Pinus koraiensis on the north slope of Changbai Mountain (northeast China) [16] indicated that the chronologies of older trees had higher parameters (e.g., standard deviation and mean sensitivity) and contain more climatic information. A study in the arid region of Kongtong Mountain (northwest China) found that Pinus tabulaeformis and Picea purpurea older than 200 years were more sensitive to temperature in spring and summer than trees younger than 200 years [17]. Sabina przewalskii showed a stronger correlation with spring temperatures along with increasing age, except trees older than 500 years, at the upper tree line of the Qilian Mountains [56]. Picea abies in the Romanian Carpathians [57] and Picea mariana in the Mackenzie and Franklin Mountains (northwest Canada) [58] also showed that older trees were more sensitive to climate. Most of this phenomenon occurred in the relatively dry area, e.g., dry valleys and tree line. There were rarely quadratic relations found between the age and sensitivity of radial growth to climate in other studies. This may be attributed to the fact that some studies did not sample over-mature trees or divided the trees into age groups instead of using the chronology of individual trees.

4.4. Comparison and Future Perspectives

The relationship between age and sensitivity of radial growth to climate in the wetter eastern area showed differences to that in the drier western area. This relationship in the east was simple, and it appeared that younger trees were more sensitive to climate. However, this relationship in the west was complex. There was the monotonic relationship between age and trees’ responses to precipitation and the quadratic relationship between age and the response to temperature. In the context of increasing temperature in northwest China [18,59], the future of forest development in the two different areas would differ based on these different relationships. Only a small part of trees younger than 80 years old showed a significant correlation with climatic factors in the wetter eastern area, so climatic warming may have a limited influence on the tree growth there. In contrast, mature trees in the drier area were more sensitive to temperature and would suffer more from warming. As a result, radial growth and forest productivity may decline there. In forest management, intensive protection should be implemented for the forests at the lower altitudes in the SDL and forests lying to the west of it, especially for mature trees. The different characteristics of relationships between the age and climate sensitivity of radial growth in the wetter and drier area were restricted to the study area in the Qilian Mountains. The discovery of deeper laws about this relationship in different moisture conditions requires further research on different species in more regions having moisture gradients.

5. Conclusions

Picea crassifolia showed significant correlations with similar climatic factors in the wetter eastern area and drier western area of the Qilian Mountains. Tree growth in these areas was mainly affected by the moisture condition in the previous and current summer. However, radial growth in the drier area more strongly correlated with climatic factors than in the wetter area. Moisture differences in the different areas played an important role in influencing the relationship between the age and climate sensitivity of radial growth. In the wetter area, the younger trees showed a stronger response to both precipitation and temperature factors than the older trees. In the drier area, the younger and older trees were more significantly correlated with the precipitation in different months. In contrast, mature trees exhibited a higher correlation with temperature factors than trees of other ages. Under the context of forecasted climate warming, mature trees in the drier area were the most vulnerable to high temperatures, and forests in the drier area should be carefully managed and protected.

Supplementary Materials

The following are available online at https://www.mdpi.com/1999-4907/9/3/135/s1, Table S1: Parameters of the models in the east; Table S2: Parameters of the models in the west.

Acknowledgments

We are grateful to Zhaojiang Hou and Yulu Tian for their help in the fieldwork. This work was supported by the National Science Foundation of China (Nos. 41630750 and 41771051).

Author Contributions

L.Z. and Y.J. were responsible for the research design and coordinating the editing of the paper. Data collection and analysis were partitioned as follows: site inventory and sampling (Y.W., L.J. and S.Z.), tree-ring width measurement (L.Z.) and tree-ring growth and climate relationship analysis (L.Z.). L.Z. and Y.J. contributed to editing and reviewing the manuscript.

Conflicts of Interest

The authors declare no conflict of interest.

References

  1. Elliott, K.J.; Miniat, C.F.; Pederson, N.; Laseter, S.H. Forest tree growth response to hydroclimate variability in the southern Appalachians. Glob. Chang. Biol. 2015, 21, 4627. [Google Scholar] [CrossRef] [PubMed]
  2. Griesbauer, H.P.; Green, D.S. Geographic and temporal patterns in white spruce climate-growth relationships in Yukon, Canada. For. Ecol. Manag. 2012, 267, 215–227. [Google Scholar] [CrossRef]
  3. Suvanto, S.; Nojd, P.; Henttonen, H.M.; Beuker, E.; Makinen, H. Geographical patterns in the radial growth response of Norway spruce provenances to climatic variation. Agric. For. Meteorol. 2016, 222, 10–20. [Google Scholar] [CrossRef]
  4. Lee, E.H.; Beedlow, P.A.; Waschmann, R.S.; Tingey, D.T.; Wickham, C.; Cline, S.; Bollman, M.; Carlile, C. Douglas-fir displays a range of growth responses to temperature, water, and Swiss needle cast in western Oregon, USA. Agric. For. Meteorol. 2016, 221, 176–188. [Google Scholar] [CrossRef]
  5. Liang, E.; Shao, X.M.; Eckstein, D.; Liu, X.H. Spatial variability of tree growth along a latitudinal transect in the Qilian Mountains, northeastern Tibetan Plateau. Can. J. For. Res. 2010, 40, 200–211. [Google Scholar] [CrossRef]
  6. Raney, P.A.; Leopold, D.J.; Dovciak, M.; Beier, C.M. Hydrologic position mediates sensitivity of tree growth to climate: Groundwater subsidies provide a thermal buffer effect in wetlands. For. Ecol. Manag. 2016, 379, 70–80. [Google Scholar] [CrossRef]
  7. Levesque, M.; Rigling, A.; Bugmann, H.; Weber, P.; Brang, P. Growth response of five co-occurring conifers to drought across a wide climatic gradient in Central Europe. Agric. For. Meteorol. 2014, 197, 1–12. [Google Scholar] [CrossRef]
  8. Schuster, R.; Oberhuber, W. Age-dependent climate-growth relationships and regeneration of Picea abies in a drought-prone mixed-coniferous forest in the Alps. Can. J. For. Res. 2013, 43, 609–618. [Google Scholar] [CrossRef] [PubMed]
  9. Voelker, S.L. Age-dependent changes in environmental influences on tree growth and their implications for forest responses to climate change. Tree Physiol. 2011, 4, 455–479. [Google Scholar] [CrossRef]
  10. Wu, G.J.; Xu, G.B.; Chen, T.; Liu, X.H.; Zhang, Y.F.; An, W.L.; Wang, W.Z.; Fang, Z.A.; Yu, S.L. Age-dependent tree-ring growth responses of Schrenk spruce (Picea schrenkiana) to climate-A case study in the Tianshan Mountain, China. Dendrochronologia 2013, 31, 318–326. [Google Scholar] [CrossRef]
  11. Copenheaver, C.A.; Crawford, C.J.; Fearer, T.M. Age-specific responses to climate identified in the growth of Quercus alba. Trees-Struct. Funct. 2011, 25, 647–653. [Google Scholar] [CrossRef]
  12. Li, X.; Liang, E.; Gričar, J.; Prislan, P.; Rossi, S.; Čufar, K. Age dependence of xylogenesis and its climatic sensitivity in Smith fir on the south-eastern Tibetan Plateau. Tree Physiol. 2013, 33, 48–56. [Google Scholar] [CrossRef] [PubMed]
  13. McMillan, A.M.S.; Winston, G.C.; Goulden, M.L. Age-dependent response of boreal forest to temperature and rainfall variability. Glob. Chang. Biol. 2008, 14, 1904–1916. [Google Scholar] [CrossRef]
  14. Rozas, V.; DeSoto, L.; Olano, J.M. Sex-specific, age-dependent sensitivity of tree-ring growth to climate in the dioecious tree Juniperus thurifera. New Phytol. 2009, 182, 687–697. [Google Scholar] [CrossRef] [PubMed]
  15. Zhang, F.; Gou, X.; Liu, W.; Levia, D.F.; Li, Y. Individual and time-varying tree-ring growth to climate sensitivity of Pinus tabuliformis Carr. and Sabina przewalskii Kom. in the eastern Qilian Mountains, China. Trees-Struct. Funct. 2013, 27, 359–370. [Google Scholar] [CrossRef]
  16. Wang, X.; Zhao, X.; Gao, L. Age-dependent growth responses of Pinus koraiensis to climate in the north slope of Changbai Mountain, North-Eastern China. Acta Ecol. Sin. 2011, 31, 6378–6387. (In Chinese) [Google Scholar]
  17. Fang, K.Y.; Chen, D.; Gou, X.H.; D’Arrigo, R.; Davi, N. Influence of non-climatic factors on the relationships between tree growth and climate over the Chinese Loess Plateau. Glob. Planet Chang. 2015, 132, 54–63. [Google Scholar] [CrossRef]
  18. Liu, Z.Y.; Zhou, P.; Zhang, F.Q.; Liu, X.D.; Chen, G. Spatiotemporal characteristics of dryness/wetness conditions across Qinghai Province, Northwest China. Agric. For. Meteorol. 2013, 182, 101–108. [Google Scholar] [CrossRef]
  19. Liu, X.C. Picea Crassifolia; Lanzhou University Press: Lanzhou, China, 1992; pp. 13–15. (In Chinese) [Google Scholar]
  20. He, Z.B.; Zhao, W.Z.; Liu, H.; Zhang, Z.H. Successional process of Picea crassifolia forest after logging disturbance in semiarid mountains: A case study in the Qilian Mountains, northwestern China. For. Ecol. Manag. 2010, 260, 396–402. [Google Scholar] [CrossRef]
  21. Zhang, Y.X.; Wilmking, M. Divergent growth responses and increasing temperature limitation of Qinghai spruce growth along an elevation gradient at the northeast Tibet Plateau. For. Ecol. Manag. 2010, 260, 1076–1082. [Google Scholar] [CrossRef]
  22. Liang, E.Y.; Leuschner, C.; Dulamsuren, C.; Wagner, B.; Hauck, M. Global warming-related tree growth decline and mortality on the north-eastern Tibetan plateau. Clim. Chang. 2016, 134, 163–176. [Google Scholar] [CrossRef]
  23. Galván, J.D.; Camarero, J.J.; Gutiérrez, E. Seeing the trees for the forest: Drivers of individual growth responses to climate in Pinus uncinata mountain forests. J. Ecol. 2014, 102, 1244–1257. [Google Scholar] [CrossRef]
  24. Rozas, V. Individual-based approach as a useful tool to disentangle the relative importance of tree age, size and inter-tree competition in dendroclimatic studies. iForest 2015, 8, 187–194. [Google Scholar] [CrossRef]
  25. Liang, E.Y.; Shao, X.M.; Eckstein, D.; Huang, L.; Liu, X.H. Topography- and species-dependent growth responses of Sabina przewalskii and Picea crassifolia to climate on the northeast Tibetan Plateau. For. Ecol. Manag. 2006, 236, 268–277. [Google Scholar] [CrossRef]
  26. Li, D.L.; Liu, D.X. Climate in Gansu; China Meteorological Press: Beijing, China, 2000; pp. 7–9. [Google Scholar]
  27. Tang, X.; Sun, G.W.; Qian, W.H. Study on the Northernmost Boundary of East-Asian Summer Monsoon; China Meteorological Press: Beijing, China, 2007; pp. 9–11. [Google Scholar]
  28. Fritts, H. Tree Rings and Climate; Elsevier: Amsterdam, The Netherlands, 2012; pp. 21–25. [Google Scholar]
  29. Cook, E.R.; Kairiukstis, L.A. Methods of Dendrochronology: Applications in the Environmental Sciences; Springer: Berlin, Germany, 1990; pp. 18–21. [Google Scholar]
  30. Rinn, F. TSAPWin: Time Series Analysis and Presentation for Dendrochronology and Related Applications; Rinn Tech: Heidelberg, Germany, 2003. [Google Scholar]
  31. Holmes, R.L. Computer-assisted quality control in tree-ring dating and measurement. Tree-Ring Bull. 1983, 43, 69–78. [Google Scholar]
  32. Cook, E.R. A Time Series Analysis Approach to Tree Ring Standardization. Ph.D. Thesis, The University of Arizona, Tucson, AZ, USA, 1985. [Google Scholar]
  33. Rahman, M.R.; Lateh, H. Spatio-temporal analysis of warming in Bangladesh using recent observed temperature data and GIS. Clim. Dyn. 2015, 46, 2943–2960. [Google Scholar] [CrossRef]
  34. Zhang, L.N.; Jiang, Y.; Zhao, S.D.; Kang, X.Y.; Zhang, W.T.; Liu, T. Lingering response of radial growth of Picea crassifolia to climate at different altitudes in the Qilian Mountains, Northwest China. Trees-Struct. Funct. 2016, 31, 455–465. [Google Scholar] [CrossRef]
  35. Applequist, M.B. A Simple Pith Locator for Use with Off-Center Increment Cores. J. For. Res. 1958, 56, 141. [Google Scholar]
  36. Bigler, C.; Veblen, T.T. Increased early growth rates decrease longevities of conifers in subalpine forests. Oikos 2009, 118, 1130–1138. [Google Scholar] [CrossRef]
  37. Fritts, H.C. Growth-rings of trees: Their correlation with climate. Science 1966, 154, 973–979. [Google Scholar] [CrossRef] [PubMed]
  38. Liang, E.Y.; Shao, X.M.; Liu, X.H. Annual precipitation variation inferred from tree rings since AD 1770 for the western Qilian Mts., northern Tibetan Plateau. Tree-Ring Res. 2009, 65, 95–103. [Google Scholar] [CrossRef]
  39. Gao, L.L.; Gou, X.H.; Deng, Y.; Yang, M.X.; Zhao, Z.Q.; Cao, Z.Y. Dendroclimatic Response of Picea crassifolia along an Altitudinal Gradient in the Eastern Qilian Mountains, Northwest China. Arct. Antarct. Alp. Res. 2013, 45, 491–499. [Google Scholar] [CrossRef]
  40. Chen, F.; Yuan, Y.J.; Wei, W.S.; Zhang, R.B.; Yu, S.L.; Shang, H.M.; Zhang, T.W.; Qin, L.; Wang, H.Q.; Chen, F.H. Tree-ring-based annual precipitation reconstruction for the Hexi Corridor, NW China: Consequences for climate history on and beyond the mid-latitude Asian continent. Boreas 2013, 42, 1008–1021. [Google Scholar] [CrossRef]
  41. Zhao, C.; Chen, L.; Ma, F.; Yao, B.; Liu, J. Altitudinal differences in the leaf fitness of juvenile and mature alpine spruce trees (Picea crassifolia). Tree Physiol. 2008, 28, 133–141. [Google Scholar] [CrossRef] [PubMed]
  42. Luo, J.; Zang, R.; Li, C. Physiological and morphological variations of Picea asperata populations originating from different altitudes in the mountains of southwestern China. For. Ecol. Manag. 2006, 221, 285–290. [Google Scholar] [CrossRef]
  43. Brown, J.M. Photosynthetic Regime of Some Southern Arizona Ponderosa Pine. Ph.D. Thesis, University of Arizona, Tucson, AZ, USA, 1968. [Google Scholar]
  44. Wang, W.B.; Zhang, F.; Yuan, L.; Wang, Q.T.; Zheng, K.; Zhao, C.Z. Environmental factors effect on stem radial variations of Picea crassifolia in Qilian Mountains, Northwestern China. Forests 2016, 7, 210. [Google Scholar] [CrossRef]
  45. Schuster, R.; Oberhuber, W. Drought sensitivity of three co-occurring conifers within a dry inner Alpine environment. Trees-Struct. Funct. 2013, 27, 61–69. [Google Scholar] [CrossRef] [PubMed]
  46. Jiang, X.; Huang, J.-G.; Stadt, K.J.; Comeau, P.G.; Chen, H.Y.H. Spatial climate-dependent growth response of boreal mixedwood forest in western Canada. Glob. Planet Chang. 2016, 139, 141–150. [Google Scholar] [CrossRef]
  47. Ashiq, M.W.; Anand, M. Spatial and temporal variability in dendroclimatic growth response of red pine (Pinus resinosa Ait.) to climate in northern Ontario, Canada. For. Ecol. Manag. 2016, 372, 109–119. [Google Scholar] [CrossRef]
  48. Helama, S.; Laanelaid, A.; Bijak, S.; Jaagus, J. Contrasting tree-ring growth response of Picea abies to climate variability in western and eastern Estonia. Geogr. Ann. A 2016, 98, 155–167. [Google Scholar] [CrossRef]
  49. Carrer, M.; Urbinati, C. Age-dependent tree-ring growth responses to climate in Larix decidua and Pinus cembra. Ecology 2004, 85, 730–740. [Google Scholar] [CrossRef]
  50. Schenk, H.J.; Jackson, R.B. Rooting depths, lateral root spreads and below-ground/above-ground allometries of plants in water-limited ecosystems. J. Ecol. 2002, 90, 480–494. [Google Scholar] [CrossRef]
  51. Haavikl, J.; Stahled, W.; Stephenf, M. Temporal aspects of Quercus rubra decline and relationship to climate in the Ozark and Ouachita Mountains, Arkansas. Can. J. For. Res. 2011, 41, 773–781. [Google Scholar] [CrossRef]
  52. Begum, S.; Nakaba, S.; Oribe, Y.; Kubo, T.; Funada, R. Cambial sensitivity to rising temperatures by natural condition and artificial heating from late winter to early spring in the evergreen conifer Cryptomeria japonica. Trees-Struct. Funct. 2010, 24, 43–52. [Google Scholar] [CrossRef]
  53. Rossi, S.; Deslauriers, A.; Anfodillo, T.; Carrer, M. Age-dependent xylogenesis in timberline conifers. New Phytol. 2008, 177, 199–208. [Google Scholar] [CrossRef] [PubMed]
  54. Rossi, S.; Deslauriers, A.; Griçar, J.; Seo, J.W.; Rathgeber, C.B.; Anfodillo, T.; Morin, H.; Levanic, T.; Oven, P.; Jalkanen, R. Critical temperatures for xylogenesis in conifers of cold climates. Glob. Ecol. Biogeogr. 2008, 17, 696–707. [Google Scholar] [CrossRef]
  55. Moreno-Gutiérrez, C.; Battipaglia, G.; Cherubini, P.; Huertas, A.D.; Querejeta, J.I. Pine afforestation decreases the long-term performance of understorey shrubs in a semi-arid Mediterranean ecosystem: A stable isotope approach. Funct. Ecol. 2014, 29, 19–25. [Google Scholar] [CrossRef]
  56. Yu, G.; Liu, Y.; Wang, X.; Ma, K. Age-dependent tree-ring growth responses to climate in Qilian juniper (Sabina przewalskii Kom.). Trees-Struct. Funct. 2008, 22, 197–204. [Google Scholar] [CrossRef]
  57. Primicia, I.; Camarero, J.J.; Janda, P.; Čada, V.; Morrissey, R.C.; Trotsiuk, V.; Bače, R.; Teodosiu, M.; Svoboda, M. Age, competition, disturbance and elevation effects on tree and stand growth response of primary Picea abies forest to climate. For. Ecol. Manag. 2015, 354, 77–86. [Google Scholar] [CrossRef]
  58. Macdonald, G.M.; Szeicz, J.M. Age dependent tree ring growth response of subarctic white spruce to climate. Can. J. For. Res. 1994, 24, 120–132. [Google Scholar] [CrossRef]
  59. Intergovernmental Panel on Climate Change. Climate Change 2013: The Physical Science Basis: Contribution of Working Group I to the Fifth Assessment Report of the Intergovernmental Panel on Climate Change; Cambridge University Press: Cambridge, UK, 2013. [Google Scholar]
Figure 1. Sampling sites of tree-ring and meteorological stations in the Qilian Mountains.
Forests 09 00135 g001
Figure 2. Monthly climate for the meteorological stations at Minhe, Wuwei, Zhangye, Jiuquan (lower altitudes) and Wushaoling, Yeniugou, Sunan and Tuole (higher altitudes) from east to west in the Qilian Mountains (1959–2013).
Forests 09 00135 g002
Figure 3. Standard deviation (SD) and mean sensitivity (MS) of chronologies of the east and west group. Average value of mean sensitivity and standard deviation labeled with different letters differed significantly between the two groups (p < 0.05, ANOVA).
Forests 09 00135 g003
Figure 4. Relationship between age and standard deviation (a,c) and mean sensitivity (b,d) of chronology from each core in the east (a,b) and west (c,d) fitted with the quadratic polynomial curve. The dashed-dotted line indicates the extremum of the curve.
Forests 09 00135 g004
Figure 5. Pearson correlation coefficients between chronologies of the cores and climatic factors in the east (a,b) and west (c,d). P indicates total monthly precipitation; T indicates mean monthly temperature; p represents months of the previous year; and c represents months of the current year. The percentage indicates the proportion of significant and insignificant correlation coefficients.
Forests 09 00135 g005aForests 09 00135 g005b
Figure 6. Relationships between age and radial growth’s correlation coefficients with climate in the east. P indicates total monthly precipitation; T indicates mean monthly temperature; p represents months of the previous year; and c represents months of the current year. The dashed lines indicate a significance level of 0.05.
Forests 09 00135 g006
Figure 7. Percentage of significant correlation coefficients between radial growth and climatic factors of different age groups in the east.
Forests 09 00135 g007
Figure 8. Relationships between age and radial growth’s correlation coefficients with climate in the west. P indicates total monthly precipitation; T indicates mean monthly temperature; p represents months of the previous year; and c represents months of the current year. The dashed lines indicate a significance level of 0.05. The dashed-dotted line indicates the extremum of the curve.
Forests 09 00135 g008aForests 09 00135 g008b
Figure 9. Percentage of significant correlation coefficients between radial growth and climatic factors of different age groups in the west.
Forests 09 00135 g009aForests 09 00135 g009b
Table 1. Summary of the sampling locations.
SiteAltitude (m a.s.l.)Latitude
(°N)
Longitude
(°E)
Slope AspectSlopeNo. of TreesClimate Data From
TLG1292236.68102.66northeast3025Wushaoling
TLG2280236.68102.66northeast2625Wushaoling
HX1289037.38102.56northeast3325Wuwei, Wushaoling
HX2269737.39102.57northeast2525Wuwei, Wushaoling
SDL1320038.4299.93northeast3125Qilian, Yeniugou
SDL2264938.4599.91northeast2625Qilian, Yeniugou
HYG1308638.7899.65northeast3525Sunan, Yeniugou
HYG2283738.7999.66north2525Sunan, Yeniugou
HYG3265438.7999.67north2725Sunan, Yeniugou
QKD289639.4098.46north2825Jiuquan and Tuole
Note: TLG represents Tulugou, HX represents Haxi, SDL represents Sidalong, HYG represents Heiyagou, QKD represents Qingkedi.

