Tropical Tree Species Effects on Soil pH and Biotic Factors and the Consequences for Macroaggregate Dynamics

1
Department of Natural Resource Ecology & Management, Iowa State University, Ames, IA 50011, USA
2
Department of Ecology and Evolutionary Biology, University of Tennessee, Knoxville, TN 37996, USA
3
Department of Integrative Biology, University of Texas at Austin, Austin, TX 78712, USA
*
Author to whom correspondence should be addressed.
Forests 2018, 9(4), 184; https://doi.org/10.3390/f9040184
Submission received: 9 March 2018
/
Revised: 9 March 2018
/
Accepted: 2 April 2018
/
Published: 4 April 2018
(This article belongs to the Special Issue Carbon, Nitrogen and Phosphorus Cycling in Forest Soils)
Abstract
:Physicochemical and biotic factors influence the binding and dispersivity of soil particles, and thus control soil macroaggregate formation and stability. Although soil pH influences dispersivity, it is usually relatively constant within a site, and thus not considered a driver of aggregation dynamics. However, land-use change that results in shifts in tree-species composition can result in alteration of soil pH, owing to species-specific traits, e.g., support of nitrogen fixation and Al accumulation. In a long-term, randomized complete block experiment in which climate, soil type, and previous land-use history were similar, we evaluated effects of individual native tropical tree species on water-stable macroaggregate size distributions in an Oxisol. We conducted this study at La Selva Biological Station in Costa Rica, in six vegetation types: 25-year-old plantations of four tree species grown in monodominant stands; an unplanted Control; and an adjacent mature forest. Tree species significantly influenced aggregate proportions in smaller size classes (0.25–1.0 mm), which were correlated with fine-root growth and litterfall. Tree species altered soil pH differentially. Across all vegetation types, the proportion of smaller macroaggregates declined significantly as soil pH increased (p ≤ 0.0184). This suggests that alteration of pH influences dispersivity, and thus macroaggregate dynamics, thereby playing a role in soil C, N, and P cycling.
1. Introduction
Soil structure is a ‘master integrating variable’ that is often linked to nutrient cycling because it is associated with so many soil properties, including water-holding capacity and stabilization of soil organic C (SOC) [1]. Soil structure can be characterized by the relationships among soil aggregates, which are defined as relatively discrete clusters of particles. Small aggregates may themselves be clustered into larger aggregates [2,3]. Aggregates in soils range in size from microns to millimeters in diameter, with macroaggregates generally defined as 0.25 to <8 mm. Aggregation dynamics are controlled by factors that affect binding/cementation, flocculation/dispersion, and arrangement of soil particles [4].
Cementing and binding agents can be of mineralogical or biotic origin. Highly weathered soils that are rich in Fe and Al oxides, e.g., Oxisols, allophanic soils, and Ultisols have very stable microaggregates [5,6,7]. Most interpret this as evidence that oxides and hydroxides of Al and Fe, as well as amorphous aluminosilicates, are the dominant stabilizing agents in these soils. In soils derived from volcanic mudflows, solid silt- to sand-size mineral grains appeared to provide the nuclei for aggregate development [8]. Biotic binding agents include fine roots, fungi, bacteria, and soil fauna. Microbial polysaccharides were important in stabilizing microaggregates (1–20 μm), while plant detritus served as nuclei for development of larger aggregates (20–300 μm), according to studies of a Mollisol and an Alfisol [9]. Compared with temperate-zone soils, aggregation in highly weathered tropical soils is expected to be controlled relatively more by mineralogical cementing [10].
Factors that disperse or flocculate soil clays, notably soil pH, also influence aggregate formation and stabilization [11]. Most conceptual frameworks of aggregate dynamics do not explicitly include this mechanism, however [1,10,12,13]. The inherent assumption is that site-level soil pH is relatively constant, and thus alteration of soil pH is not included as a driver of aggregation within a site that does not receive applications such as lime. This assumption of a relatively constant soil pH within a site may not apply under land-use change, especially where shifts in species composition occur. Given that plant species, especially trees, can alter soil pH [14,15,16], changes in species composition could influence aggregation via alteration of soil pH. Thus, including the effect of plant species on soil pH would improve our conceptual framework of aggregation dynamics.
The objectives of this study were to determine the extent to which vegetation type influenced macroaggregate structure in an Oxisol, and to evaluate the influence of binding agents, both mineralogical and biological, and alteration of pH on soil aggregation. In a unique tropical experimental field setting in which soil type, climate, forest age and previous land-use history were similar across plots [17], we assayed macroaggregate structure in six vegetation types. These included: four tree species, each grown in 25-year-old monodominant plantations; an unplanted Control that regenerated naturally; and a mature forest. All four of the tree species are broad-leaved, evergreen, and native, but differ in multiple traits that influence detrital inputs and decomposition [18,19,20]. One species, Pentaclethra macroloba (Willd.) Kuntze, is a nodulated legume, known to acidify soil at this site. Another species, Vochysia guatemalensis Donn. Smith, is an Al-accumulator, known to increase the soil pH [16].
We evaluated three hypotheses:
- Macroaggregate size distribution and chemistry differ among the six vegetation types. The four species in plantations and the Control plots would have started with similar soil structure at the beginning of this experiment, 25 years prior to our study. Thus, observed differences among vegetation types in the chemistry and quantity of organic matter (OM) inputs [18,20] would influence soil aggregation, depending on the relative importance of their binding material in this soil. A lack of difference in macroaggregate structure would indicate over-riding control by mineralogical interactions.
- Macroaggregate structure is correlated with fine-root growth, litterfall, fungal, and microbial effects on aggregation. Fine-root and litterfall additions are expected to bind aggregates and thus contribute to their stabilization via multiple chemical and physical mechanisms [11]. Fungal hyphae can reorient clay particles, bind particles with extracellular polysaccharides, and enmesh particles, thereby influencing soil aggregation [21] (Ternan et al., 1996). Mycorrhizal fungi can act at multiple scales, from the plant community to the soil mycelium, to influence soil aggregation [22]. In addition, microbial biomass C, rather than fungal hyphae alone, is often associated with factors that stabilize soil organic C (SOC), and could thus affect soil structure [23]. Microbial activity, however, differs temporally, and with aggregate size, soil type, cropping system and management [24,25].
- Macroaggregate structure is correlated with soil pH. The tree species in this experiment have altered soil pH [16,26] and this could alter aggregation processes. Previously, it was hypothesized that in these variable-charge soils, changes in soil pH above or below the point of zero charge (PZC) would disperse colloids [16]. This effect on colloidal stability could thus influence macroaggregate stability.
2. Materials and Methods
2.1. Study Site and Experimental Design
This study was conducted in a tropical rainforest at La Selva Biological Station (10°26′ N, 83°59′ W) in Costa Rica. The mean annual temperature is 25.8 °C, and the mean annual rainfall is 4000 mm, with rainfall averaging >100 mm in any month [27]. The parent material is considered to be weathered andesitic/basaltic Pleistocene lava flows [28]. These soils may have received more recent inputs, ash or lahars, from nearby volcanoes [29]. The soil was classified as Mixed Haplic Haploperox [30]. Mean soil C and N concentrations in the surface (0–15 cm) layer range from 44 to 55 and 3.4 to 4.2 g/kg, respectively [26]. The point of zero charge (PZC) in these variable-charge soils has not been measured, but a reasonable assumption is that the PZC is ≤4, as it is in many comparable Oxisols [31,32].
The study site was deforested in ~1955 and pastured until abandonment in 1987 [20]. In 1988, a randomized complete block experiment containing four blocks was initiated. The experiment includes four species: Hieronyma alchorneoides L., Pentaclethra macroloba, a nodulated legume, Virola koschnyi Warb., and Vochysia guatemalensis, an Al-accumulator (see Russell et al. [20] for a more complete description). The site is hilly, with elevation ranging from 44 to 89 m. To ensure that topographic effects did not create a bias, each block was centered on a hilltop, and randomization of plot assignment to a species was stratified such that across the four blocks, each species was represented in each topographic position (hilltop, slope and slope bottom). In Block 3 of Vochysia, a stand-level lightning event killed nearly 75% of the trees in 2011, so that plot was not used for this study. Each plot was 50 × 50 m (0.25 ha) and divided into four quadrants. Trees were planted at a spacing of 3 × 3 m. For the first three years, understory vegetation was cleared manually. Trees were thinned by 50% at age four in Hieronyma and Vochysia, the fast-growing species. There was no other management of the plots, except for trail maintenance. For more information about the original design, see Russell et al. [20].
Two types of reference vegetation were also included to provide a basis of comparison for the four planted tree species. (1) An unplanted Control was contained within the original experimental design; (2) In the mature forest, we established a fifth block (150 × 200 m in size). Situated <150 m from the experimental plots, soil, climate, and vegetation prior to 1955 were similar to the adjacent experiment. We sampled four 50 m × 50 m plots randomly selected from within this block. Pentaclethra is the dominant species in La Selva mature forest, accounting for 36–38% of the estimated aboveground biomass of trees [33]. Thus, the complete study design included 23 plots (6 vegetation types x 4 blocks, less 1 plot for Vochysia).
2.2. Field Methods
Soil was sampled for macroaggregate analysis once in late January 2013, as previous studies indicated a lack of seasonal variation (data unpub.). Twenty subsamples were taken in the 0–15 cm layer, using a 3.2-cm diameter push-tube soil sampler at randomly selected locations within three of the four quadrants of each plot. The fourth quadrant was not sampled because soil compaction had occurred during recent erection of a moveable 40-m tower for canopy sampling. The 60 subsamples from each plot were composited into a single sample per plot and mixed well. A subsample of ~800 g of field-moist soil was gently passed through an 8-mm sieve. Of that sample, 150 g was stored at field moisture in the refrigerator at 3 °C for the macroaggregate analyses, while the remaining soil was air-dried for other measurements. Both field-moist and air-dried soils were transported to Iowa State University for subsequent analysis. Soil pH was determined on samples collected from the same depth interval in 2011 when all four quadrants of each plot were sampled.
For assessments of fungal abundance and microbial biomass C, soils were collected at four dates over two years: February 2012, September 2012, February 2013, and September 2013. At each date, we collected five soil cores (10 cm deep × 2.5 cm diameter) in each plot, which were located as one core randomly positioned in each of the four plot quadrants, plus a fifth core from a random position in the full plot. The cores were combined to create a single plot-level sample and homogenized by sieving to 2 mm. There were 23 soil samples per date for a total of 76 samples over two years. The homogenized soils were subsampled for quantification of fungal abundance and microbial biomass C, described below. See Kivlin and Hawkes [34,35] for additional details.
Fine litter production (litterfall of leaves, flowers, fruits, branches ≤1 cm diameter, and frass) was measured every two weeks for two years, 2011–2013, using four 1.3 × 0.4 m litter traps per plot as in Raich et al. [18]. The samples were dried at 65 °C soon after collection, weighed and then ground as described in Russell et al. [16].
Fine-root growth, as an assay for fine-root detrital inputs to soil, was measured in 2012–2013 (0–15 cm depth) using 2-mm mesh ingrowth cores as described by Valverde et al. [36] and Russell et al. [20]. Root ingrowth on a length basis was determined by elutriating the sample, separating roots from detritus, and quantifying root length with a WinRHIZO image analysis system (www.regentinstruments.com/products/rhizo/Rhizo.html).
2.3. Laboratory Analyses
Macroaggregate size distributions in the different vegetation types were evaluated by means of a wet-slaking method that is based on the quantification of the size (diameter) class of macroaggregates according to their ability to resist slaking in water [3]. Air-dried Oxisol samples are usually resistant to wet-sieving [10], so we modified the method of Elliott [3] by using field-moist samples. Before wet-sieving, the initial gravimetric soil moisture content of samples was determined to ensure that the variability in soil moisture did not exceed 10%. The soil moisture content was determined by drying 10-g subsamples at 105 °C for 48 h. The mean soil moisture content was 43% and ranged from 38 to 47% among the samples. Thus, we concluded that initial differences were small enough not to require moisture adjustments prior to wet-slaking. For the procedure, we weighed approximately 100 g of field-moist soil and recorded the mass of each sample to two decimal places. No additional water was added to the samples before wet-sieving. The weighed field-moist sample was then transferred to a Petri dish, 150 mm in diameter and 25 mm in height, that was lined with Whatman Number 1 filter paper and covered while awaiting analysis. We transferred one sample at a time to the top of a set of nested sieves with mesh sizes of 4, 2, 1, 0.5, and 0.25 mm. The nested sieves were held in place by a frame consisting of a round base, two rods as long as the nested sieves, and a clamping device at the top of the sieves that secured the rods. The nested sieves were attached to a lever that raised and lowered the sieves into a 38-L cylinder that was 2/3 filled with water. The set of sieves was then lowered into water just until all soil on all sieves was submerged at all points of lever movement. The sample was wet-sieved by gentle mechanical action that moved the set of sieves 11 cm at a constant rate of 118 cycles per minute in the water for 5 min.
The sample remaining on each sieve was then transferred to a separate aluminum pan. Soil materials that were lodged in the sieve were not included in any of the aggregate size distributions. Thus, the sum of the sample recovered in the 0.25–4.0 mm size distributions is a conservative measure of the total within that size range. We dried samples in a forced-air oven for 48 h. A drying temperature of 60 °C is often used in macroaggregate studies [3], but 55 °C was recommended to avoid N loss, given that samples would be subsequently analyzed for N (C. Cambardella, pers. comm.). The dried subsample within each size class was then weighed and finely ground to <0.25 mm in a mortar and pestle for analysis of C and N.
Total C and N in macroaggregates were measured by dry combustion, using a ThermoFinnigan Flash EA 1112 elemental analyzer (Thermo Fisher Scientific, Waltham, MA, USA). Total P was extracted in aqua regia (HCl:HNO3 = 4:1 by volume) following the method of Crosland et al. [37]. Phosphorus in the digests was determined by inductively coupled plasma atomic emission spectrometry (ICP-AES). Total organic P was determined by the ignition method [38], in which organic P in the soil is converted to inorganic P by oxidation at 550 °C. Phosphorus in ignited and unignited subsamples is then extracted with 0.5 N H2SO4 for 16 h. Phosphorus in the extracts was determined via ICP-AES. Organic P in the soil was calculated by subtracting P concentration in the unignited sample from P concentration in the ignited sample. Litterfall Al was measured by microwave-assisted acid digestion and analyzed using inductively coupled plasma optical emission spectroscopy [39]. Soil pH was measured using a stirred slurry of 10 mL sieved, air-dried soil in 25 mL deionized water [40,41].
To quantify fungal hyphae, soils were first air-dried for 24 h and ground with a mortar and pestle to disrupt clay aggregates. Hyphae were extracted from soil using 3% sodium hexametaphosphate, collected via vacuum filtration, stained with acid fuchsin, and quantified by microscopy at 160× with at least 100 fields of view per sample [42,43]. Both septate (decomposers and pathogens) and aseptate (arbuscular mycorrhizal fungi) hyphae, as well as all hyphae inside of soil aggregates, were recorded and summed for total abundance, which is reported as length per g dry soil. Microbial biomass C (MBC) was quantified as the difference between chloroform fumigated and unfumigated soils extracted in a 1:5 ratio of 0.5M K2SO4 [44,45]. Microbial biomass data are reported as μg C per g dry soil. Carbon was quantified by combustion (Apollo 9000 TOC Analyzer, Teledyne Tekmar, Mason, OH, USA) [34,35].
2.4. Data Analysis
The experimental unit was the plot. For variables with multiple measurements per plot, the plot mean was used in the analysis. Inclusion of the mature forest in analyses resulted in a randomized incomplete block design. Blocks were treated as a random effect. We tested for homogeneity of variances and normality of distributions. For Al in litterfall, the variances were heterogeneous, so tests were performed on natural log-transformed data. Computations were done using a generalized linear model with both random and fixed effects, the Statistical Analysis System (SAS) mixed model [46]; inclusion of the mature forest required use of the Satterthwaite adjustment for degrees of freedom. Pairwise comparisons for significant overall F-tests were performed using p-values adjusted by Tukey’s Honestly Significant Difference method.
To test for differences among the vegetation types in macroaggregate size distributions and element (C, N, P) content (H1), we analyzed response variables for the five macroaggregate size classes in the six vegetation types. This Analysis of Variance (ANOVA) model included terms for size class (S), vegetation type (V) and S × V interaction. The response variables regarding macroaggregates were: fraction of total sample; C, N, inorganic P and organic P content; and C:N. The S × V interactions were significant; therefore, separate ANOVAs were conducted for each macroaggregate size class.
To evaluate the strength of the four hypothesized biotic effects on macroaggregate fractions (H2), we tested the four factors simultaneously by conducting partial regression residual analysis. This analysis quantifies the effect of a particular explanatory variable after the effects of all the other explanatory variables in the model have been taken into consideration [47]. This multiple regression model included one response variable, the fraction of macroaggregates within a size class. The four predictor (=explanatory) variables tested were: (a) fungal hyphae in aggregates (mm g−1 dry soil); (b) microbial biomass C (μg C g−1 dry soil); (c) fine-root growth (length basis, 0–15 cm depth, cm m−2 yr−1); and (d) Al flux in fine litterfall (kg ha−1 yr−1). With n = 23 plots for these analyses, it was not appropriate to include more explanatory variables in the model. For all explanatory variables, we used the mean over all sample times in this analysis. Exploratory analyses of microbial variables indicated that results were relatively invariable, regardless of whether we used the values from one sample time that occurred <1 month after macroaggregate sampling or mean values over the four sample times. Results were also similar between the variables of total hyphae and hyphae within aggregates. Of these two variables, we report only the latter, with values based on the mean of four sample times. Pearson correlational analyses were conducted to test for relationships between the fraction of macroaggregates within the smallest size class and soil pH.
3. Results
3.1. Macroaggregate Size Distribution and Element Concentrations under Different Vegetation (H1)
In the surface horizon, the largest three size classes of water-stable macroaggregates (4–8, 2–4, and 1–2 mm) accounted for 72% of the total dry mass of aggregates, with no significant differences among the vegetation types in any of these three size classes (Figure 1a). In the smallest size classes, however, vegetation (V) had a significant impact on the fraction within the size class (S), with the effect of vegetation differing by size class (p = 0.0012, S × V) (Table 1, Figure 1a). In the mature forest, the fraction of macroaggregates in the 0.5–1.0-mm size class was significantly higher than in the other vegetation types, with the exception of Pentaclethra, which is the dominant species in the mature forest. In the 0.25–0.5-mm size, the vegetation types differed with: Mature forest > Pentaclethra > Vochysia > Hieronyma, Virola and Control (Figure 1b).
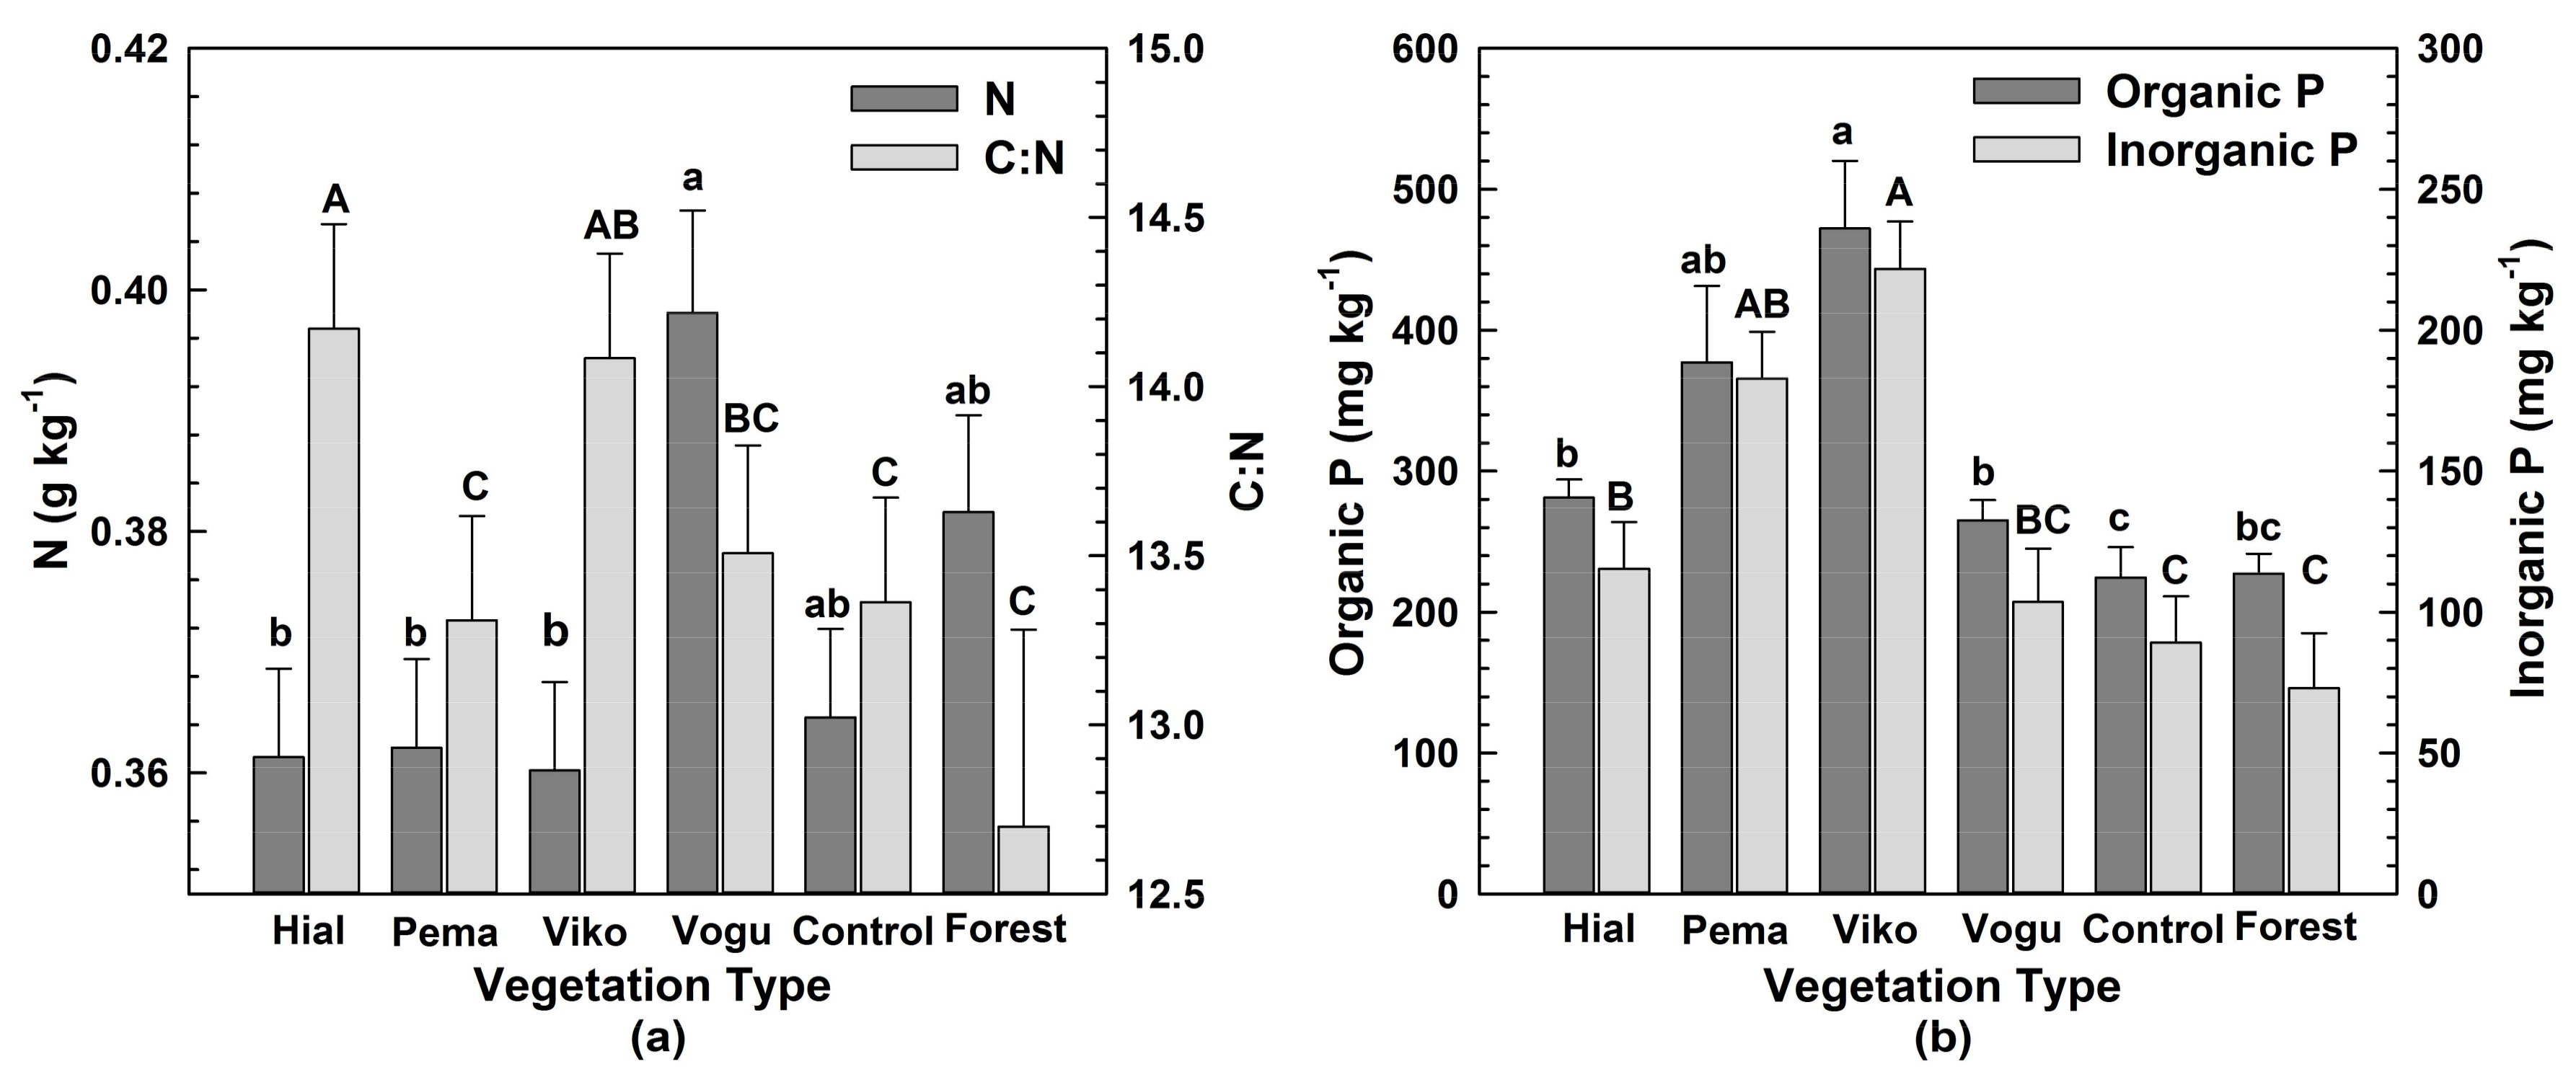
Concentrations of N, organic P and inorganic P in aggregates differed significantly among vegetation types (Table 1; Table A1). Nitrogen concentrations were higher in Vochysia than in Hieronyma, Pentaclethra and Virola (Figure 2a). Hieronyma had the highest C:N values, whereas Pentaclethra, the mature forest and Control had the lowest (Figure 2a). Both organic and inorganic P concentrations were highest in Virola and lowest in the mature forest and Control (Figure 2b).
All values represent the mean across all size classes of macroaggregates, given no significant differences among size classes for these variables. Small letters denote differences among vegetation types in N and Organic P concentrations; capital letters signify differences for C:N and inorganic P.
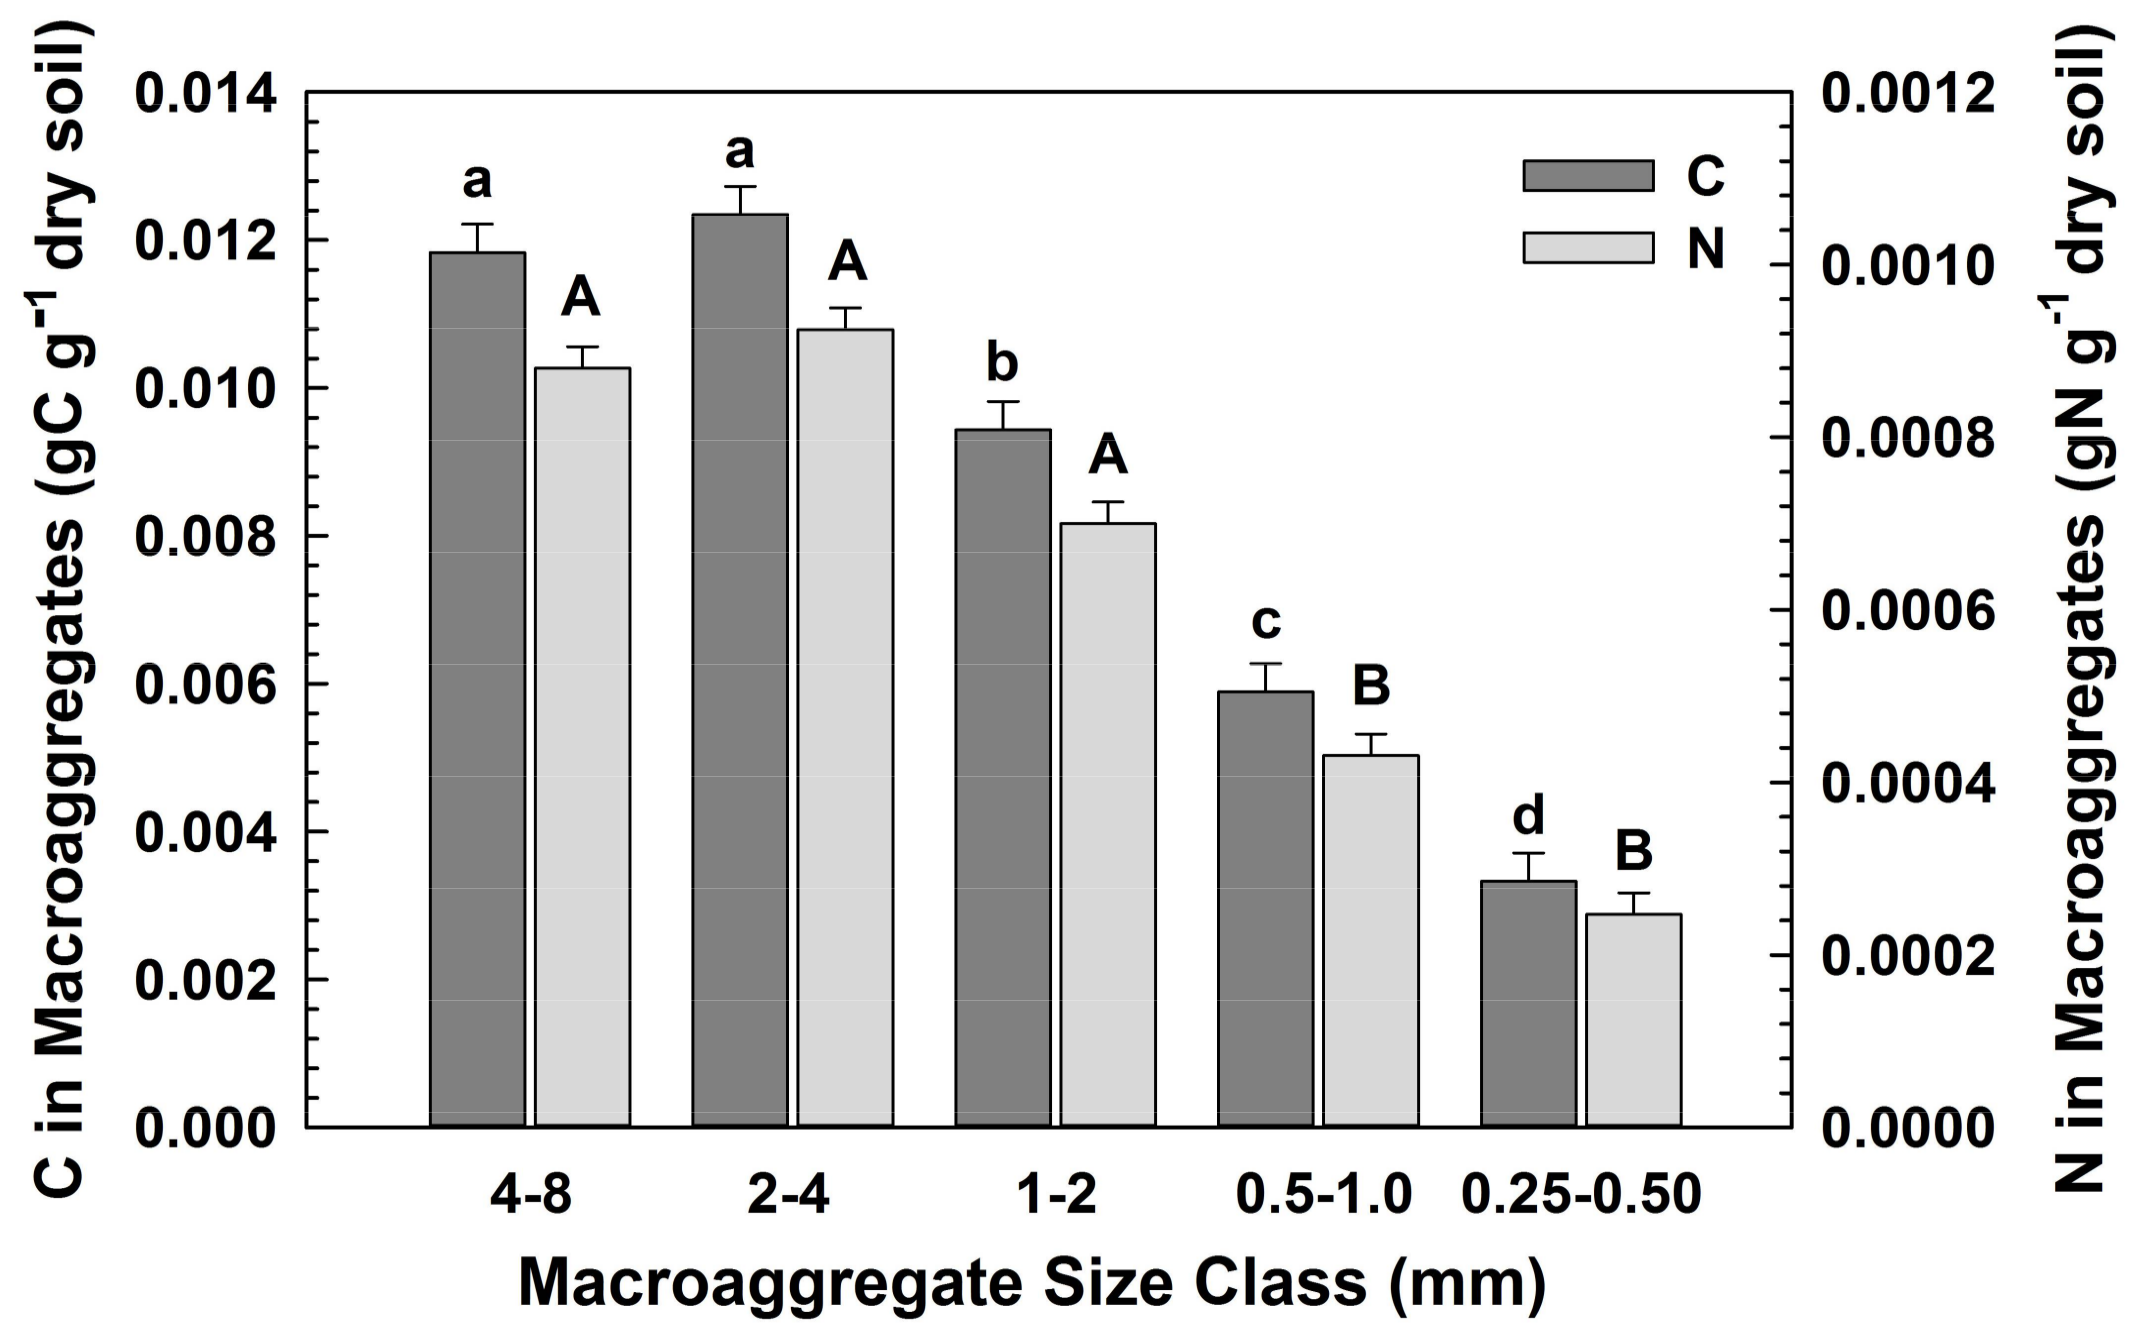
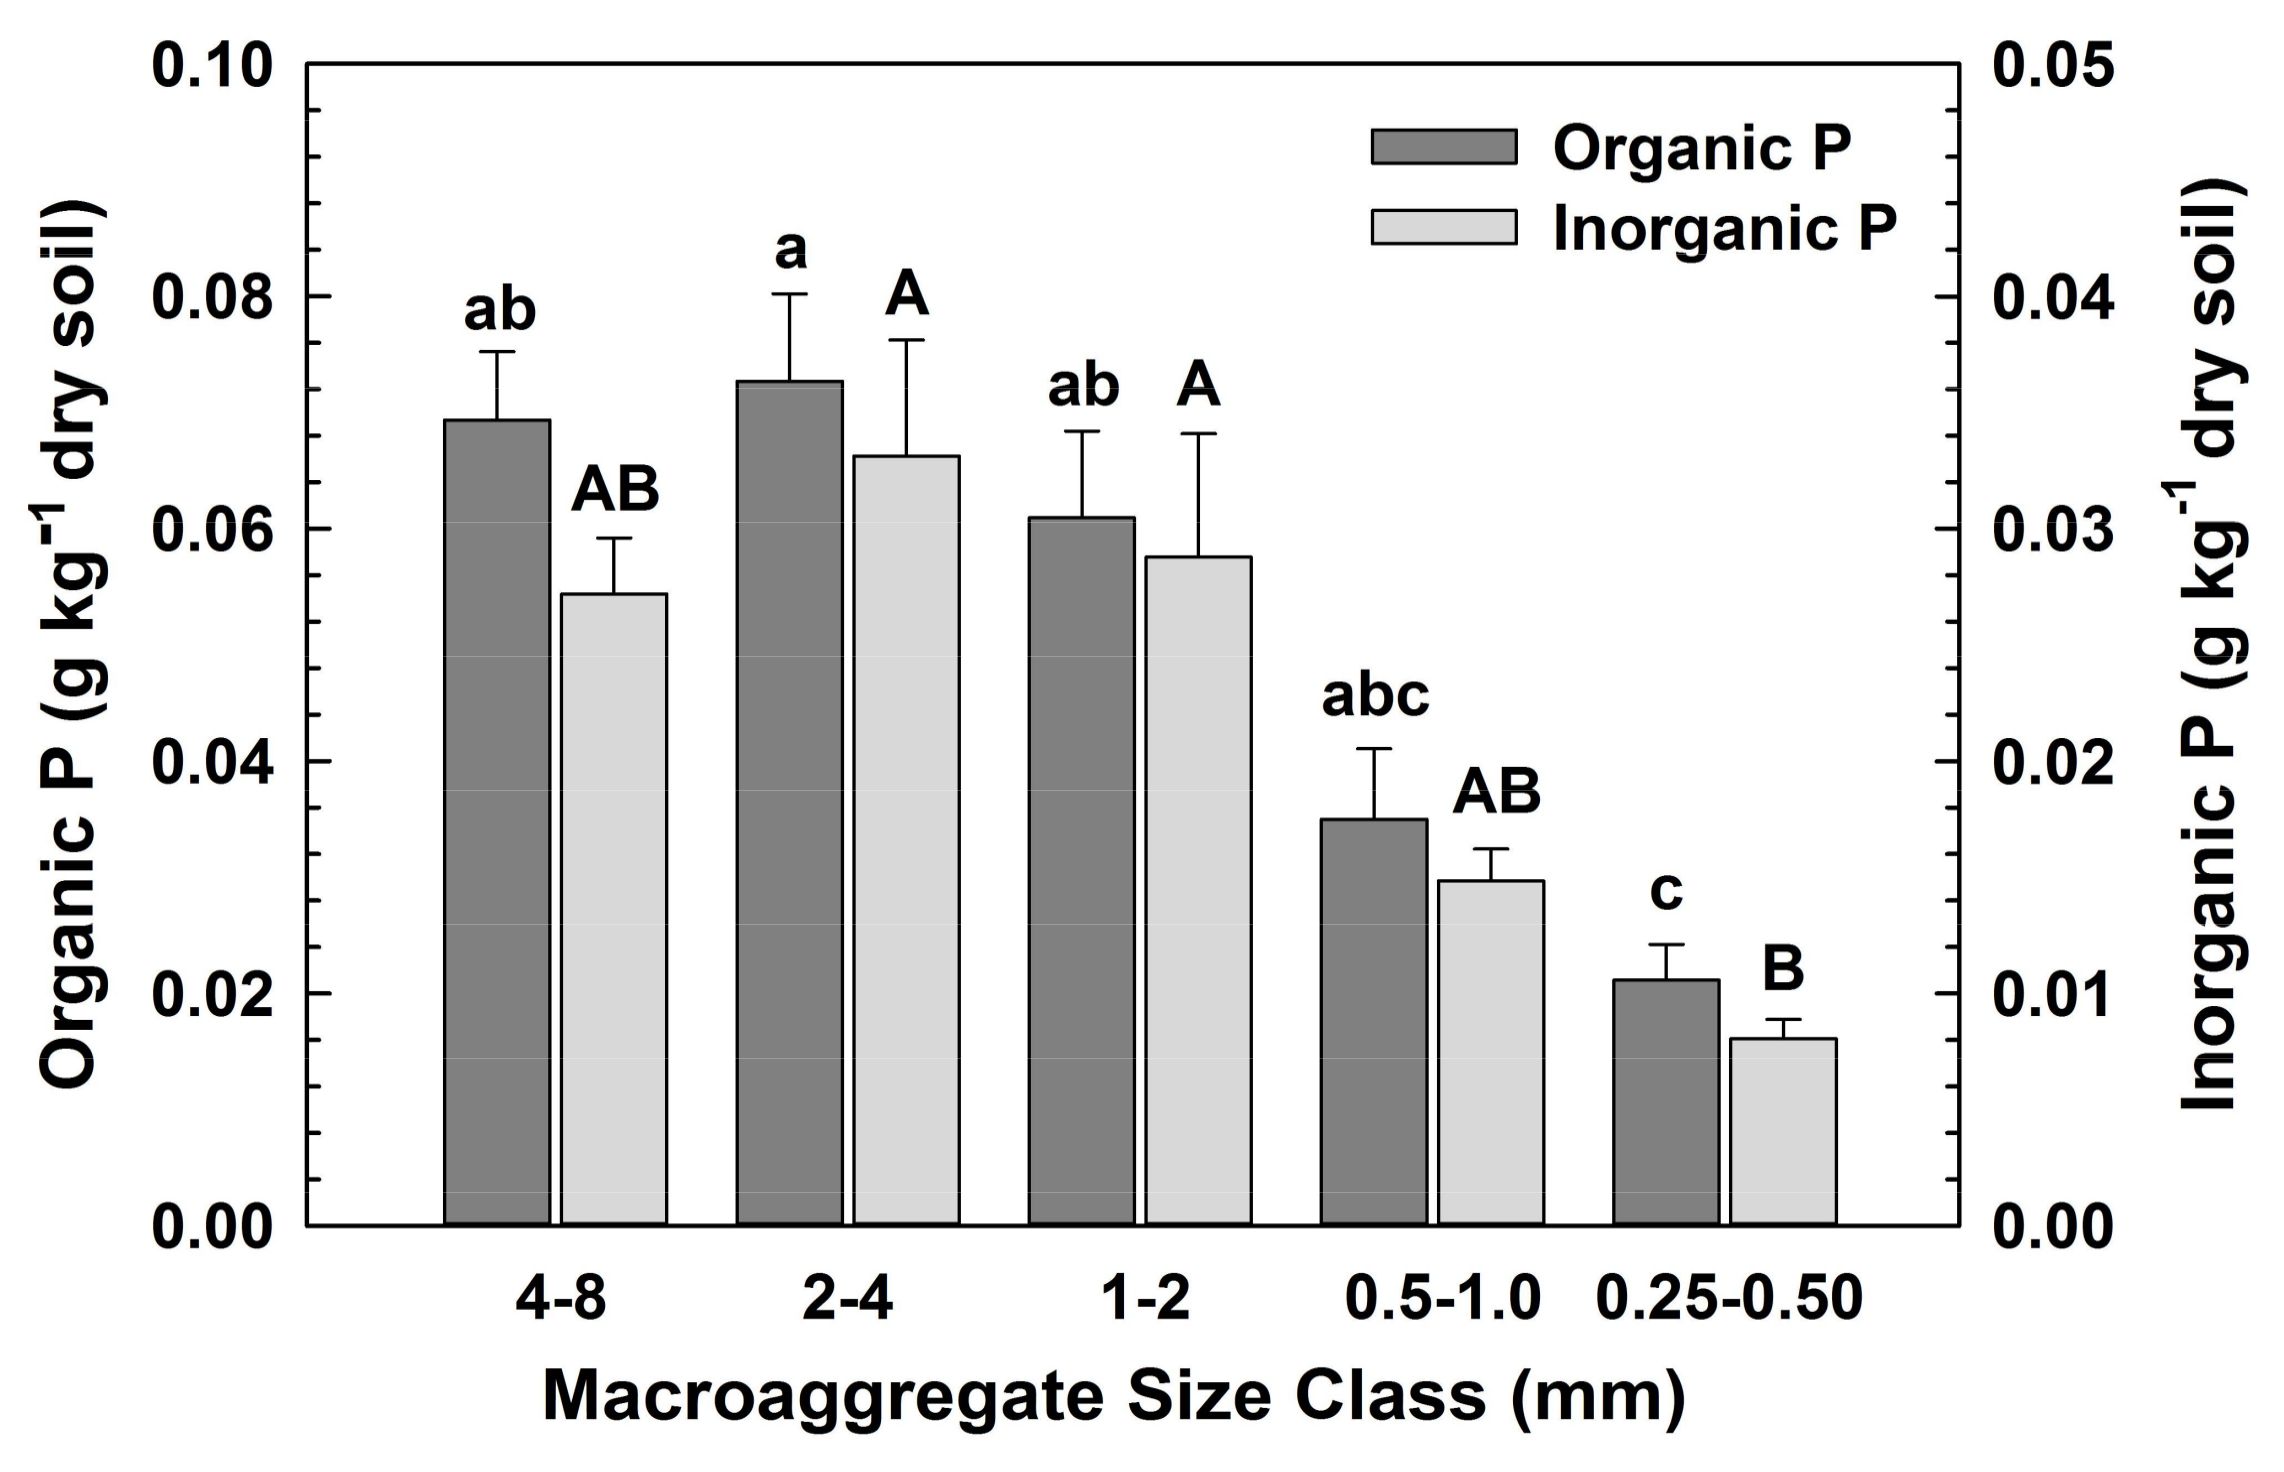
Concentrations of C, N, organic P and inorganic P did not differ significantly among the macroaggregate size classes (Table 1; Table A1). Thus, larger macroaggregates (>1 mm), which accounted for the majority of the water-stable aggregates (72%), contained the largest fraction of macroaggregate C, N and P, (Figure 3 and Figure 4, calculated from Table A1, as the product of the element concentration within a size class and the fraction of total soil within that size class, respectively). These data are expressed as the fraction of total soil, with means across all vegetation types, given no significant differences among vegetation types. The differences in elemental concentrations translated into significant effects of the vegetation on the N and P (organic and inorganic) fractions, but not on C fractions contained in macroaggregates (Table 1).
3.2. Biotic Effects on Macroaggregate Size Distributions (H2, H3)
We evaluated several biotic factors that could potentially differ among the vegetation types and thus influence macroaggregate formation differentially: fungal hyphae within aggregates; microbial biomass C; fine-root growth; and flux of Al in litterfall (Table A2). These explanatory variables were included in the multiple regression model for which the response variable was the fraction of total macroaggregate dry mass contained within a size class (Table A1). Fine-root growth was significantly correlated with the dry mass macroaggregate fraction in two size classes (4–8 and 1–2 mm) (Table 2). The flux of Al in litterfall was significantly correlated with the dry mass macroaggregate fraction in the smallest size classes (0.25–0.5 mm) (Table 2).
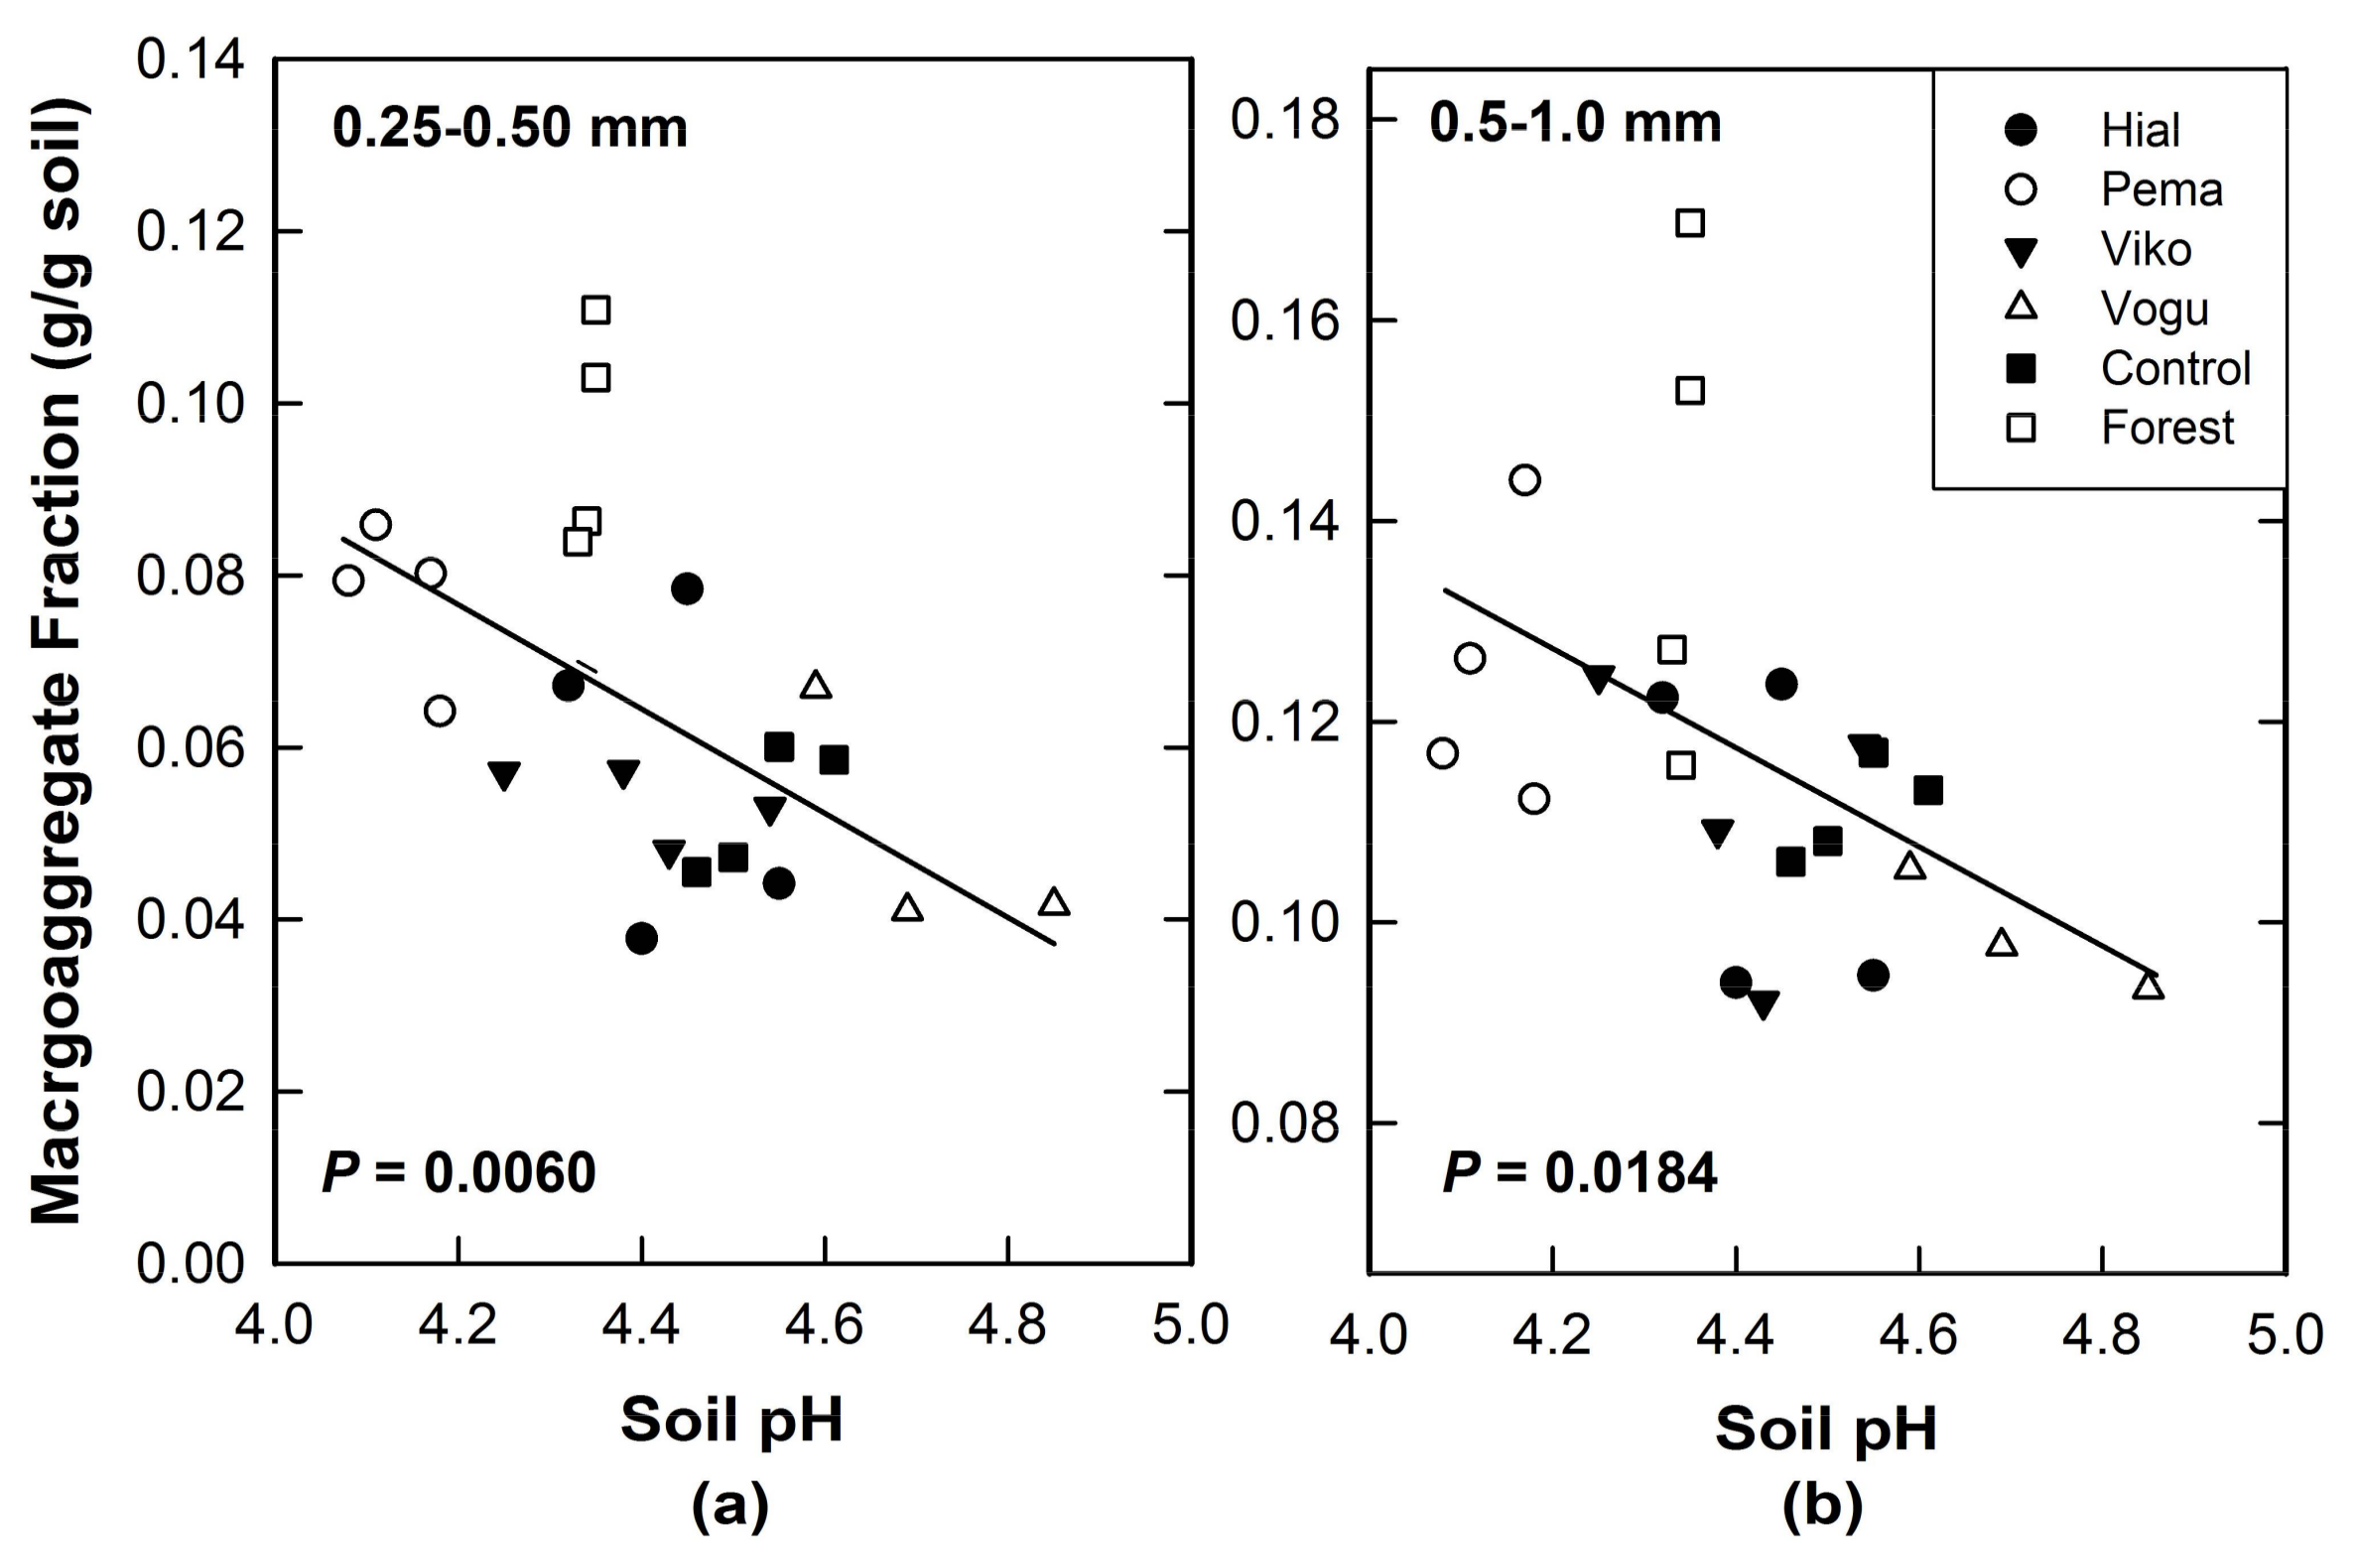
The effect of vegetation on soil pH influenced macroaggregate fractions in the smallest size classes (Table 3; Table A2). Across all plots, macroaggregates <1 mm in diameter declined with increasing soil pH (Figure 5a,b). These two macroaggregate size classes were the smallest measured in this study. All data are for the 0–15 cm mineral soil layer. Results are based on Pearson’s analyses.
4. Discussion
4.1. Cementing Effect of Soil Mineralogy
The similarly high proportion of larger macroaggregates (1–8 mm) across all vegetation types indicated that mineral interactions were relatively more important than biotic factors in binding soil particles in this Oxisol. This was expected under the current conceptual framework [10,13], and given the presence of Fe and Al oxides in this soil. However, total Fe (hydr)oxide content does not always correlate with aggregate stability. Duiker et al. [48] found that the crystallinity of the Fe (hydr)oxides was important; poorly crystalline (hydr)oxides, with their larger and more reactive surface area, had a higher degree of aggregation than crystalline Fe (hydr)oxides, even when present in lower concentrations.
The similarities among the macroaggregate size classes in elemental concentrations and C:N in this study indicated a lack of aggregate hierarchy resulting from the cementing effect of the mineral interactions. These results were consistent with those from another Oxisol in which oxides were the stabilizing agent [10]. Macroaggregate size in our study thus did not appear to represent stages of formation or decomposition of aggregates as in conceptual models for temperate soils (e.g., [1]).
4.2. Binding Effects of the Biota
Despite the strong potential for oxides to affect aggregation in this Oxisol, biotic factors exerted an influence over the smaller macroaggregates (0.25–1 mm) in this experiment, as indicated by significant differences among tree species in these size classes. These aggregates comprised the smallest proportion of the total soil in the Vochysia treatment, and the largest fraction in the Pentaclethra treatment (Figure 1a). Of the potential explanatory biotic factors that we evaluated, only fine-root growth and Al flux in litterfall were significantly correlated with macroaggregate structure. The quantity and chemistry of plant detritus have been shown to influence aggregation in numerous studies cited by Bronick and Lal [11]. In addition, plant roots can perform multiple tasks that would bind soil particles, including realigning and fastening them together and exuding chemical cementing agents [11]. Thus, it is reasonable that differences among the tree species in fine-root growth [16] were correlated with macroaggregate structure. Similarly, Rillig et al. [22] found that aggregation increased with root length density.
Microbial factors (fungal abundance and microbial biomass C) were not correlated with macroaggregate structure (Table 2). While soil microbial processes and their interactions with plants can also influence binding, and thus aggregation, differences in microbial community composition and function were not strongly correlated with tree species at our study site [34,35]. Studies at other sites have had similar results [49,50]. Thus, it is not surprising that these variables were not correlated with macroaggregate structure. For fungal taxonomic richness and phylogenetic diversity, the relationships with tree species composition were also not significant [34,35]. Similarly, microbial community composition was poorly predicted by plant species composition and functional traits in a study at Barro Colorado Island, Panama, [51].
4.3. Dispersivity (pH) Effects of Tree Species
Of the many factors that influence soil structure, soil pH has been noted, but is often overlooked [11], and is not generally included in conceptual frameworks of controls over aggregation (e.g., [1,13]. In previous studies at our site, we found that the planted tree species significantly altered soil pH. At the start of this experiment in 1988, mean (±S.E.) soil pH across this site that had been in pasture for >30 years was 4.52 (±0.02) [17]. After 25 years under the mono-dominant plantation treatment of Pentaclethra, the nodulated legume, soil pH had declined to as low as 4.08 in one plot (treatment mean ± S.E.: 4.14 ± 0.02), and under Vochysia, the Al-accumulating species, soil pH had increased to as 4.85 in one plot (treatment mean: 4.71 ± 0.08) (Table A2; [16]. These pH changes over time occurred without additions of lime or other chemicals. Other studies of nodulated legumes that support microbial N2 fixation have demonstrated that ammonification and subsequent nitrification are increased by these species, therefore releasing H+ and acidifying soil [52]. At the other end of the spectrum of species effects on soil pH, species that accumulate Al could take up H+ as a consequence of changing the equilibrium between Al minerals and soluble Al [53]:
Al(OH)3 + 3H+ ⇌ Al3+ + 3H2O
In a previous study, we hypothesized that in these variable-charge soils, the observed range of pH values under the different vegetation types—nearly one pH unit—would be sufficient to create observable differences in aggregation and dispersion of soil colloids across vegetation types. We predicted that aggregation would be greatest at the hypothesized PZC of ≤4 and would decrease as pH increased [16]. In this study, the Pentaclethra treatment had the lowest soil pH and the highest fraction of macroaggregates <1 mm, whereas Vochysia had the highest pH and lowest fraction of macroaggregates in this smaller size range (Figure 1). The result that across all treatments the smallest macroaggregate fractions declined with increasing pH (Figure 5) is consistent with the hypothesis that aggregation would be negatively correlated with soil pH in this variable-charge soil.
5. Conclusions
This long-term tropical experimental setting allowed us to test whether biotic effects exerted control over macroaggregate structure in an Oxisol in which Fe and Al oxides were expected to be the major cementing agents. We found no significant differences among vegetation types in water-stable macroaggregate fractions for aggregates >1 mm, but for aggregates ≤1 mm, differences were significant. Biotic factors that could mediate these effects, e.g., fine-root growth and Al in litterfall, were significantly correlated with several size classes of macroaggregate fractions, but microbial and fungal abundance within macroaggregates had no significant correlation. After 25 years of growth, the planted tree species had altered soil pH by a range across all plots of nearly one pH unit. These differences in pH were correlated with smaller aggregate fractions (p = 0.0563, r = 0.40 for 0.5–1.0 mm size; p = 0.0055, r = 0.56 for 0.25–050 mm size), suggesting an important linkage between these two master soil variables, pH and macroaggregate structure, such that both were influenced by tree species. Increases or decreases in pH mediated by plant traits could release elements that are physically protected within macroaggregates and thereby influence soil C, N and P cycling.
Acknowledgments
This material is based upon work supported by the National Science Foundation under Grant No. 1119223, 1119169, and 1120015. We are grateful to Ricardo Bedoya, Flor Cascante, Marlon Hernández, Melissa Sánchez, and Eduardo Paniagua for assistance in the field and laboratory. Amy Morrow and David Denhaan conducted the C analyses. Cindy Cambardella advised on and Jody Ohmacht assisted with the wet-slaking methods. John Kovar and Jay Berkey were responsible for the soil P analyses, for which we are grateful. Katherine Taylor assisted in many aspects of the laboratory studies. We thank Philip Dixon, Emily Casleton, and Daniel Ries for advice on statistical analyses.
Author Contributions
All three authors conceived and designed the experiments, performed the experiments, and analyzed the data for their respective components; S.N.K. and C.V.H. conducted the fungal and microbial studies, and A.E.R. conducted studies for the other components. A.E.R. wrote the paper.
Conflicts of Interest
The authors declare no conflict of interest.
Appendix A

Table A1.
Macroaggregate dry mass and elemental concentration by diameter size class and vegetation type in experimental site in Costa Rica. ‘Fraction’ refers to the proportion of the total dry soil mass recovered after wet sieving. Means (±S.E.) are for n = 4 samples (3 in Vochysia) from the 0–15 cm depth.
| Vegetation | Size Class | Fraction of Dry Mass | C | N | C:N | Organic P | Inorganic P |
|---|---|---|---|---|---|---|---|
| mm | g/g | g/kg | g/kg | mg/kg | mg/kg | ||
| Hieronyma | 4–8 | 0.227 ± 0.012 | 48.85 ± 1.87 | 3.57 ± 0.09 | 13.71 ± 0.45 | 247.81 ± 36.39 | 110.97 ± 13.19 |
| 2–4 | 0.246 ± 0.014 | 48.85 ± 2.22 | 3.53 ± 0.13 | 13.85 ± 0.43 | 283.93 ± 19.23 | 113.16 ± 15.27 | |
| 1–2 | 0.196 ± 0.009 | 50.78 ± 2.37 | 3.58 ± 0.13 | 14.17 ± 0.45 | 292.23 ± 10.48 | 119.34 ± 12.73 | |
| 0.5–1 | 0.109 ± 0.008 | 52.51 ± 2.57 | 3.65 ± 0.16 | 14.44 ± 0.68 | 323.97 | 125.28 | |
| 0.25–0.5 | 0.057 ± 0.009 | 54.93 ± 2.36 | 3.75 ± 0.12 | 14.68 ± 0.53 | 318.39 | 108.47 | |
| Pentaclethra | 4–8 | 0.221 ± 0.029 | 48.20 ± 4.95 | 3.61 ± 0.37 | 13.35 ± 0.09 | 400.50 ± 103.38 | 175.37 ± 66.12 |
| 2–4 | 0.251 ± 0.010 | 46.08 ± 3.53 | 3.57 ± 0.24 | 12.87 ± 0.24 | 390.63 ± 101.75 | 160.37 ± 55.96 | |
| 1–2 | 0.191 ± 0.010 | 46.94 ± 3.33 | 3.57 ± 0.27 | 13.17 ± 0.21 | 304.86 ± 142.77 | 258.00 ± 101.07 | |
| 0.5–1 | 0.125 ± 0.007 | 46.94 ± 3.64 | 3.60 ± 0.26 | 13.64 ± 0.20 | 488.09 | 156.27 | |
| 0.25–0.5 | 0.077 ± 0.005 | 49.16 ± 3.74 | 3.75 ± 0.24 | 13.51 ± 0.36 | 408.80 | 164.50 | |
| Virola | 4–8 | 0.243 ± 0.015 | 49.76 ± 1.81 | 3.56 ± 0.09 | 13.98 ± 0.36 | 428.60 ± 12.71 | 139.40 ± 10.64 |
| 2–4 | 0.256 ± 0.008 | 50.14 ± 2.29 | 3.60 ± 0.08 | 13.90 ± 0.35 | 412.34 ± 162.27 | 240.51 ± 99.42 | |
| 1–2 | 0.199 ± 0.007 | 50.31 ± 3.02 | 3.55 ± 0.14 | 14.16 ± 0.41 | 524.92 ± 96.56 | 232.16 ± 92.47 | |
| 0.5–1 | 0.111 ± 0.007 | 51.79 ± 3.14 | 3.63 ± 0.15 | 14.24 ± 0.51 | 535.67 | 234.02 | |
| 0.25–0.5 | 0.054 ± 0.002 | 52.00 ± 2.43 | 3.67 ± 0.08 | 14.15 ± 0.41 | 509.14 | 240.11 | |
| Vochysia | 4–8 | 0.285 ± 0.021 | 52.50 ± 2.61 | 3.92 ± 0.22 | 13.41 ± 0.31 | 233.30 ± 8.44 | 100.00 ± 5.52 |
| 2–4 | 0.270 ± 0.010 | 53.10 ± 2.02 | 3.82 ± 0.18 | 13.91 ± 0.22 | 232.07 ± 15.32 | 102.48 ± 5.44 | |
| 1–2 | 0.171 ± 0.009 | 53.19 ± 2.16 | 3.87 ± 0.18 | 13.77 ± 0.27 | 290.10 ± 24.19 | 99.88 ± 6.75 | |
| 0.5–1 | 0.099 ± 0.003 | 57.76 ± 2.01 | 4.17 ± 0.19 | 13.85 ± 0.15 | 293.99 | 102.09 | |
| 0.25–0.5 | 0.050 ±0.009 | 57.10 ± 1.98 | 4.10 ± 0.26 | 13.98 ± 0.41 | 356.02 | 100.18 | |
| Control | 4–8 | 0.244 ± 0.008 | 47.45 ± 2.51 | 3.58 ± 0.13 | 13.23 ± 0.33 | 242.59 ± 48.55 | 103.52 ± 18.15 |
| 2–4 | 0.262 ± 0.014 | 47.22 ± 1.69 | 3.62 ± 0.14 | 13.05 ± 0.21 | 228.57 ± 47.77 | 104.40 ± 23.58 | |
| 1–2 | 0.202 ± 0.006 | 48.63 ± 2.60 | 3.65 ± 0.16 | 13.30 ± 0.22 | 207.83 ± 43.05 | 95.42 ± 22.29 | |
| 0.5–1 | 0.111 ± 0.002 | 49.56 ± 2.95 | 3.66 ± 0.17 | 13.53 ± 0.34 | 166.38 | 81.69 | |
| 0.25–0.5 | 0.053 ± 0.004 | 50.96 ± 2.60 | 3.72 ± 0.14 | 13.70 ± 0.28 | 260.81 | 60.83 | |
| Mature Forest | 4–8 | 0.219 ± 0.021 | 50.85 ± 2.97 | 3.94 ± 0.17 | 12.88 ± 0.29 | 221.43 ± 26.57 | 72.51 ± 5.47 |
| 2–4 | 0.224 ± 0.014 | 50.43 ± 2.76 | 4.00 ± 0.13 | 12.59 ± 0.31 | 214.55 ± 34.30 | 76.75 ± 9.96 | |
| 1–2 | 0.190 ± 0.007 | 47.54 ± 2.79 | 3.74 ± 0.16 | 12.71 ± | 257.37 ± 18.74 | 69.18 ± 8.14 | |
| 0.5–1 | 0.142 ± 0.012 | 46.87 ± 3.18 | 3.67 ± 0.14 | 12.74 ± | 158.26 | 68.30 | |
| 0.25–0.5 | 0.096 ± 0.007 | 47.04 ± 2.76 | 3.74 ±0.12 | 12.57 ± | 251.20 | 78.68 |
Notes. Sample mass in the two smallest size classes was insufficient for analyses of P in all blocks. Values represent the composited samples across blocks of a given species and size class.
Table A2.
Four biological factors and soil pH data used in evaluating relationships with macroaggregate structure.
Table A2.
Four biological factors and soil pH data used in evaluating relationships with macroaggregate structure.
| Vegetation | Hyphae in Aggregates | Microbial Biomass C | Fine-Root Growth | Al in Litterfall | Soil pH |
|---|---|---|---|---|---|
| mm g−1 Dry Soil | μg C g−1 Dry Soil | cm cm−2 yr−1 | kg Al ha−1 yr−1 | ||
| Hieronyma | 16,588 ± 1150 | 1022 ± 108 | 99 ± 8 | 10 ± 2 | 4.43 ± 0.05 |
| Pentaclethra | 19,201 ± 818 | 933 ± 49 | 70 ± 9 | 8 ± 1 | 4.14 ± 0.02 |
| Virola | 17,438 ± 1853 | 781 ± 180 | 91 ± 9 | 14 ± 1 | 4.40 ± 0.06 |
| Vochysia | 12,021 ± 1818 | 1171 ± 33 | 181 ± 15 | 180 ± 17 | 4.71 ± 0.08 |
| Control | 15,420 ± 1543 | 949 ± 139 | 106 ± 10 | 83 ± 14 | 4.53 ± 0.03 |
| Mature Forest | 16,548 ± 721 | 1033 ± 89 | 94 ± 11 | 2 ± 1 | 4.34 ± 0.01 |
References
- Jastrow, J.D.; Amonette, J.E.; Bailey, V.L. Mechanisms controlling soil carbon turnover and their potential application for enhancing carbon sequestration. Clim. Chang. 2007, 80, 5–23. [Google Scholar] [CrossRef]
- Tisdall, J.M.; Oades, J.M. Organic matter and water-stable aggregates in soils. Eur. J. Soil Sci. 1982, 33, 141–163. [Google Scholar] [CrossRef]
- Elliott, E. Aggregate structure and carbon, nitrogen, and phosphorus in native and cultivated soils. Soil Sci. Soc. Am. J. 1986, 50, 627–633. [Google Scholar] [CrossRef]
- Payne, D. Soil structure, tilth and mechanical behaviour. Russells Soil Cond. Plant Growth 1988, 11, 378–411. [Google Scholar]
- El-Swaify, S. Physical and mechanical properties of oxisols. In Soils with Variable Charge; Theng, B.K.G., Ed.; Offset Publ.: Palmerston North, New Zealand, 1980; pp. 303–324. [Google Scholar]
- Warkentin, B.; Maeda, T. Physical and mechanical characteristics of Andisols. N. Z. Soc. Soil Sci. 1980, 12, 281–302. [Google Scholar]
- Igwe, C.A.; Zarei, M.; Stahr, K. Fe and Al oxides distribution in some ultisols and inceptisols of southeastern Nigeria in relation to soil total phosphorus. Environ. Earth Sci. 2010, 60, 1103–1111. [Google Scholar] [CrossRef]
- Spycher, G.; Rose, S.L.; Sollins, P.; Norgren, J.; Young, J.L.; Kermit Cromack, J. Evolution of Structure in a chronosequence of andesitic forest soils. Soil Sci. 1986, 142, 164–178. [Google Scholar] [CrossRef]
- Tiessen, H.; Stewart, J.W. Light and electron microscopy of stained microaggregates: The role of organic matter and microbes in soil aggregation. Biogeochemistry 1988, 5, 312–322. [Google Scholar] [CrossRef]
- Oades, J.; Waters, A. Aggregate hierarchy in soils. Soil Res. 1991, 29, 815–828. [Google Scholar] [CrossRef]
- Bronick, C.J.; Lal, R. Soil structure and management: A review. Geoderma 2005, 124, 3–22. [Google Scholar] [CrossRef]
- Sollins, P.; Homann, P.; Caldwell, B.A. Stabilization and destabilization of soil organic matter: Mechanisms and controls. Geoderma 1996, 74, 65–105. [Google Scholar] [CrossRef]
- Six, J.; Feller, C.; Denef, K.; Ogle, S.; de Moraes Sa, J.C.; Albrecht, A. Soil organic matter, biota and aggregation in temperate and tropical soils-Effects of no-tillage. Agronomie 2002, 22, 755–775. [Google Scholar] [CrossRef]
- Finzi, A.C.; Canham, C.D.; Van Breemen, N. Canopy tree–soil interactions within temperate forests: Species effects on pH and cations. Ecol. Appl. 1998, 8, 447–454. [Google Scholar]
- Reich, P.B.; Oleksyn, J.; Modrzynski, J.; Mrozinski, P.; Hobbie, S.E.; Eissenstat, D.M.; Chorover, J.; Chadwick, O.A.; Hale, C.M.; Tjoelker, M.G. Linking litter calcium, earthworms and soil properties: An common garden test with 14 tree species. Ecol. Lett. 2005, 8, 811–818. [Google Scholar] [CrossRef]
- Russell, A.E.; Hall, S.J.; Raich, J.W. Tropical tree species traits drive soil cation dynamics via effects on pH: A proposed conceptual framework. Ecol. Monogr. 2017, 87, 685–701. [Google Scholar] [CrossRef]
- Fisher, R.F. Amelioration of degraded rain forest soils by plantations of native trees. Soil Sci. Soc. Am. J. 1995, 59, 544–549. [Google Scholar] [CrossRef]
- Raich, J.W.; Russell, A.E.; Bedoya-Arrieta, R. Lignin and enhanced litter turnover in tree plantations of lowland Costa Rica. For. Ecol. Manag. 2007, 239, 128–135. [Google Scholar] [CrossRef]
- Raich, J.W.; Russell, A.E.; Valverde-Barrantes, O. Fine root decay rates vary widely among lowland tropical tree species. Oecologia 2009, 161, 325–330. [Google Scholar] [CrossRef] [PubMed]
- Russell, A.E.; Raich, J.W.; Arrieta, R.B.; Valverde-Barrantes, O.; González, E. Impacts of individual tree species on carbon dynamics in a moist tropical forest environment. Ecol. Appl. 2010, 20, 1087–1100. [Google Scholar] [CrossRef] [PubMed]
- Ternan, J.; Elmes, A.; Williams, A.; Hartley, R. Aggregate stability of soils in central Spain and the role of land management. Earth Surf. Process. Landf. 1996, 21, 181–193. [Google Scholar] [CrossRef]
- Rillig, M.C.; Mummey, D.L. Mycorrhizas and soil structure. New Phytol. 2006, 171, 41–53. [Google Scholar] [CrossRef] [PubMed]
- Cotrufo, M.F.; Wallenstein, M.D.; Boot, C.M.; Denef, K.; Paul, E. The Microbial Efficiency-Matrix Stabilization (MEMS) framework integrates plant litter decomposition with soil organic matter stabilization: Do labile plant inputs form stable soil organic matter? Glob. Chang. Biol. 2013, 19, 988–995. [Google Scholar] [CrossRef] [PubMed]
- Schutter, M.E.; Dick, R.P. Microbial community profiles and activities among aggregates of winter fallow and cover-cropped soil. Soil Sci. Soc. Am. J. 2002, 66, 142–153. [Google Scholar] [CrossRef]
- Mendes, I.; Bandick, A.; Dick, R.; Bottomley, P. Microbial biomass and activities in soil aggregates affected by winter cover crops. Soil Sci. Soc. Am. J. 1999, 63, 873–881. [Google Scholar] [CrossRef]
- Russell, A.E.; Raich, J.W.; Valverde-Barrantes, O.J.; Fisher, R.F. Tree species effects on soil properties in experimental plantations in tropical moist forest. Soil Sci. Soc. Am. J. 2007, 71, 1389–1397. [Google Scholar] [CrossRef]
- Sanford, R.L., Jr.; Paaby, P.; Luvall, J.C.; Phillips, E. Climate, geomorphology, and aquatic systems. In La Selva: Ecology and Natural History of a Neotropical Rain Forest; University of Chicago Press: Chicago, IL, USA, 1994; pp. 19–33. [Google Scholar]
- Sollins, P.; Sancho, F.; Ch, R.M.; Sanford, R.L., Jr. So//s and Soil Process Research. In La Selva: Ecology and Natural History of a Neotropical Rain Forest; University of Chicago Press: Chicago, IL, USA, 1994; p. 34. [Google Scholar]
- Porder, S.; Clark, D.A.; Vitousek, P.M. Persistence of rock-derived nutrients in the wet tropical forests of La Selva, Costa Rica. Ecology 2006, 87, 594–602. [Google Scholar] [CrossRef] [PubMed]
- Kleber, M.; Schwendenmann, L.; Veldkamp, E.; Rößner, J.; Jahn, R. Halloysite versus gibbsite: Silicon cycling as a pedogenetic process in two lowland neotropical rain forest soils of La Selva, Costa Rica. Geoderma 2007, 138, 1–11. [Google Scholar] [CrossRef]
- Chorover, J.; Sposito, G. Surface charge characteristics of kaolinitic tropical soils. Geochim. Cosmochim. Acta 1995, 59, 875–884. [Google Scholar] [CrossRef]
- Anda, M.; Shamshuddin, J.; Fauziah, C.; Omar, S.S. Mineralogy and factors controlling charge development of three Oxisols developed from different parent materials. Geoderma 2008, 143, 153–167. [Google Scholar] [CrossRef]
- Clark, D.B.; Clark, D.A. Landscape-scale variation in forest structure and biomass in a tropical rain forest. For. Ecol. Manag. 2000, 137, 185–198. [Google Scholar] [CrossRef]
- Kivlin, S.N.; Hawkes, C.V. Temporal and spatial variation of soil bacteria richness, composition, and function in a neotropical rainforest. PLoS ONE 2016, 11, e0159131. [Google Scholar] [CrossRef] [PubMed]
- Kivlin, S.N.; Hawkes, C.V. Tree species, spatial heterogeneity, and seasonality drive soil fungal abundance, richness, and composition in Neotropical rainforests. Environ. Microbiol. 2016, 18, 4662–4673. [Google Scholar] [CrossRef] [PubMed]
- Valverde-Barrantes, O.J.; Raich, J.W.; Russell, A.E. Fine-root mass, growth and nitrogen content for six tropical tree species. Plant Soil 2007, 290, 357–370. [Google Scholar] [CrossRef]
- Crosland, A.; Zhao, F.; McGrath, S.; Lane, P. Comparison of aqua regia digestion with sodium carbonate fusion for the determination of total phosphorus in soils by inductively coupled plasma atomic emission spectroscopy (ICP). Commun. Soil Sci. Plant Anal. 1995, 26, 1357–1368. [Google Scholar] [CrossRef]
- Kuo, S. Phosphorus. In Methods of Soil Analysis Part 3—Chemical Methods; Sparks, D.L., Page, A.L., Helmke, P.A., Loeppert, R.H., Eds.; Soil Science Society of America, American Society of Agronomy: Madison, WI, USA, 1996; pp. 869–919. [Google Scholar]
- Kingston, H.M.; Haswell, S.J. Microwave-Enhanced Chemistry; American Chemical Society: Washington, DC, USA, 1997. [Google Scholar]
- Díaz-Romeu, R.; Hunter, A. Metodologías de Muestreo de Suelos, Análisis Químico de Suelos y Tejido Vegetal y de Investigaciones en Invernadero; Centro Agronómico Tropical de Investigación y Enseñanza (CATIE): Cartago, Costa Rica, 1978. [Google Scholar]
- Thomas, G. Soil pH and soil acidity. In Methods of Soil Analysis Part 3—Chemical Methods; Soil Science Society of America, American Society of Agronomy: Madison, WI, USA, 1996; pp. 475–490. [Google Scholar]
- Brundrett, M.; Melville, L.; Peterson, L. Practical Methods in Mycorrhiza Research: Based on a Workshop Organized in Conjuction with the Ninth North American Conference on Mycorrhizae, University of Guelph, Guelph, Ontario, Canada; Mycologue Publications: Devon, UK, 1994. [Google Scholar]
- Sylvia, D.M. 3 Quantification of External Hyphae of Vesicular-arbuscular Mycorrhizal Fungi. In Methods in Microbiology; Elsevier: Amsterdam, The Netherlands, 1992; Volume 24, pp. 53–65. [Google Scholar]
- Scott-Denton, L.E.; Rosenstiel, T.N.; Monson, R.K. Differential controls by climate and substrate over the heterotrophic and rhizospheric components of soil respiration. Glob. Chang. Biol. 2006, 12, 205–216. [Google Scholar] [CrossRef]
- Brookes, P.; Landman, A.; Pruden, G.; Jenkinson, D. Chloroform fumigation and the release of soil nitrogen: A rapid direct extraction method to measure microbial biomass nitrogen in soil. Soil Biol. Biochem. 1985, 17, 837–842. [Google Scholar] [CrossRef]
- Littell, R.; Milliken, G.; Stroup, W.; Wolfinger, R. SAS Systems for Mixed Models; SAS Inst. Inc.: Cary, NC, USA, 1996. [Google Scholar]
- Neter, J.; Kutner, M.H.; Nachtsheim, C.J.; Wasserman, W. Applied Linear Statistical Models; Irwin Chicago: Chicago, IL, USA, 1996; Volume 4. [Google Scholar]
- Duiker, S.W.; Rhoton, F.E.; Torrent, J.; Smeck, N.E.; Lal, R. Iron (hydr) oxide crystallinity effects on soil aggregation. Soil Sci. Soc. Am. J. 2003, 67, 606–611. [Google Scholar] [CrossRef]
- Fierer, N.; Jackson, R.B. The diversity and biogeography of soil bacterial communities. Proc. Nat. Acad. Sci. USA 2006, 103, 626–631. [Google Scholar] [CrossRef] [PubMed]
- Prober, S.M.; Leff, J.W.; Bates, S.T.; Borer, E.T.; Firn, J.; Harpole, W.S.; Lind, E.M.; Seabloom, E.W.; Adler, P.B.; Bakker, J.D. Plant diversity predicts beta but not alpha diversity of soil microbes across grasslands worldwide. Ecol. Lett. 2015, 18, 85–95. [Google Scholar] [CrossRef] [PubMed]
- Barberán, A.; McGuire, K.L.; Wolf, J.A.; Jones, F.A.; Wright, S.J.; Turner, B.L.; Essene, A.; Hubbell, S.P.; Faircloth, B.C.; Fierer, N. Relating belowground microbial composition to the taxonomic, phylogenetic, and functional trait distributions of trees in a tropical forest. Ecol. Lett. 2015, 18, 1397–1405. [Google Scholar] [CrossRef] [PubMed]
- Van Miegroet, H.; Cole, D. The Impact of Nitrification on Soil Acidification and Cation Leaching in a Red Alder Ecosystem 1. J. Environ. Qual. 1984, 13, 586–590. [Google Scholar] [CrossRef]
- Essington, M. Soil and Water Chemistry: An Integrative Approach; CRC Press: Boca Raton, FL, USA, 2004. [Google Scholar]
Figure 1.
Effect of vegetation type on macroaggregate size distributions. (a) All size classes; (b) Detail of smaller size classes with significant differences denoted by letters.
Figure 1.
Effect of vegetation type on macroaggregate size distributions. (a) All size classes; (b) Detail of smaller size classes with significant differences denoted by letters.

Figure 2.
Effect of vegetation type on: (a) N concentrations (left y-axis) and C:N (right y-axis) and (b) Organic P (left y-axis) and Inorganic P (right y-axis).
Figure 2.
Effect of vegetation type on: (a) N concentrations (left y-axis) and C:N (right y-axis) and (b) Organic P (left y-axis) and Inorganic P (right y-axis).

Figure 3.
Fractions of C and N contained in macroaggregate size classes. Significant differences among size classes for C (left) are denoted by small letters, for N (right) by capital letters.
Figure 3.
Fractions of C and N contained in macroaggregate size classes. Significant differences among size classes for C (left) are denoted by small letters, for N (right) by capital letters.

Figure 4.
Fractions of organic and inorganic P contained in macroaggregate size classes. Significant differences among size classes for organic P (left) are denoted by small letters, for inorganic P (right) by capital letters.
Figure 4.
Fractions of organic and inorganic P contained in macroaggregate size classes. Significant differences among size classes for organic P (left) are denoted by small letters, for inorganic P (right) by capital letters.

Figure 5.
Correlations between soil pH and C contained in macroaggregates. (a) Data are for the smallest size fractions, 0.25–0.50 mm and (b) Size fractions 0.5–1.0 mm.
Figure 5.
Correlations between soil pH and C contained in macroaggregates. (a) Data are for the smallest size fractions, 0.25–0.50 mm and (b) Size fractions 0.5–1.0 mm.

Table 1.
Statistical results (p values) for analysis of macroaggregates by size class.
| Response Variable | Explanatory Variable | ||
|---|---|---|---|
| Size (S) | Vegetation (V) | S × V | |
| Fraction (g g−1 dry soil) 1 | <0.0001 | 0.8952 | 0.0012 |
| C (g kg−1) | 0.3155 | 0.0781 | 0.9935 |
| N (g kg−1) | 0.7791 | 0.0478 | 0.9984 |
| C:N | 0.0420 | 0.0024 | 0.9367 |
| Inorganic P (mg kg−1) 2 | 0.7682 | 0.0008 | 0.9750 |
| Organic P (mg kg−1) | 0.9019 | 0.0006 | 0.9998 |
| C Fraction (gC g−1 dry soil) | <0.0001 | 0.5782 | 0.2863 |
| N Fraction (gN g−1 dry soil) | <0.0001 | 0.2100 | 0.3230 |
| Inorganic P Fraction (gP kg−1 dry soil) | <0.0001 | 0.0039 | 0.8511 |
| Organic P Fraction (gP kg−1 dry soil) | <0.0001 | 0.0003 | 0.7911 |
1 ‘Fraction’ refers to the proportion of the total dry soil contained with a given size class of macroaggregate. 2 For P, only the three largest size categories (4–8, 2–4, and 1–2 mm) were included in the analysis due to insufficient material in the two smallest size classes.
Table 2.
Relationships between macroaggregate size fractions (g g-1 dry soil) and four biological factors.
Table 2.
Relationships between macroaggregate size fractions (g g-1 dry soil) and four biological factors.
| Explanatory Variables 1 | Macroaggregate Size Class (mm) | ||||
|---|---|---|---|---|---|
| 4–8 | 2–4 | 1–2 | 0.5–1.0 | 0.25–0.50 | |
| p-value 2 | |||||
| Hyphae in Aggregates | 0.2185 | 0.9067 | 0.4062 | 0.6491 | 0.9383 |
| Microbial Biomass C | 0.7711 | 0.7080 | 0.2663 | 0.7559 | 0.2316 |
| Fine Root Growth | 0.0013 | 0.8827 | 0.0077 | 0.7732 | 0.5268 |
| Al in Litterfall | 0.7450 | 0.1382 | 0.4991 | 0.1079 | 0.0201 |
1 The variables included: fungal hyphae within macroaggregates (mm g−1 dry soil); microbial biomass C (μg C g−1 dry soil); fine root growth (cm cm−2 yr−1); and Al flux in litterfall (kg Al ha−1 yr−1). All belowground measurements are for the 0–15 cm depth interval. 2 The p values are results of partial regression analysis (n = 23 plots).
Table 3.
Relationships between macroaggregate fractions (g g−1 dry soil) and soil pH.
| Test Statistic | Macroaggregate Size Class (mm) | ||||
|---|---|---|---|---|---|
| 4–8 | 2–4 | 1–2 | 0.5–1.0 | 0.25–0.50 | |
| p | 0.5240 | 0.4122 | 0.5489 | 0.0563 | 0.0055 |
| r | 0.1400 | 0.1794 | 0.1319 | 0.4032 | 0.5595 |
© 2018 by the authors. Licensee MDPI, Basel, Switzerland. This article is an open access article distributed under the terms and conditions of the Creative Commons Attribution (CC BY) license (http://creativecommons.org/licenses/by/4.0/).
Share and Cite
MDPI and ACS Style
Russell, A.E.; Kivlin, S.N.; Hawkes, C.V. Tropical Tree Species Effects on Soil pH and Biotic Factors and the Consequences for Macroaggregate Dynamics. Forests 2018, 9, 184. https://doi.org/10.3390/f9040184
AMA Style
Russell AE, Kivlin SN, Hawkes CV. Tropical Tree Species Effects on Soil pH and Biotic Factors and the Consequences for Macroaggregate Dynamics. Forests. 2018; 9(4):184. https://doi.org/10.3390/f9040184
Chicago/Turabian StyleRussell, Ann E., Stephanie N. Kivlin, and Christine V. Hawkes. 2018. "Tropical Tree Species Effects on Soil pH and Biotic Factors and the Consequences for Macroaggregate Dynamics" Forests 9, no. 4: 184. https://doi.org/10.3390/f9040184
Note that from the first issue of 2016, this journal uses article numbers instead of page numbers. See further details here.