Seed Dispersal, Microsites or Competition—What Drives Gap Regeneration in an Old-Growth Forest? An Application of Spatial Point Process Modelling

1
Institute of Forest Ecology, Department of Forest- and Soil Sciences, BOKU—University of Natural Resources and Life Sciences, 1190 Vienna, Austria
2
Department of Mathematical Sciences, Aalborg University, 9100 Aalborg, Denmark
*
Author to whom correspondence should be addressed.
Forests 2018, 9(5), 230; https://doi.org/10.3390/f9050230
Submission received: 8 February 2018
/
Revised: 29 March 2018
/
Accepted: 23 April 2018
/
Published: 27 April 2018
(This article belongs to the Special Issue Old Growth Temperate and Boreal Forests: Processes, Functions, and Dynamics)
Abstract
:The spatial structure of trees is a template for forest dynamics and the outcome of a variety of processes in ecosystems. Identifying the contribution and magnitude of the different drivers is an age-old task in plant ecology. Recently, the modelling of a spatial point process was used to identify factors driving the spatial distribution of trees at stand scales. Processes driving the coexistence of trees, however, frequently unfold within gaps and questions on the role of resource heterogeneity within-gaps have become central issues in community ecology. We tested the applicability of a spatial point process modelling approach for quantifying the effects of seed dispersal, within gap light environment, microsite heterogeneity, and competition on the generation of within gap spatial structure of small tree seedlings in a temperate, old growth, mixed-species forest. By fitting a non-homogeneous Neyman–Scott point process model, we could disentangle the role of seed dispersal from niche partitioning for within gap tree establishment and did not detect seed densities as a factor explaining the clustering of small trees. We found only a very weak indication for partitioning of within gap light among the three species and detected a clear niche segregation of Picea abies (L.) Karst. on nurse logs. The other two dominating species, Abies alba Mill. and Fagus sylvatica L., did not show signs of within gap segregation.
1. Introduction
The spatial patterns of plants are thought to carry information on the processes that led to their formation. Unlocking this information, however, is far from trivial and is an age-old task in plant ecology [1,2,3,4]. It is not only the variety of influencing processes acting and the interaction at different spatial and temporal scales that makes the identification and interpretation of processes leading to a certain spatial structure very difficult [3,4], but also the fact that different drivers may create similar patterns and similar processes may create different patterns in different settings. This has spurred statistical research and the presentation and discussion of various spatial point processes [5,6,7,8]. Modelling of a spatial point process was recently used to identify factors driving spatial distribution of trees at stand scales [9,10,11,12]. For a review, see Velázquez et al. [13].
Old growth forests in particular, with their high structural complexity [14,15,16] and a resulting higher heterogeneity in resource distribution, pose strong challenges to understanding pattern generation. Yet, the functioning of these forests is increasingly seen as a model for the sustainable and resilient provision of ecosystem services [17]. Improving the understanding of drivers of dynamics in such forests contributes towards these goals.
Apart from the differential responses of plants to heterogeneities in belowground resources, disturbances are major factors in triggering the reorganization and creation of forest spatial structure. Disturbances, however, not only create a dichotomous “Swiss-cheese” like distribution of higher resource availabilities within disturbed areas and lower ones in the forest matrix, but create specific and heterogeneous combinations of resource availabilities at fine, within gap, scales [18,19,20]. If such differences lead to resource partitioning and allows for coexistence of tree species has become a matter of debate and a central issue in the community ecology of tropical forests [21,22,23,24,25]. In temperate mixed species forests, lower species diversity and the resulting higher density of mother trees render recruitment limitation less common. This increases the importance of niche partitioning and trade-offs for species coexistence [22,26]. Within gap variation of resources may be influenced by differences in the light availability and by different substrates and micro topographies, which provide certain combinations of soil nutrient and soil water levels. The small spatial extent of these microsites limits their potential role in influencing tree seedling survival to the early life stages of trees where roots do not extend beyond these patches. Increased survivorship of young trees on certain microsites was found in a number of studies [27,28,29,30,31,32,33,34,35,36]. When the survivorship rates of species differ on these microsites, differential mortality results in a spatial segregation of species. This decreases interspecific competition and is thought to support multi-species coexistence [26,37].
Within-gap processes, however, are not only characterized by responses to different resource levels. The size of species pools, influenced by seed dispersal and the presence of seedling and sapling banks, is a template from which establishment as well as neighborhood processes unfold. Consequently, it must be considered when studying within gap processes. To our knowledge, the combined effect of dispersal and within-gap resource gradients, microsites, and competition on the spatial structure of tree seedlings in gaps has not yet been quantified.
Statistically, the spatial pattern of plants is a realization of a spatial point process. Recent advances in spatial statistics allow for applications of non-homogenous point process models that model the probability of spatial events depending on a set of spatial covariates [5,7,8,38].
Provided that the spatial distribution of these covariates in the study is known, this allows for inclusion of environmental and biotic factors. The parameter estimates would then allow for an assessment of the strength of these factors in determining event probabilities, such as tree occurrence in a given location.
Our objective in this paper is to parameterize a spatial point process model and test its applicability for quantifying the combined seed dispersal, within gap light environment, microsite heterogeneity, and competition on the generation of within gap spatial structure of small tree seedlings in a temperate old growth, mixed-species forest. We specifically aim at answering the following questions: does the spatial modelling approach allow for (i) disentangling spatial structure of tree seedlings in terms of seed densities, within gap resources, or competition; and (ii) characterization of partitioning of light and microsites as a determinant for the bivariate spatial structure of seedlings of the studied tree species.
2. Materials and Methods
2.1. Study Area
The study area is located in the Northern Limestone Alps of Lower Austria at an elevation of 900 to 1400 m asl (47°47′ N, 15°04′ E). We investigated the Rothwald old-growth forest, which is situated in a basin, surrounded by steep slopes. The climate is submaritime to subcontinental with long winters and short, cool summers. Due to its position within the northern outposts of the Alps, the area receives high precipitation (ca. 2200 mm annual precipitation) (Roller cit. in Zukrigl et al. [39]. Annual precipitation pattern is bimodal with maxima during the summer and winter months [39]. Deep, wet, and long-lasting snow cover shortens the growing season. The bedrock is comprised of dolomite and banked limestone. Soils are a mosaic of Rendzinas and relictic loams (Rendzic Leptosols and chromic Cambisols) [34]. Forests are classified as Asperulo–Abieti–Fagetum, a higher altitude subtype of a Galio–odorati–Fagetum and Adenostylo–glabrae–Fagetum [40]. Fagus sylvatica dominates on all sites but more on the slopes. Generally, Picea abies (L.) Karst. and Abies alba Mill. grow 10 to 15 m taller (up to 58 m) than F. sylvatica L., forming a distinctly two-layered upper canopy [39,41].
2.2. Data Collection
The study was conducted using data from a 100 m × 100 m permanent study plot (PSP) installed in 1980 [36]. It is situated in the lower and flatter, conifer-richer portion of the forest. In winter 1990, a gap was formed roughly in the center of the plot by a windstorm (Figure 1, expanded gap area sensu [42]). In 2001, diameter at breast height (dbh) was recorded for all trees >1 cm in dbh. In the center of the plot, we installed a 20 m × 20 m regeneration subplot. The subplot covered the larger part of a gap created in 1990 and reached into closed canopy areas, thus covering a light gradient from the center of the gap into the canopy (Figure 1). We recorded the location of all seedlings in the plot and measured height to the nearest cm. We recorded micro-morphology (convex, equal, and concave) of seedlings in two categories: less and more than 50 cm height difference in relation to the surrounding area (a circle with one m radius). We characterized microsites at which seedlings were established in terms of the composition of the L-layer (the humus layer where the structure of vegetation is still discernible) of the ectohumus (beech litter, conifer litter, mixed litter) and their cover (bryophytes, rhizomes of grasses, bare mineral soil, bryophyte covered boulders) and nurse logs. For micromorphology, the two depth categories were grouped together in order to reduce the complexity of the covariate. Data were recorded for a total of 1180 seedlings (231 P. abies, 421 A. alba and 528 F. sylvatica). To reduce temporal variation, we only included seedlings less than 50 cm height in our analysis. Both micromorphology and microsite types were also recorded in a 1 m × 1 m grid in the 20 m × 20 m plot.
In the same plot, the light environment was characterized by taking hemispherical photographs with a digital camera (Nikon D3100, Nikon, Tokio, Japan, Circular Fisheye: Sigma 4.5 mm, F2.8 EX DC, Kanagawa, Japan) in a 2 m × 2 m grid. The photographs were taken under overcast sky conditions in order to achieve even illumination and to avoid reflections. Photographs were taken at a height of 1 m. Digital images were processed using Hemiview version 2.1, Delta-T Devices, Cambridge, UK [43] in order to obtain the Global Site Factor (GSF, [44]). The GSF integrates the percentage of diffuse and direct solar radiation reaching a particular point for a whole year. Since seedlings larger than 50 cm (the maximum size of seedlings included in this analysis), and smaller than 150 cm are either not or only weakly represented in the hemispherical photographs, we included these seedlings as spatial covariate in the analysis.
To obtain seed density data, we used an inverse modelling approach following [45]. Seed density functions were calibrated by relating seed density data with the spatial distribution of potential mother trees using maximum likelihood functions. The “recruits” model [45] was parameterized using seed densities generated from 81 seed traps located in a grid at a 100 m × 100 m permanent sample plot close to PSP 1. Seed densities were recorded weekly from the beginning of September until the end of November 2003 (for F. sylvatic and A. alba) and in May 2004 soon after the snow melt (for P. abies). For the dispersal functions, we used Weibull kernels. The parameterization of the recruits model is described in [46].
Mean dispersal distances of P. abies, A. alba and F. sylvatica were 39 m, 23 m, and 6 m, respectively (Table 1). Seed density maps were calculated in a grid of one m2 based on the spatial distribution of mother trees in PSP 1.
2.3. Statistical Analysis
In order to quantify the influence of the various covariates on the spatial structure of the seedlings, we fit non-homogeneous intensity functions to seedling point patterns for each species. The intensity functions are of log-linear form:
where the sum in Equation (1) contains regression terms for the covariates seed density m−2 SD, micromorphology MM, cover of microsites MC, percentage of above canopy light L (%), density of seedlings between 50 and 150 cm height m−2 DSL, and all pairwise interactions.
For statistical analyses based on point processes, it is important to specify the observation window—i.e., the area where points can potentially occur. Since no seedlings occurred on concave microsites, we excluded concave locations from the observation window. Parameter estimates associated with concave micro-topography would otherwise tend towards minus infinity, and empirical L-functions would be biased.
Using a stepwise approach and assuming that the point patterns are realizations of non-homogeneous Poisson processes, non-significant interactions were removed from the model. We did not find significant differences between planar and convex micromorphology for many of the species encountered. Consequently, we grouped these two micro-topographies for further analysis. Hence for micromorphology only one parameter remains that describes the difference between nurse-logs and convex/equal. Similarly, the ectohumus-types were grouped into two classes (litter and lignomoder; bryophyte-covered boulders).
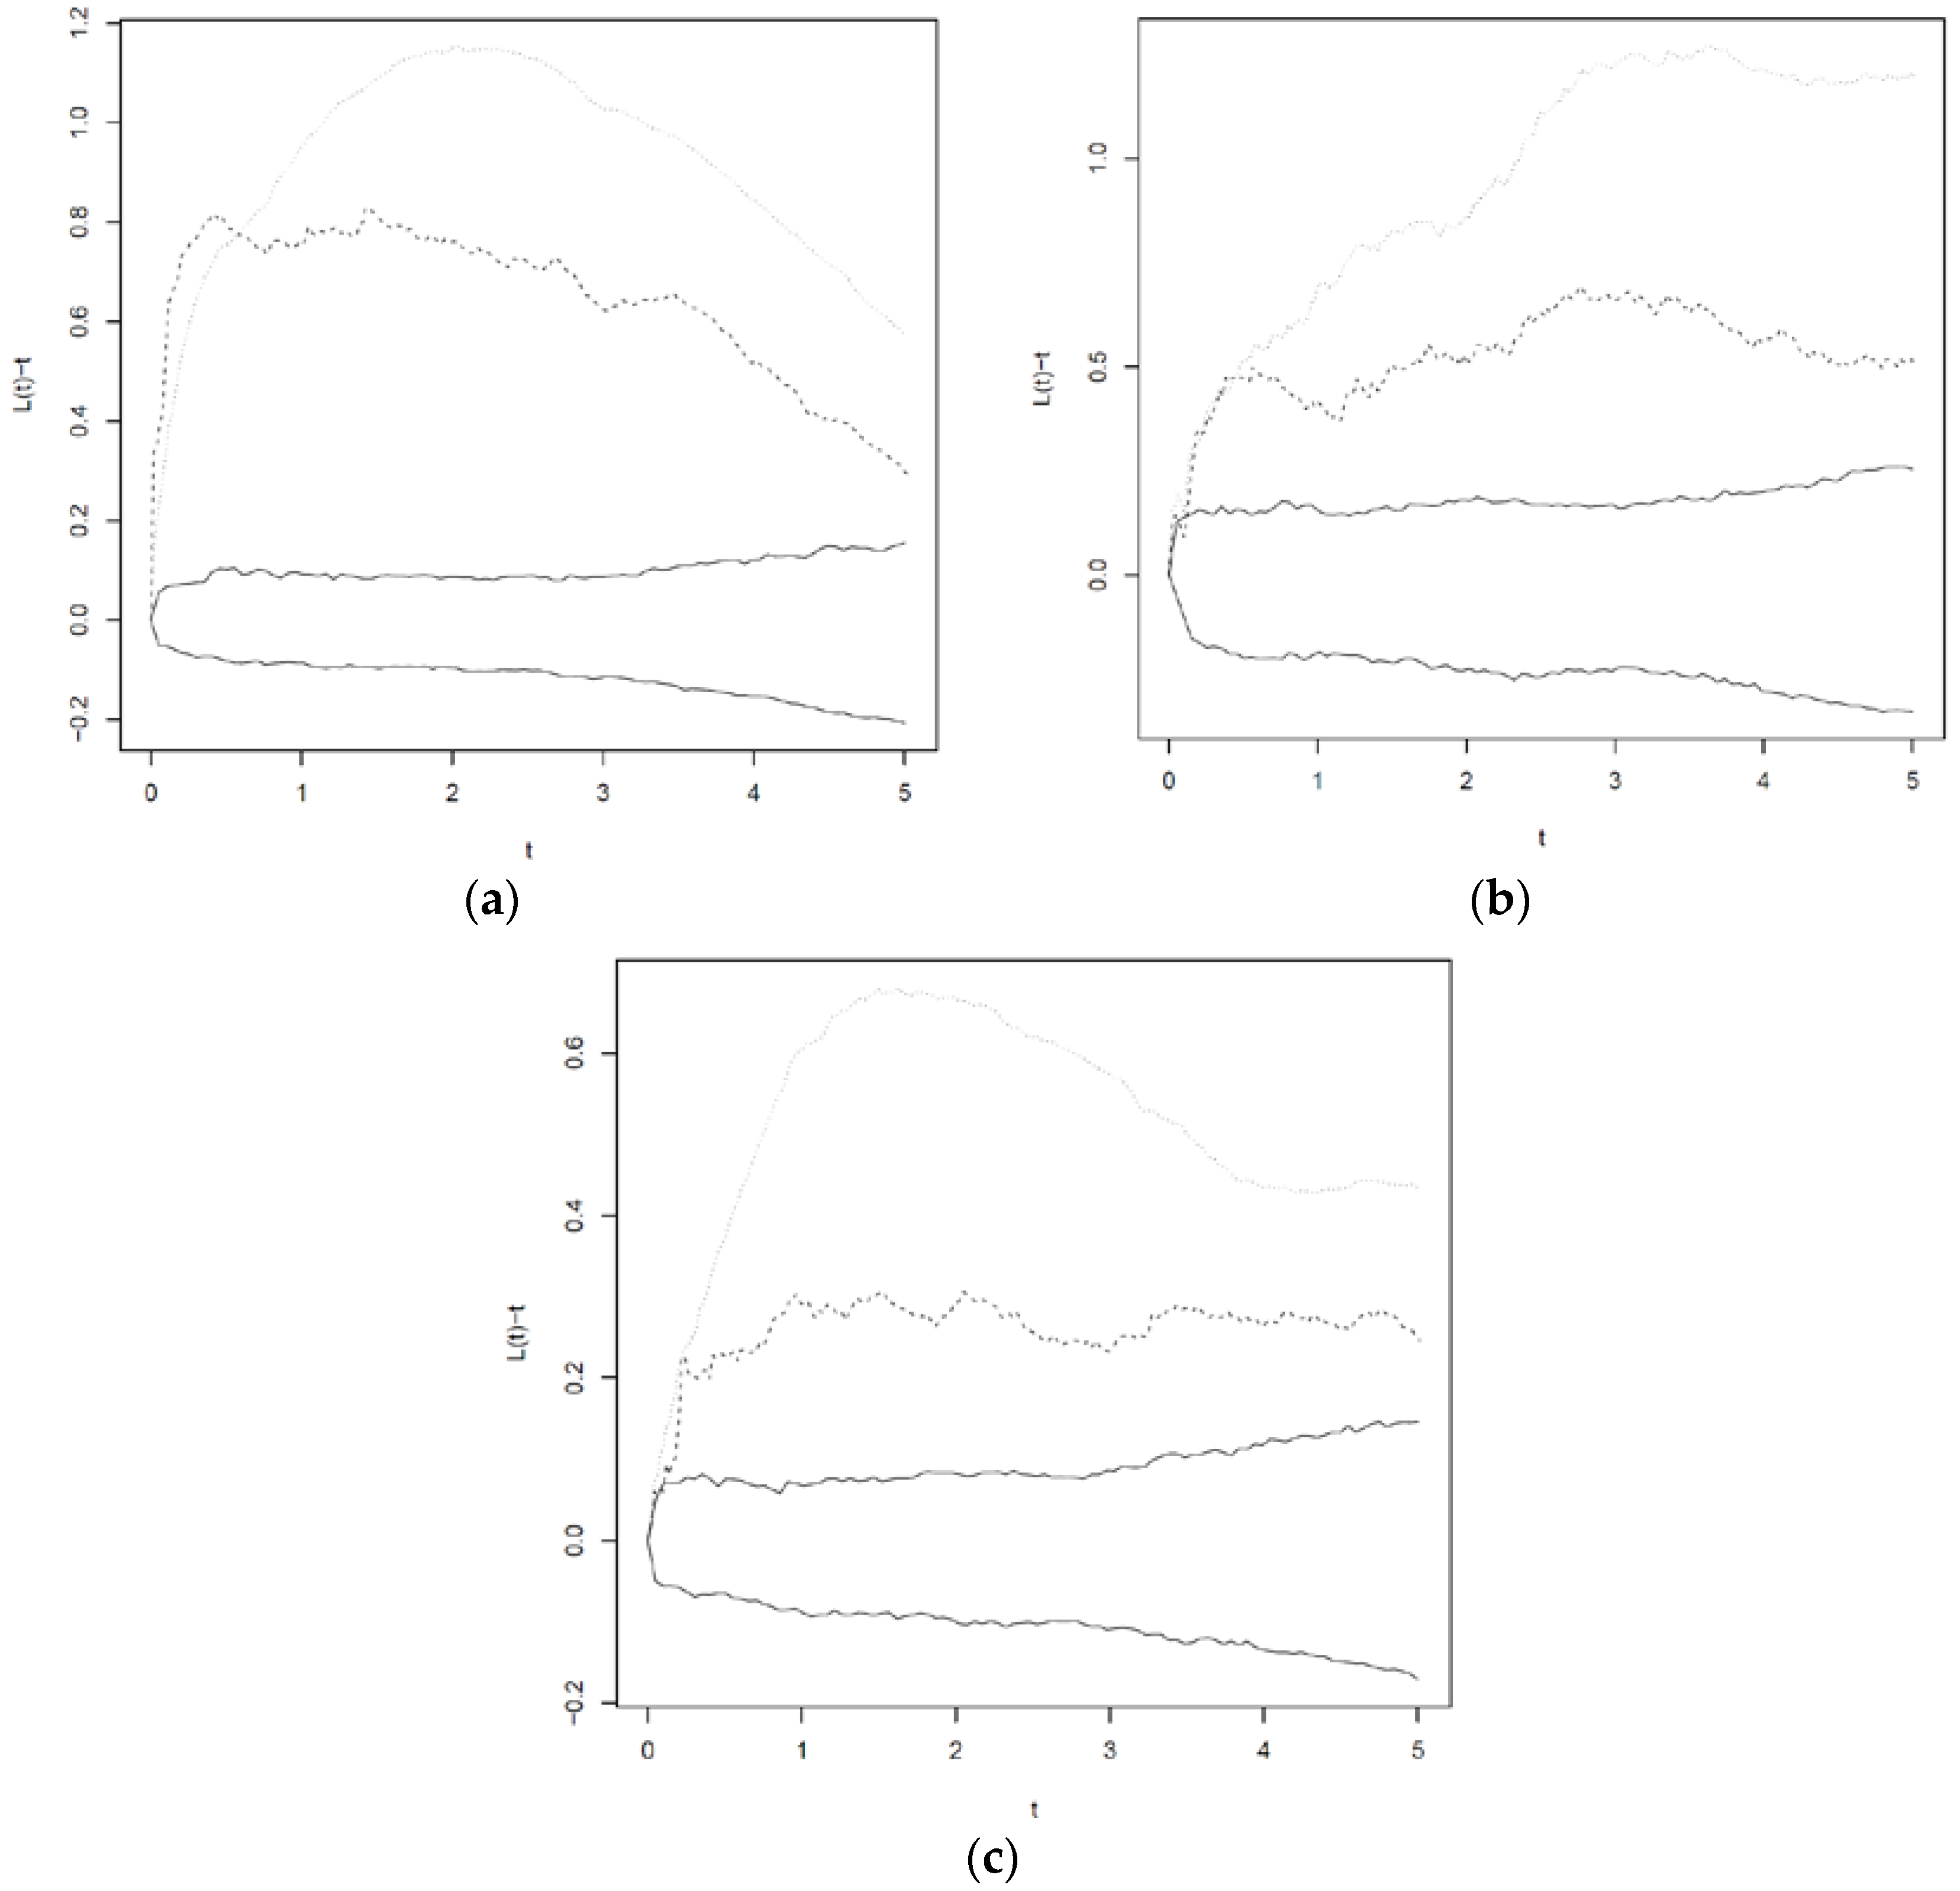
Following the approach described by [47], we applied empirical L-functions adjusted for non-homogeneous intensity. For P. abies and F. sylvatica, the L-functions accounting for the non-homogeneous intensity functions indicated less clustering than the L-functions obtained with a constant intensity (Appendix A). However, an extra Poisson clustering remained for all species. This indicates that it is not appropriate to consider the data as realizations of non-homogeneous Poisson processes with the given intensity functions. It also means that some terms were incorrectly classified as significant in the initial analysis, since failure to consider clustering leads to the underestimation of the parameter standard errors.
Based on a parametric expression for the L-functions quantifying the degree of clustering, it is possible to adjust the standard errors to take the clustering into account following [48]. Specifically, we considered the L-function for a so-called non-homogeneous Neyman–Scott point process (INSP). This type of point process may be viewed as a thinning of a homogeneous Neyman–Scott, obtained as the union of offspring clusters centered on parent points from a homogeneous Poisson process. Based on probabilities proportional to the intensity function (given as in Equation (1)), the offspring are then retained or removed independently of each other, thus introducing non-homogeneity controlled by the covariates. In our application, the number of offspring in each cluster is Poisson-distributed and before thinning, the offspring are distributed around the parent point according to a bivariate normal density. As discussed in [10], only the expression for the L-function matters regarding the parameter standard errors—not the specific point process model generating the L-functions. Parameters of the INSP L-functions were estimated using least squares estimation based on integrated squared differences between the parametric and the empirical L-functions. Adjusted parameter standard errors and confidence intervals were obtained using the fitted L-functions and the significance of the covariates were reassessed based on the adjusted confidence intervals. To study interactions between the species, empirical cross-L functions (both with and without adjusting for inhomogeneity) were applied. Confidence bands for the cross-L functions were obtained using simulations from the fitted INSP models.
3. Results
3.1. The Spatial Covariates
Site characteristics of PSP 1 are presented in [49], spatial patterns of trees and the location of the studied gap are shown in Figure 1. Most of the area in the plot had planar and convex micro-morphology (66%), 21% of the plot was concave and nurse logs covered 13%. The density of seedlings on the different micro-morphology classes is presented in Table 2. P. abies had the highest densities on nurse logs while A. alba and F. sylvatica had predominantly established on equal and convex micro-morphologies.
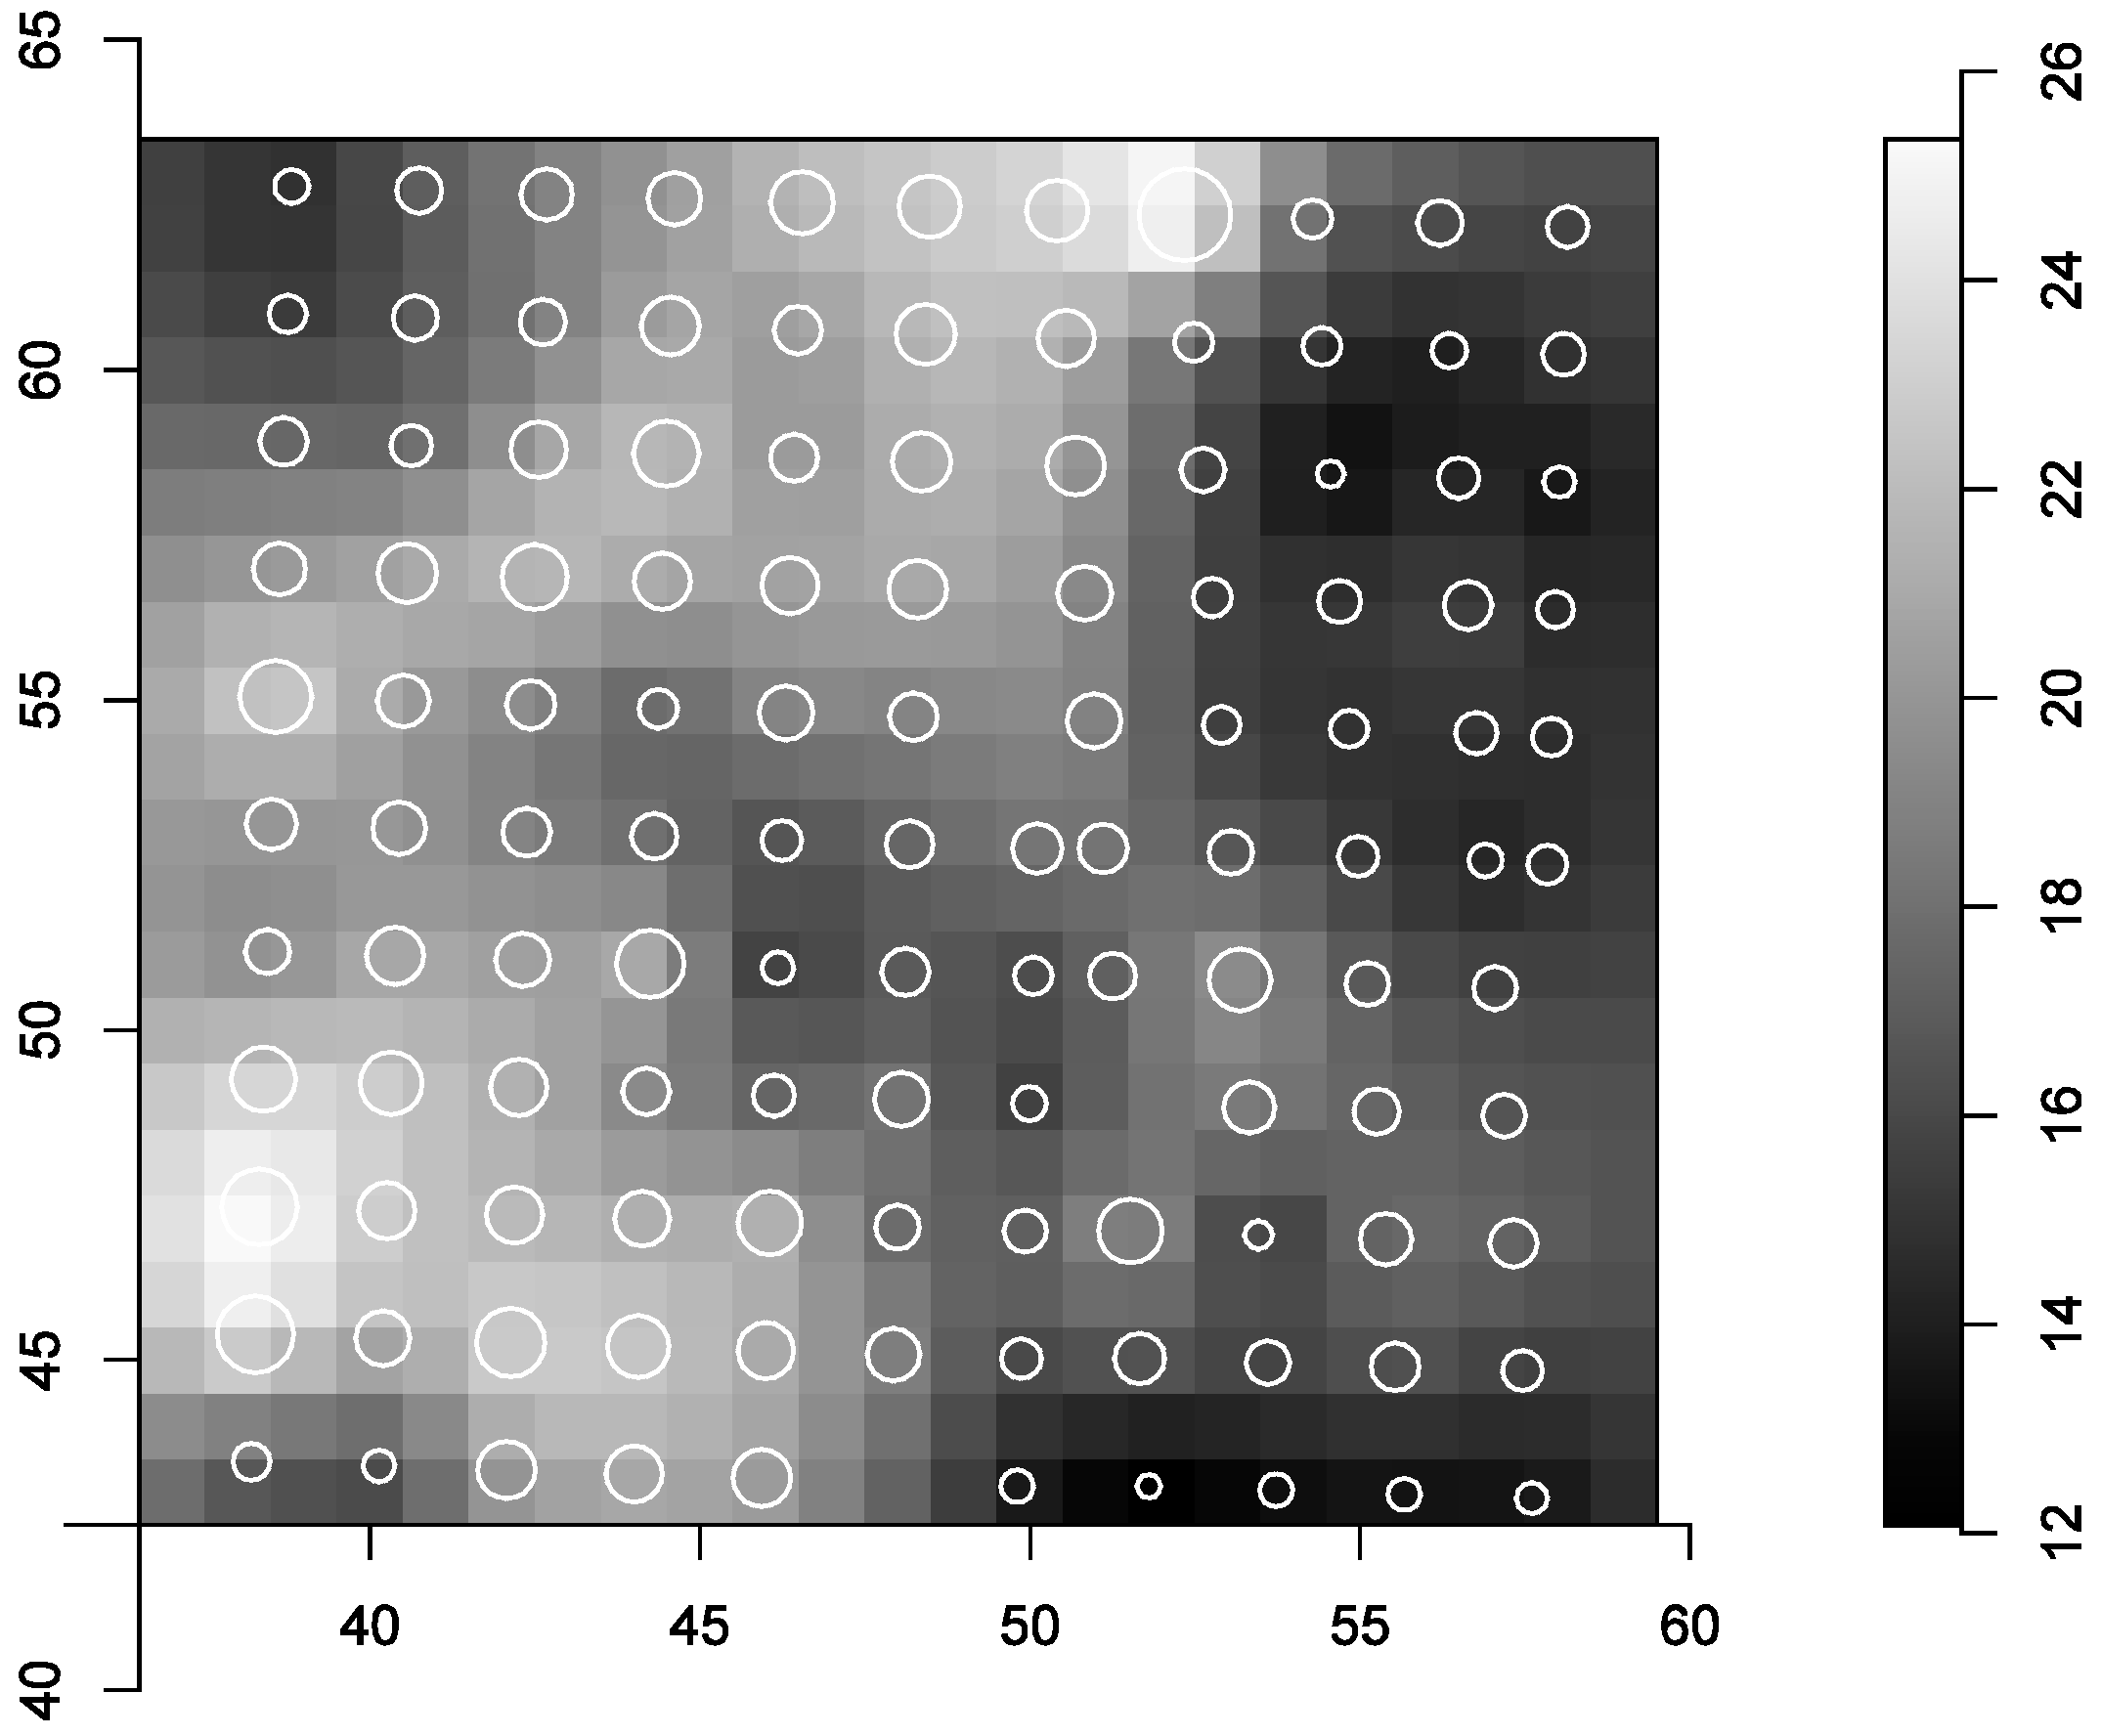
The average light level in the subplot was 18% (±4%) of open area radiation, minimum and maximum light levels were 9% and 35%, respectively (Figure 2). The circles are scaled to the percentage of above canopy light at the respective grid points.
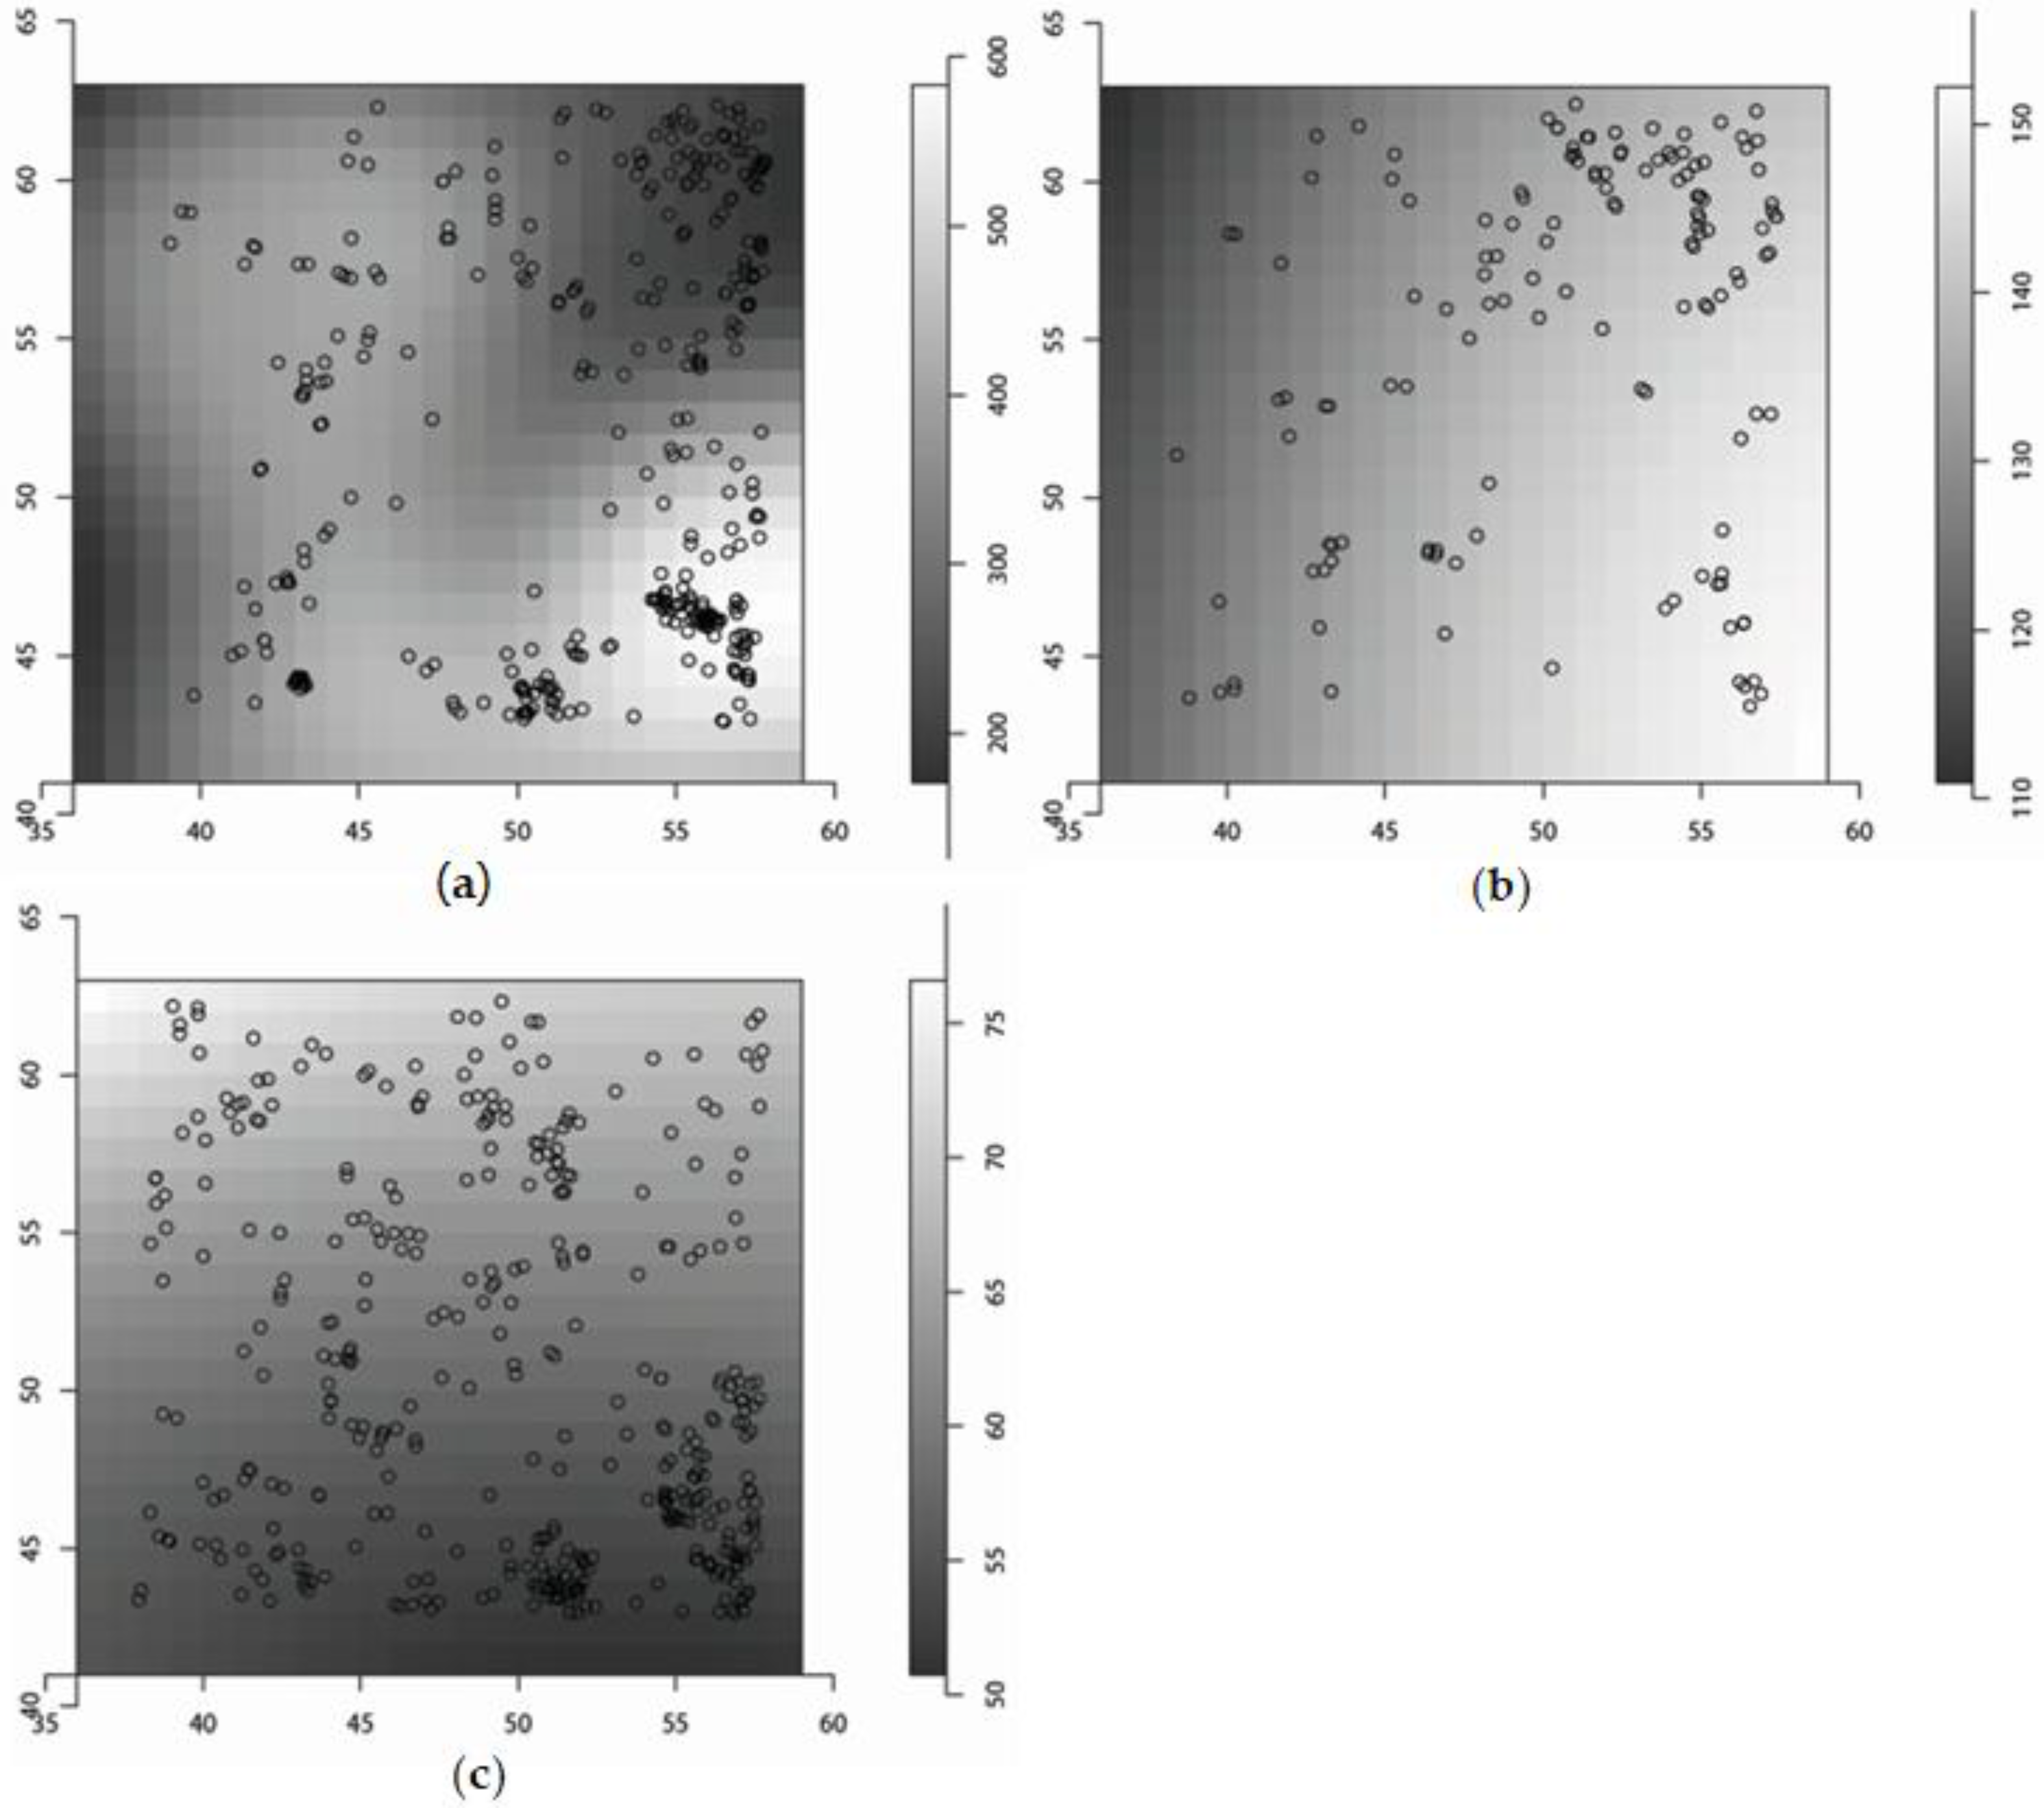
The model parameters for the seed density estimates are presented in Table 2. The median seed densities per m2 were 233, 68 and 112 for F. sylvatica, A. alba and P. abies, respectively, none of the squares was without seeds for all three species (Figure 3). The pooled density of tree seedlings of all three species between 50 cm and 150 cm height was 0.46 m−2, their spatial distribution is presented in Figure 4.
3.2. Parameter Estimates
For P. abies, nurse logs and DSL had positive parameters; the former parameter underlines the strong occurrence of spruce on nurse logs (Table 3). For this species, a negative interaction between nurse logs and DSL was detected, showing that the strength of the nurse log effect decreases with increasing DSL and vice versa. The parameter estimates for A. alba were negative for nurse logs and bryophyte covered boulders as well as slightly negative for DSL. For small F. sylvatica, parameter estimates for bryophyte covered boulders were strongly negative. The same was true for the light levels, even though the parameter estimate was smaller. In contrast to small beeches, large beeches had a strongly negative parameter for nurse logs and, less negative, for bryophyte covered boulders. Light had a less negative parameter estimate as compared to small beeches (Table 3).
3.3. Cross L—Functions
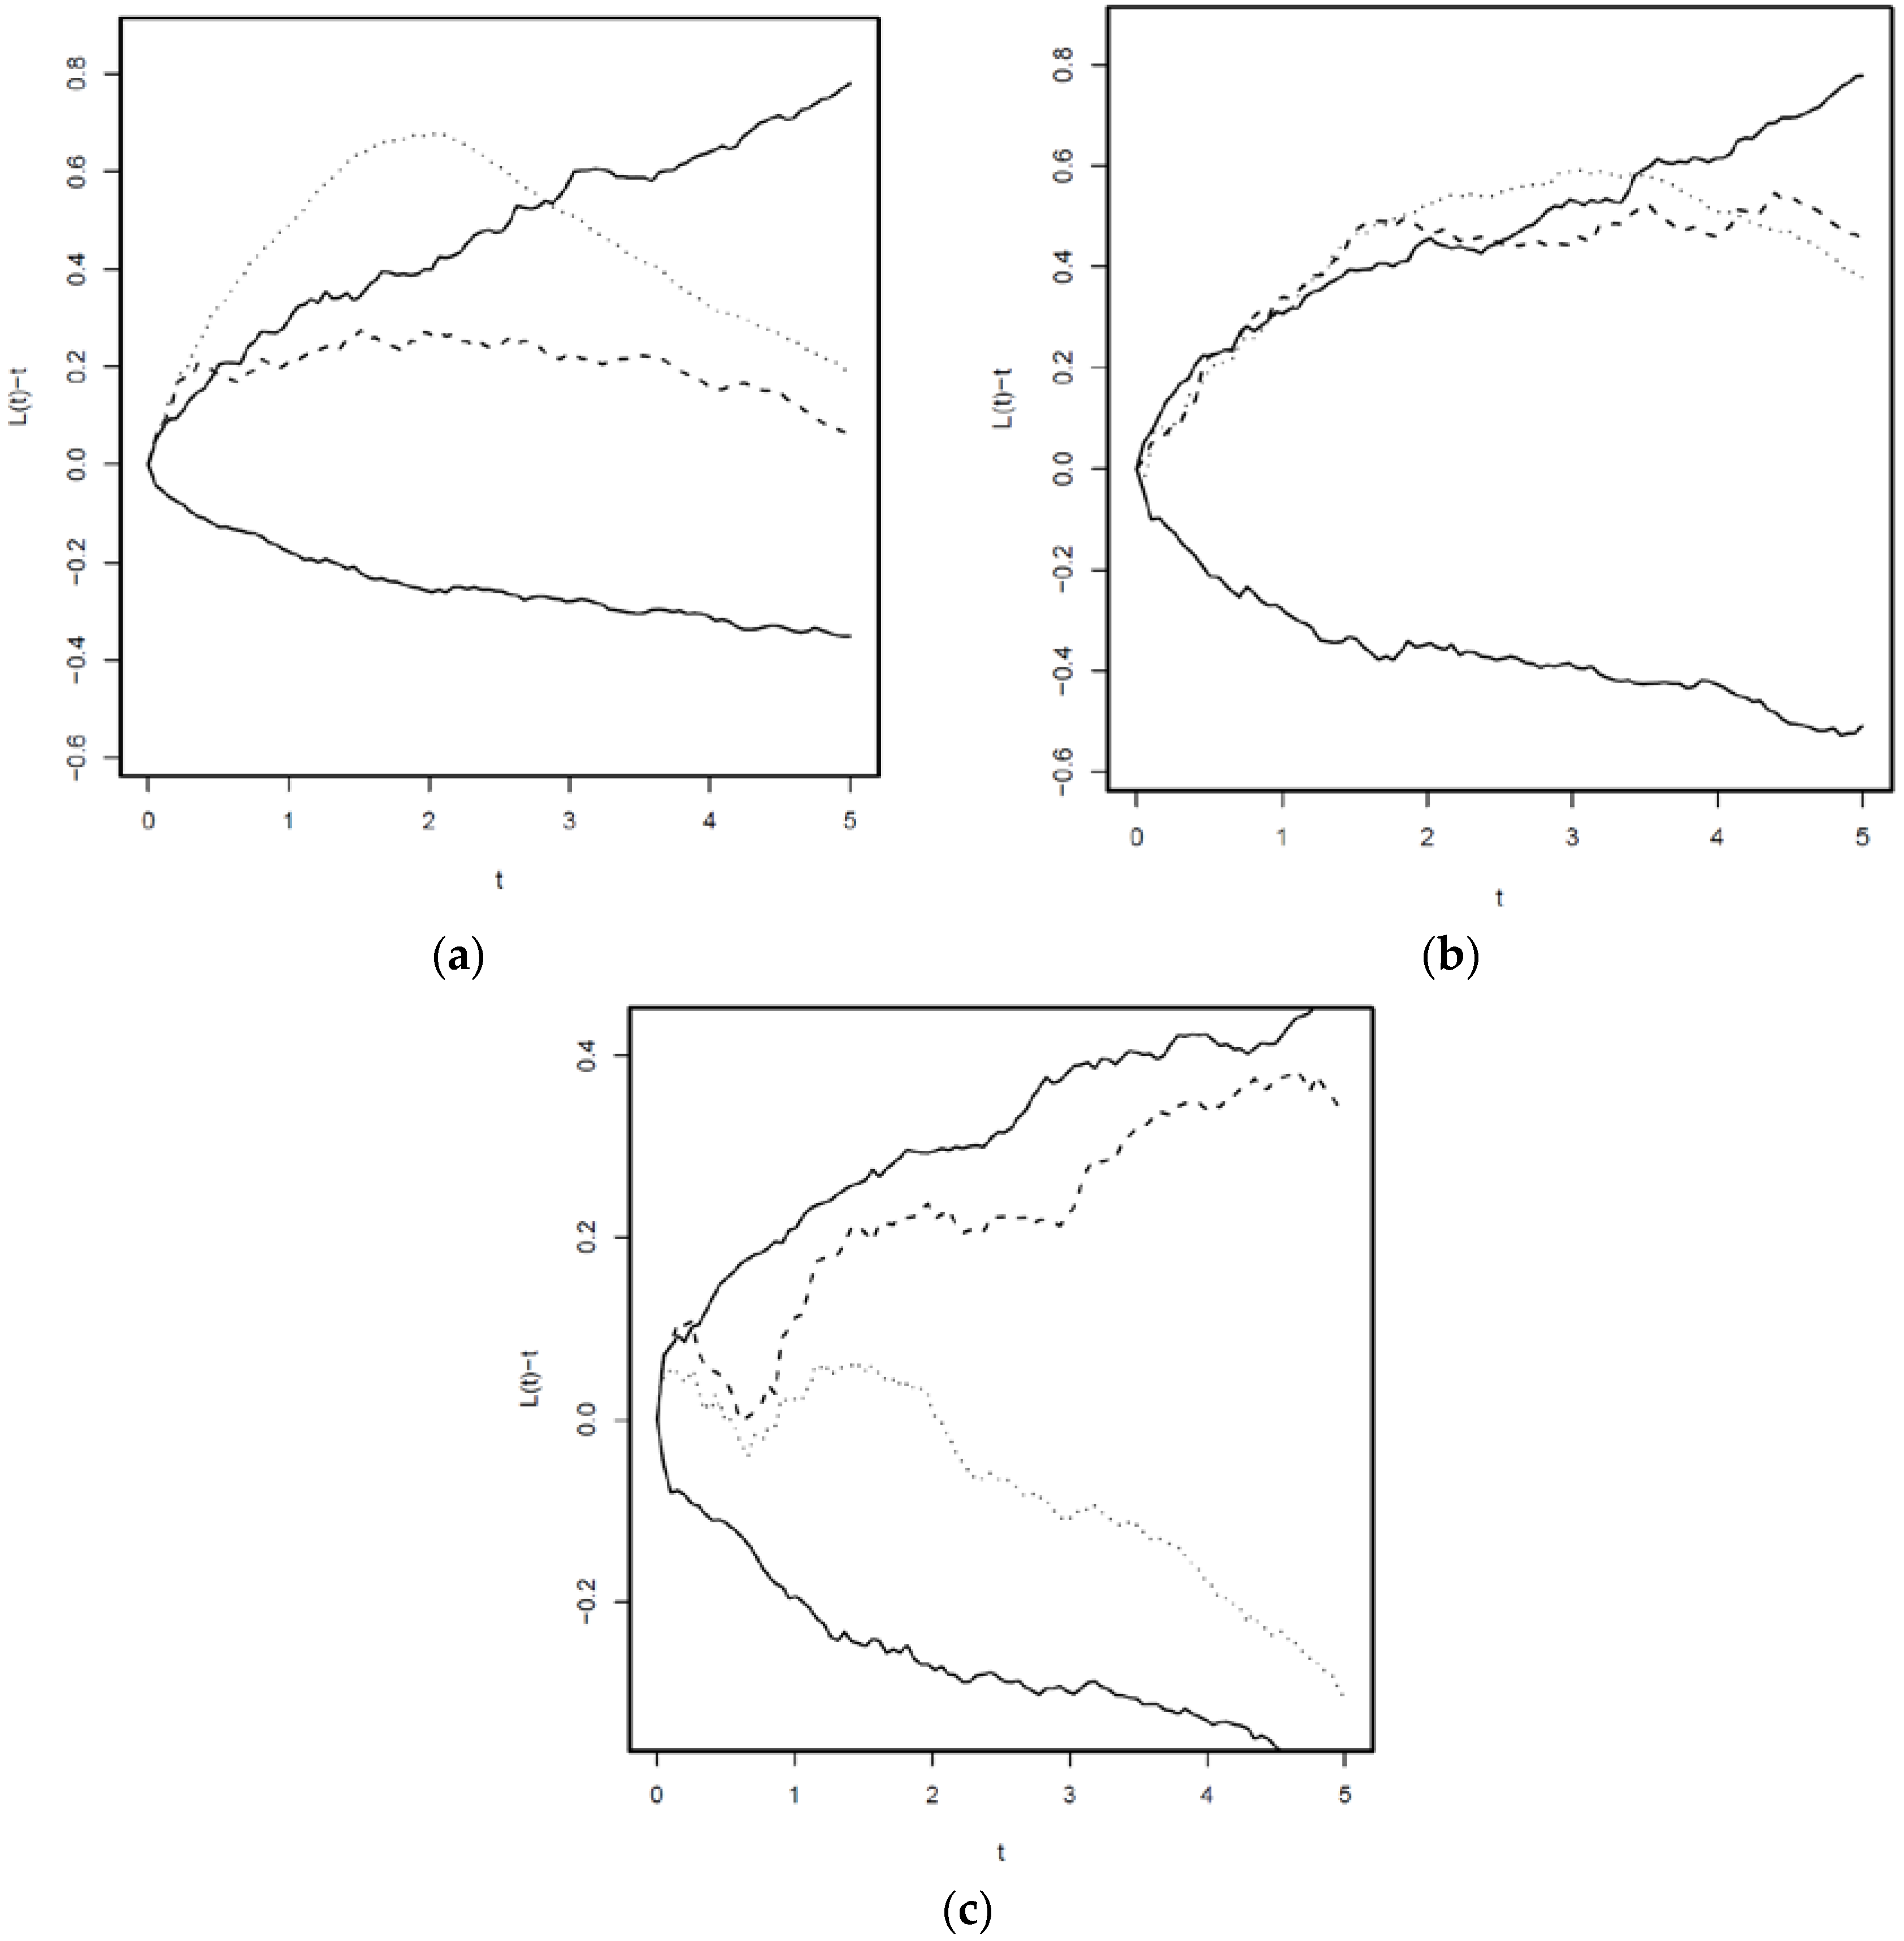
The homogeneous L-function showed strong aggregation of F. sylvatica with A. alba, but only weak signs of aggregation after adjusting for the inhomogeneous intensity function (Figure 5). For F. sylvatica versus P. abies, there was only weak evidence of aggregation regardless of whether one adjust for the inhomogeneous intensity or not. There is no evidence of aggregation between A. alba and P. abies.
4. Discussion
4.1. Quantifying Pattern Generating Factors with a Poisson Cluster Model
Using our set of spatial co-variates (seed density, percentage of above canopy light, micromorphology, cover of microsites, density of seedlings between 50 and 150 cm height), we could account for the within gap clustering of small tree seedlings by fitting a non-homogeneous Neyman–Scott point process model. Since we did not include a temporal component in this analysis, we restricted the work to small seedlings in order to reduce temporal variation in resources and seed availability. As with previous research on spatial point patterns [5,50,51], and due to the high sampling effort and the spatial resolution required for the study, we restricted our measurements to a single plot. This certainly limits the scope of the study in terms of the applicability of its ecological findings. Results from a study on the role of pit and mound topography created by windthrow disturbances in the Rothwald old growth forest [52], however, confirmed the findings of this study in terms of the role of microsites for tree regeneration. With the approach tested in this study, we were not only able to disentangle the role of niche partitioning and seed dispersal but also to identify the habitat factors driving establishment in gaps.
4.2. The Role of Seed Dispersal Versus Environmental Heterogeneity
We did not detect seed limitation in the gap we investigated, which is consistent with general notions on the less important role of seed limitation in temperate compared to tropical forests [22,26,53]. The finding was not surprising even for the short disperser F. sylvatica given that the density of F. sylvatica was high in the surrounding of the gap and that single trees in the gap survived the gap formation event. Furthermore, F. sylvatica is highly shade tolerant and seedlings continue to establish and die even under closed canopy conditions in a short rotation, thus maintaining a seedling bank [54]. Hence, the chance that seedlings of F. sylvatica are present before gap formation and survive the disturbance is rather high. This also confirms that, for the studied gap, the competition colonization trade off as a mechanism leading to the coexistence of tree species would thus not apply for the weak disperser and strong competitor F. sylvatica versus P. abies, with its higher dispersal distances but poorer competitive abilities.
None of the recorded seedlings had established in small dells. In the study area, these dells develop mainly from windthrow-pits and less often between limestone outcrops. For the whole basin of Rothwald, Simon et al. [52] identified smothering through litter accumulation in the pits combined with heavy snow loads compacting the accumulated litter as the main source of mortality of present year seedlings in pits. The important role of mortality caused by litter smothering has been reported previously for temperate and southern boreal forests [55,56,57]. Regeneration failure in such microsites has been observed in previous studies. For example, Hunziker and Brang [58] found an absence of seedlings in dells in a higher altitude A. alba–P. abies forest in the Alps. Peterson and Campbell [59] studied environmental characteristics of pits and mounds and found the former to be significantly colder and moister. In Rothwald, snow accumulation in these small dells causes a delayed snow melt for at least two weeks [52]. This is known to favor the occurrence of snow-mold fungi (Herpotrichia juniperii), which is an important mortality agent for P. abies and A. alba (e.g., [58,60]).
P. abies seedlings were strongly segregated from the other two species. This was mainly caused by a strongly positive nurse log–parameter, while this spatial covariate was negative for A. alba and F. sylvatica. A higher survival of P. abies on nurse logs was reported by Szewczyk and Szwagrzyk [28] and by Baier et al. [61] for comparable P. abies, A. alba, F. sylvatica forests and for higher altitudes [34] as well as for boreal P. abies forests [62]. The negative parameters for A. alba and F. sylvatica could be attributed to a lower seed retention on nurse logs. A separate analysis with small (<25 cm) versus larger (26–50 cm) beech seedlings, however, showed that this negative parameter was only significant for larger beech seedlings, indicating higher mortality of beech on nurse logs (results not shown). This underlines the role of coarse woody debris as a disturbance legacy for species coexistence.
We found only a very weak indication for partitioning of within gap light among the three species. Parameters were not significant for P. abies and A. alba, while F. sylvatica had a negative light parameter. The latter can be hypothesized to be a consequence of photoinhibition in higher light and a low phenotypic plasticity in photosynthetic capacity of the shade tolerant F. sylvatica [63,64] and was also found by [65] in old-growth forest gaps in south-central Europe. The drying out of seedbeds and subsequent killing of germinants would be another explanation for the negative light parameter of F. sylvatica [66] but it is fairly unlikely in the high precipitation climate in the study area where no month is below 100 mm of precipitation [67].
4.3. Competition and Spatial Segregation
We accounted for competition by larger individuals by including their density (for seedlings of 50 cm–150 cm height, DSL) and the light levels (for larger seedlings and trees) as spatial covariates in the Neyman–Scott model. Since the gap was formed in 1990, some regeneration was already established in the gap and occupied a part of the area or was established before gap formation. When these individuals competed with later gap colonists, the parameters of the larger individuals would be negative. Only P. abies had a significant, albeit positive, parameter for DSL. This can be interpreted as an expression of a regeneration cohort of which the smaller seedlings are part, maybe located on a patch with a resource configuration, which we did not account for in our density function. With an increasing DSL, the nurse log effects become less positive. This likely reflects a competitive effect of larger individuals when they reach a certain density (>2 m−2) on regeneration established on nurse logs. DSL was not significant for the other two species. This is in line with studies indicating that stronger competitive effects become more apparent in later life phases when the neighborhood of plants increases in size (e.g., [68,69,70]).
The clear segregation of P. abies from the other two species reflects reduced competition for P. abies on nurse logs. This species is the weakest competitor among the main tree species in this forest. Consequently, segregation can result from competition that increased mortality of this species on sites other than nurse logs. It can also be a result of mortality on unsuitable microsites for P. abies on shallow Rendzina soils on limestone and dolomite [61].
Surprisingly, A. alba and F. sylvatica did not show signs of within gap segregation in terms of their regeneration niches. Similarly, strongly overlapping regeneration niches of tree species regenerating in gaps were found for Abies amabilis, Pseudotsuga menziesii and Tsuga heterophylla in the Cascades Mountains of the U.S. Pacific Northwest [71]. A. alba and F. sylvatica are both shade tolerant [72] and had negative parameters on elevated microsites, such as nurse logs and bryophyte covered boulders. When the spatial extent of these microsites, including dells, is added up, these two species are left with only approximately 55% of the area. This can be interpreted as a sign of establishment limitation (or microsite limitation) sensu Clark et al. [73], where competitive relationships of the two species will determine coexistence. Up to now, integrated quantifications of the factors driving within gap processes and the coexistence of these two species have been rare. A. alba has a higher survival on moist and wet sites than F. sylvatica [74,75]. However, this potential advantage, which should enable A. alba to survive in dells with snow accumulation, seems to be offset by an increased mortality through smothering. The cross L(t)-functions show that the aggregation between F. sylvatica and A. alba could be accounted for with the fitted inhomogeneous Poisson cluster model. Given the comparable parameters of the spatial covariates for the two species this supports the statement that these two species do not show segregation in their regeneration niches. Coexistence of these two species is thus strongly dependent on competitive relations, which may be strongly influenced by climatic factors. Seed predation, herbivory, and pathogens, however, were shown to have the potential to modify competitive relations and alter species composition in old-growth forests [76,77,78,79].
Often, Neyman–Scott processes are interpreted as realizations of dispersal (parent-offspring) events [43,71]. In this paper, we included seed densities explicitly as spatial covariates, and thus can rule out seed dispersal as a source for extra Poisson clustering. While seed predation shows a higher temporal than spatial variation [76], mortality through debarking of tree seedlings by small mammals was observed to occur patchy. Such events would be candidates for the extra, unobserved clustering.
5. Conclusions
Using a set of spatial co-variates (seed density, percentage of above canopy light, micromorphology, cover of microsites, density of seedlings between 50 and 150 cm height), we accounted for the within gap clustering of small tree seedlings by fitting a non-homogeneous Neyman–Scott point process model. We disentangled the role of seed dispersal from niche partitioning for within gap tree establishment and did not detect seed densities as a factor explaining within gap clustering of small trees. From the habitat factors among the spatial co-variates, we detected clear niche segregation of P. abies on nurse logs. Both other main tree species had negative parameters at this microsite. They did not show signs of within gap segregation in terms of their regeneration niches and were not found in dells created by windthrows. Hence, they compete for resources at the remaining areas. All processes, influencing competitive relationships like changes in climate (affecting growth and mortality) and differential herbivory and pathogens will thus strongly influence the coexistence of A. alba and F. sylvatica. Herbivory and pathogens could also be causes of the extra, unexplained Poisson clustering. The method tested in this study allows for a more informed interpretation of processes leading to patterns of plants, in this case of within gap tree regeneration processes.
Author Contributions
G.G. conceived and designed the study and performed field work and provided spatial covariates. R.P.W. designed spatial statistical methods and performed the spatial point process modelling. G.G. wrote the paper.
Acknowledgments
This work was originally developed in a working group ‘Spatial analysis of tropical forest biodiversity’ funded by the Natural Environment Research Council and English Nature through the NERC Centre for Population Biology and UK Population Biology Network. We particularly thank Richard Law for making this possible. The Rothwald data was recorded as part of project P14583, funded by the Austrian Science Fund (FWF). We thank Monika Kutter for assistance in providing seed density data and Martin Wresowar for assistance in field work and William S. Keeton for helpful pre-review of the manuscript. Rasmus Waagepetersen was supported by The Danish Council for Independent Research|Natural Sciences, grant 7014-00074B, “Statistics for point processes in space and beyond”, and by the “Centre for Stochastic Geometry and Advanced Bioimaging”, funded by grant 8721 from the Villum Foundation.
Conflicts of Interest
The authors declare no conflict of interest.
Appendix A
Figure A1.
L-functions for F. sylvatica (a), P. abies (b) and A. alba (c). Dotted curves: L(t)-t computed assuming constant intensity. Dashed: L(t)-t computed assuming inhomogeneous intensity. Solid curves: 95% envelopes for L(t)-t assuming an inhomogeneous Poisson process. For an inhomogeneous Poisson process, the expected value of L(t)-t is zero.

References
- Watt, A.S. Pattern and Process in the Plant Community. J. Ecol. 1947, 35, 1–22. [Google Scholar] [CrossRef]
- Harper, J.L. Population biology of plants. In Population Biology of Plants; Academic Press: Waltham, MA, USA, 1977. [Google Scholar]
- Law, R.; Illian, J.B.; Burslem, D.F.R.P.; Gratzer, G.; Gunatilleke, C.V.S.; Gunatilleke, I.A.U.N. Ecological information from spatial patterns of plants: Insights from point process theory. J. Ecol. 2009, 97, 616–628. [Google Scholar] [CrossRef]
- Brown, C.; Illian, J.B.; Burslem, D.F.R.P.; Sandhu, L. Success of spatial statistics in determining underlying process in simulated plant communities. J. Ecol. 2016, 104, 106–172. [Google Scholar] [CrossRef]
- Diggle, P. Statistical Analysis of Spatial Point Patterns; Arnold: London, UK, 2003; ISBN 978-0-340-74070-5. [Google Scholar]
- Illian, D.J.; Penttinen, P.A.; Stoyan, D.H.; Stoyan, D. Statistical Analysis and Modelling of Spatial Point Patterns; John Wiley & Sons: Hoboken, NJ, USA, 2008; ISBN 978-0-470-72515-3. [Google Scholar]
- Møller, J.; Waagepetersen, R.P. Modern Statistics for Spatial Point Processes. Scand. J. Stat. 2007, 34, 643–684. [Google Scholar] [CrossRef]
- Møller, J.; Waagepetersen, R. Some Recent Developments in Statistics for Spatial Point Patterns. Annu. Rev. Stat. Its Appl. 2017, 4, 317–342. [Google Scholar] [CrossRef]
- Getzin, S.; Wiegand, T.; Wiegand, K.; He, F. Heterogeneity influences spatial patterns and demographics in forest stands. J. Ecol. 2008, 96, 807–820. [Google Scholar] [CrossRef]
- Zhu, Y.; Getzin, S.; Wiegand, T.; Ren, H.; Ma, K. The Relative Importance of Janzen-Connell Effects in Influencing the Spatial Patterns at the Gutianshan Subtropical Forest. PLoS ONE 2013, 8, e74560. [Google Scholar] [CrossRef] [PubMed]
- Guochun, S.; Mingjian, Y.; Xinsheng, H.; Xiangcheng, M.; Haibao, R.; I-Fang, S.; Keping, M. Species-area relationships explained by the joint effects of dispersal limitation and habitat heterogeneity. Ecology 2009, 90, 3033–3041. [Google Scholar]
- Lin, Y.-C.; Chang, L.-W.; Yang, K.-C.; Wang, H.-H.; Sun, I.-F. Point patterns of tree distribution determined by habitat heterogeneity and dispersal limitation. Oecologia 2011, 165, 175–184. [Google Scholar] [CrossRef] [PubMed]
- Velázquez, E.; Martínez, I.; Getzin, S.; Moloney, K.A.; Wiegand, T. An evaluation of the state of spatial point pattern analysis in ecology. Ecography 2016, 39, 1042–1055. [Google Scholar] [CrossRef]
- Motta, R.; Garbarino, M.; Berretti, R.; Meloni, F.; Nosenzo, A.; Vacchiano, G. Development of old-growth characteristics in uneven-aged forests of the Italian Alps. Eur. J. For. Res. 2015, 134, 19–31. [Google Scholar] [CrossRef]
- Burrascano, S.; Keeton, W.S.; Sabatini, F.M.; Blasi, C. Commonality and variability in the structural attributes of moist temperate old-growth forests: A global review. For. Ecol. Manag. 2013, 291, 458–479. [Google Scholar] [CrossRef]
- Keeton, W.S.; Chernyavskyy, M.; Gratzer, G.; Main-Knorn, M.; Shpylchak, M.; Bihun, Y. Structural characteristics and aboveground biomass of old-growth spruce–fir stands in the eastern Carpathian mountains, Ukraine. Plant Biosyst. Int. J. Deal. Asp. Plant Biol. 2010, 144, 148–159. [Google Scholar] [CrossRef]
- Kern, C.C.; Burton, J.I.; Raymond, P.; D’Amato, A.W.; Keeton, W.S.; Royo, A.A.; Walters, M.B.; Webster, C.R.; Willis, J.L. Challenges facing gap-based silviculture and possible solutions for mesic northern forests in North America. For. Int. J. For. Res. 2017, 90, 4–17. [Google Scholar] [CrossRef]
- Canham, C.D.; Finzi, A.C.; Pacala, S.W.; Burbank, D.H. Causes and consequences of resource heterogeneity in forests: Interspecific variation in light transmission by canopy trees. Can. J. For. Res. 1994, 24, 337–349. [Google Scholar] [CrossRef]
- Latif, Z.A.; Blackburn, G.A. The effects of gap size on some microclimate variables during late summer and autumn in a temperate broadleaved deciduous forest. Int. J. Biometeorol. 2010, 54, 119–129. [Google Scholar] [CrossRef] [PubMed]
- Muscolo, A.; Bagnato, S.; Sidari, M.; Mercurio, R. A review of the roles of forest canopy gaps. J. For. Res. 2014, 25, 725–736. [Google Scholar] [CrossRef]
- Hubbell, S.P.; Foster, R.B.; O’Brien, S.T.; Harms, K.E.; Condit, R.; Wechsler, B.; Wright, S.J.; Lao, S.L. de Light-Gap Disturbances, Recruitment Limitation, and Tree Diversity in a Neotropical Forest. Science 1999, 283, 554–557. [Google Scholar] [CrossRef] [PubMed]
- Hubbell, S.P. Neutral Theory and the Evolution of Ecological Equivalence. Ecology 2006, 87, 1387–1398. [Google Scholar] [CrossRef]
- Bagchi, R.; Henrys, P.A.; Brown, P.E.; Burslem, D.F.R.P.; Diggle, P.J.; Gunatilleke, C.V.S.; Gunatilleke, I.A.U.N.; Kassim, A.R.; Law, R.; Noor, S.; et al. Spatial patterns reveal negative density dependence and habitat associations in tropical trees. Ecology 2011, 92, 1723–1729. [Google Scholar] [CrossRef] [PubMed]
- Uriarte, M.; Muscarella, R.; Zimmerman, J.K. Environmental heterogeneity and biotic interactions mediate climate impacts on tropical forest regeneration. Glob. Chang. Biol. 2017. [Google Scholar] [CrossRef] [PubMed]
- Brokaw, N.; Busing, R.T. Niche versus chance and tree diversity in forest gaps. Trends Ecol. Evol. 2000, 15, 183–188. [Google Scholar] [CrossRef]
- Nakashizuka, T. Species coexistence in temperate, mixed deciduous forests. Trends Ecol. Evol. 2001, 16, 205–210. [Google Scholar] [CrossRef]
- Gray, A.N.; Spies, T.A. Microsite Controls on Tree Seedling Establishment in Conifer Forest Canopy Gaps. Ecology 1997, 78, 2458–2473. [Google Scholar] [CrossRef]
- Szewczyk, J.; Szwagrzyk, J. Tree regeneration on rotten wood and on soil in old-growth stand. Vegetatio 1996, 122, 37–46. [Google Scholar] [CrossRef]
- Brang, P. Early seedling establishment of Picea abies in small forest gaps in the Swiss Alps. Can. J. For. Res. 1998, 28, 626–639. [Google Scholar] [CrossRef]
- Titus, J.H.; del Moral, R. Seedling establishment in different microsites on Mount St. Helens, Washington, USA. Plant Ecol. 1998, 134, 13–26. [Google Scholar] [CrossRef]
- Gratzer, G.; Rai, P.B.; Glatzel, G. The influence of the bamboo Yushania microphylla on regeneration of Abies densa in central Bhutan. Can. J. For. Res. 1999, 29, 1518–1527. [Google Scholar] [CrossRef]
- Pröll, G.; Darabant, A.; Gratzer, G.; Katzensteiner, K. Unfavourable microsites, competing vegetation and browsing restrict post-disturbance tree regeneration on extreme sites in the Northern Calcareous Alps. Eur. J. For. Res. 2015, 134, 293–308. [Google Scholar] [CrossRef]
- Kathke, S.; Bruelheide, H. Interaction of gap age and microsite type for the regeneration of Picea abies. For. Ecol. Manag. 2010, 259, 1597–1605. [Google Scholar] [CrossRef]
- Kupferschmid, A.D.; Bugmann, H. Effect of microsites, logs and ungulate browsing on Picea abies regeneration in a mountain forest. For. Ecol. Manag. 2005, 205, 251–265. [Google Scholar] [CrossRef]
- Van Couwenberghe, R.; Collet, C.; Lacombe, E.; Pierrat, J.-C.; Gégout, J.-C. Gap partitioning among temperate tree species across a regional soil gradient in windstorm-disturbed forests. For. Ecol. Manag. 2010, 260, 146–154. [Google Scholar] [CrossRef]
- Christie, D.A.; Armesto, J.J. Regeneration Microsites and Tree Species Coexistence in Temperate Rain Forests of Chiloé Island, Chile. J. Ecol. 2003, 91, 776–784. [Google Scholar] [CrossRef]
- Grubb, P. The maintenance of species-richness in plant communities: The importance of the regeneration niche. Biol. Rev. 1977, 52, 107–145. [Google Scholar] [CrossRef]
- Wiegand, T.; Moloney, K.A. Handbook of Spatial Point-Pattern Analysis in Ecology; CRC Press: Boca Raton, FL, USA, 2013; ISBN 978-1-4200-8255-5. [Google Scholar]
- Zukrigl, K.; Eckhart, G.; Nather, J. Standortskundliche und Waldbauliche Untersuchungen in Urwaldresten der Niederösterreichischen Kalkalpen. Mitt FBVA 62; Österreichischer Agrarverlag: Vienna, Austria, 1963. [Google Scholar]
- Willner, W.; Grabherr, G. Die Wälder und Gebüsche Österreichs; Spektrum Akademischer Verlag: Heidelberg, Berlin, 2007; ISBN 978-3-8274-1892-0. [Google Scholar]
- Schrempf, W. Waldbauliche Untersuchungen im Fichten-Tannen-Buchen-Urwald Rothwald und in Urwald-Folge-Beständen. Ph.D. Thesis, Universität für Bodenkultur, Wien, Austria, 1985. [Google Scholar]
- Runkle, J.R. Guidelines and Sample Protocol for Sampling Forest Gaps; General Technical Report PNW-GTR-283; U.S. Department of Agriculture, Forest Service, Pacific Northwest Research Station: Portland, OR, USA, 1992; Volume 283.
- Delta-T Devices Ltd. Hemiview User Manual 2.1; Delta-T Devices: Cambridge, UK, 1998. [Google Scholar]
- Rich, P.M. Characterizing plant canopies with hemispherical photographs. Remote Sens. Rev. 1990, 5, 13–29. [Google Scholar] [CrossRef]
- Ribbens, E.; Silander, J.A.; Pacala, S.W. Seedling Recruitment in Forests: Calibrating Models to Predict Patterns of Tree Seedling Dispersion. Ecology 1994, 75, 1794–1806. [Google Scholar] [CrossRef]
- Kutter, M.; Georg, G. Current methods for estimation of seed dispersal of trees—An example of seed dispersal of Picea abies, Abiel alba and Fagus sylvatica. Aust. J. For. Sci. 2006, 123, 103–120. [Google Scholar]
- Baddeley, A.J.; Møller, J.; Waagepetersen, R. Non- and semi-parametric estimation of interaction in inhomogeneous point patterns. Stat. Neerlandica 2000, 54, 329–350. [Google Scholar] [CrossRef]
- Waagepetersen, R.P. An Estimating Function Approach to Inference for Inhomogeneous Neyman–Scott Processes. Biometrics 2007, 63, 252–258. [Google Scholar] [CrossRef] [PubMed]
- Splechtna, B.E.; Gratzer, G.; Black, B.A.; Franklin, J. Disturbance history of a European old-growth mixed-species forest—A spatial dendro-ecological analysis. J. Veg. Sci. 2005, 16, 511–522. [Google Scholar]
- Stoyan, D.; Penttinen, A. Recent Applications of Point Process Methods in Forestry Statistics. Stat. Sci. 2000, 15, 61–78. [Google Scholar]
- Bagchi, R.; Illian, J.B. A method for analysing replicated point patterns in ecology. Methods Ecol. Evol. 2015, 6, 482–490. [Google Scholar] [CrossRef]
- Simon, A.; Gratzer, G.; Sieghardt, M. The influence of windthrow microsites on tree regeneration and establishment in an old growth mountain forest. For. Ecol. Manag. 2011, 262, 1289–1297. [Google Scholar] [CrossRef]
- Punchi-Manage, R.; Wiegand, T.; Wiegand, K.; Getzin, S.; Gunatilleke, C.V.S.; Gunatilleke, I.A.U.N. Effect of spatial processes and topography on structuring species assemblages in a Sri Lankan dipterocarp forest. Ecology 2014, 95, 376–386. [Google Scholar] [CrossRef] [PubMed]
- Szwagrzyk, J.; Szewczyk, J.; Bodziarczyk, J. Dynamics of seedling banks in beech forest: Results of a 10-year study on germination, growth and survival. For. Ecol. Manag. 2001, 141, 237–250. [Google Scholar] [CrossRef]
- Gillman, L.N.; Wright, S.D.; Ogden, J. Response of forest tree seedlings to simulated litterfall damage. Plant Ecol. 2003, 169, 53–60. [Google Scholar] [CrossRef]
- Gillman, L.N.; Ogden, J. Physical damage by litterfall to canopy tree seedlings in two temperate New Zealand forests. J. Veg. Sci. 2001, 12, 671–676. [Google Scholar] [CrossRef]
- Simard, M.-J.; Bergeron, Y.; Sirois, L. Substrate and litterfall effects on conifer seedling survivorship in southern boreal stands of Canada. Can. J. For. Res. 2003, 33, 672–681. [Google Scholar] [CrossRef]
- Hunziker, U.; Brang, P. Microsite patterns of conifer seedling establishment and growth in a mixed stand in the Southern Alps. For. Ecol. Manag. 2005, 210, 67–79. [Google Scholar] [CrossRef]
- Peterson, C.J.; Campbell, J.E. Microsite Differences and Temporal Change in Plant Communities of Treefall Pits and Mounds in an Old-Growth Forest. Bull. Torrey Bot. Club 1993, 120, 451–460. [Google Scholar] [CrossRef]
- Bazzigher, G. Der schwarze Schneeschimmel der Koniferen [Herpotrichia juniperi (Duby) Petrak und Herpotrichia Coulteri (Peck) Bose). For. Pathol. 1976, 6, 109–122. [Google Scholar] [CrossRef]
- Baier, R.; Meyer, J.; Göttlein, A. Regeneration niches of Norway spruce (Picea abies [L.] Karst.) saplings in small canopy gaps in mixed mountain forests of the Bavarian Limestone Alps. Eur. J. For. Res. 2007, 126, 11–22. [Google Scholar] [CrossRef]
- Hornberg, G.; Ohlson, M.; Zackrisson, O. Influence of bryophytes and microrelief conditions on Picea abies seed regeneration patterns in boreal old-growth swamp forests. Can. J. For. Res. 1997, 27, 1015–1023. [Google Scholar] [CrossRef]
- Tognetti, R.; Minotta, G.; Pinzauti, S.; Michelozzi, M.; Borghetti, M. Acclimation to changing light conditions of long-term shade-grown beech (Fagus sylvatica L.) seedlings of different geographic origins. Trees 1998, 12, 326–333. [Google Scholar] [CrossRef]
- Einhorn, K.S.; Rosenqvist, E.; Leverenz, J.W. Photoinhibition in seedlings of Fraxinus and Fagus under natural light conditions: Implications for forest regeneration? Oecologia 2004, 2, 241–251. [Google Scholar] [CrossRef] [PubMed]
- Dusan, R.; Stjepan, M.; Igor, A.; Jurij, D. Gap regeneration patterns in relationship to light heterogeneity in two old-growth beech–fir forest reserves in South East Europe. For. Int. J. For. Res. 2007, 80, 431–443. [Google Scholar] [CrossRef]
- Čater, M.; Levanič, T. Response of Fagus sylvatica L. and Abies alba Mill. in different silvicultural systems of the high Dinaric karst. For. Ecol. Manag. 2013, 289, 278–288. [Google Scholar] [CrossRef]
- Splechtna, B.E.; Gratzer, G. Natural disturbances in Central European forests: Approaches and preliminary results from Rothwald, Austria. For. Snow Landsc. Res. 2005, 79, 57–67. [Google Scholar]
- Weiner, J.; Stoll, P.; Muller-Landau, H.; Jasentuliyana, A. The Effects of Density, Spatial Pattern, and Competitive Symmetry on Size Variation in Simulated Plant Populations. Am. Nat. 2001, 158, 438–450. [Google Scholar] [CrossRef] [PubMed] [Green Version]
- Vospernik, S.; Sterba, H. Do competition-density rule and self-thinning rule agree? Ann. For. Sci. 2015, 72, 379–390. [Google Scholar] [CrossRef]
- Wang, X.; Wiegand, T.; Wolf, A.; Howe, R.; Davies, S.J.; Hao, Z. Spatial patterns of tree species richness in two temperate forests. J. Ecol. 2011, 6, 1382–1393. [Google Scholar] [CrossRef]
- Gray, A.N.; Spies, T.A. Gap Size, Within-Gap Position and Canopy Structure Effects on Conifer Seedling Establishment. J. Ecol. 1996, 84, 635–645. [Google Scholar] [CrossRef]
- Stancioiu, P.T.; O’Hara, K.L. Regeneration growth in different light environments of mixed species, multiaged, mountainous forests of Romania. Eur. J. For. Res. 2006, 125, 151–162. [Google Scholar] [CrossRef]
- Clark, C.J.; Poulsen, J.R.; Levey, D.J.; Osenberg, C.W. Are Plant Populations Seed Limited? A Critique and Meta-Analysis of Seed Addition Experiments. Am. Nat. 2007, 170, 128–142. [Google Scholar] [CrossRef] [PubMed]
- Paluch, J.G. The spatial pattern of a natural European beech (Fagus sylvatica L.)–silver fir (Abies alba Mill.) forest: A patch-mosaic perspective. For. Ecol. Manag. 2007, 253, 161–170. [Google Scholar] [CrossRef]
- Dobrowolska, D.; Bončina, A.; Klumpp, R. Ecology and silviculture of silver fir (Abies alba Mill.): A review. J. For. Res. 2017, 22, 326–335. [Google Scholar] [CrossRef]
- Nopp-Mayr, U.; Kempter, I.; Muralt, G.; Gratzer, G. Seed survival on experimental dishes in a central European old-growth mixed-species forest—Effects of predator guilds, tree masting and small mammal population dynamics. Oikos 2012, 3, 337–346. [Google Scholar] [CrossRef]
- Szwagrzyk, J.; Gratzer, G.; Stępniewska, H.; Szewczyk, J.; Veselinovic, B. High Reproductive Effort and Low Recruitment Rates of European Beech: Is There a Limit for the Superior Competitor? Pol. J. Ecol. 2015, 63, 198–212. [Google Scholar] [CrossRef]
- Jankowiak, R.; Stępniewska, H.; Szwagrzyk, J.; Bilański, P.; Gratzer, G. Characterization of Cylindrocarpon-like species associated with litter in the old-growth beech forests of Central Europe. For. Pathol. 2016, 6. [Google Scholar] [CrossRef]
- Bagchi, R.; Gallery, R.E.; Gripenberg, S.; Gurr, S.J.; Narayan, L.; Addis, C.E.; Freckleton, R.P.; Lewis, O.T. Pathogens and insect herbivores drive rainforest plant diversity and composition. Nature 2014, 506, 85–88. [Google Scholar] [CrossRef] [PubMed]
Figure 1.
Spatial pattern of trees in permanent study plot (PSP) 1 at Rothwald. The crosses denote the corners of the 20 m × 20 m inner plot. The solid line marks gap formed in 1990 (expanded gap definition, sensu [42].
Figure 1.
Spatial pattern of trees in permanent study plot (PSP) 1 at Rothwald. The crosses denote the corners of the 20 m × 20 m inner plot. The solid line marks gap formed in 1990 (expanded gap definition, sensu [42].

Figure 2.
Light environment in the regeneration subplot. Colors correspond to percent of open area radiation from analyzing hemispherical photographs taken in a 2 m × 2 m grid.
Figure 2.
Light environment in the regeneration subplot. Colors correspond to percent of open area radiation from analyzing hemispherical photographs taken in a 2 m × 2 m grid.

Figure 3.
Seed density (gray shades, seeds m−2) and tree seedlings <50 cm height (black circles) for Fagus sylvatica (a), Picea abies (b) and Abies alba (c). Note that the scales are different for the three graphs.
Figure 3.
Seed density (gray shades, seeds m−2) and tree seedlings <50 cm height (black circles) for Fagus sylvatica (a), Picea abies (b) and Abies alba (c). Note that the scales are different for the three graphs.

Figure 4.
Density of tree seedlings between 50 cm and 150 cm height. Shades correspond to the number of individuals m−2.
Figure 4.
Density of tree seedlings between 50 cm and 150 cm height. Shades correspond to the number of individuals m−2.

Figure 5.
Cross L(t)—functions of tree seedlings. (a): Fagus sylvatica and Abies alba; (b): Fagus sylvatica and Picea abies, (c): Abies alba and Picea abies. Solid lines: 95% envelopes generated assuming data realizations of independent inhomogeneous cluster processes. Dotted line: L-function computed assuming homogeneous distribution of points. Dashed: L-function computed taking into account inhomogeneity due to covariates.


Table 1.
Densities of tree seedlings in different micro-morphology-types and micro-site classes.
| Density (Individuals ≤ 50 cm Height) m−2 | Density of Seedlings in Micro-Morphology Classes (Individuals ≤ 50 cm Height) m−2 Cover of Micro-Morphology Class | Density of Seedlings on Micro-Site Classes (Individuals ≤ 50 cm Height) m−2 Cover of Micro-Site Class | ||||
|---|---|---|---|---|---|---|
| Species | Equal and convex | Concave | Nurse logs | Litter and lignomoder | Bryophyte covered boulders | |
| Fagus sylvatica | 1.32 | 1.37 | 0 | 0.5 | 1.11 | 0.11 |
| Abies alba | 1.05 | 1.40 | 0 | 0.58 | 1.05 | 0.14 |
| Picea abies | 0.58 | 0.36 | 0 | 0.81 | 0.37 | 0.10 |
Table 2.
Model parameters and results of the models of seed dispersal for Picea abies, Abies alba and Fagus sylvatica using the “recruits-model” [45].
Table 2.
Model parameters and results of the models of seed dispersal for Picea abies, Abies alba and Fagus sylvatica using the “recruits-model” [45].
| Species | STR | MDD | D ζ | n | r2 |
|---|---|---|---|---|---|
| Fagus sylvatica | 26692 | 6.1 | 169.774 | 199.35 | 0.43 |
| Abies alba | 11712 | 22.6 | 3.481 | 2660.05 | 0.26 |
| Picea abies | 52067 | 38.7 | 0.694 | 7789.65 | 0.20 |
STR = standard total recruitment (number of recruits produced for a tree of standardized dbh); MDD mean dispersal distance (m); D = determinant of the rapidity of decline of recruit density with distance from parent tree, ζ values equal D × 105.
Table 3.
Parameter estimates for seedlings of Picea abies, Abies alba and Fagus sylvatica.
| Species | Picea abies | Abies alba | Fagus sylvatica |
|---|---|---|---|
| Intercept | −1.29 (−10.75; 8.16) | 7.46 ** (3.50; 11.43) | 0.95 * (−0.05; 5.95) |
| Nurse logs | 1.06 ** (0.38; 1.75) | −1.00 ** (−1.61; −0.38) | −0.92 * (−1.80; 0.03) |
| Bryophyte covered boulders | −0.59 (−1.47; 0.28) | −0.76 ** (−1.34; −0.19) | −1.46 ** (−2.49; −0.44) |
| Light levels | −0.08 (−0.26; 0.09) | −0.07 (−0.18; 0.04) | −0.20 ** (−0.35; −0.04) |
| Seed density | 0.01 (−0.04; 0.06) | −0.10 ** (−0.15; −0.04) | 0.002 (−0.002; 0.007) |
| DSL | 0.40 ** (0.14; 0.66) | 0.17 (−0.02; 0.36) | 0.09 (−0.23; 0.41) |
| Nurse log: DSL | −0.47 * (−0.84; −0.10) | - | - |
Note: the asterisk denotes the p-values from the Wald-Tests (**: less than 0.01; *: less than 0.05). Non-significant interactions not shown.
© 2018 by the authors. Licensee MDPI, Basel, Switzerland. This article is an open access article distributed under the terms and conditions of the Creative Commons Attribution (CC BY) license (http://creativecommons.org/licenses/by/4.0/).
Share and Cite
MDPI and ACS Style
Gratzer, G.; Waagepetersen, R.P. Seed Dispersal, Microsites or Competition—What Drives Gap Regeneration in an Old-Growth Forest? An Application of Spatial Point Process Modelling. Forests 2018, 9, 230. https://doi.org/10.3390/f9050230
AMA Style
Gratzer G, Waagepetersen RP. Seed Dispersal, Microsites or Competition—What Drives Gap Regeneration in an Old-Growth Forest? An Application of Spatial Point Process Modelling. Forests. 2018; 9(5):230. https://doi.org/10.3390/f9050230
Chicago/Turabian StyleGratzer, Georg, and Rasmus Plenge Waagepetersen. 2018. "Seed Dispersal, Microsites or Competition—What Drives Gap Regeneration in an Old-Growth Forest? An Application of Spatial Point Process Modelling" Forests 9, no. 5: 230. https://doi.org/10.3390/f9050230
Note that from the first issue of 2016, this journal uses article numbers instead of page numbers. See further details here.