Climate Change-Induced Shift of Tree Growth Sensitivity at a Central Himalayan Treeline Ecotone

 , ,
, ,  and
and
Abstract
:1. Introduction
2. Materials and Methods
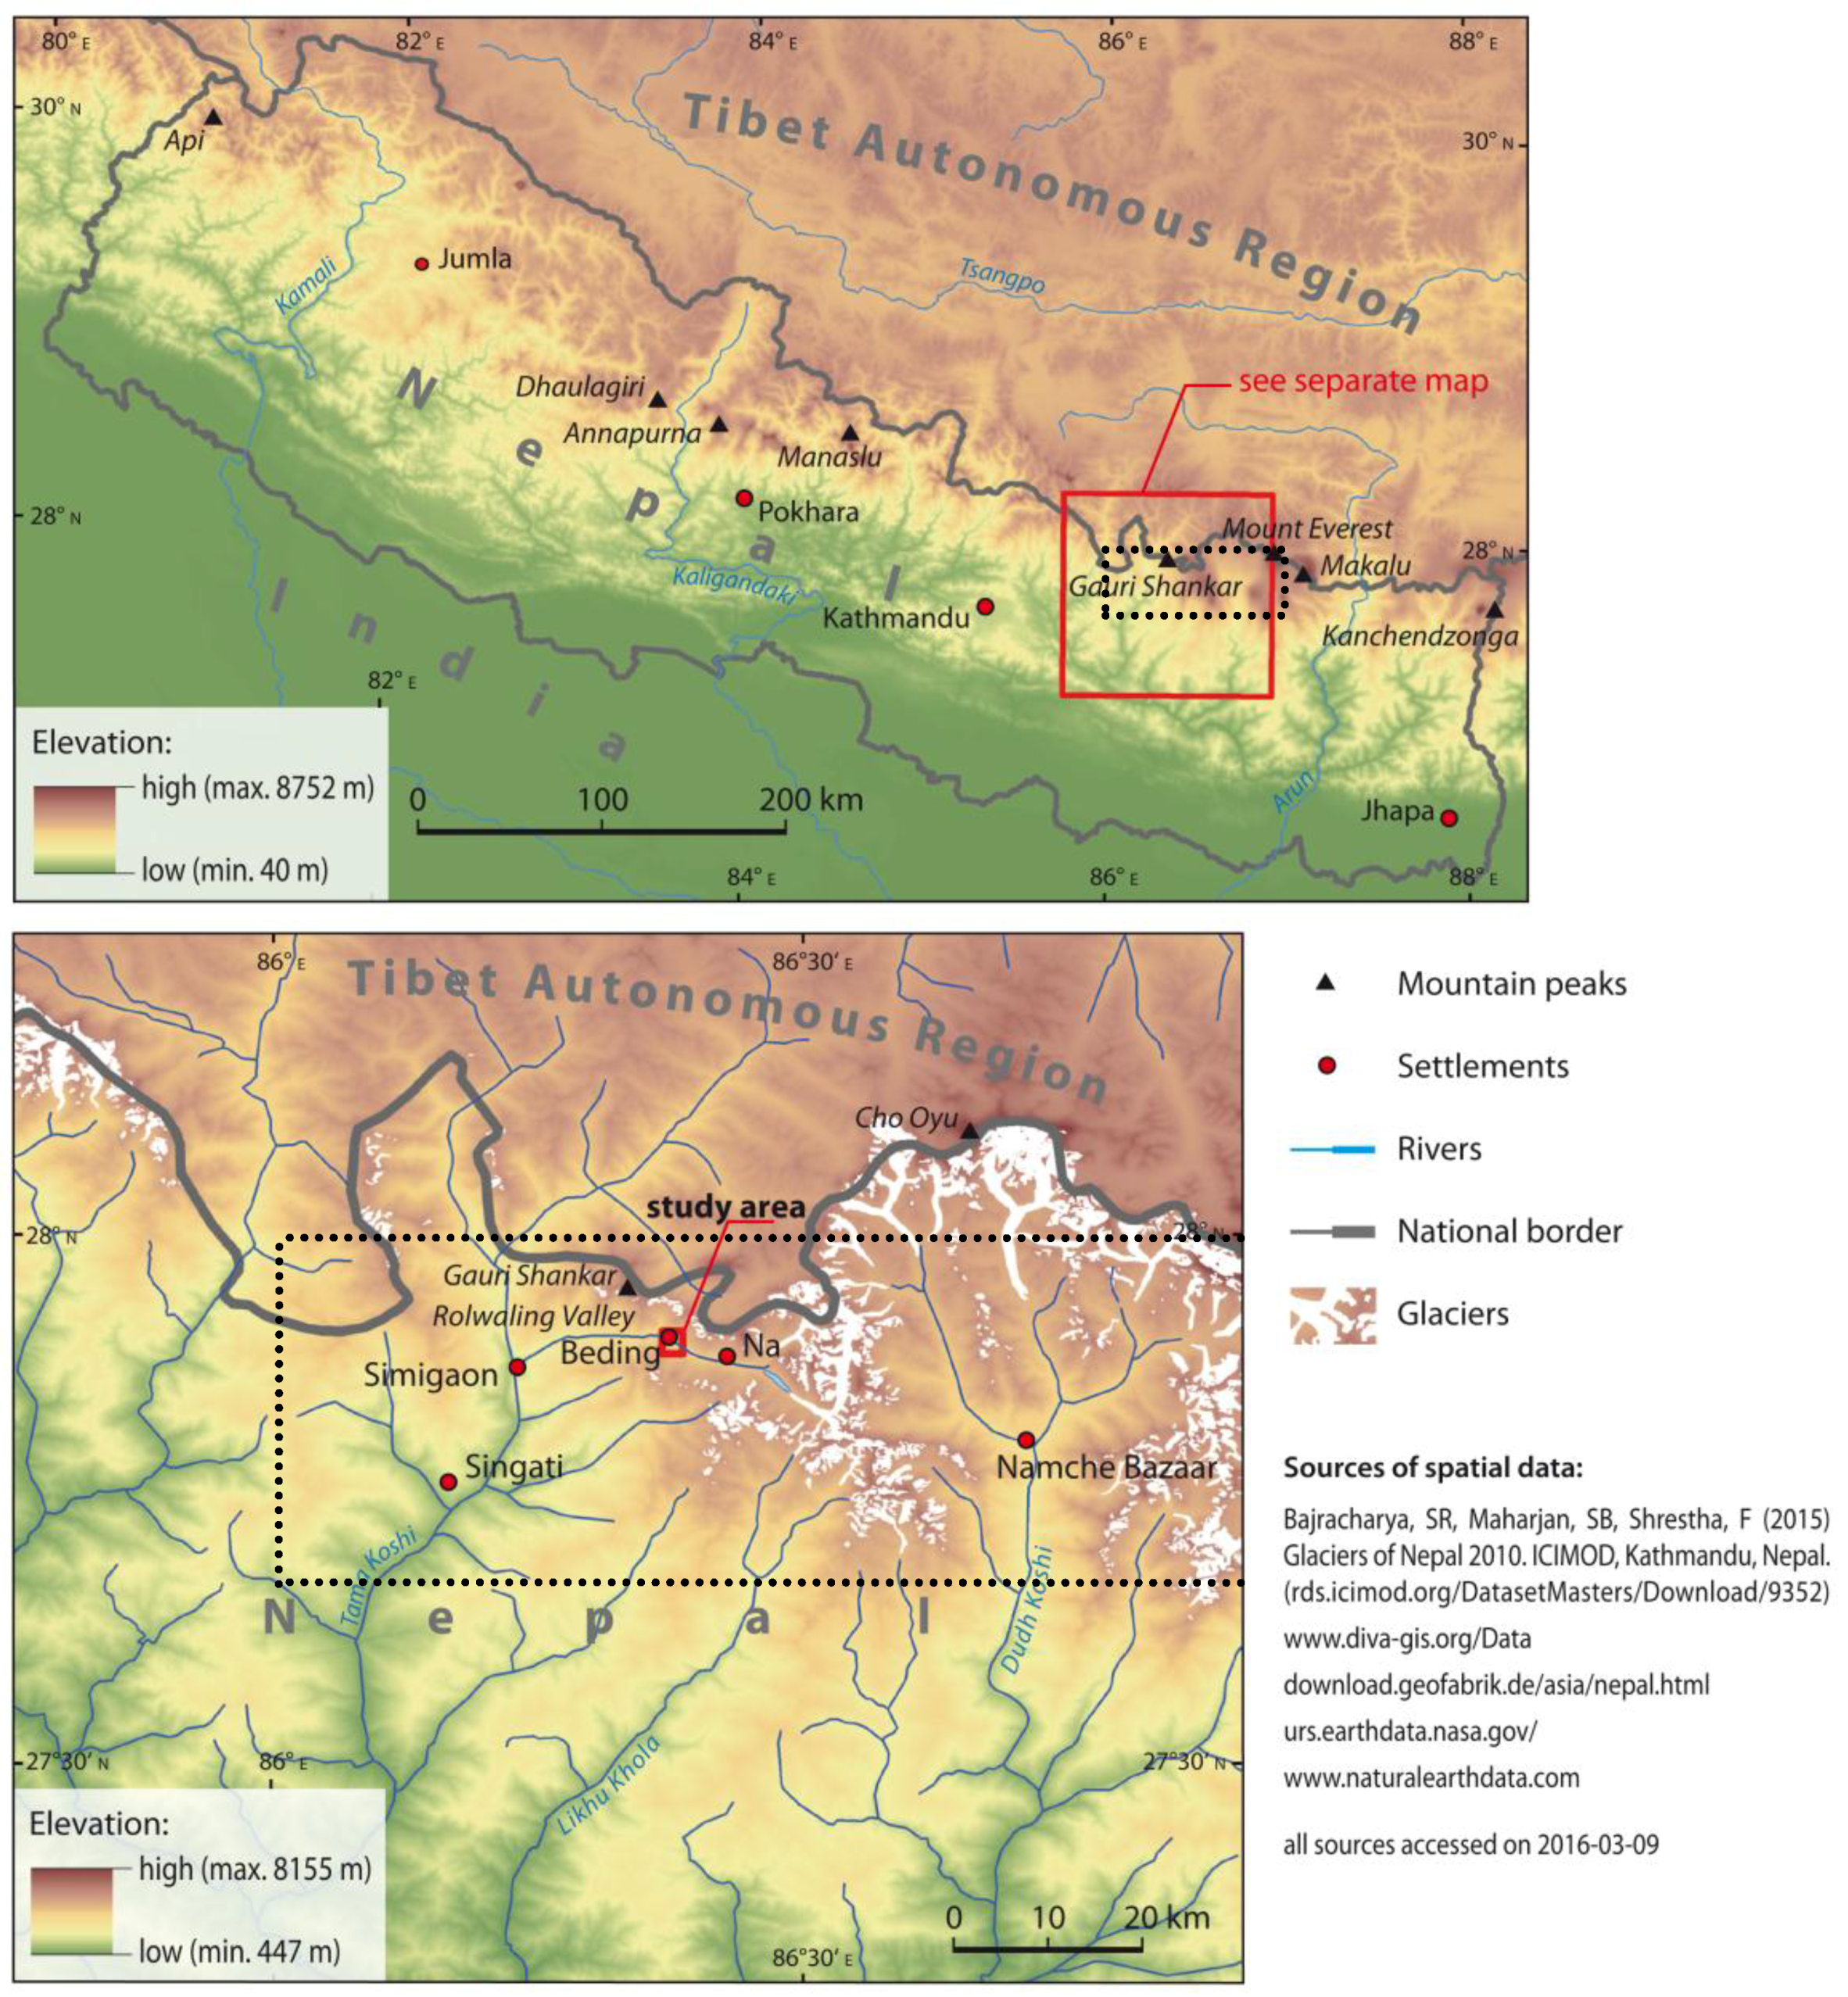
2.1. Study Area and Sampling Site
2.2. Tree-Ring Data
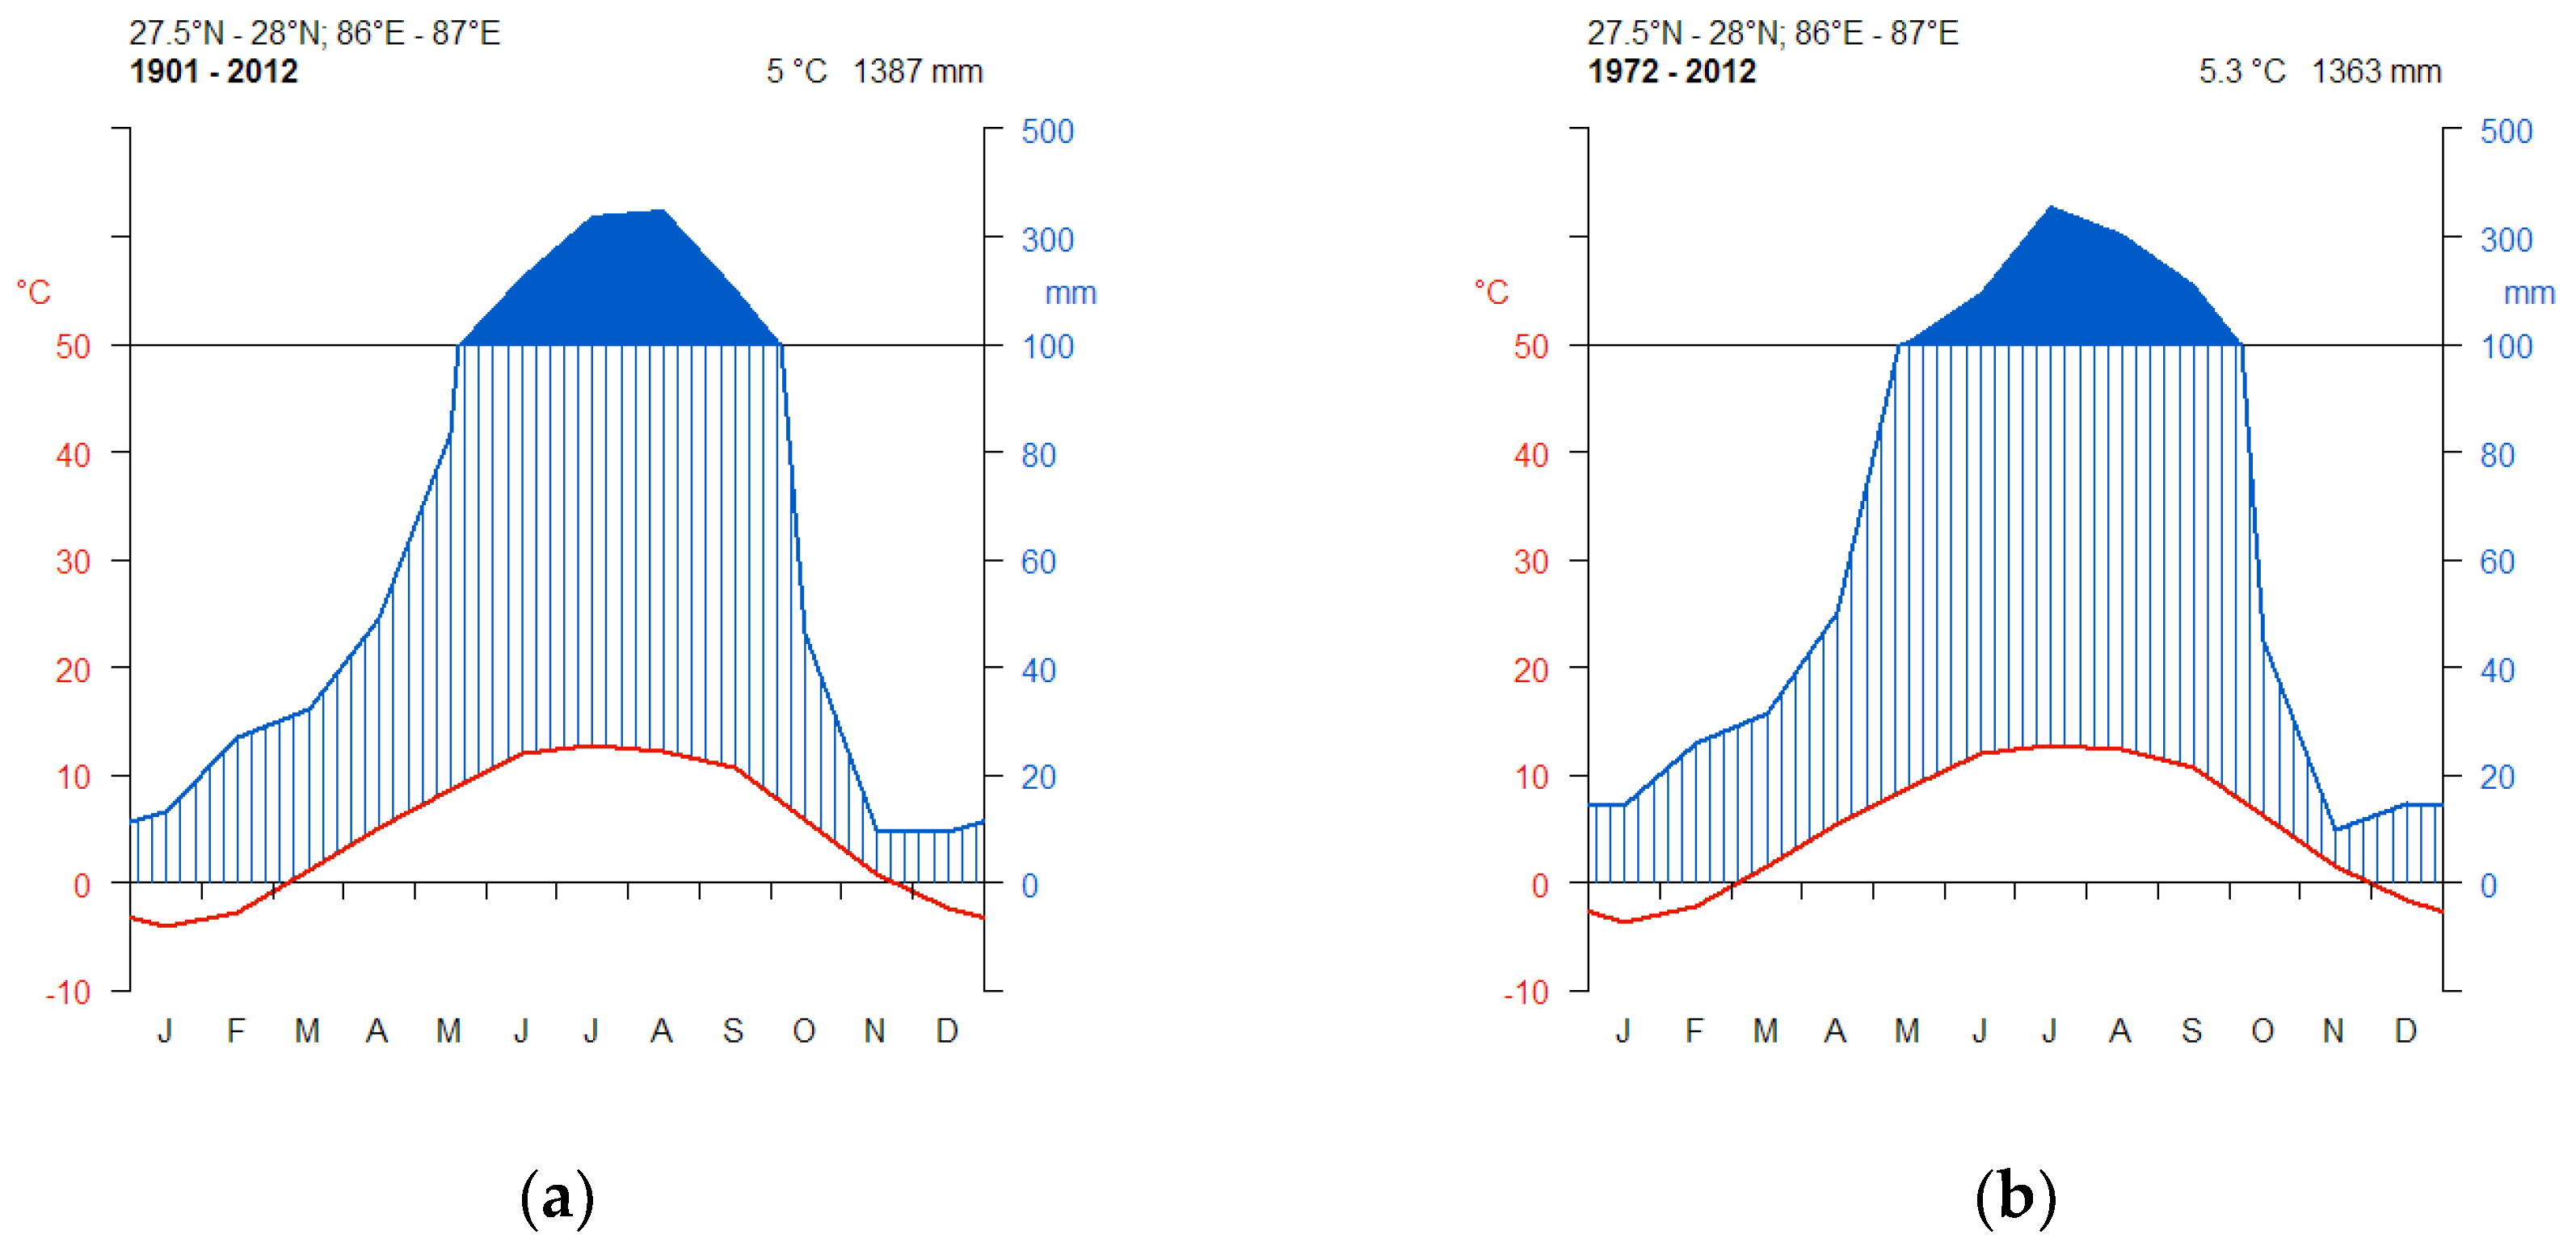
2.3. Climate Data
2.4. Tree Growth–Climate and BI–Climate Correlations
3. Results
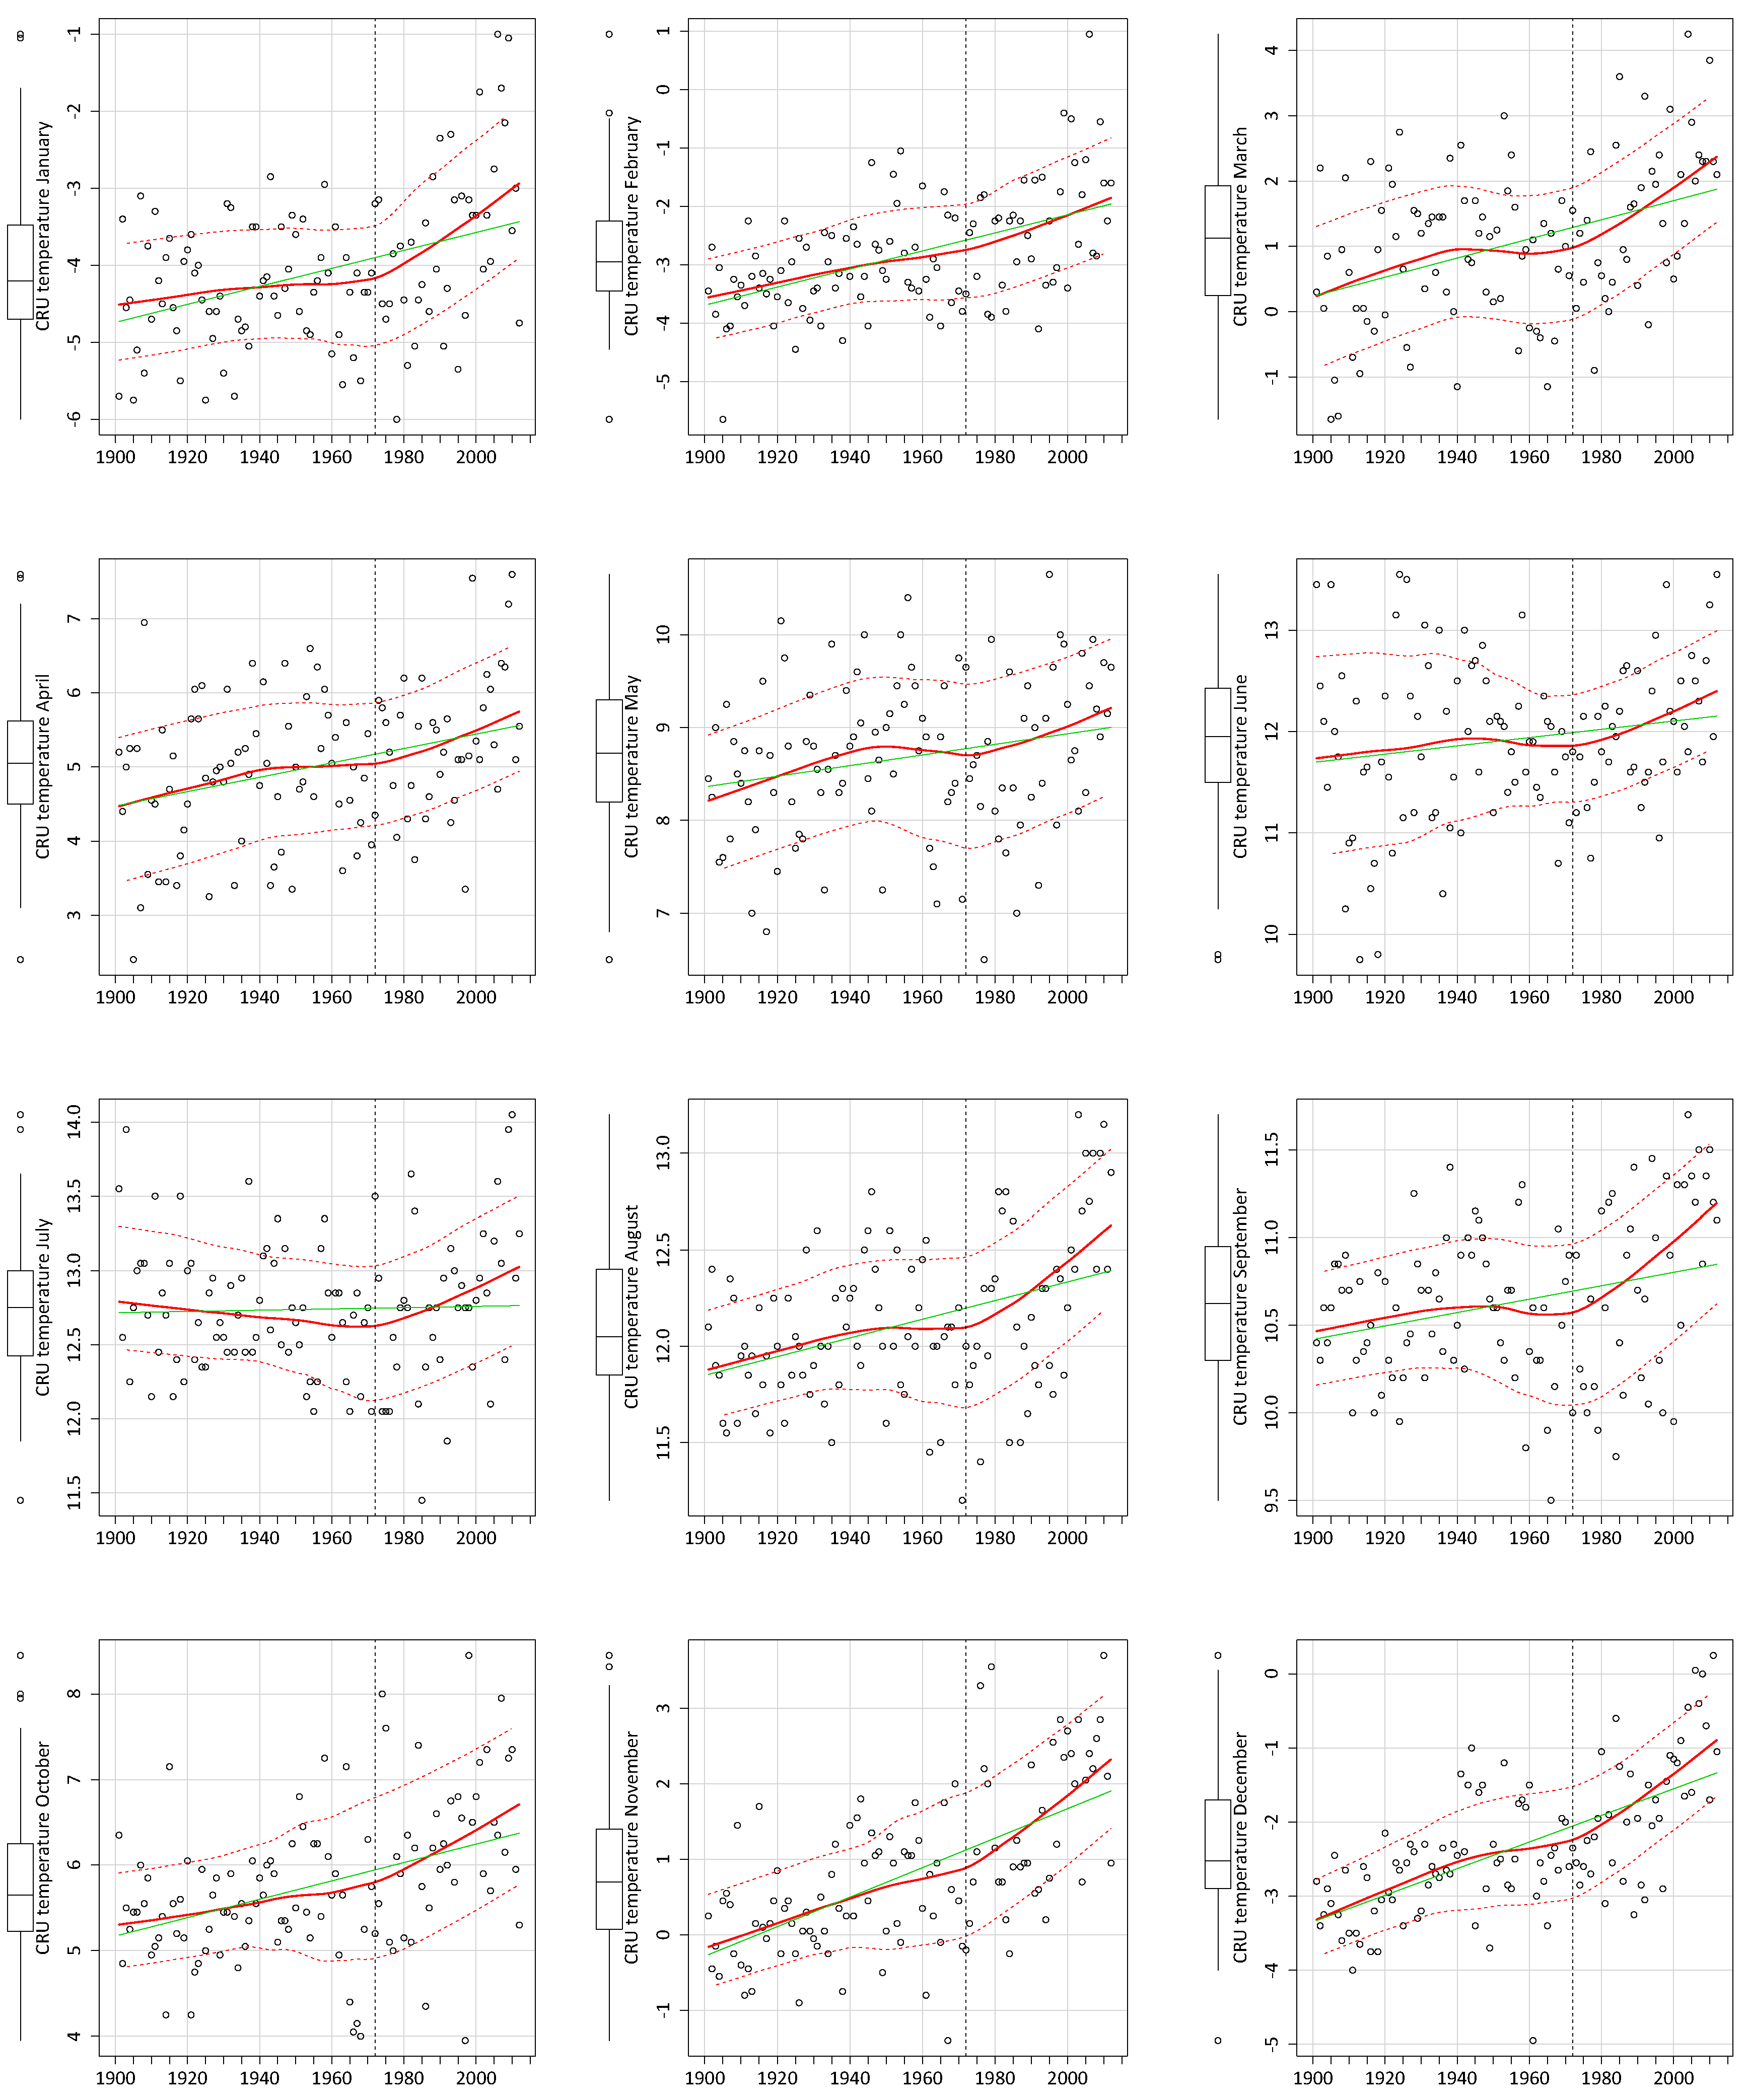
3.1. CRU Climate Data Trends
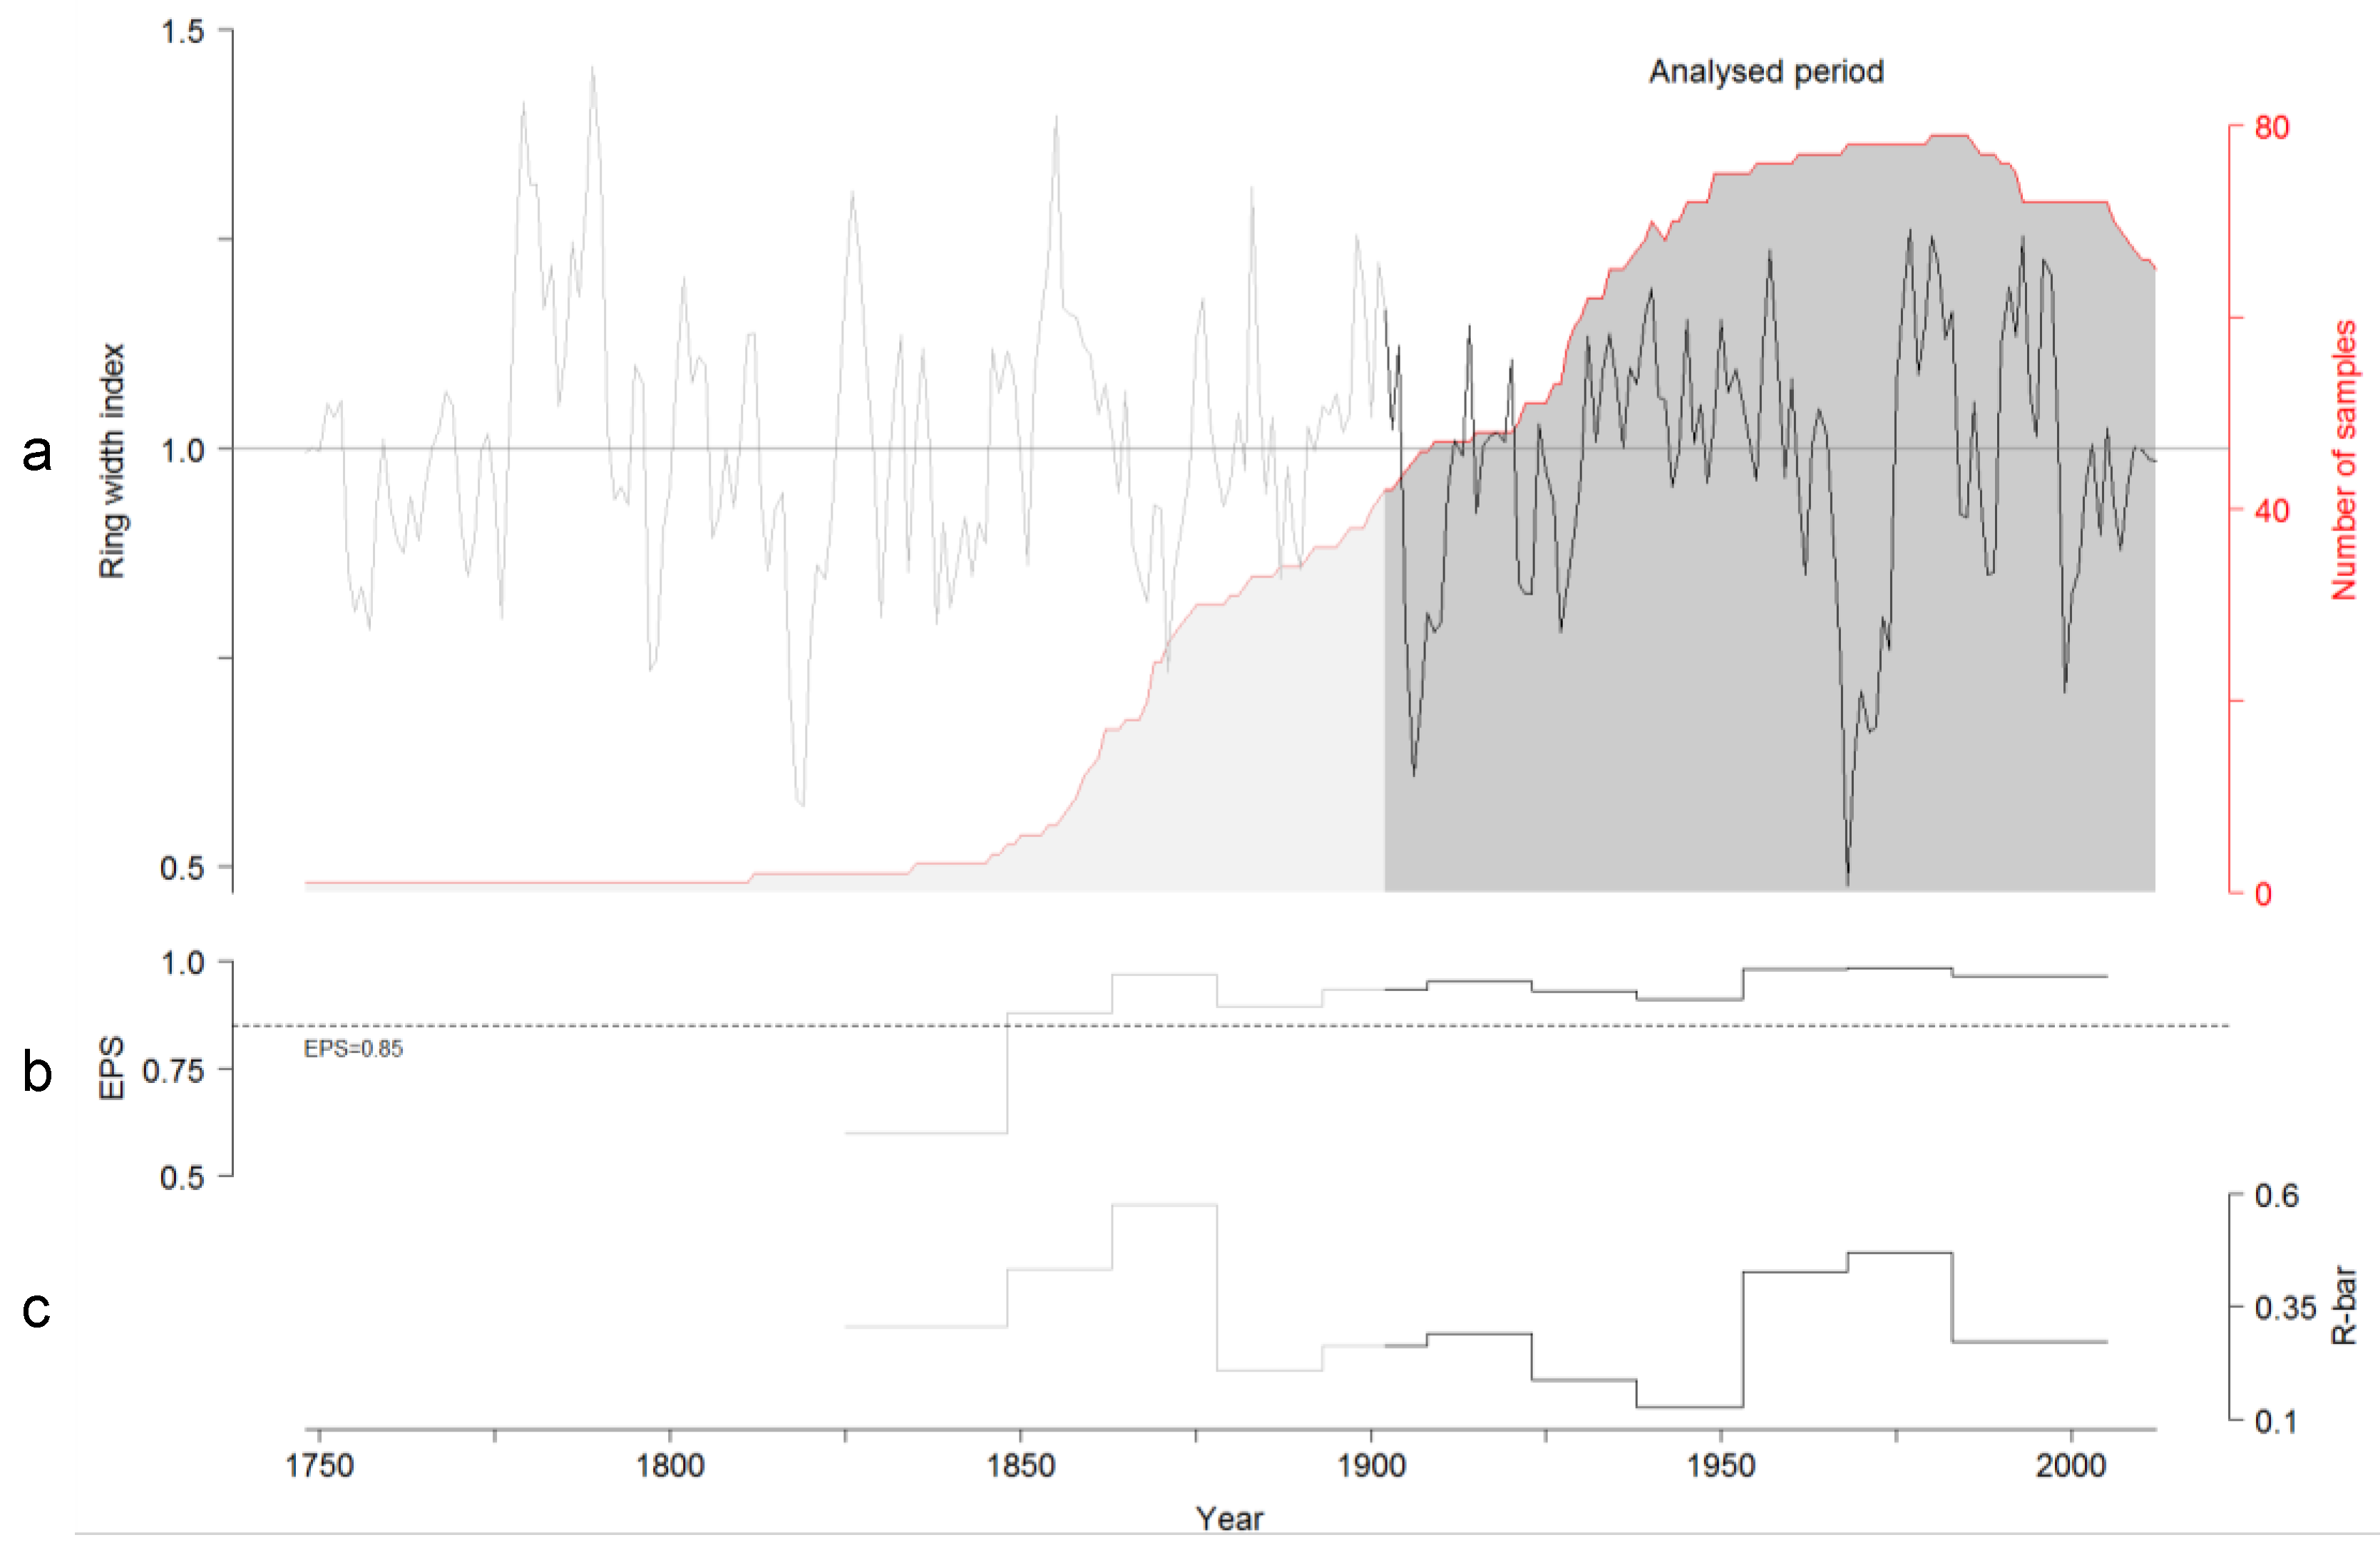
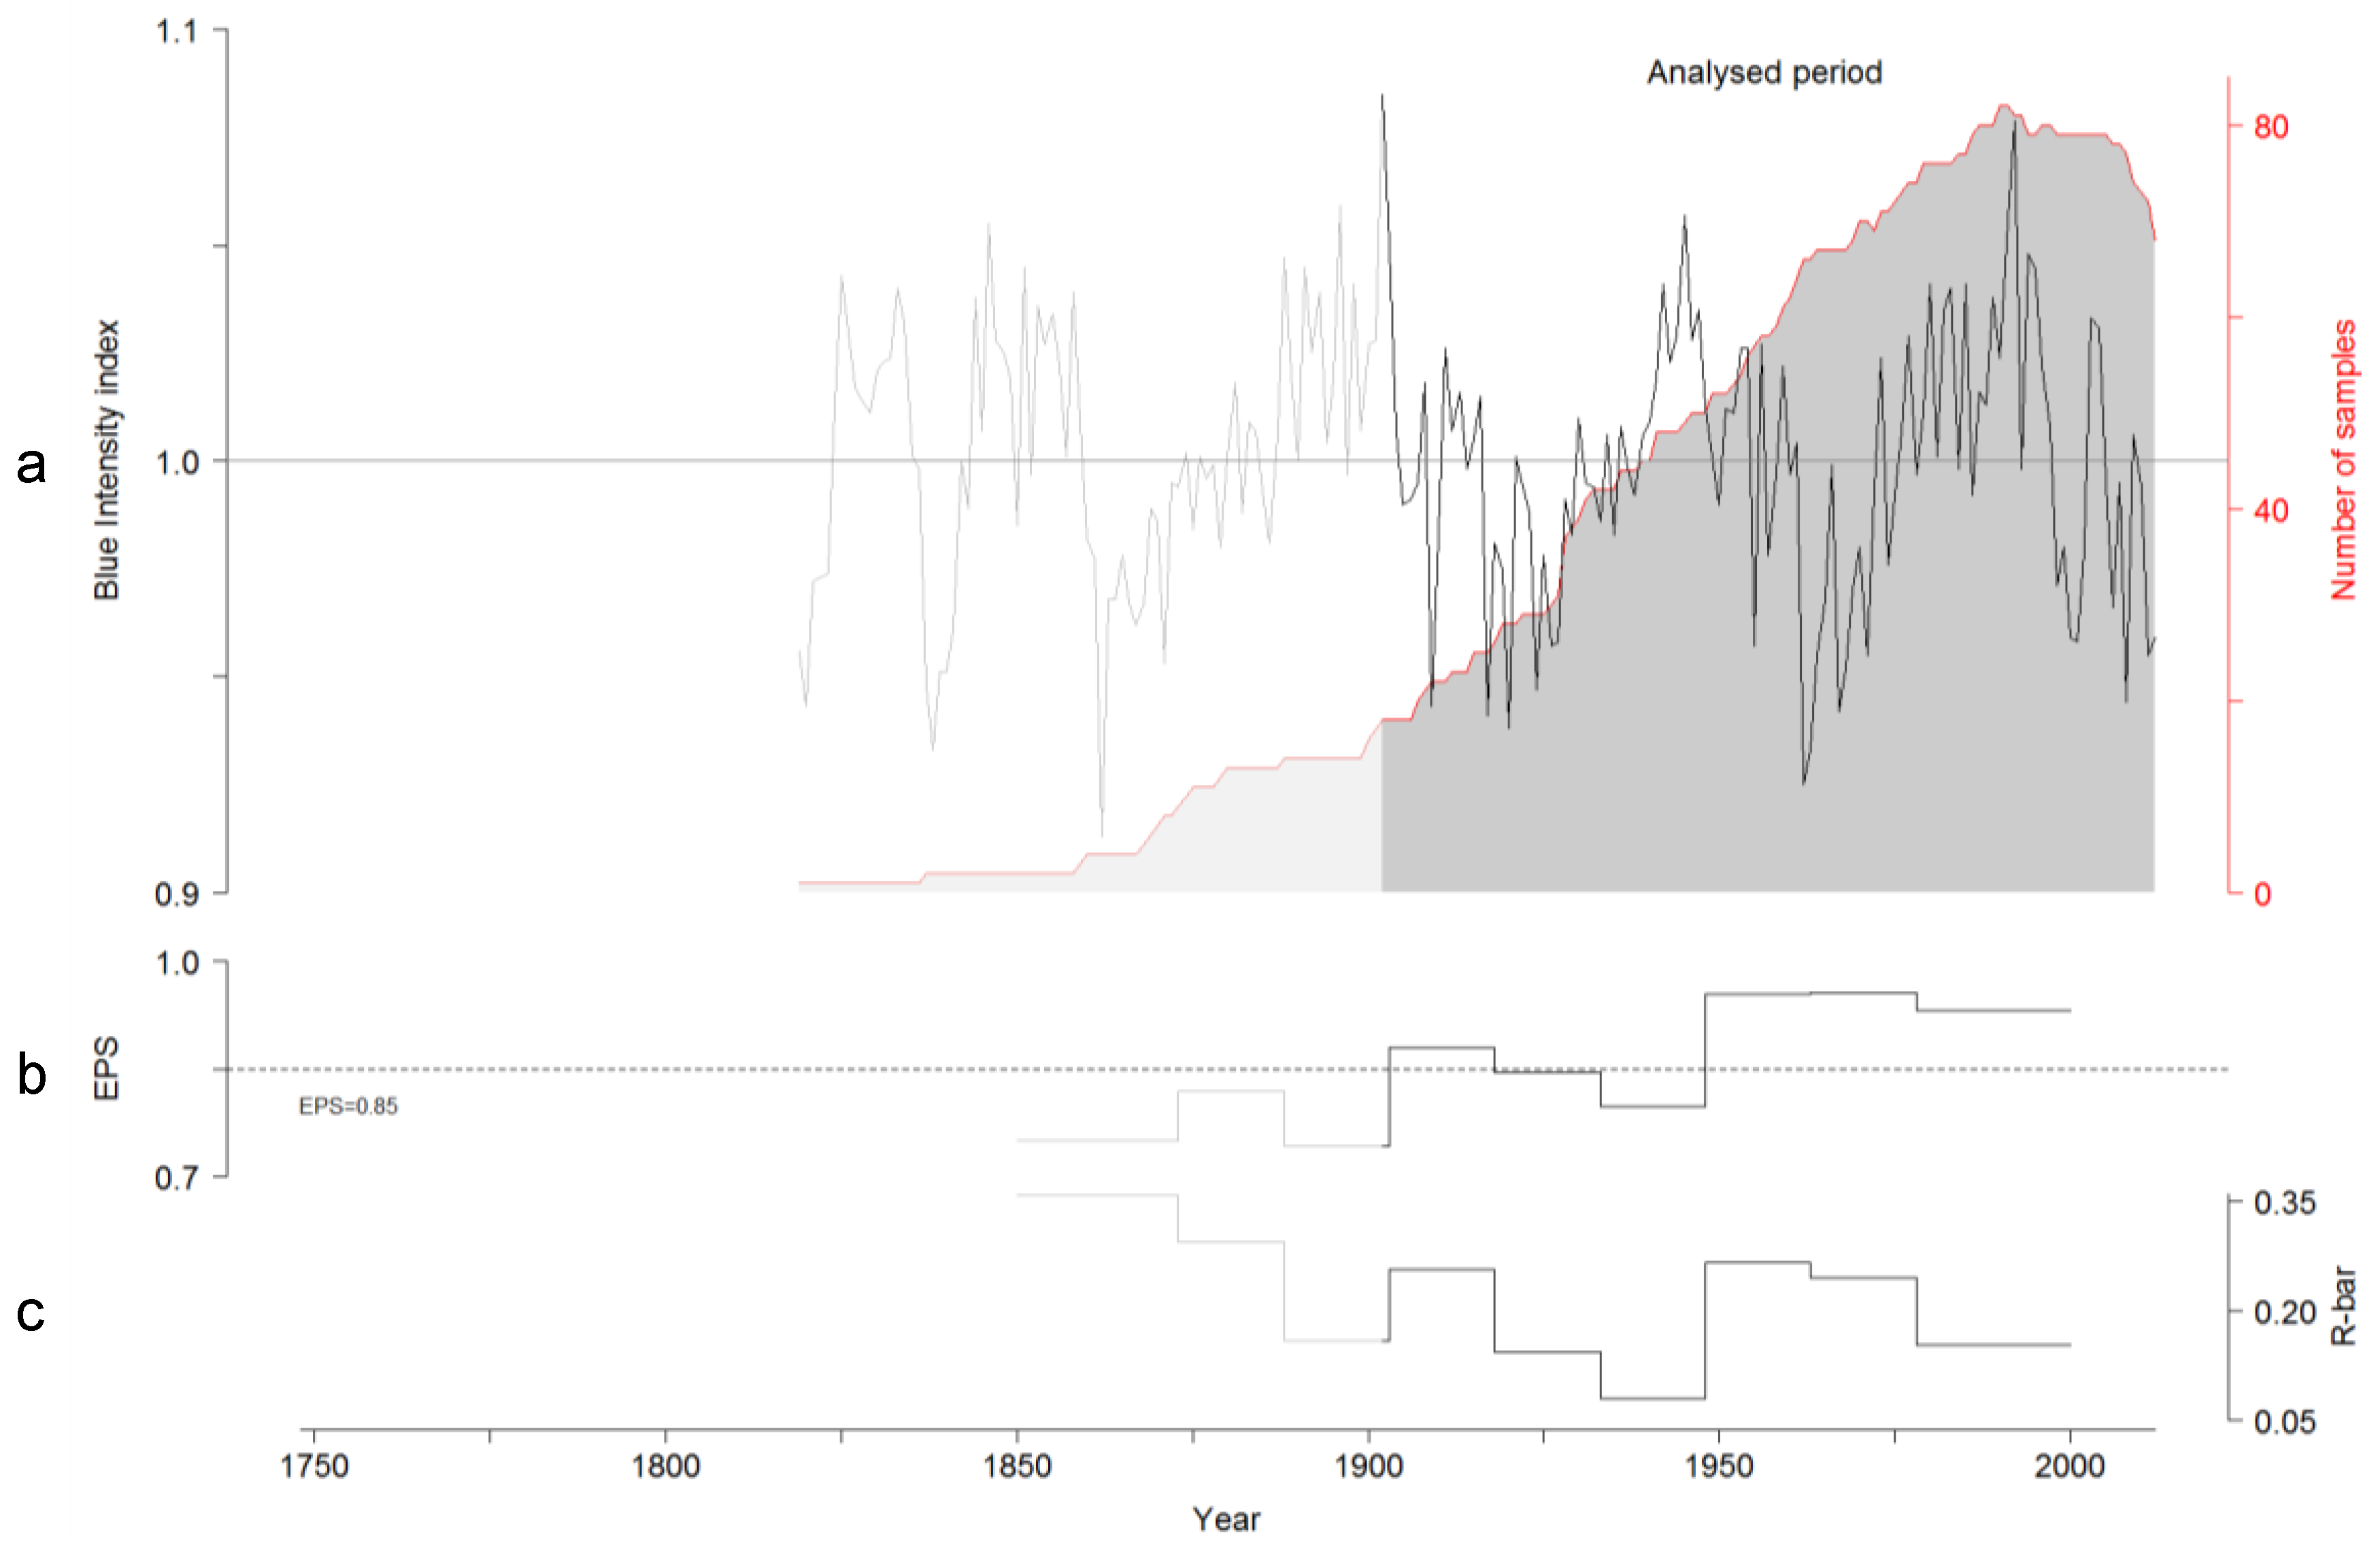
3.2. TRW and BI Chronologies
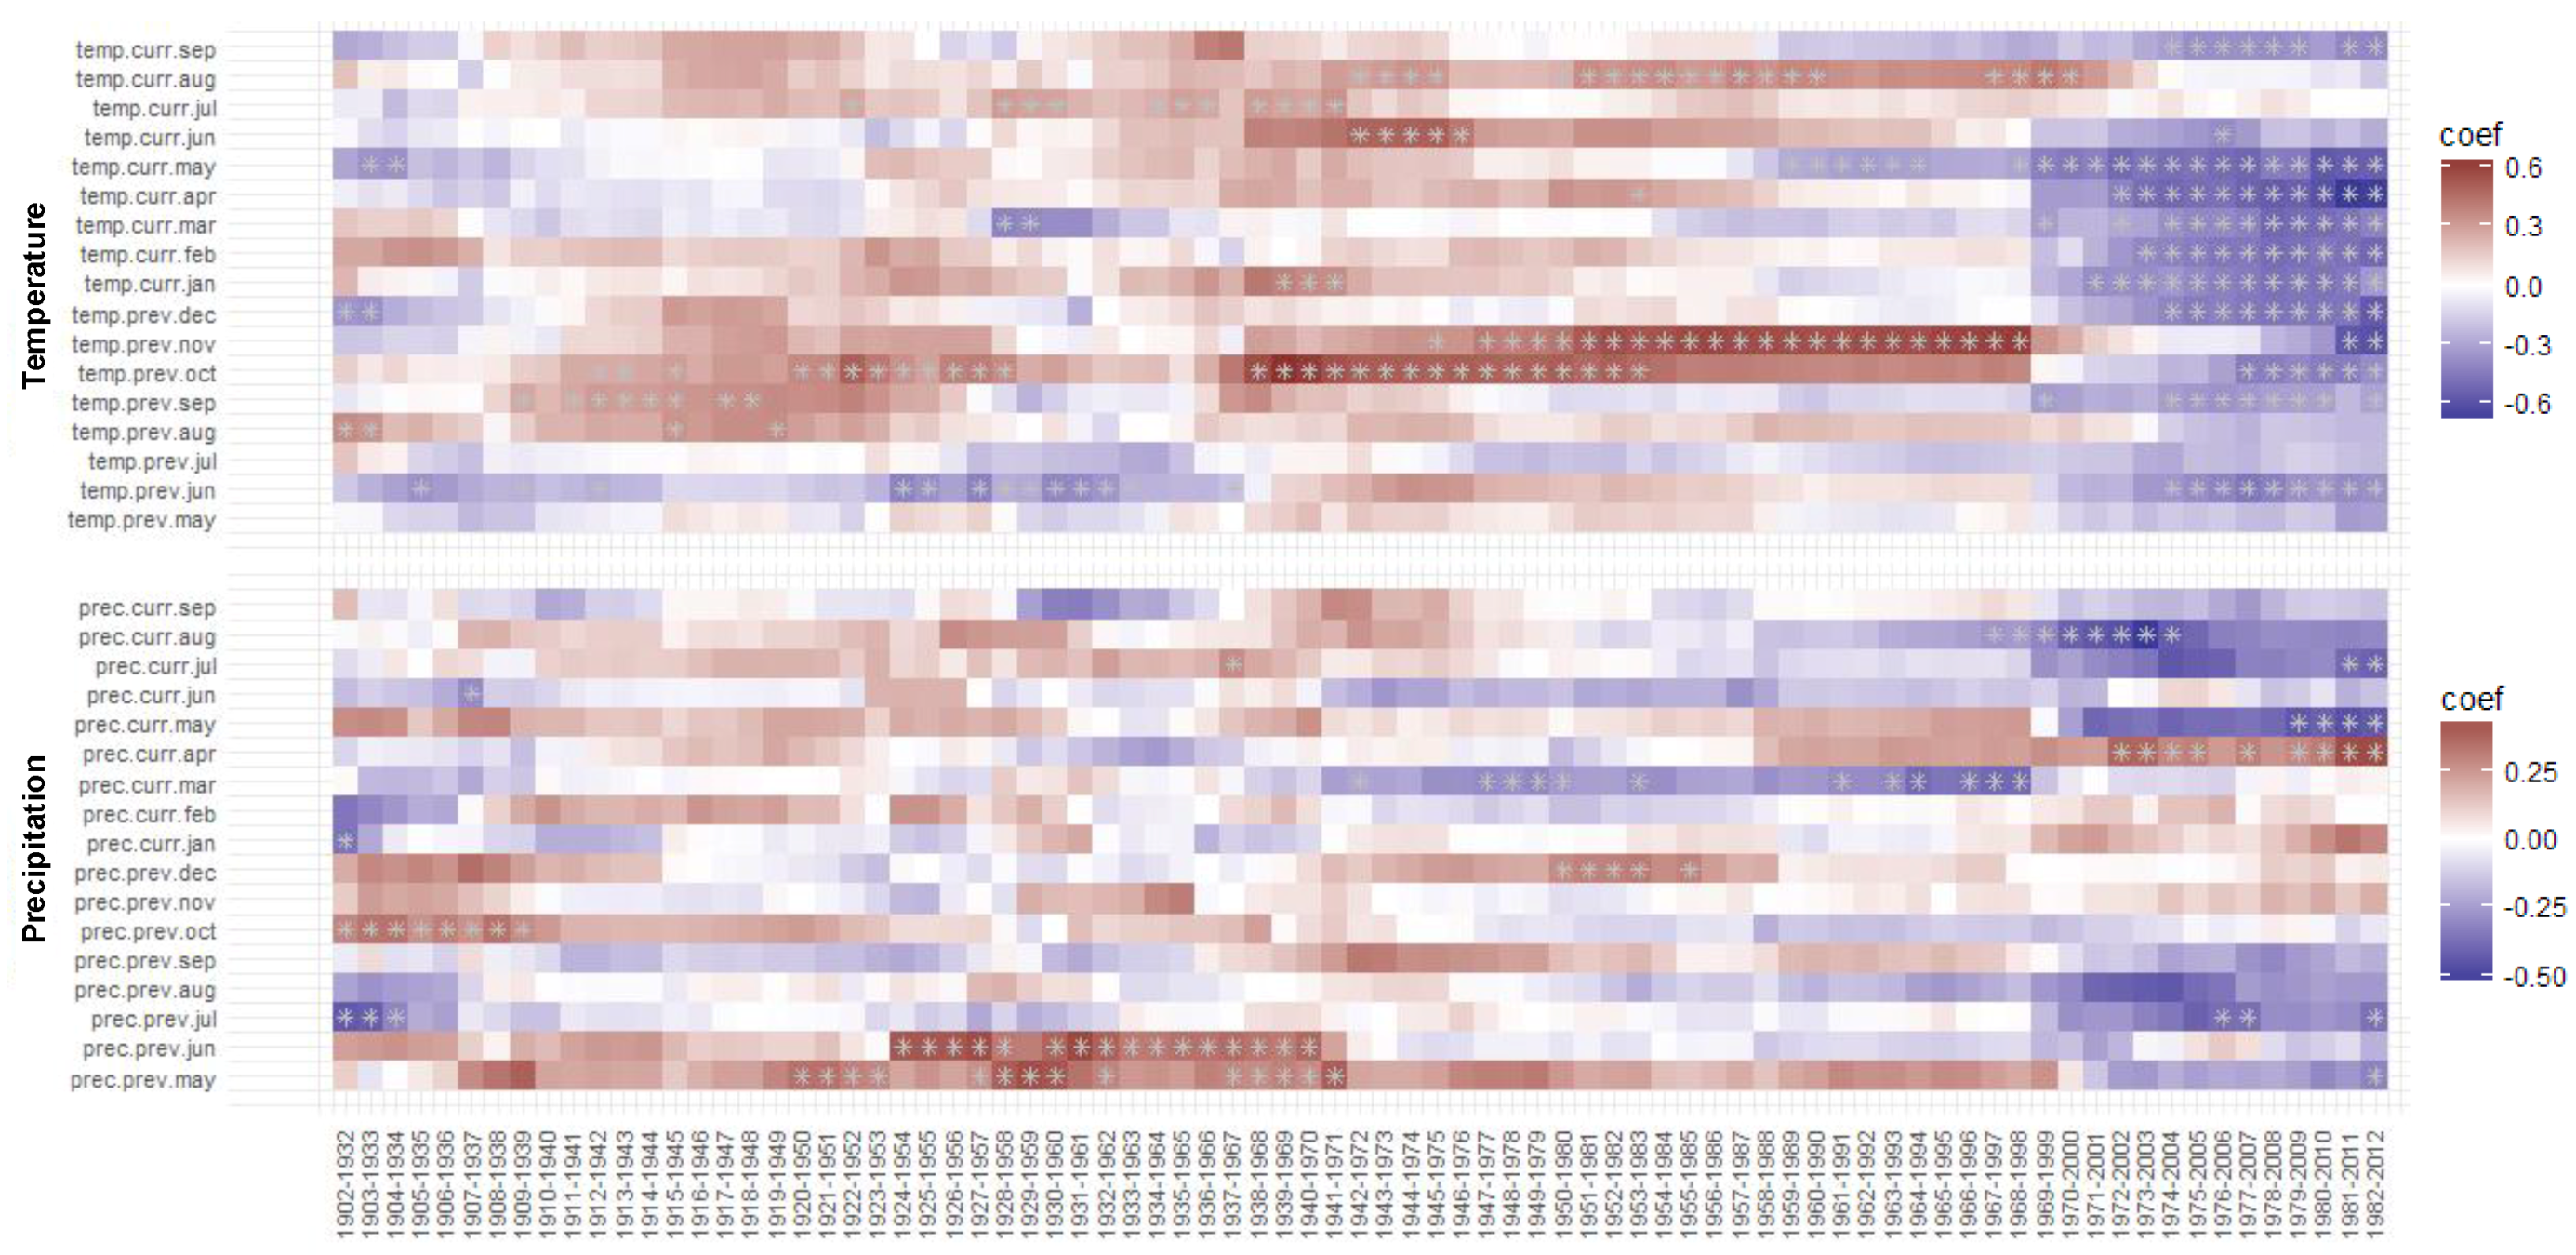
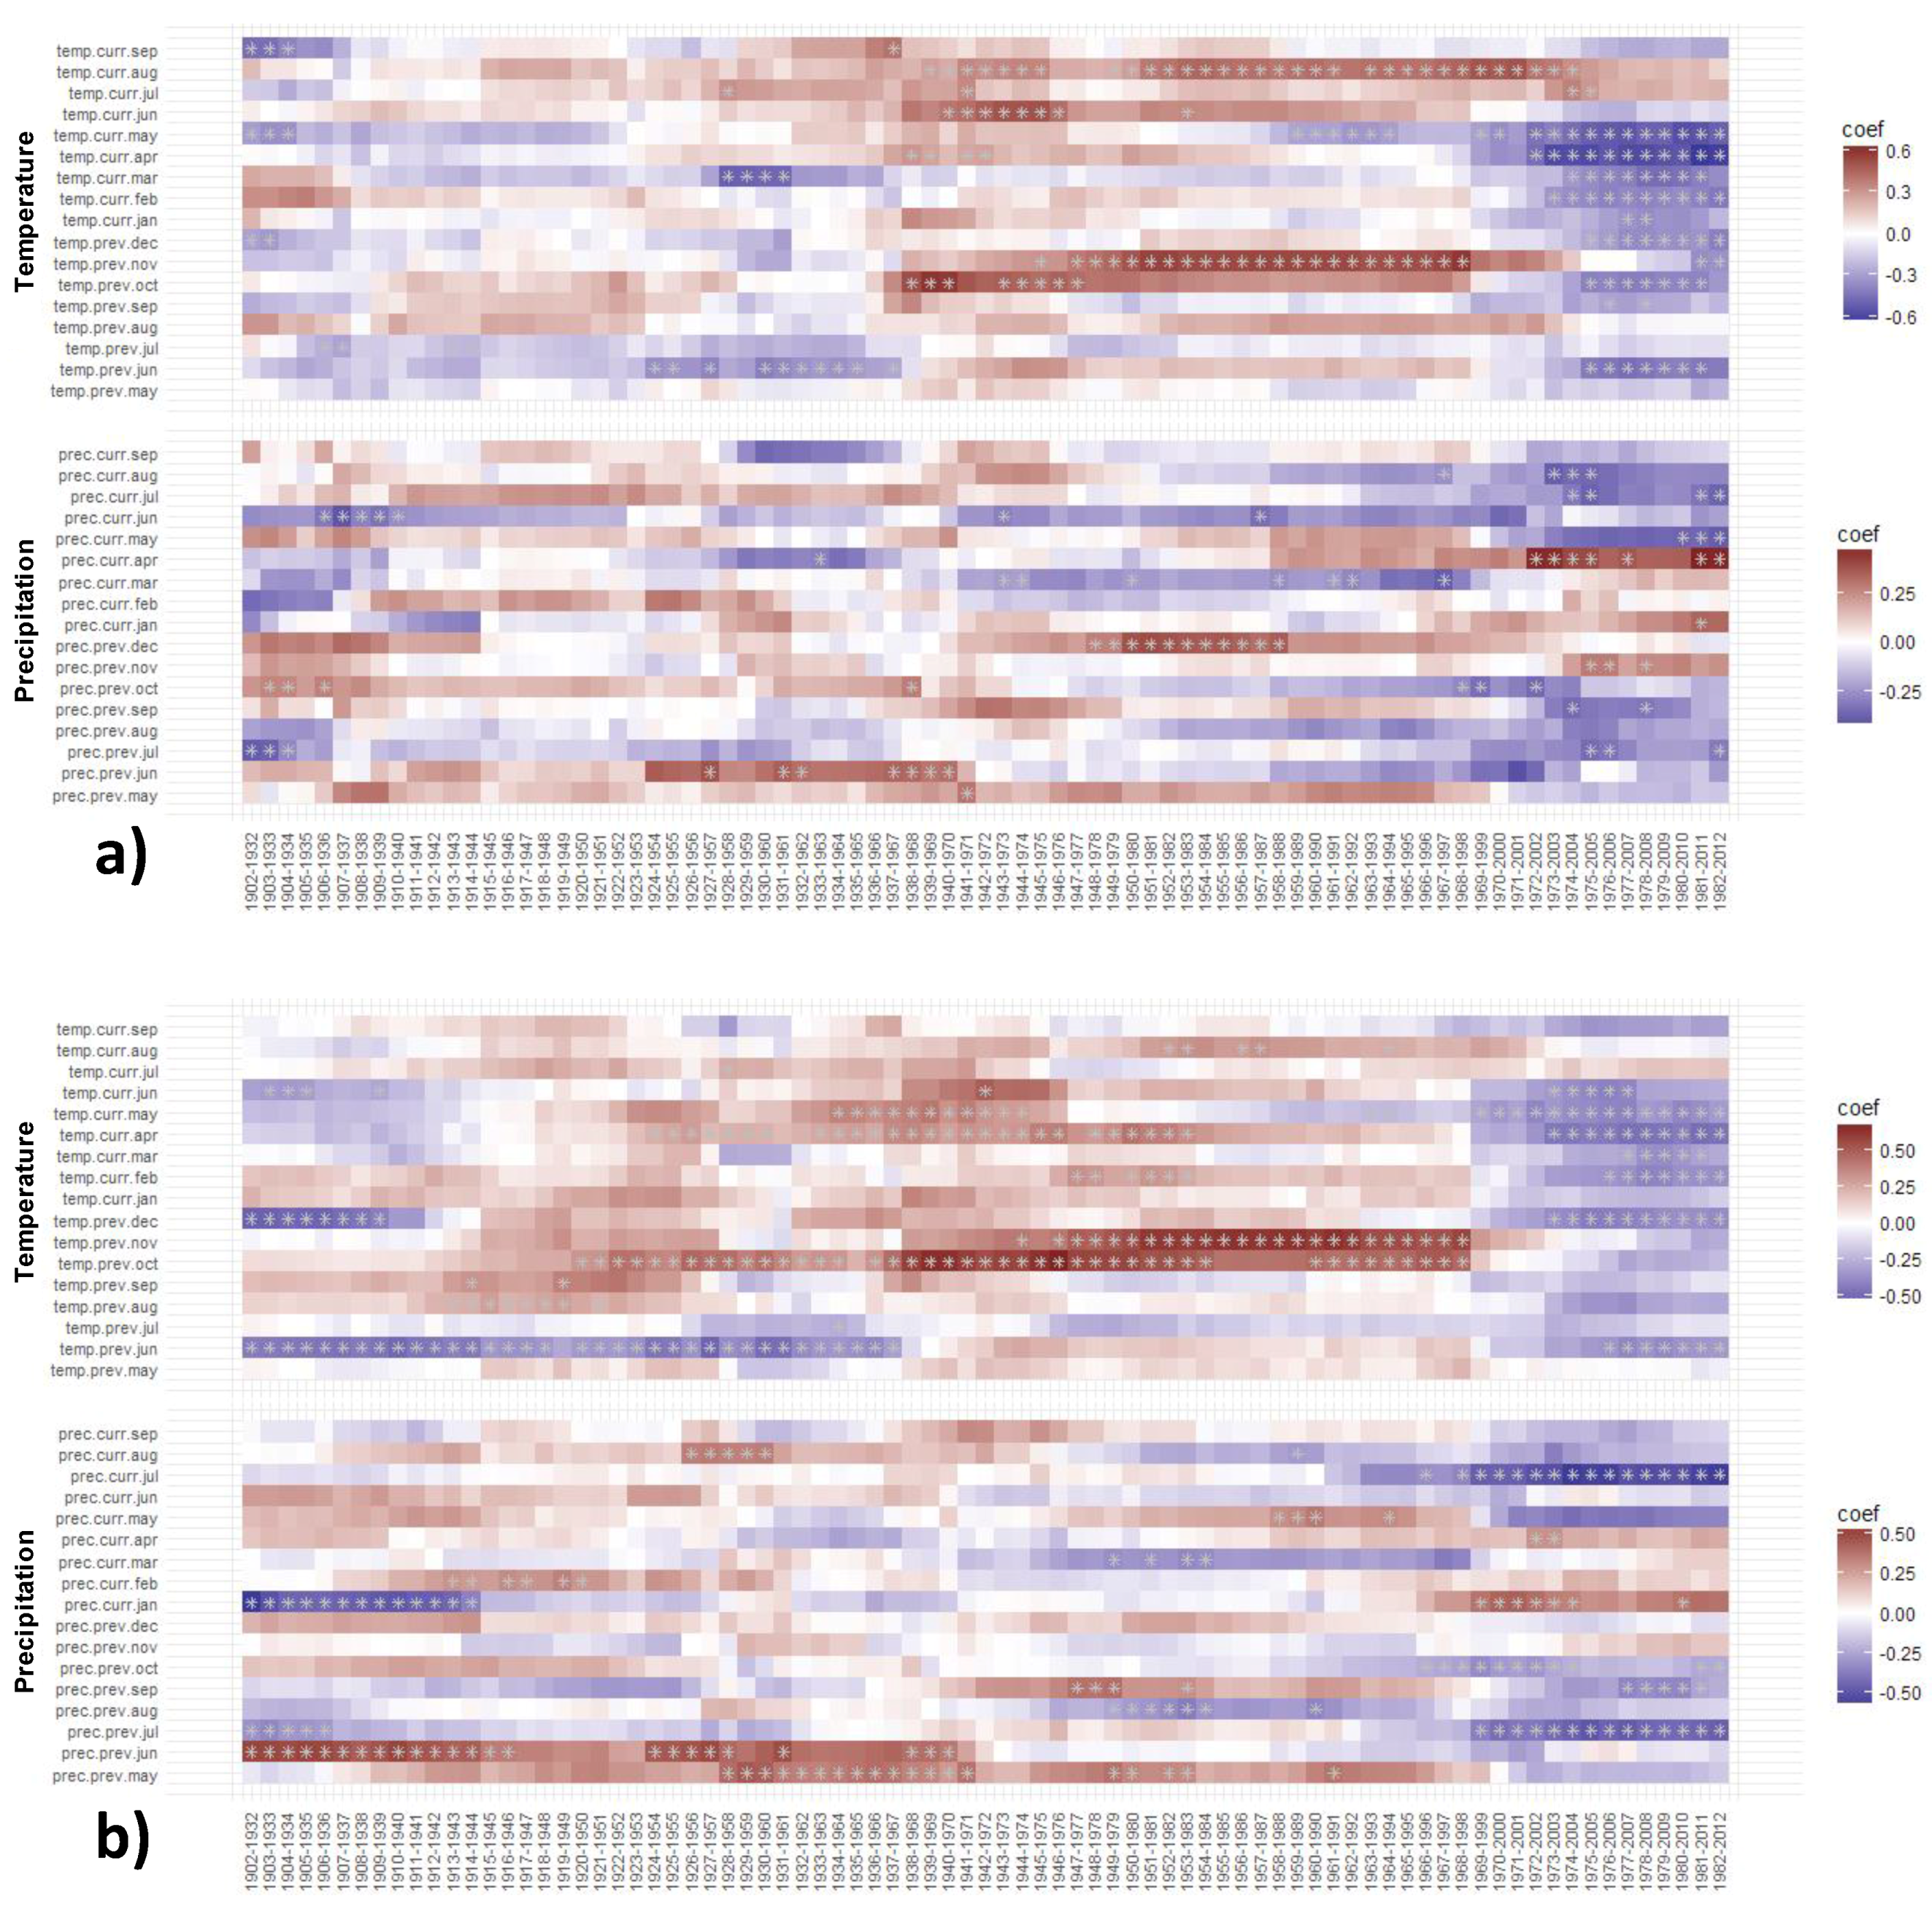
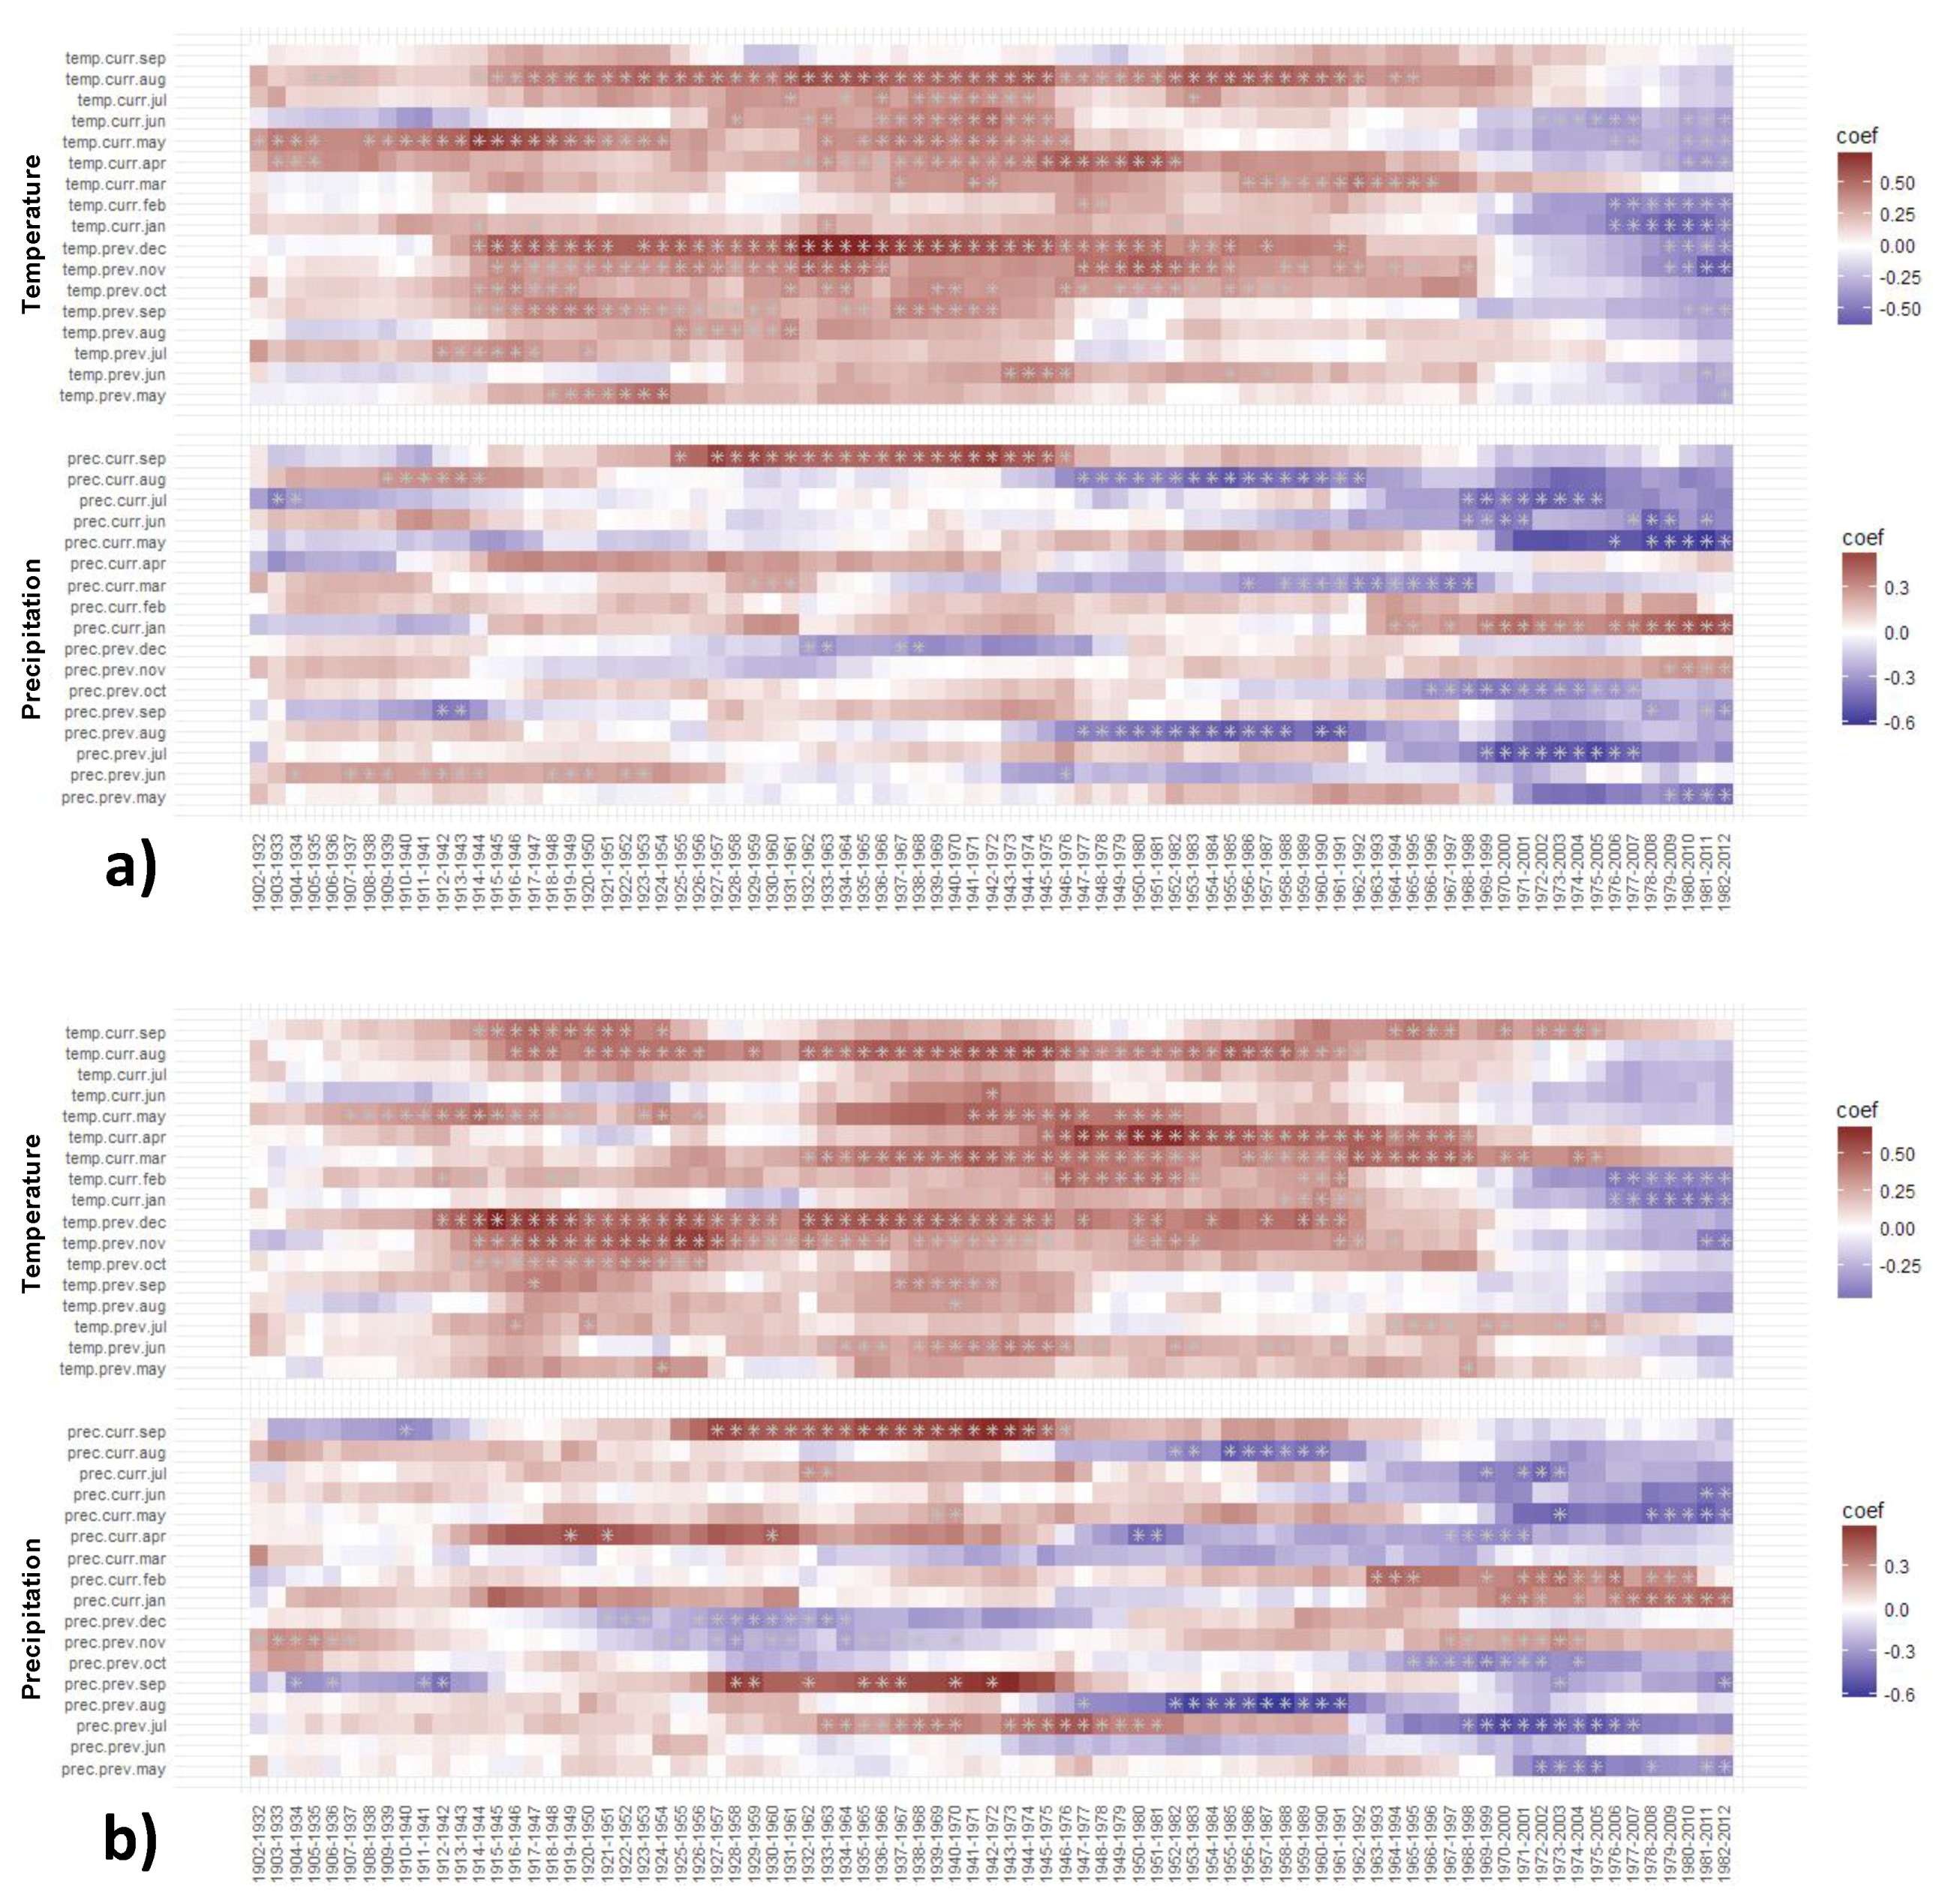
3.3. Moving and Evolving Window Correlations of TRW and BI Chronologies with Climate in the Period 1902–2012
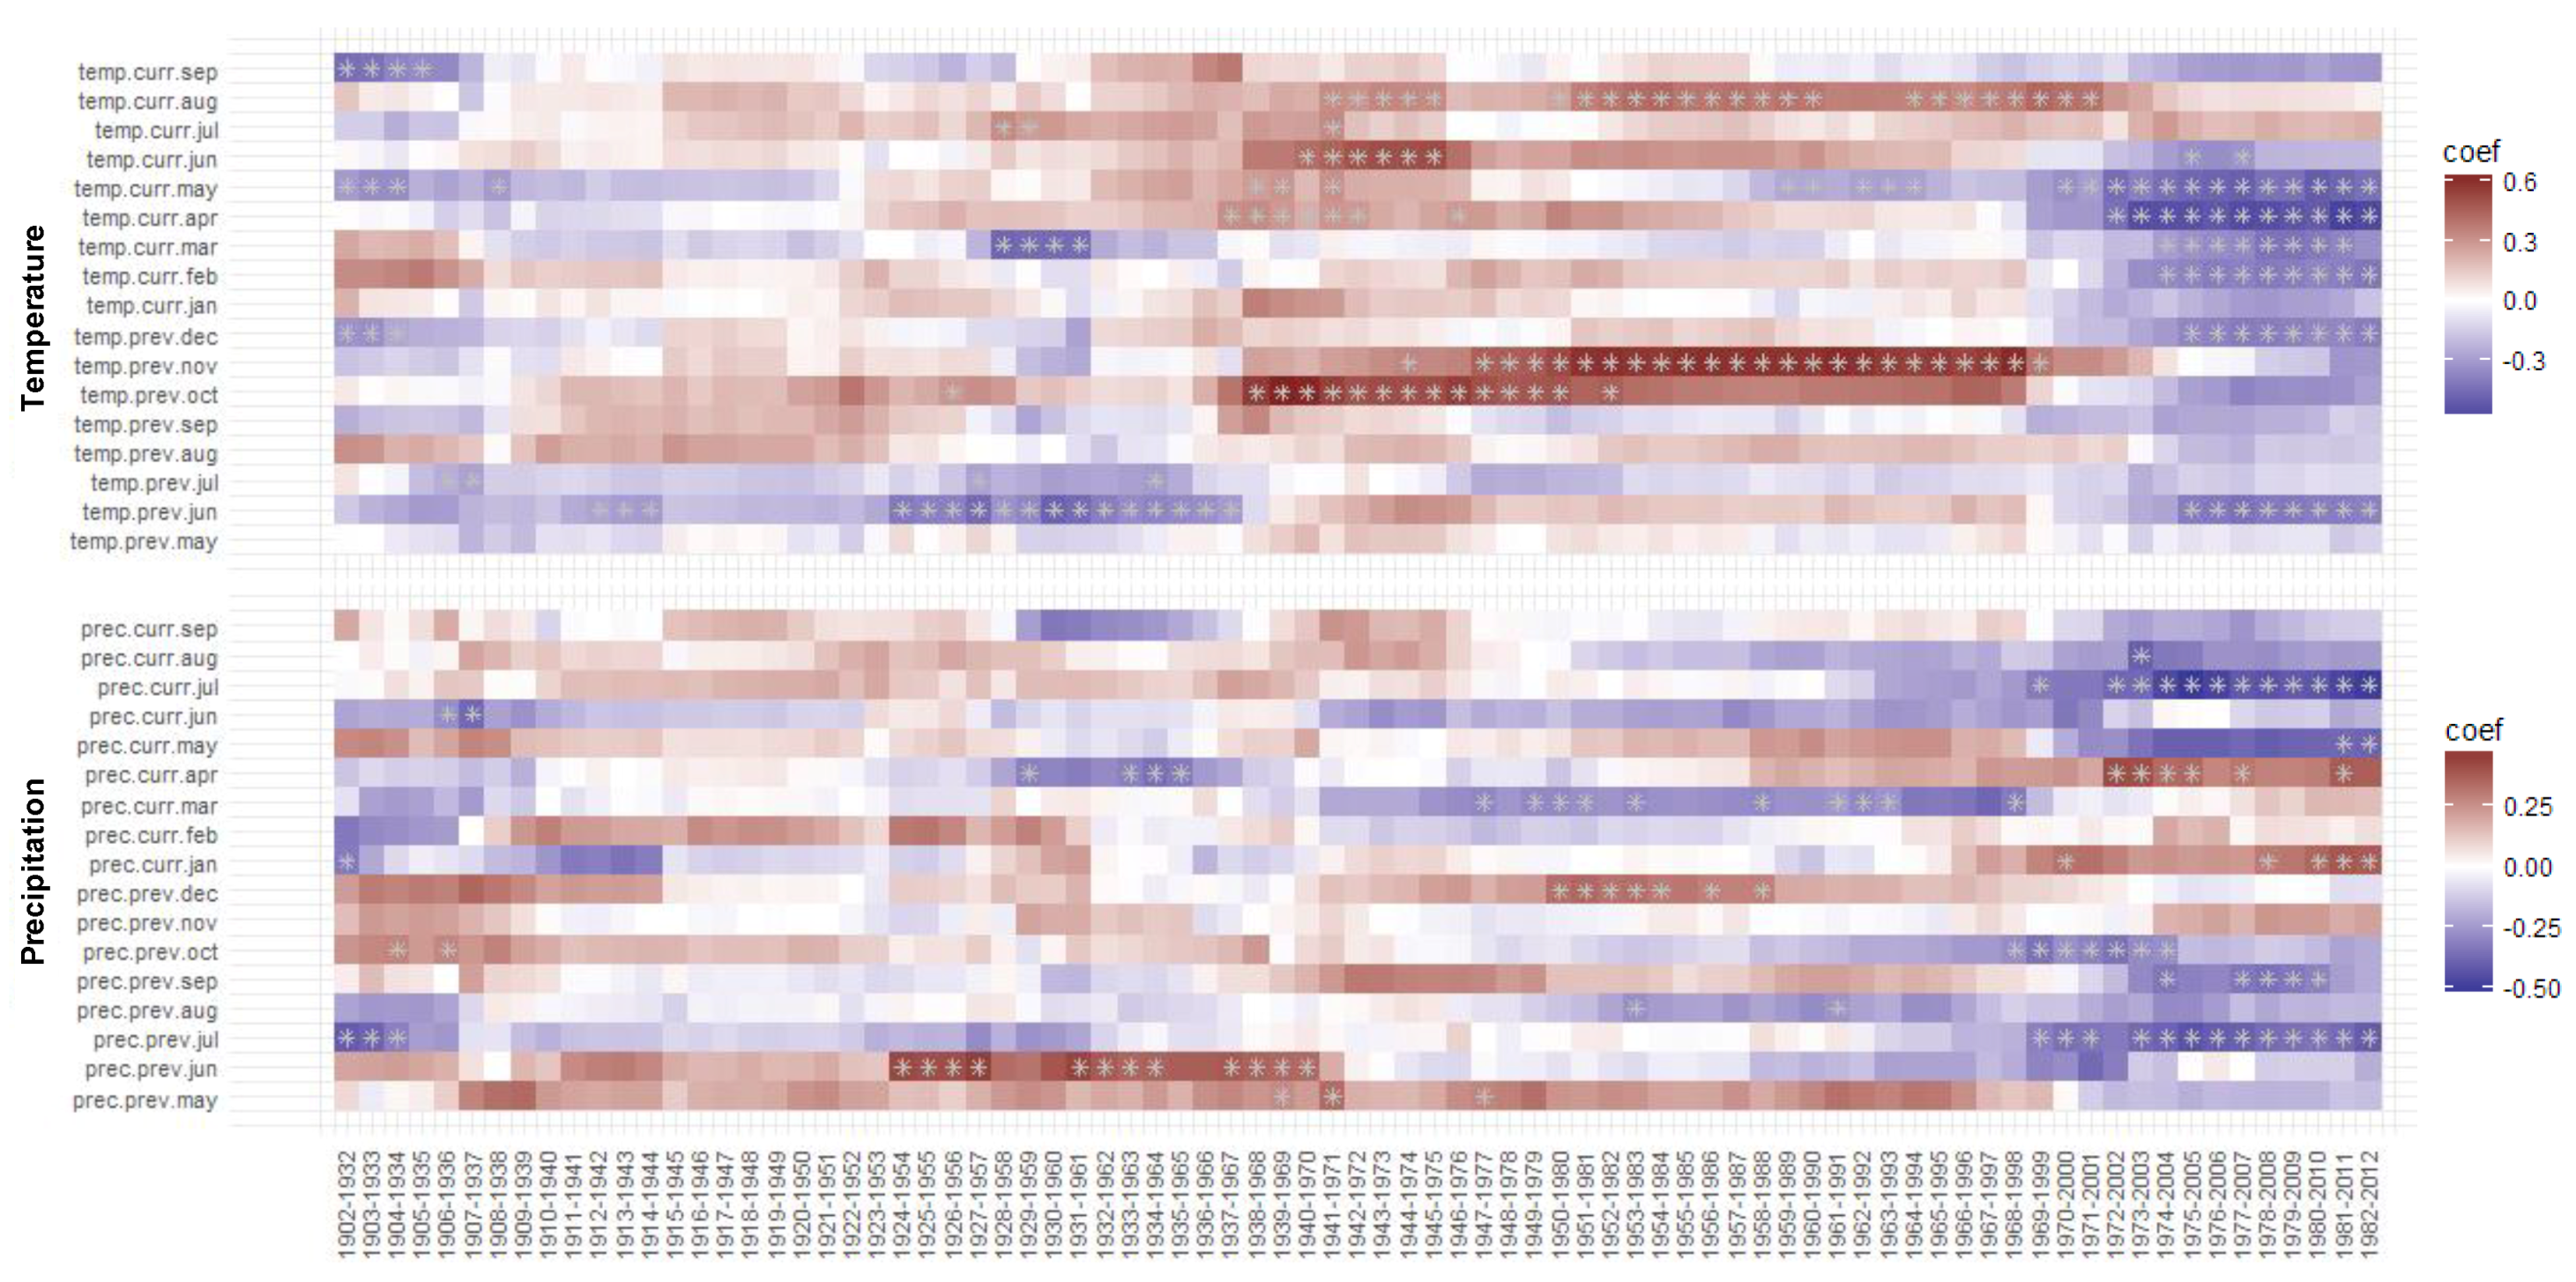
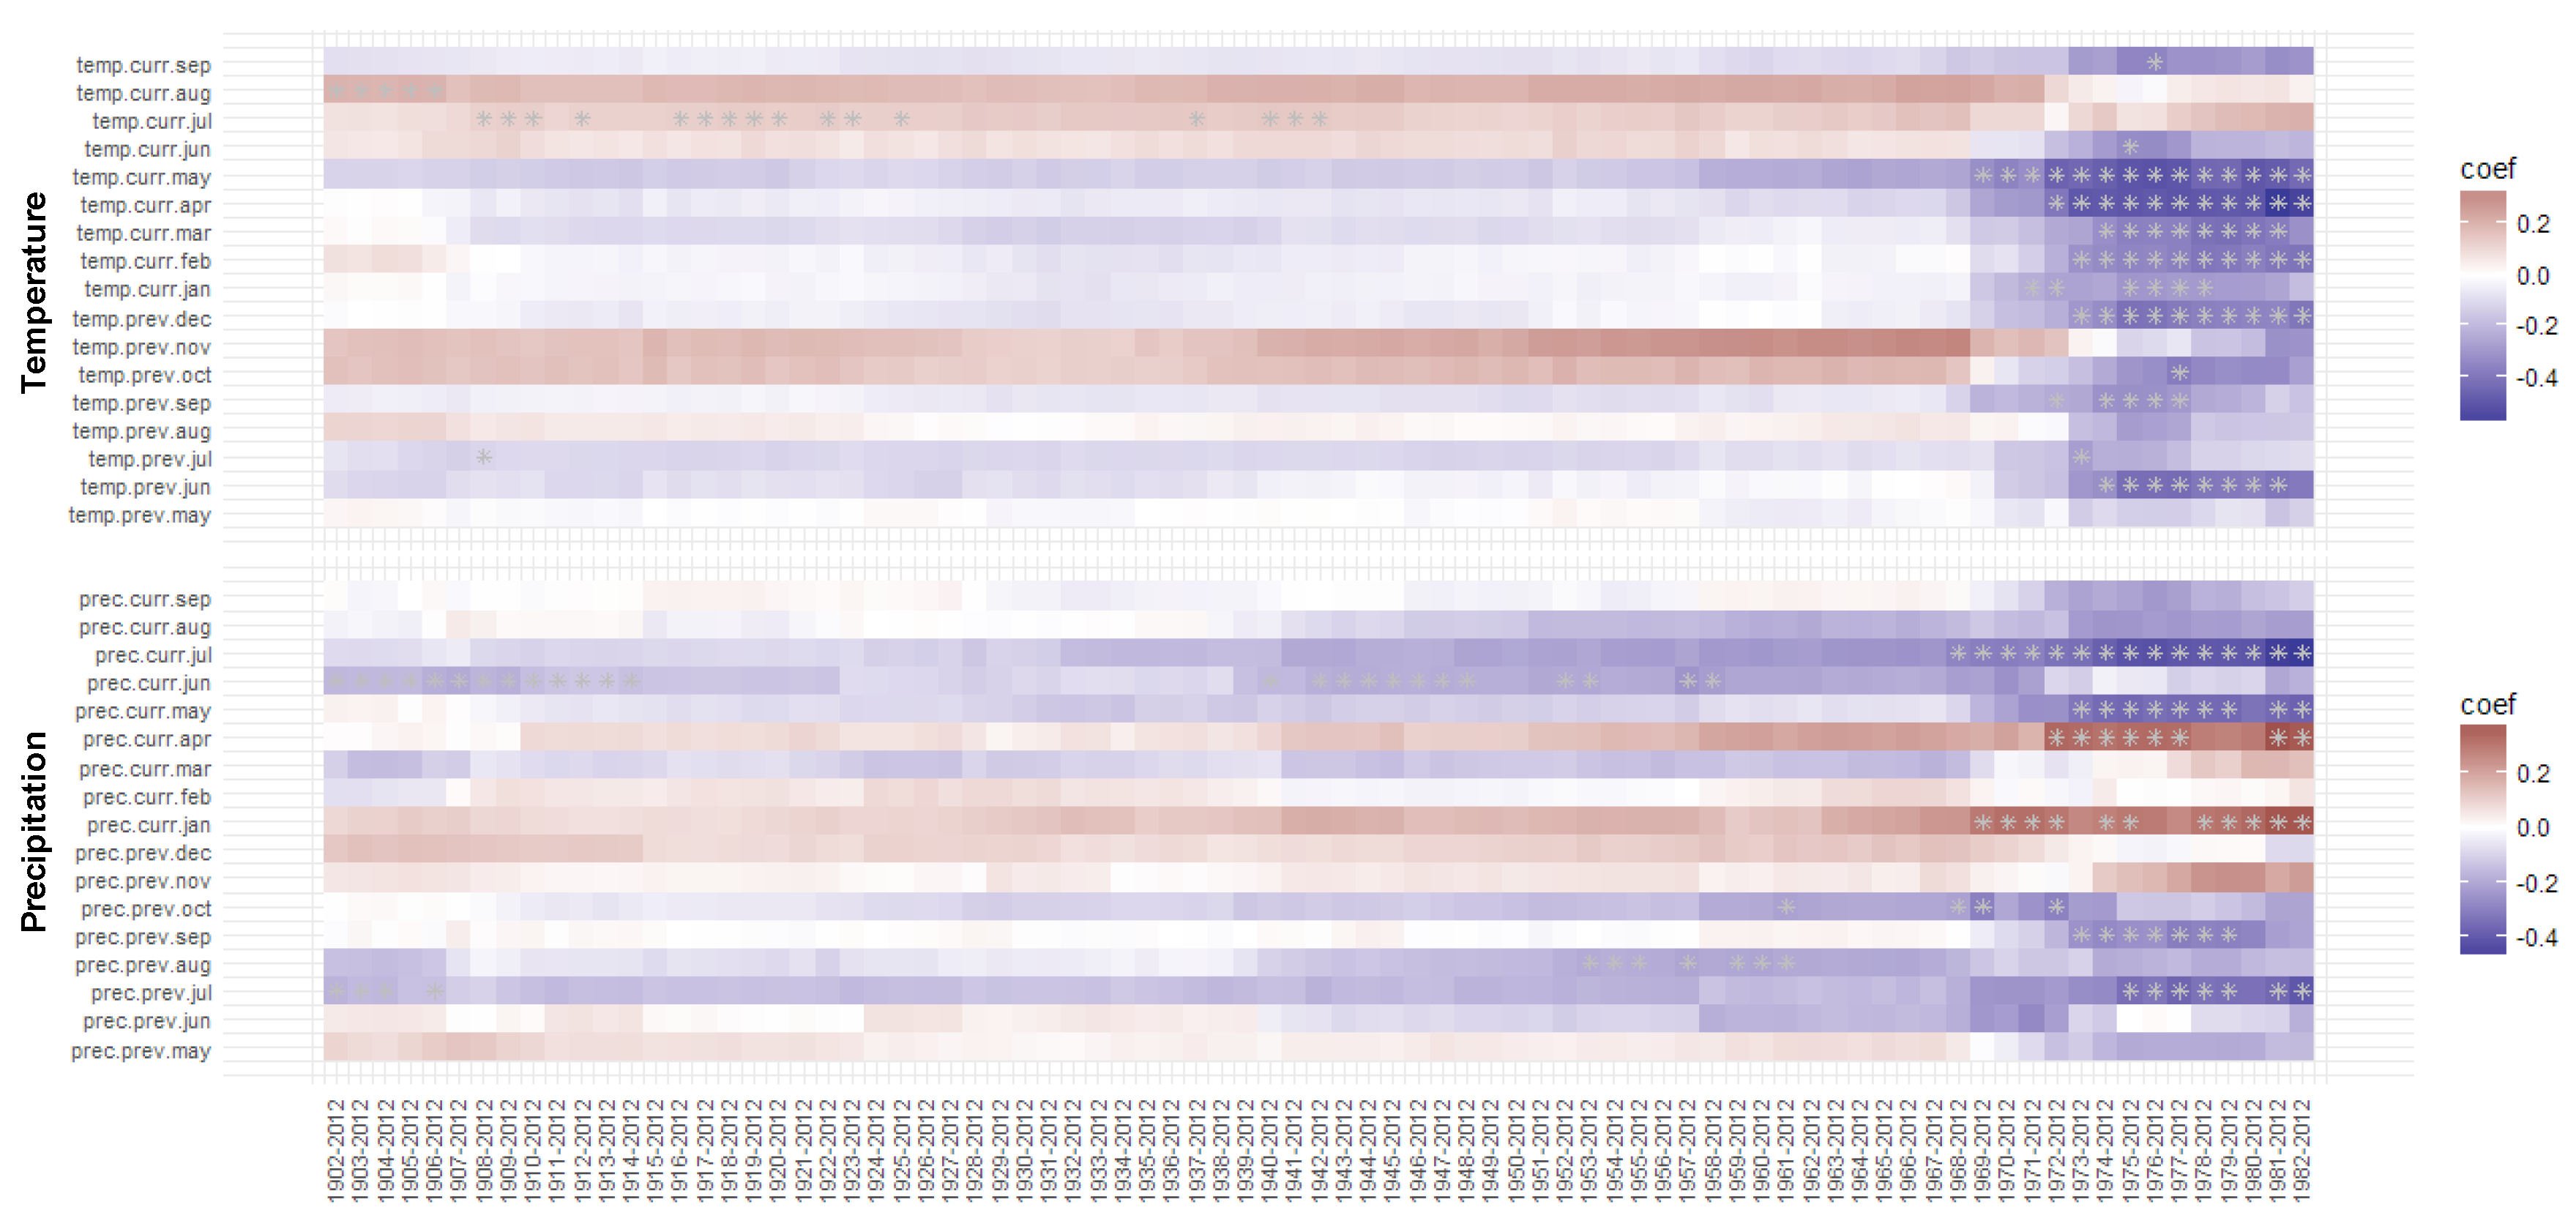
3.3.1. Moving TRW–Climate Correlations
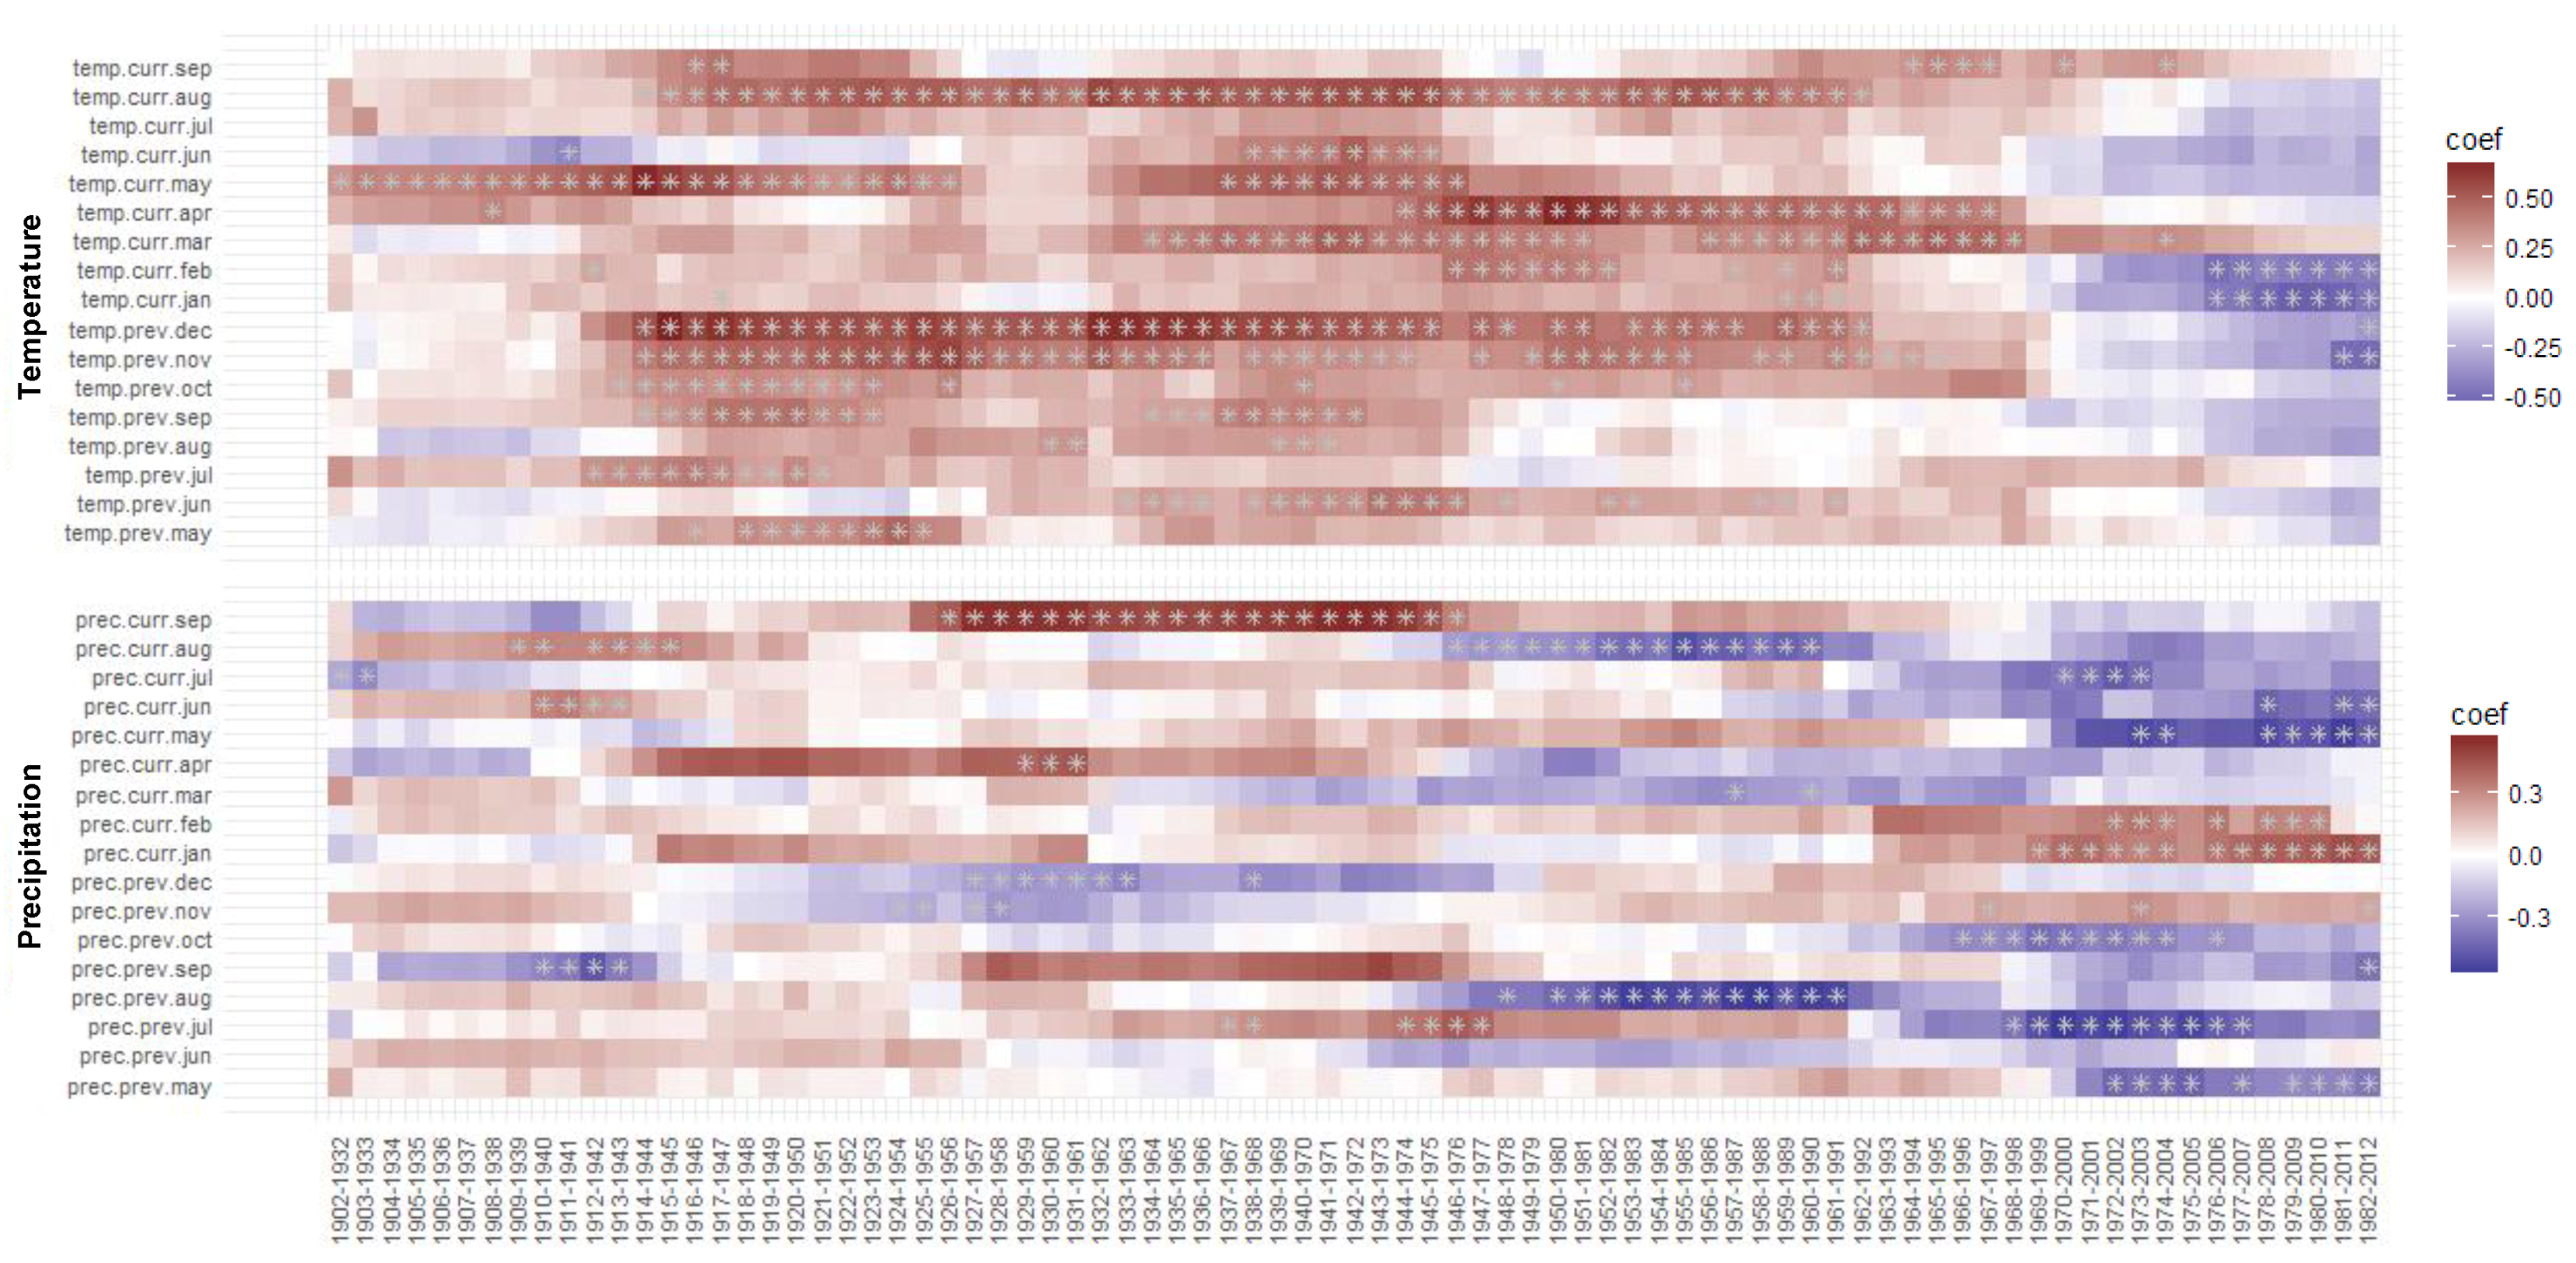
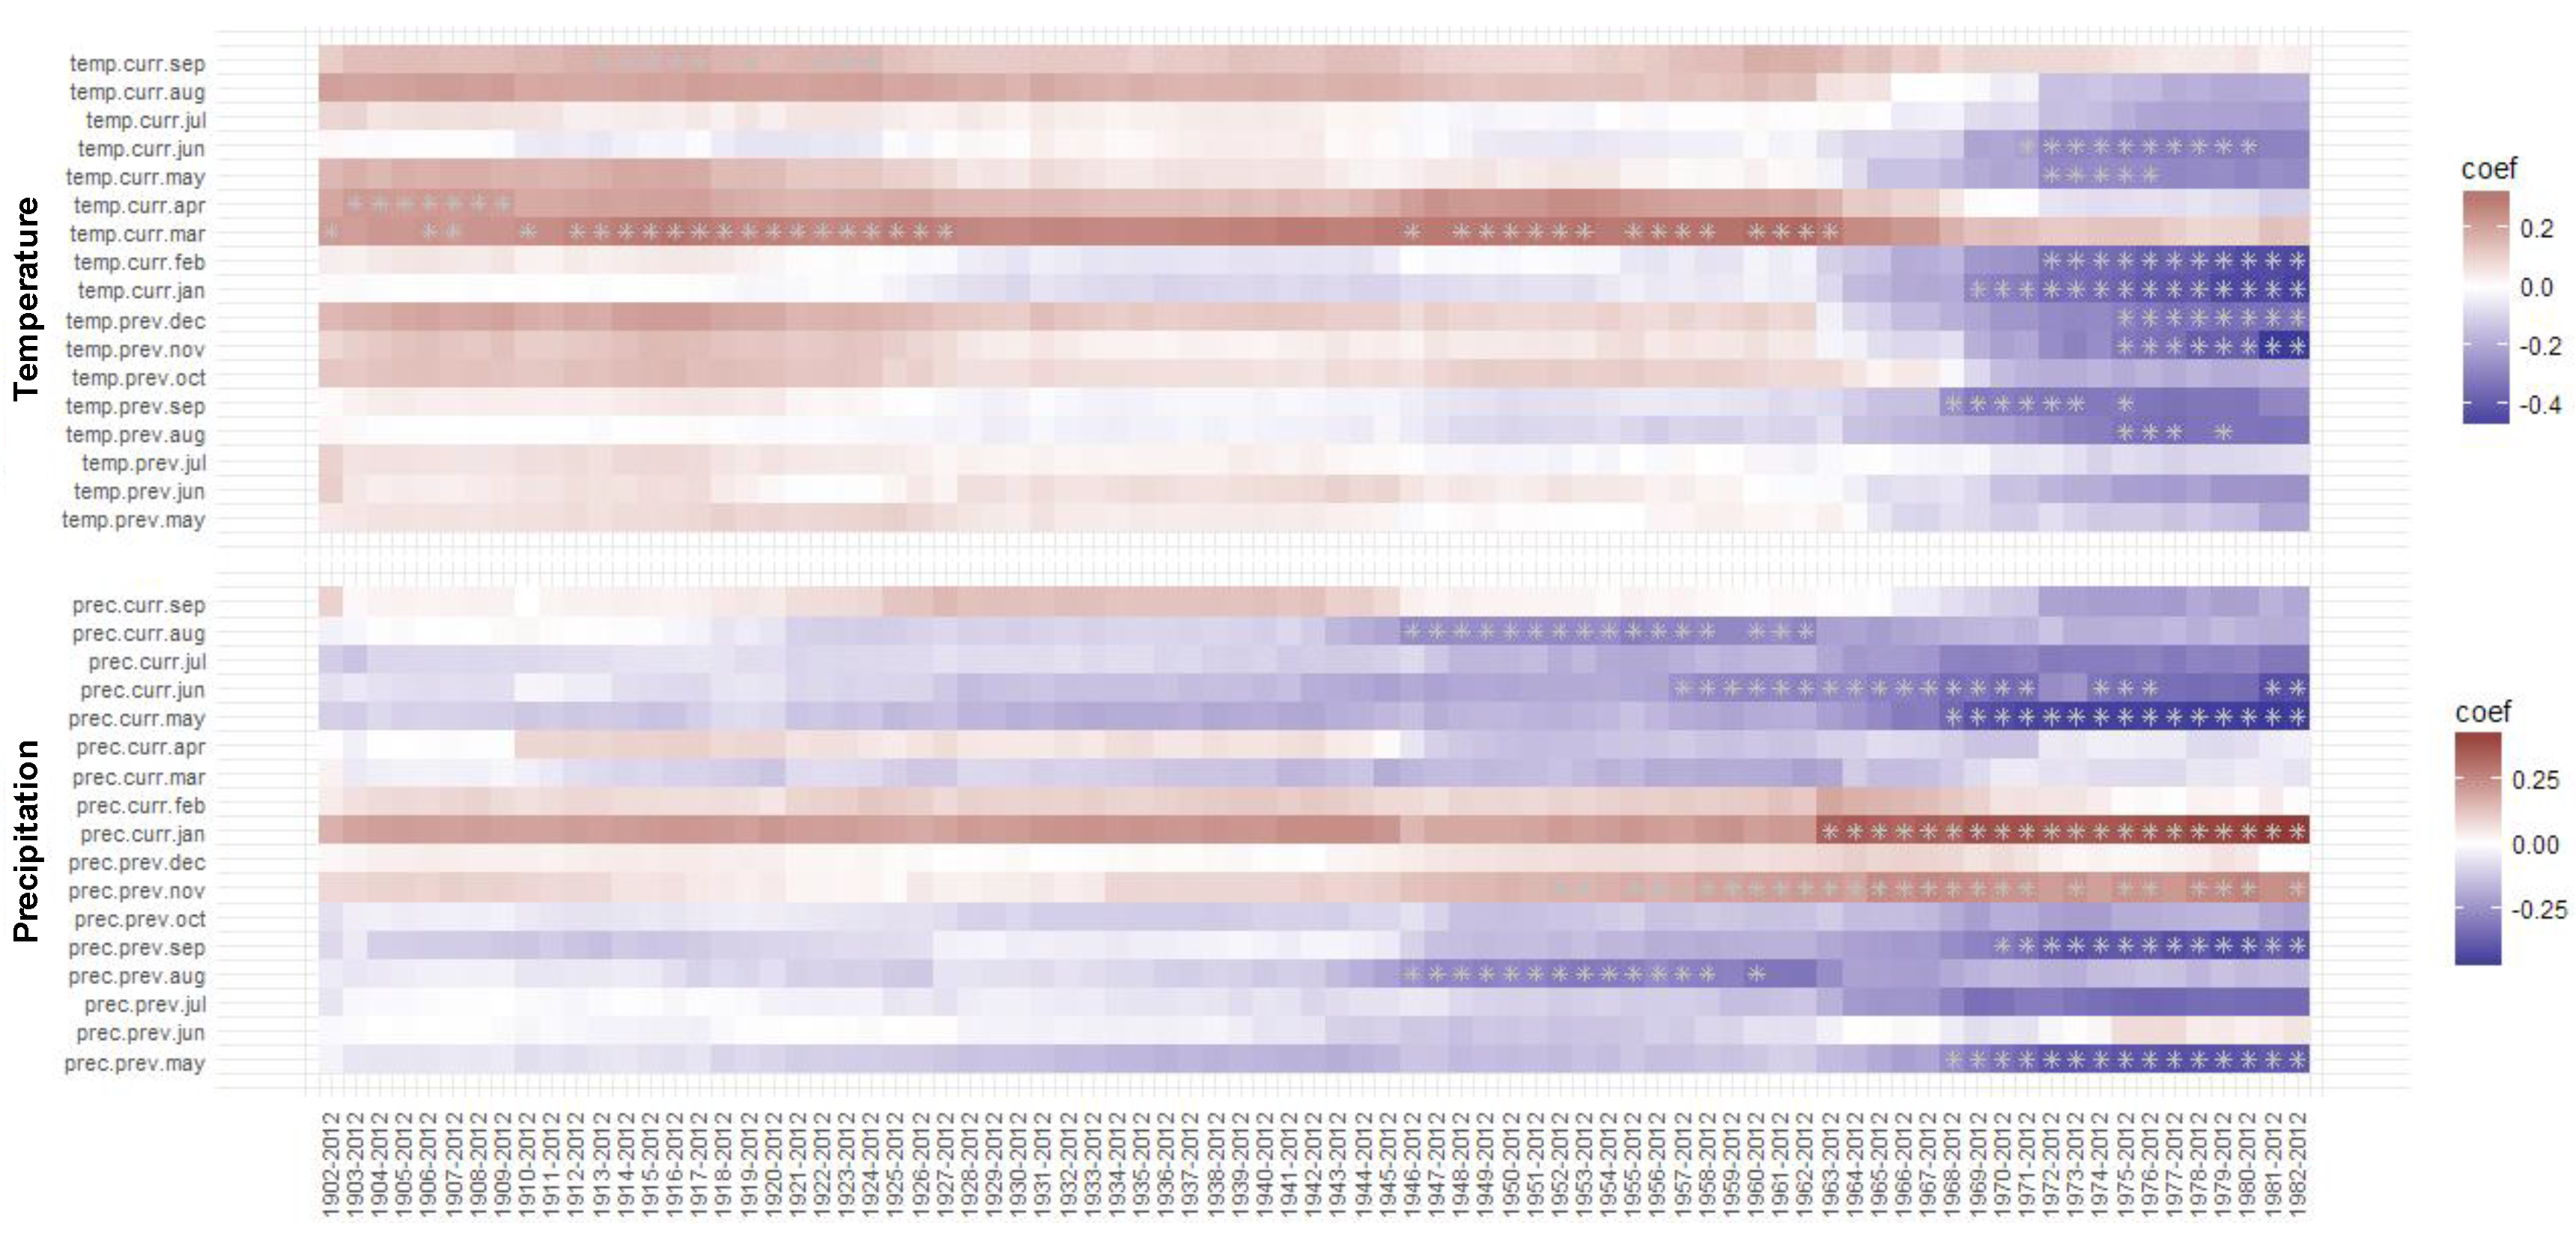
3.3.2. Moving BI–Climate Correlations
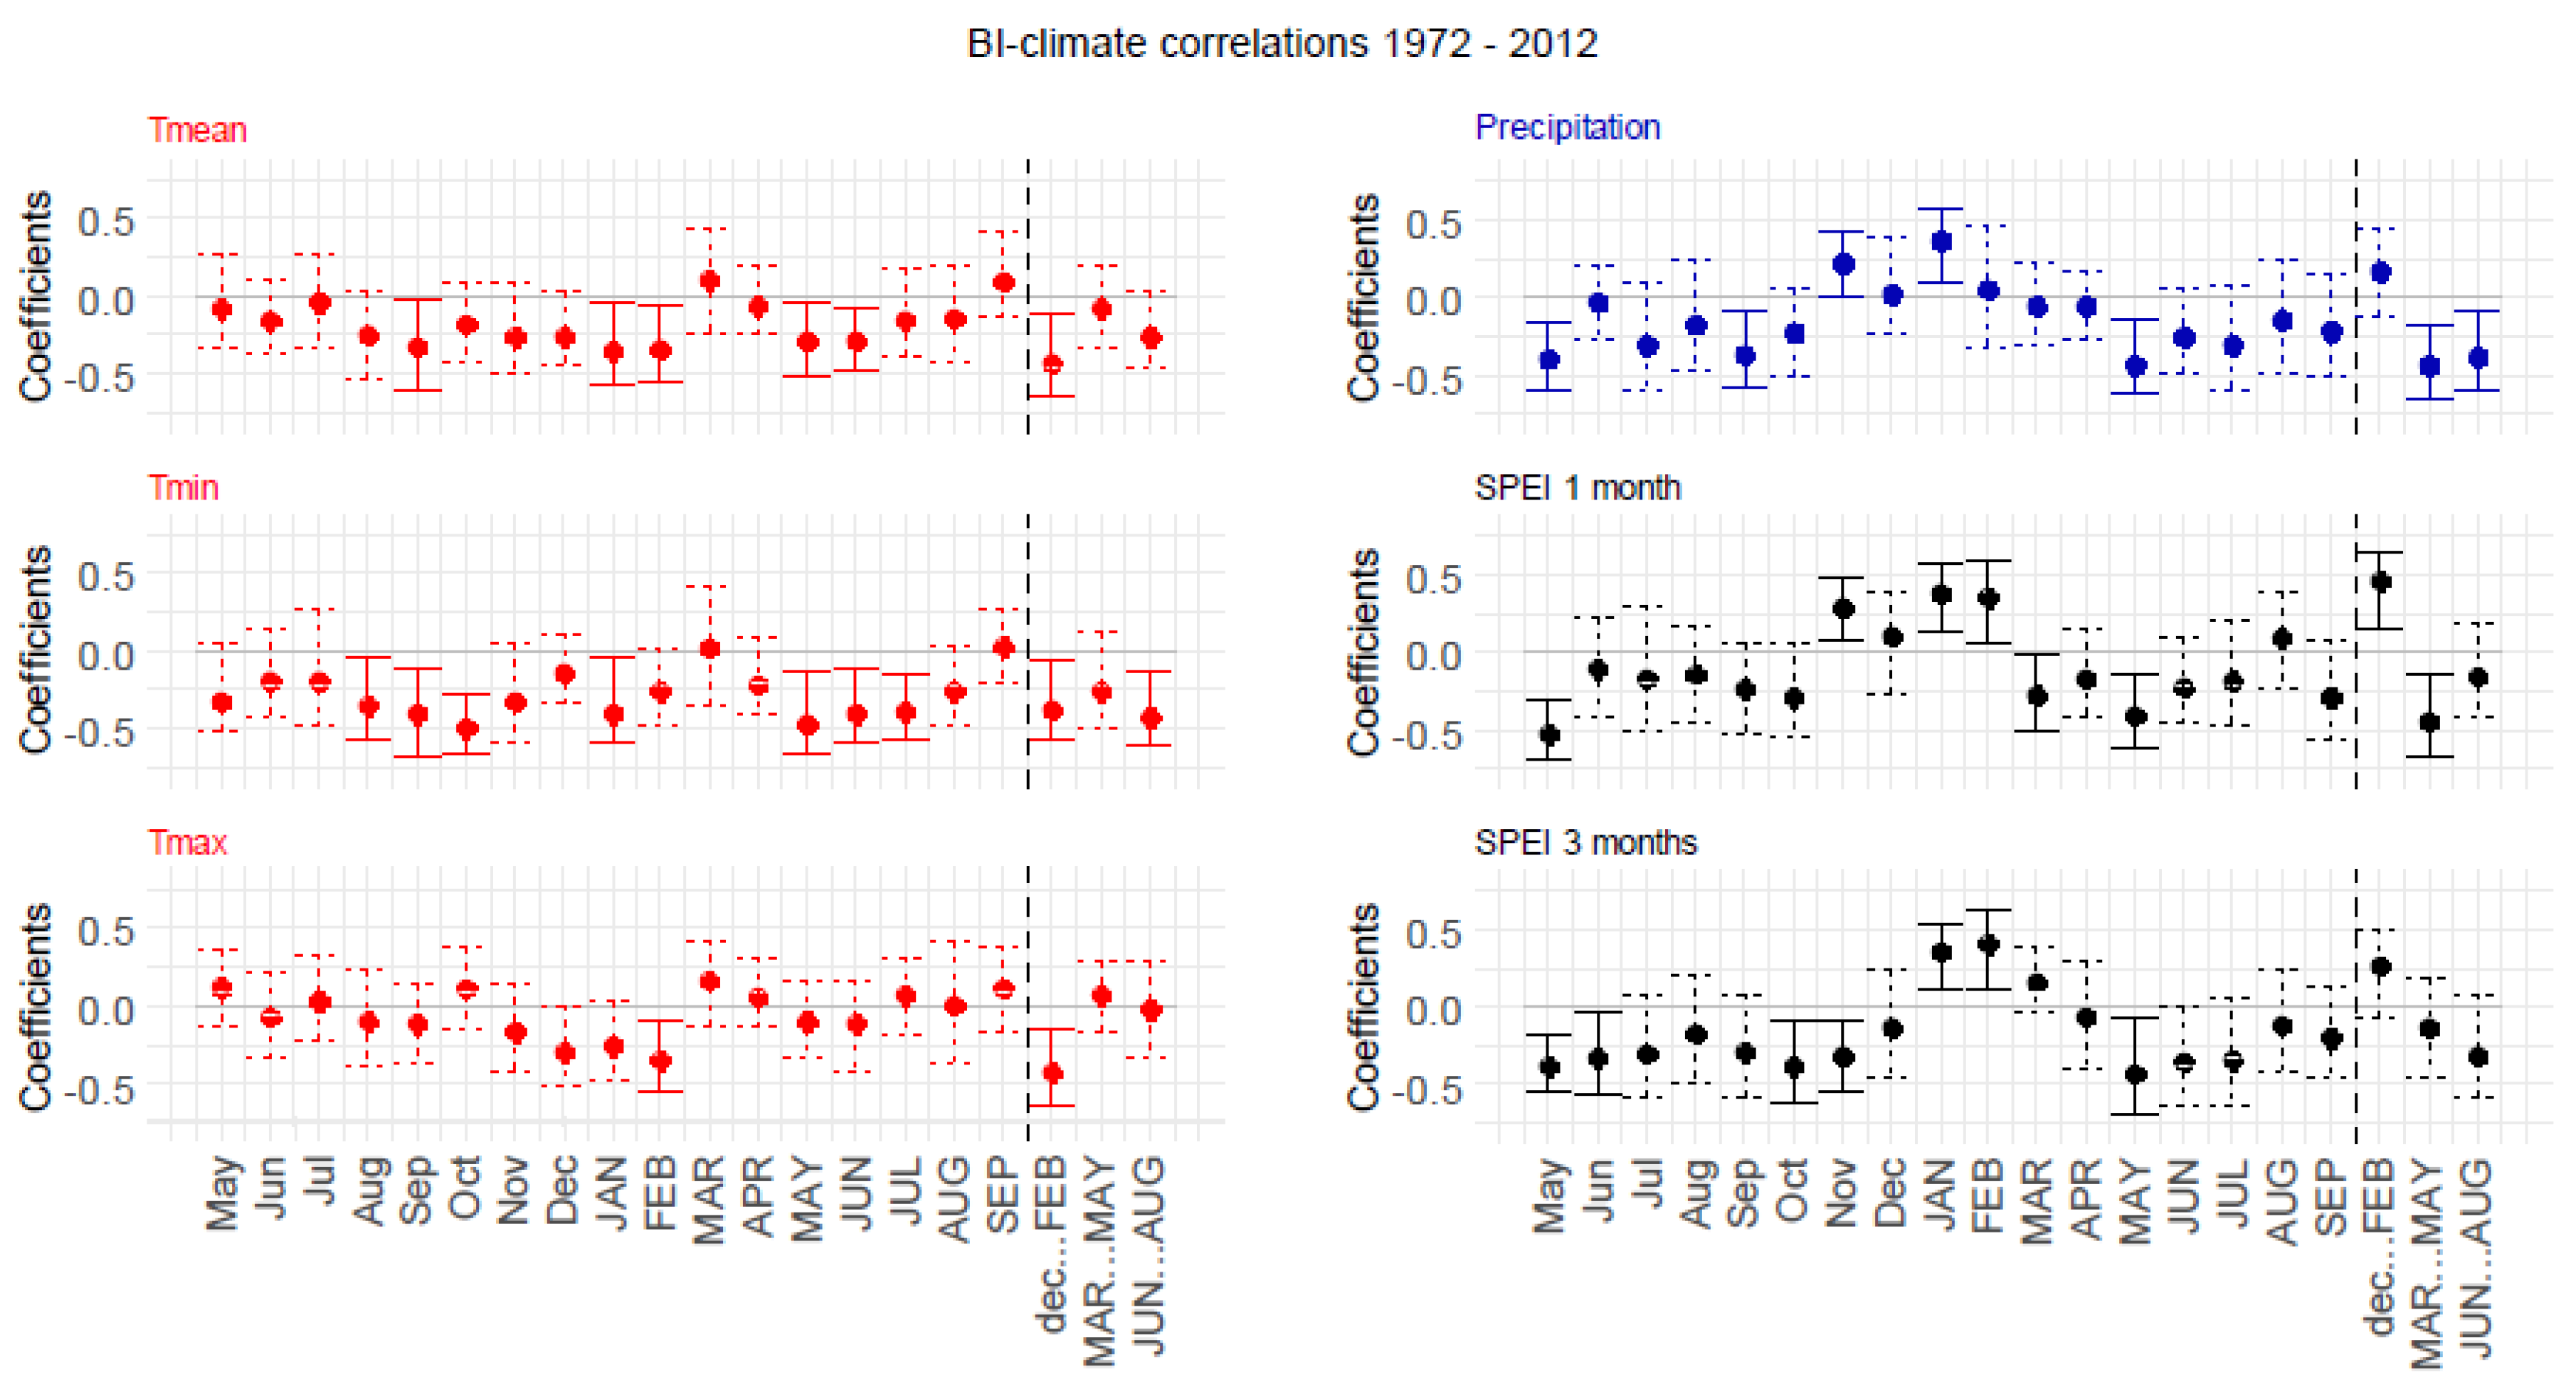
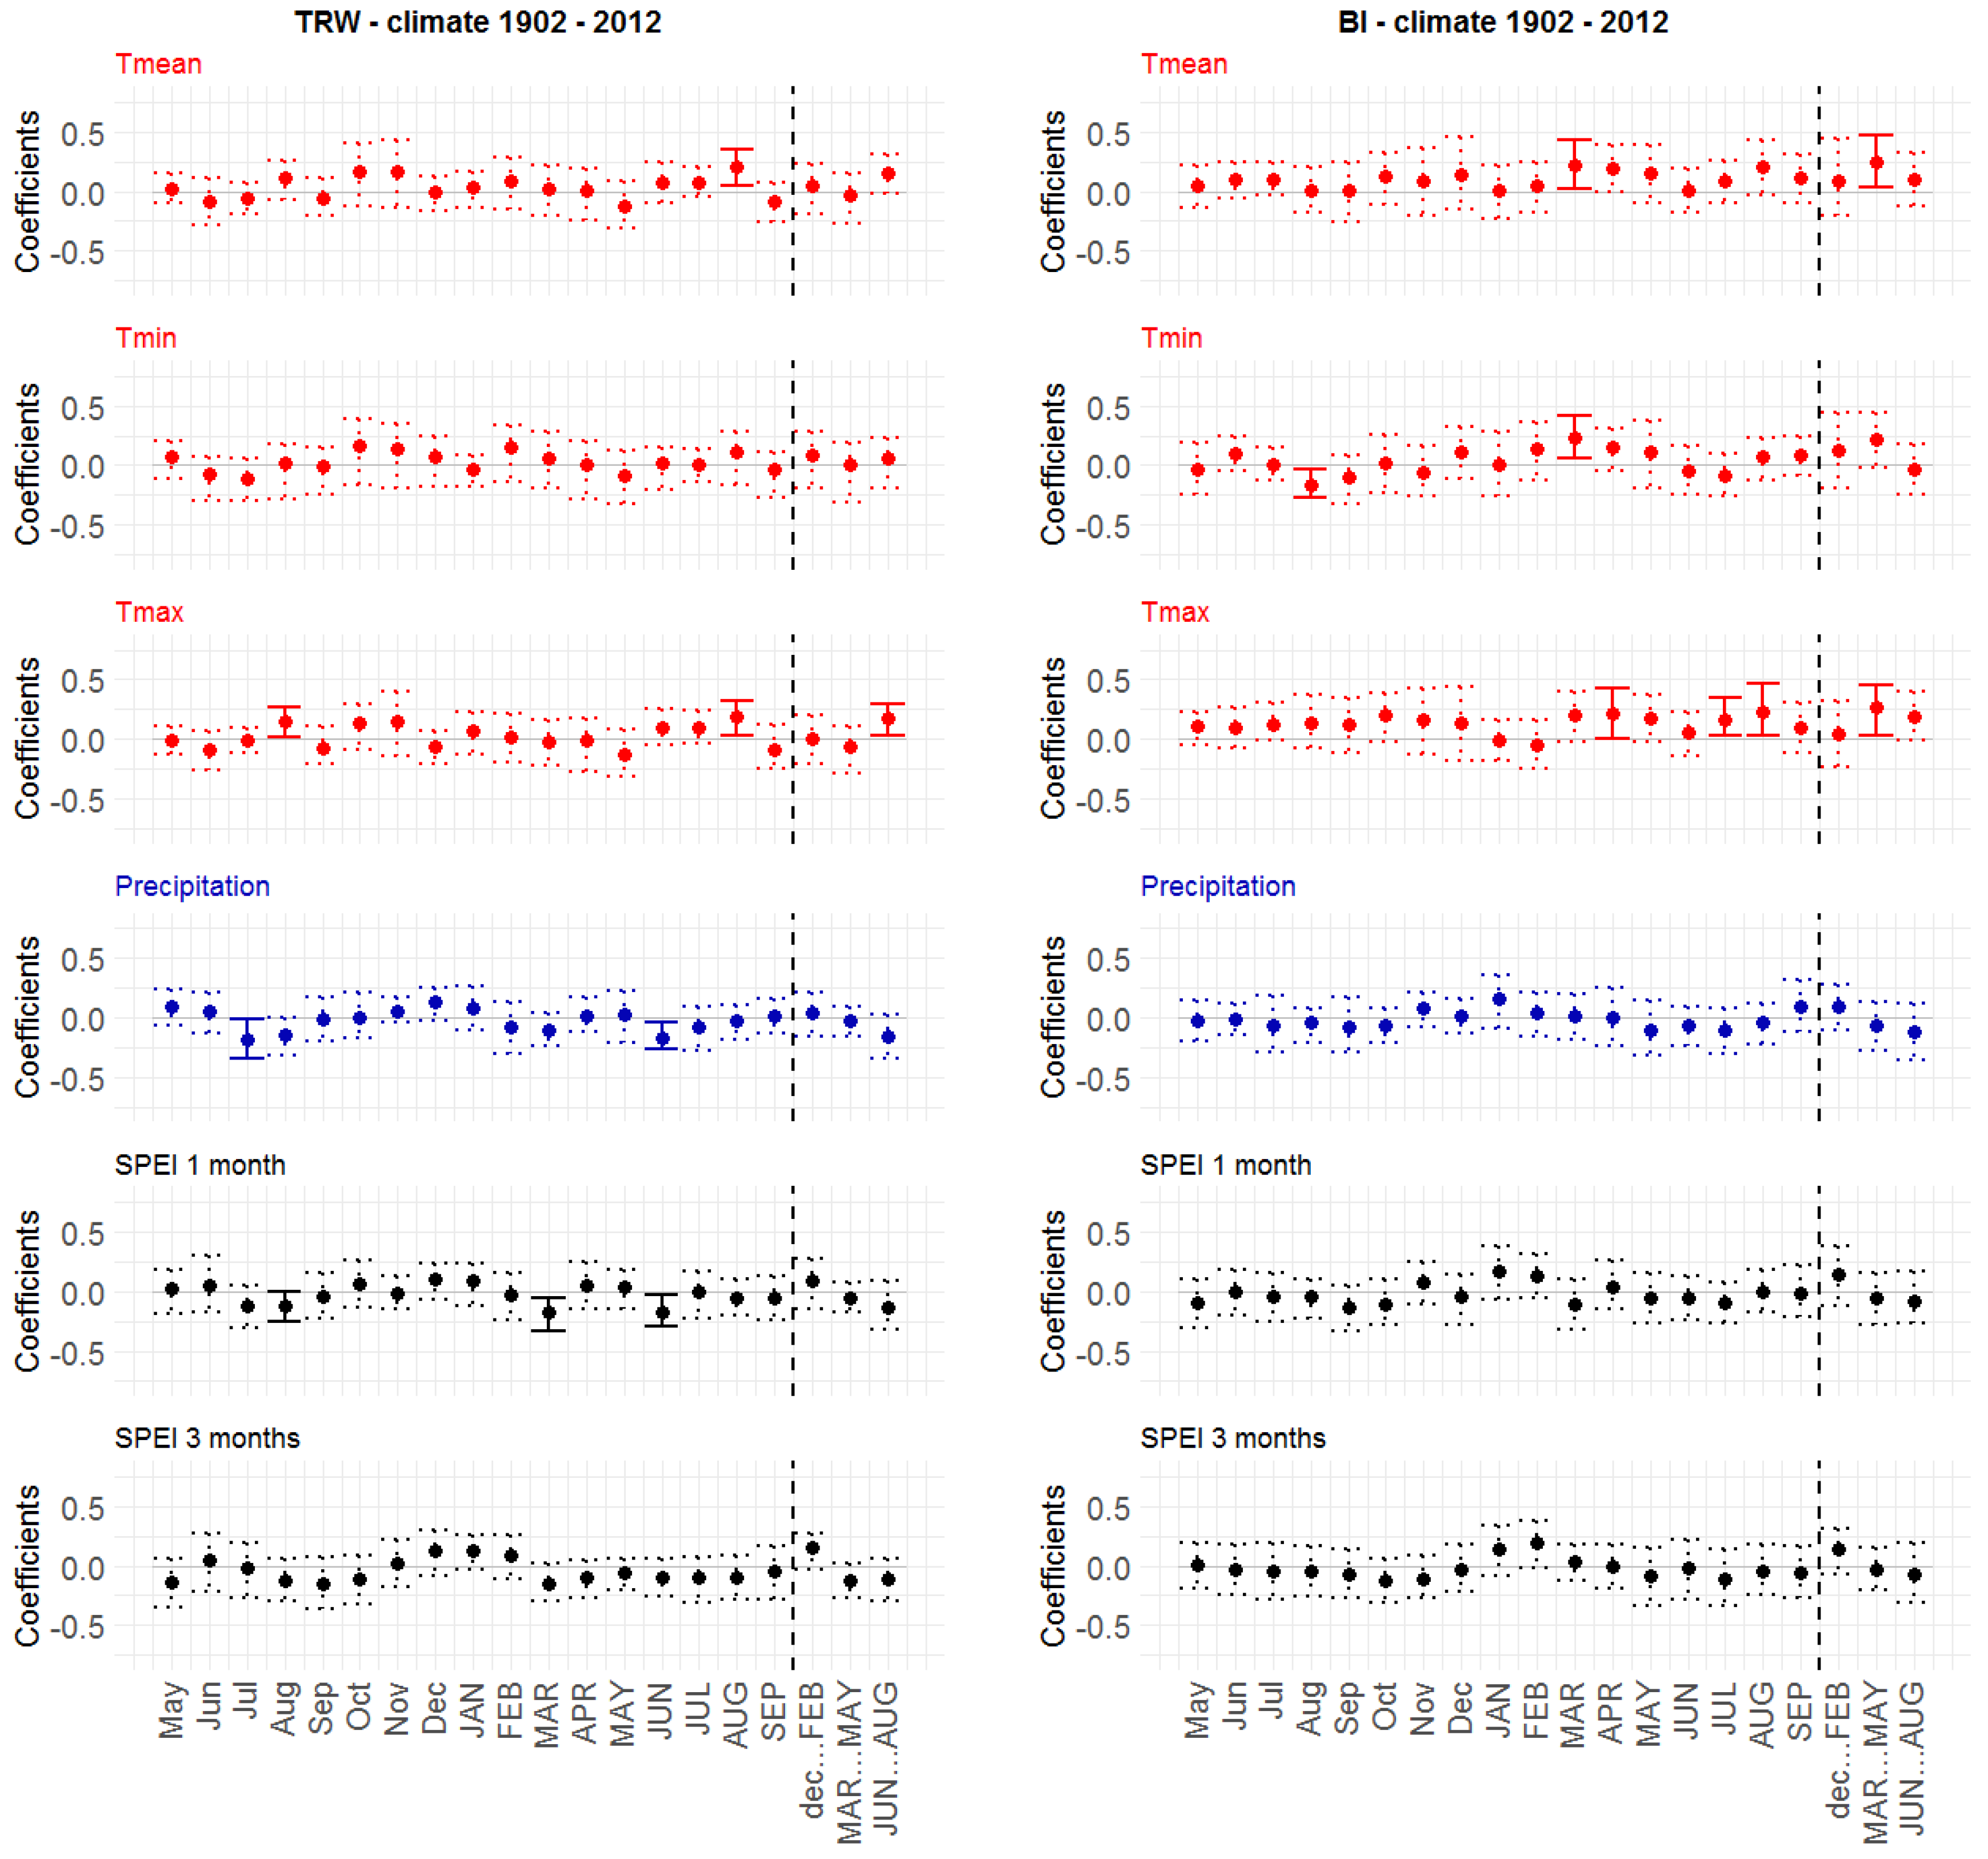
3.4. Static Correlations of TRW and BI Chronologies with Climate in the Period 1972–2012
3.4.1. Static TRW–Climate Correlations
3.4.2. Static BI–Climate Correlations
4. Discussion
4.1. TRW and BI Chronologies
4.2. Tree Growth–Climate Relationships during Recent Decades (1972–2012)
4.3. Changing Long-Term Tree Growth–Climate Relationships (the Entire 20th Century)
4.4. Suitability of Blue Intensity as a Climate Proxy
5. Conclusions
Author Contributions
Funding
Acknowledgments
Conflicts of Interest
Appendix A


References
- IPCC Climate Change 2014: Impacts, Adaptation, and Vulnerability. Part A: Global and Sectoral Aspects; Contribution of Working Group II to the Fifth Assessment Report of the Intergovernmental Panel on Climate Change; Cambridge University Press: Cambridge, UK; New York, NY, USA, 2014; ISBN 978-1-107-64165-5.
- Mountain Research Initiative EDW Working Group. Elevation-dependent warming in mountain regions of the world. Nat. Clim. Chang. 2015, 5, 424–430. [Google Scholar] [CrossRef] [Green Version]
- Schickhoff, U.; Singh, R.B.; Mal, S. Climate change and dynamics of glaciers and vegetation in the Himalaya: An overview. In Climate Change, Glacier Response, and Vegetation Dynamics in the Himalaya; Singh, R.B., Schickhoff, U., Mal, S., Eds.; Springer International Publishing: Cham, Switzerland, 2016; pp. 1–26. ISBN 978-3-319-28975-5. [Google Scholar]
- Shrestha, U.B.; Gautam, S.; Bawa, K.S. Widespread climate change in the Himalayas and associated changes in local ecosystems. PLoS ONE 2012, 7, e36741. [Google Scholar] [CrossRef] [PubMed] [Green Version]
- Telwala, Y.; Brook, B.W.; Manish, K.; Pandit, M.K. Climate-induced elevational range shifts and increase in plant species richness in a Himalayan biodiversity epicentre. PLoS ONE 2013, 8, e57103. [Google Scholar] [CrossRef] [PubMed]
- Zhang, Y.; Gao, J.; Liu, L.; Wang, Z.; Ding, M.; Yang, X. NDVI-based vegetation changes and their responses to climate change from 1982 to 2011: A case study in the Koshi River Basin in the middle Himalayas. Glob. Planet. Chang. 2013, 108, 139–148. [Google Scholar] [CrossRef]
- Salick, J.; Ghimire, S.K.; Fang, Z.; Dema, S.; Konchar, K.M. Himalayan alpine vegetation, climate change and mitigation. J. Ethnobiol. 2014, 34, 276–293. [Google Scholar] [CrossRef]
- Dawadi, B.; Liang, E.; Tian, L.; Devkota, L.P.; Yao, T. Pre-monsoon precipitation signal in tree rings of timberline Betula utilis in the central Himalayas. Quat. Int. 2013, 283, 72–77. [Google Scholar] [CrossRef]
- Liang, E.; Dawadi, B.; Pederson, N.; Eckstein, D. Is the growth of birch at the upper timberline in the Himalayas limited by moisture or by temperature? Ecology 2014, 95, 2453–2465. [Google Scholar] [CrossRef]
- Gaire, N.P.; Koirala, M.; Bhuju, D.R.; Carrer, M. Site- and species-specific treeline responses to climatic variability in eastern Nepal Himalaya. Dendrochronologia 2017, 41, 44–56. [Google Scholar] [CrossRef]
- Kharal, D.K.; Thapa, U.K.; St. George, S.; Meilby, H.; Rayamajhi, S.; Bhuju, D.R. Tree-climate relations along an elevational transect in Manang Valley, central Nepal. Dendrochronologia 2017, 41, 57–64. [Google Scholar] [CrossRef]
- Tiwari, A.; Fan, Z.-X.; Jump, A.S.; Li, S.-F.; Zhou, Z.-K. Gradual expansion of moisture sensitive Abies spectabilis forest in the Trans-Himalayan zone of central Nepal associated with climate change. Dendrochronologia 2017, 41, 34–43. [Google Scholar] [CrossRef]
- Harsch, M.A.; Hulme, P.E.; McGlone, M.S.; Duncan, R.P. Are treelines advancing? A global meta-analysis of treeline response to climate warming. Ecol. Lett. 2009, 12, 1040–1049. [Google Scholar] [CrossRef] [PubMed]
- Malanson, G.P.; Resler, L.M.; Bader, M.Y.; Holtmeier, F.-K.; Butler, D.R.; Weiss, D.J.; Daniels, L.D.; Fagre, D.B. Mountain treelines: A roadmap for research orientation. Arct. Antarct. Alp. Res. 2011, 43, 167–177. [Google Scholar] [CrossRef]
- Wieser, G.; Holtmeier, F.-K.; Smith, W.K. Treelines in a changing global environment. In Trees in a Changing Environment; Tausz, M., Grulke, N., Eds.; Springer: Dordrecht, The Netherlands, 2014; pp. 221–263. ISBN 978-94-017-9099-4. [Google Scholar]
- Way, D.A.; Oren, R. Differential responses to changes in growth temperature between trees from different functional groups and biomes: A review and synthesis of data. Tree Physiol. 2010, 30, 669–688. [Google Scholar] [CrossRef] [PubMed]
- Körner, C. Alpine Treelines: Functional Ecology of the Global High Elevation Tree Limits; Springer: Basel, Switzerland, 2012; ISBN 3-0348-0395-8. [Google Scholar]
- Müller, M.; Schickhoff, U.; Scholten, T.; Drollinger, S.; Böhner, J.; Chaudhary, R.P. How do soil properties affect alpine treelines? General principles in a global perspective and novel findings from Rolwaling Himal, Nepal. Prog. Phys. Geogr. 2016, 40, 135–160. [Google Scholar] [CrossRef]
- Vaganov, E.A.; Hughes, M.K.; Kirdyanov, A.V.; Schweingruber, F.H.; Silkin, P.P. Influence of snowfall and melt timing on tree growth in subarctic Eurasia. Nature 1999, 400, 149–151. [Google Scholar] [CrossRef]
- Gaire, N.P.; Bhuju, D.R.; Koirala, M. Dendrochronological studies in Nepal: Current status and future prospects. FUUAST J. Biol. 2013, 3, 1–9. [Google Scholar]
- Schickhoff, U.; Bobrowski, M.; Böhner, J.; Bürzle, B.; Chaudhary, R.P.; Gerlitz, L.; Heyken, H.; Lange, J.; Müller, M.; Scholten, T.; et al. Do Himalayan treelines respond to recent climate change? An evaluation of sensitivity indicators. Earth Syst. Dyn. 2015, 6, 245–265. [Google Scholar] [CrossRef]
- Schwab, N.; Schickhoff, U.; Bürzle, B.; Hellmold, J.; Stellmach, M. Dendroecological studies in the Nepal Himalaya—Review and outlook in the context of a new research initiative (TREELINE). In TRACE—Tree Rings in Archaeology, Climatology and Ecology; Wilson, R., Helle, G., Gaertner, H., Eds.; Scientific Technical Report; GFZ German Research Centre for Geosciences: Potsdam, Germany, 2015; Volume 13, pp. 86–95. [Google Scholar]
- Chaudhary, V.; Bhattacharyya, A.; Yadav, R.R. Tree-ring studies in the eastern Himalayan region: Prospects and problems. IAWA J. 1999, 20, 317–324. [Google Scholar] [CrossRef]
- Cook, E.R.; Krusic, P.J.; Jones, P.D. Dendroclimatic signals in long tree-ring chronologies from the Himalayas of Nepal. Int. J. Climatol. 2003, 23, 707–732. [Google Scholar] [CrossRef]
- Ahmed, M.; Palmer, J.; Khan, N.; Wahab, M.; Fenwick, P.; Esper, J.; Cook, E. The dendroclimatic potential of conifers from northern Pakistan. Dendrochronologia 2011, 29, 77–88. [Google Scholar] [CrossRef]
- Yadav, R.R.; Bräuning, A.; Singh, J. Tree ring inferred summer temperature variations over the last millennium in western Himalaya, India. Clim. Dyn. 2011, 36, 1545–1554. [Google Scholar] [CrossRef]
- Thapa, U.K.; George, S.S.; Kharal, D.K.; Gaire, N.P. Tree growth across the Nepal Himalaya during the last four centuries. Prog. Phys. Geogr. 2017, 41, 478–495. [Google Scholar] [CrossRef]
- Shrestha, K.B.; Hofgaard, A.; Vandvik, V. Tree-growth response to climatic variability in two climatically contrasting treeline ecotone areas, central Himalaya, Nepal. Can. J. For. Res. 2015, 45, 1643–1653. [Google Scholar] [CrossRef]
- Shrestha, K.B.; Chhetri, P.K.; Bista, R. Growth responses of Abies spectabilis to climate variations along an elevational gradient in Langtang National Park in the central Himalaya, Nepal. J. For. Res. 2017, 22, 274–281. [Google Scholar] [CrossRef]
- Chhetri, P.K.; Cairns, D.M. Dendroclimatic response of Abies spectabilis at treeline ecotone of Barun Valley, eastern Nepal Himalaya. J. For. Res. 2016, 27, 1163–1170. [Google Scholar] [CrossRef]
- Rayback, S.A.; Shrestha, K.B.; Hofgaard, A. Growth variable-specific moisture and temperature limitations in co-occurring alpine tree and shrub species, central Himalayas, Nepal. Dendrochronologia 2017, 44, 193–202. [Google Scholar] [CrossRef]
- Gaire, N.P.; Dhakal, Y.R.; Lekhak, H.C.; Bhuju, D.R.; Shah, S.K. Dynamics of Abies spectabilis in relation to climate change at the treeline ecotone in Langtang National Park. Nepal J. Sci. Technol. 2011, 12, 220–229. [Google Scholar] [CrossRef]
- Gaire, N.P.; Bhuju, D.R.; Koirala, M.; Shah, S.K.; Carrer, M.; Timilsena, R. Tree-ring based spring precipitation reconstruction in western Nepal Himalaya since AD 1840. Dendrochronologia 2017, 42, 21–30. [Google Scholar] [CrossRef]
- Fritts, H.C. Tree Rings and Climate; Academic Press: London, UK; New York, NY, USA, 1976; ISBN 0-12-268450-8. [Google Scholar]
- Nash, T.H.; Kincaid, W.B. Statistical methods for detecting environmental changes. In Methods of Dendrochronology: Applications in the Environmental Science; Cook, E., Kairiukstis, L., Eds.; Kluwer Academic Publishers: Dordrecht, The Netherlands, 1990; pp. 232–239. ISBN 0-7923-0586-8. [Google Scholar]
- Speer, J.H. Fundamentals of Tree-Ring Research; University of Arizona Press: Tucson, AZ, USA, 2010; ISBN 978-0-8165-2684-0. [Google Scholar]
- Mitscherlich, E.A. Das Gesetz des Minimums und das Gesetz des abnehmenden Bodenertrages. Landwirtsch. Jahrb. 1909, 38, 537–552. [Google Scholar]
- Ohse, B.; Jansen, F.; Wilmking, M. Do limiting factors at Alaskan treelines shift with climatic regimes? Environ. Res. Lett. 2012, 7, 015505. [Google Scholar] [CrossRef]
- Wilmking, M.; Scharnweber, T.; van der Maaten-Theunissen, M.; van der Maaten, E. Reconciling the community with a concept—The uniformitarian principle in the dendro-sciences. Dendrochronologia 2017, 44, 211–214. [Google Scholar] [CrossRef]
- Jacoby, G.C.; D’Arrigo, R.D. Tree ring width and density evidence of climatic and potential forest change in Alaska. Glob. Biogeochem. Cycles 1995, 9, 227–234. [Google Scholar] [CrossRef]
- Briffa, K.R.; Schweingruber, F.H.; Jones, P.D.; Osborn, T.J.; Harris, I.C.; Shiyatov, S.G.; Vaganov, E.A.; Grudd, H. Trees tell of past climates: But are they speaking less clearly today? Philos. Trans. R. Soc. Lond. B Biol. Sci. 1998, 353, 65–73. [Google Scholar] [CrossRef]
- Carrer, M.; Urbinati, C. Long-term change in the sensitivity of tree-ring growth to climate forcing in Larix decidua. New Phytol. 2006, 170, 861–872. [Google Scholar] [CrossRef] [PubMed]
- D’Arrigo, R.; Wilson, R.; Liepert, B.; Cherubini, P. On the ‘divergence problem’ in northern forests: A review of the tree-ring evidence and possible causes. Glob. Planet. Chang. 2008, 60, 289–305. [Google Scholar] [CrossRef]
- Pellizzari, E.; Camarero, J.J.; Gazol, A.; Granda, E.; Shetti, R.; Wilmking, M.; Moiseev, P.; Pividori, M.; Carrer, M. Diverging shrub and tree growth from the Polar to the Mediterranean biomes across the European continent. Glob. Chang. Biol. 2017, 23, 3169–3180. [Google Scholar] [CrossRef] [PubMed]
- Esper, J.; Frank, D.; Büntgen, U.; Verstege, A.; Hantemirov, R.M.; Kirdyanov, A.V. Trends and uncertainties in Siberian indicators of 20th century warming. Glob. Chang. Biol. 2010, 16, 386–398. [Google Scholar] [CrossRef]
- Zhang, Y.; Shao, X.; Wilmking, M. Dynamic relationships between Picea crassifolia growth and climate at upper treeline in the Qilian Mts., Northeast Tibetan Plateau, China. Dendrochronologia 2011, 29, 185–199. [Google Scholar] [CrossRef]
- Buras, A.; Spyt, B.; Janecka, K.; Kaczka, R. Divergent growth of Norway spruce on Babia Góra Mountain in the western Carpathians. Dendrochronologia 2018, 50, 33–43. [Google Scholar] [CrossRef]
- Zhang, Y.; Wilmking, M. Divergent growth responses and increasing temperature limitation of Qinghai spruce growth along an elevation gradient at the northeast Tibet Plateau. For. Ecol. Manag. 2010, 260, 1076–1082. [Google Scholar] [CrossRef]
- D’Arrigo, R.D.; Kaufmann, R.K.; Davi, N.; Jacoby, G.C.; Laskowski, C.; Myneni, R.B.; Cherubini, P. Thresholds for warming-induced growth decline at elevational tree line in the Yukon Territory, Canada. Glob. Biogeochem. Cycles 2004, 18, GB3021. [Google Scholar] [CrossRef]
- Cook, E.R.; Esper, J.; D’Arrigo, R.D. Extra-tropical Northern Hemisphere land temperature variability over the past 1000 years. Quat. Sci. Rev. 2004, 23, 2063–2074. [Google Scholar] [CrossRef]
- Briffa, K.R.; Schweingruber, F.H.; Jones, P.D.; Osborn, T.J.; Shiyatov, S.G.; Vaganov, E.A. Reduced sensitivity of recent tree-growth to temperature at high northern latitudes. Nature 1998, 391, 678–682. [Google Scholar] [CrossRef]
- Schneider, L.; Esper, J.; Timonen, M.; Büntgen, U. Detection and evaluation of an early divergence problem in northern Fennoscandian tree-ring data. Oikos 2014, 123, 559–566. [Google Scholar] [CrossRef]
- Galván, J.D.; Büntgen, U.; Ginzler, C.; Grudd, H.; Gutiérrez, E.; Labuhn, I.; Julio Camarero, J. Drought-induced weakening of growth–temperature associations in high-elevation Iberian pines. Glob. Planet. Chang. 2015, 124, 95–106. [Google Scholar] [CrossRef]
- Ponocná, T.; Spyt, B.; Kaczka, R.; Büntgen, U.; Treml, V. Growth trends and climate responses of Norway spruce along elevational gradients in east-central Europe. Trees 2016, 30, 1633–1646. [Google Scholar] [CrossRef]
- Buras, A.; Schunk, C.; Zeiträg, C.; Herrmann, C.; Kaiser, L.; Lemme, H.; Straub, C.; Taeger, S.; Gößwein, S.; Klemmt, H.-J.; et al. Are Scots pine forest edges particularly prone to drought-induced mortality? Environ. Res. Lett. 2018, 13, 025001. [Google Scholar] [CrossRef]
- Carrer, M. Individualistic and time-varying tree-ring growth to climate sensitivity. PLoS ONE 2011, 6, e22813. [Google Scholar] [CrossRef] [PubMed]
- Hughes, M.K. Dendroclimatology in high-resolution paleoclimatology. In Dendroclimatology; Hughes, M.K., Swetnam, T.W., Diaz, H.F., Eds.; Springer Netherlands: Dordrecht, The Netherlands, 2011; pp. 17–34. ISBN 978-1-4020-4010-8. [Google Scholar]
- Thapa, U.K.; Shah, S.K.; Gaire, N.P.; Bhuju, D.R. Spring temperatures in the far-western Nepal Himalaya since AD 1640 reconstructed from Picea smithiana tree-ring widths. Clim. Dyn. 2015, 45, 2069–2081. [Google Scholar] [CrossRef]
- Sohar, K.; Altman, J.; Lehečková, E.; Doležal, J. Growth–climate relationships of Himalayan conifers along elevational and latitudinal gradients. Int. J. Climatol. 2016, 2593–2605. [Google Scholar] [CrossRef]
- Frank, D.; Esper, J. Characterization and climate response patterns of a high-elevation, multi-species tree-ring network in the European Alps. Dendrochronologia 2005, 22, 107–121. [Google Scholar] [CrossRef]
- Björklund, J.; Gunnarson, B.E.; Seftigen, K.; Zhang, P.; Linderholm, H.W. Using adjusted Blue Intensity data to attain high-quality summer temperature information: A case study from Central Scandinavia. Holocene 2015, 25, 547–556. [Google Scholar] [CrossRef]
- Babst, F.; Bouriaud, O.; Papale, D.; Gielen, B.; Janssens, I.A.; Nikinmaa, E.; Ibrom, A.; Wu, J.; Bernhofer, C.; Köstner, B.; et al. Above-ground woody carbon sequestration measured from tree rings is coherent with net ecosystem productivity at five eddy-covariance sites. New Phytol. 2014, 201, 1289–1303. [Google Scholar] [CrossRef] [PubMed]
- Bouriaud, O.; Teodosiu, M.; Kirdyanov, A.V.; Wirth, C. Influence of wood density in tree-ring-based annual productivity assessments and its errors in Norway spruce. Biogeosciences 2015, 12, 6205–6217. [Google Scholar] [CrossRef]
- Pompa-García, M.; Venegas-González, A. Temporal variation of wood density and carbon in two elevational sites of Pinus cooperi in relation to climate response in northern Mexico. PLoS ONE 2016, 11, e0156782. [Google Scholar] [CrossRef] [PubMed]
- Sano, M.; Furuta, F.; Kobayashi, O.; Sweda, T. Temperature variations since the mid-18th century for western Nepal, as reconstructed from tree-ring width and density of Abies spectabilis. Dendrochronologia 2005, 23, 83–92. [Google Scholar] [CrossRef]
- Kaczka, R.J.; Spyt, B.; Janecka, K.; Beil, I.; Büntgen, U.; Scharnweber, T.; Nievergelt, D.; Wilmking, M. Different maximum latewood density and blue intensity measurements techniques reveal similar results. Dendrochronologia 2018, 49, 94–101. [Google Scholar] [CrossRef]
- McCarroll, D.; Pettigrew, E.; Luckman, A.; Guibal, F.; Edouard, J.-L. Blue reflectance provides a surrogate for latewood density of high-latitude Pine tree rings. Arct. Antarct. Alp. Res. 2002, 34, 450–453. [Google Scholar] [CrossRef]
- Campbell, R.; McCarroll, D.; Loader, N.J.; Grudd, H.; Robertson, I.; Jalkanen, R. Blue intensity in Pinus sylvestris tree-rings: Developing a new palaeoclimate proxy. Holocene 2007, 17, 821–828. [Google Scholar] [CrossRef]
- McCarroll, D.; Tuovinen, M.; Campbell, R.; Gagen, M.; Grudd, H.; Jalkanen, R.; Loader, N.J.; Robertson, I. A critical evaluation of multi-proxy dendroclimatology in northern Finland. J. Quat. Sci. 2011, 26, 7–14. [Google Scholar] [CrossRef]
- Björklund, J.A.; Gunnarson, B.E.; Seftigen, K.; Esper, J.; Linderholm, H.W. Blue intensity and density from northern Fennoscandian tree rings, exploring the potential to improve summer temperature reconstructions with earlywood information. Clim. Past 2014, 10, 877–885. [Google Scholar] [CrossRef]
- Rydval, M.; Larsson, L.-Å.; McGlynn, L.; Gunnarson, B.E.; Loader, N.J.; Young, G.H.F.; Wilson, R. Blue intensity for dendroclimatology: Should we have the blues? Experiments from Scotland. Dendrochronologia 2014, 32, 191–204. [Google Scholar] [CrossRef]
- Schwab, N.; Schickhoff, U.; Müller, M.; Gerlitz, L.; Bürzle, B.; Böhner, J.; Chaudhary, R.P.; Scholten, T. Treeline responsiveness to climate warming: Insights from a krummholz treeline in Rolwaling Himal, Nepal. In Climate Change, Glacier Response, and Vegetation Dynamics in the Himalaya; Singh, R.B., Schickhoff, U., Mal, S., Eds.; Springer International Publishing: Cham, Switzerland, 2016; pp. 307–345. ISBN 978-3-319-28975-5. [Google Scholar]
- Schwab, N.; Schickhoff, U.; Bürzle, B.; Müller, M.; Böhner, J.; Chaudhary, R.P.; Scholten, T.; Oldeland, J. Implications of tree species—Environment relationships for the responsiveness of Himalayan krummholz treelines to climate change. J. Mt. Sci. 2017, 14, 453–473. [Google Scholar] [CrossRef]
- Bürzle, B.; Schickhoff, U.; Schickhoff, U.; Schwab, N.; Oldeland, J.; Müller, M.; Böhner, J.; Chaudhary, R.P.; Scholten, T.; Dickoré, W.B. Phytosociology and ecology of treeline ecotone vegetation in Rolwaling Himal, Nepal. Phytocoenologia 2017, 47, 197–220. [Google Scholar] [CrossRef]
- Baumgartner, R. Farewell to Yak and Yeti? The Sherpas of Rolwaling Facing a Globalised World; Vajra Books: Kathmandu, Nepal, 2015; ISBN 978-9937-623-43-8. [Google Scholar]
- Karki, R.; Talchabhadel, R.; Aalto, J.; Baidya, S.K. New climatic classification of Nepal. Theor. Appl. Climatol. 2016, 125, 799–808. [Google Scholar] [CrossRef]
- Karki, R.; Schickhoff, U.; Scholten, T.; Böhner, J. Rising precipitation extremes across Nepal. Climate 2017, 5, 4. [Google Scholar] [CrossRef]
- Karki, R.; ul Hasson, S.; Gerlitz, L.; Schickhoff, U.; Scholten, T.; Böhner, J. Quantifying the added value of convection-permitting climate simulations in complex terrain: A systematic evaluation of WRF over the Himalayas. Earth Syst. Dyn. 2017, 8, 507–528. [Google Scholar] [CrossRef]
- Guijarro, J.A. Climatol: Climate Tools (Series Homogenization and Derived Products). R Package Version 3.0. Available online: https://CRAN.R-project.org/package=climatol (accessed on 10 October 2017).
- Miehe, G.; Miehe, S.; Böhner, J.; Ghimire, S.K.; Bhattarai, K.; Chaudhary, R.P.; Subedi, M.; Jha, P.K.; Pendry, C. Vegetation ecology. In Nepal: An Introduction to the Natural History, Ecology and Human Environment in the Himalayas; Miehe, G., Pendry, C., Chaudhary, R.P., Eds.; Royal Botanic Garden Edinburgh: Edinburgh, UK, 2015; pp. 385–472. ISBN 978-1-910877-02-9. [Google Scholar]
- Stokes, M.A.; Smiley, T.L. An Introduction to Tree-Ring Dating; University of Arizona Press: Tucson, AZ, USA, 1996; ISBN 0-8165-1680-4. [Google Scholar]
- Müller, M.; Schwab, N.; Schickhoff, U.; Böhner, J.; Scholten, T. Soil temperature and soil moisture patterns in a Himalayan alpine treeline ecotone. Arct. Antarct. Alp. Res. 2016, 48, 501–521. [Google Scholar] [CrossRef]
- Schweingruber, F.H. Wood Structure and Environment; Springer: Berlin, Germany; New York, NY, USA, 2007; ISBN 978-3-540-48299-4. [Google Scholar]
- Janecka, K.; Kaczka, R.; Gärtner, H.; Treydte, K. The influence of compression wood on the strength of the climatic signal in tree rings of Norway spruce. In TRACE—Tree Rings in Archaeology, Climatology and Ecology; Hevia, A., Sánchez-Salguero, R., Linares, J.C., Olano, J.M., Camarero, J.J., Gutiérrez, E., Helle, G., Gärtner, H., Eds.; Scientific Technical Report; GFZ German Research Centre for Geosciences: Potsdam, Germany, 2016; Volume 14, pp. 50–59. [Google Scholar]
- Larsson, L.-Å. CooRecorder and CDendro Programs of the CooRecorder/CDendro Package Version 8.1. Available online: http://www.cybis.se/forfun/dendro/ (accessed on 1 December 2016).
- Holmes, R.L. Computer-assisted quality control in tree-ring dating and measurement. Tree-Ring Bull. 1983, 43, 69–78. [Google Scholar]
- Cook, E.R. A Time Series Analysis Approach to Tree Ring Standardization; University of Arizona: Tucson, AZ, USA, 1985. [Google Scholar]
- Esper, J.; Frank, D. Divergence pitfalls in tree-ring research. Clim. Chang. 2009, 94, 261. [Google Scholar] [CrossRef]
- Cook, E.R.; Peters, K. Calculating unbiased tree-ring indices for the study of climatic and environmental change. Holocene 1997, 7, 361–370. [Google Scholar] [CrossRef]
- Wigley, T.M.L.; Briffa, K.R.; Jones, P.D. On the average value of correlated time series, with applications in dendroclimatology and hydrometeorology. J. Clim. Appl. Meteorol. 1984, 23, 201–213. [Google Scholar] [CrossRef]
- Briffa, K.; Jones, P.D. Basic chronology statistics and assessment. In Methods of Dendrochronology: Applications in the Environmental Science; Cook, E., Kairiukstis, L., Eds.; Kluwer Academic Publishers: Dordrecht, The Netherlands, 1990; pp. 137–152. ISBN 0-7923-0586-8. [Google Scholar]
- Cook, E.; Briffa, K.; Shiyatov, S.; Mazepa, V. Tree-ring standardization and growth-trend estimation. In Methods of Dendrochronology: Applications in the Environmental Science; Cook, E., Kairiukstis, L., Eds.; Kluwer Academic Publishers: Dordrecht, The Netherlands, 1990; pp. 104–123. ISBN 0-7923-0586-8. [Google Scholar]
- Buras, A. A comment on the expressed population signal. Dendrochronologia 2017, 44, 130–132. [Google Scholar] [CrossRef]
- Harris, I.; Jones, P.D.; Osborn, T.J.; Lister, D.H. Updated high-resolution grids of monthly climatic observations—The CRU TS3.10 Dataset. Int. J. Climatol. 2014, 34, 623–642. [Google Scholar] [CrossRef] [Green Version]
- University of East Anglia Climatic Research Unit; Harris, I.C.; Jones,, P.D. CRU TS4.00: Climatic Research Unit (CRU) Time-Series (TS) Version 4.00 of High Resolution Gridded Data of Month-By-Month Variation in Climate (Jan. 1901–Dec. 2015); Centre for Environmental Data Analysis (CEDA): Didcot, UK, 2017; Available online: http://catalogue.ceda.ac.uk/uuid/edf8febfdaad48abb2cbaf7d7e846a86 (accessed on 17 September 2017).
- Vicente-Serrano, S.M.; Beguería, S.; López-Moreno, J.I.; Angulo, M.; El Kenawy, A. A new global 0.5° gridded dataset (1901–2006) of a multiscalar drought index: Comparison with current drought index datasets based on the Palmer Drought Severity Index. J. Hydrometeorol. 2010, 11, 1033–1043. [Google Scholar] [CrossRef]
- CRU TS Version 4.01 Google Earth Interface. Available online: https://crudata.uea.ac.uk/cru/data/hrg/cru_ts_4.01/ge/ (accessed on 16 October 2017).
- Trouet, V.; Van Oldenborgh, G.J. KNMI Climate Explorer: A web-based research tool for high-resolution paleoclimatology. Tree-Ring Res. 2013, 69, 3–13. [Google Scholar] [CrossRef]
- Fox, J.; Weisberg, S. An R Companion to Applied Regression; Sage: Thousand Oaks, CA, USA, 2011; ISBN 978-1-4129-7514-8. [Google Scholar]
- R Core Team. R: A Language and Environment for Statistical Computing; R Foundation for Statistical Computing: Vienna, Austria, 2017. [Google Scholar]
- Politis, D.N.; Romano, J.P. The stationary bootstrap. J. Am. Stat. Assoc. 1994, 89, 1303–1313. [Google Scholar] [CrossRef]
- Politis, D.N.; White, H. Automatic block-length selection for the dependent bootstrap. Econom. Rev. 2004, 23, 53–70. [Google Scholar] [CrossRef]
- Biondi, F.; Waikul, K. DENDROCLIM2002: A C++ program for statistical calibration of climate signals in tree-ring chronologies. Comput. Geosci. 2004, 30, 303–311. [Google Scholar] [CrossRef]
- Zang, C.; Biondi, F. treeclim: An R package for the numerical calibration of proxy-climate relationships. Ecography 2015, 38, 431–436. [Google Scholar] [CrossRef]
- Fan, Z.-X.; Bräuning, A.; Cao, K.-F. Tree-ring based drought reconstruction in the central Hengduan Mountains region (China) since A.D. 1655. Int. J. Climatol. 2008, 28, 1879–1887. [Google Scholar] [CrossRef]
- St. George, S. An overview of tree-ring width records across the Northern Hemisphere. Quat. Sci. Rev. 2014, 95, 132–150. [Google Scholar] [CrossRef]
- Wang, S.-Y.; Yoon, J.-H.; Gillies, R.R.; Cho, C. What caused the winter drought in western Nepal during recent years? J. Clim. 2013, 26, 8241–8256. [Google Scholar] [CrossRef]
- Dahal, P.; Shrestha, N.S.; Shrestha, M.L.; Krakauer, N.Y.; Panthi, J.; Pradhanang, S.M.; Jha, A.; Lakhankar, T. Drought risk assessment in central Nepal: Temporal and spatial analysis. Nat. Hazards 2015, 1–20. [Google Scholar] [CrossRef]
- Naidu, C.V.; Krishna, K.M.; Rao, S.R.; Bhanu Kumar, O.S.R.U.; Durgalakshmi, K.; Ramakrishna, S.S.V.S. Variations of Indian summer monsoon rainfall induce the weakening of easterly jet stream in the warming environment? Glob. Planet. Chang. 2011, 75, 21–30. [Google Scholar] [CrossRef]
- Lv, L.-X.; Zhang, Q.-B. Asynchronous recruitment history of Abies spectabilis along an altitudinal gradient in the Mt. Everest region. J. Plant Ecol. 2012, 5, 147–156. [Google Scholar] [CrossRef]
- Kharal, D.K.; Meilby, H.; Rayamajhi, S.; Bhuju, D.; Thapa, U.K. Tree ring variability and climate response of Abies spectabilis along an elevation gradient in Mustang, Nepal. Banko Janakari 2014, 24, 3–13. [Google Scholar] [CrossRef]
- Bräuning, A.; Grießinger, J. Late holocene variations in monsoon intensity in the Tibetan- Himalayan region—Evidence from tree rings. Geol. Soc. India 2006, 68, 485–493. [Google Scholar]
- Borgaonkar, H.P.; Sikder, A.B.; Ram, S. High altitude forest sensitivity to the recent warming: A tree-ring analysis of conifers from Western Himalaya, India. Quat. Int. 2011, 236, 158–166. [Google Scholar] [CrossRef]
- Li, J.; Shi, J.; Zhang, D.D.; Yang, B.; Fang, K.; Yue, P.H. Moisture increase in response to high-altitude warming evidenced by tree-rings on the southeastern Tibetan Plateau. Clim. Dyn. 2017, 48, 649–660. [Google Scholar] [CrossRef]
- Panthi, S.; Bräuning, A.; Zhou, Z.-K.; Fan, Z.-X. Tree rings reveal recent intensified spring drought in the central Himalaya, Nepal. Glob. Planet. Chang. 2017, 157, 26–34. [Google Scholar] [CrossRef]
- Ren, P.; Rossi, S.; Gricar, J.; Liang, E.; Cufar, K. Is precipitation a trigger for the onset of xylogenesis in Juniperus przewalskii on the north-eastern Tibetan Plateau? Ann. Bot. 2015, 115, 629–639. [Google Scholar] [CrossRef] [PubMed]
- Tiwari, A.; Fan, Z.-X.; Jump, A.S.; Zhou, Z.-K. Warming induced growth decline of Himalayan birch at its lower range edge in a semi-arid region of Trans-Himalaya, central Nepal. Plant Ecol. 2017, 218, 621–633. [Google Scholar] [CrossRef]
- Bräuning, A. Tree-ring studies in the Dolpo-Himalya (western Nepal). In TRACE—Tree Rings in Archaeology, Climatology and Ecology; Schriften des Forschungszentrums Jülich, Reihe Umwelt Volume 44; Jansma, E., Bräuning, A., Gärtner, H., Schleser, G., Eds.; GFZ German Research Centre for Geosciences: Potsdam, Germany, 2004; Volume 2, pp. 8–12. [Google Scholar]
- Peterson, D.W.; Peterson, D.L.; Ettl, G.J. Growth responses of subalpine fir to climatic variability in the Pacific Northwest. Can. J. For. Res. 2002, 32, 1503–1517. [Google Scholar] [CrossRef]
- Borgaonkar, H.P.; Pant, G.B.; Rupa Kumar, K. Dendroclimatic reconstruction of summer precipitation at Srinagar, Kashmir, India, since the late-eighteenth century. Holocene 1994, 4, 299–306. [Google Scholar] [CrossRef]
- Vicente-Serrano, S.M.; Beguería, S.; Lorenzo-Lacruz, J.; Camarero, J.J.; López-Moreno, J.I.; Azorin-Molina, C.; Revuelto, J.; Morán-Tejeda, E.; Sanchez-Lorenzo, A.; Vicente-Serrano, S.M.; et al. Performance of drought indices for ecological, agricultural, and hydrological applications. Earth Interact. 2012, 16, 1–27. [Google Scholar] [CrossRef]
- Vaganov, E.A.; Anchukaitis, K.J.; Evans, M.N. How well understood are the processes that create dendroclimatic records? A mechanistic model of the climatic control on conifer tree-ring growth dynamics. In Dendroclimatology; Hughes, M.K., Swetnam, T.W., Diaz, H.F., Eds.; Springer Netherlands: Dordrecht, The Netherlands, 2011; pp. 37–75. ISBN 978-1-4020-4010-8. [Google Scholar]
- Gerlitz, L.; Bechtel, B.; Böhner, J.; Bobrowski, M.; Bürzle, B.; Müller, M.; Scholten, T.; Schickhoff, U.; Schwab, N.; Weidinger, J. Analytic comparison of temperature lapse rates and precipitation gradients in a Himalayan treeline environment: Implications for statistical downscaling. In Climate Change, Glacier Response, and Vegetation Dynamics in the Himalaya; Singh, R.B., Schickhoff, U., Mal, S., Eds.; Springer International Publishing: Cham, Switzerland, 2016; pp. 49–64. ISBN 978-3-319-28975-5. [Google Scholar]
- Zurick, D.; Pacheco, J. Illustrated Atlas of the Himalaya; University Press of Kentucky: Lexington, KY, USA, 2006; ISBN 978-0-8131-2388-2. [Google Scholar]
- Elliott, G.P.; Cowell, C.M. Slope aspect mediates fine-scale tree establishment patterns at upper treeline during wet and dry periods of the 20th century. Arct. Antarct. Alp. Res. 2015, 47, 681–692. [Google Scholar] [CrossRef]
- Bobrowski, M.; Schickhoff, U. Why input matters: Selection of climate data sets for modelling the potential distribution of a treeline species in the Himalayan region. Ecol. Model. 2017, 359, 92–102. [Google Scholar] [CrossRef]
- Kaczka, R.J.; Spyt, B.; Janecka, K.; Niedźwiedź, T.; Bednarz, Z. Climate reconstruction from tree-rings in the Tatra mountains. In Flood Risk in the Upper Vistula Basin; Springer: Cham, Switzerland, 2016; pp. 209–229. ISBN 978-3-319-41922-0. [Google Scholar]
- Ul Hasson, S.; Gerlitz, L.; Schickhoff, U.; Scholten, T.; Böhner, J. Recent climate change over High Asia. In Climate Change, Glacier Response, and Vegetation Dynamics in the Himalaya; Singh, R.B., Schickhoff, U., Mal, S., Eds.; Springer International Publishing: Cham, Switzerland, 2016; pp. 29–48. ISBN 978-3-319-28975-5. [Google Scholar]
- Singh, J.; Yadav, R.R.; Wilmking, M. A 694-year tree-ring based rainfall reconstruction from Himachal Pradesh, India. Clim. Dyn. 2009, 33, 1149–1158. [Google Scholar] [CrossRef]
- Yadav, R.R.; Misra, K.G.; Kotlia, B.S.; Upreti, N. Premonsoon precipitation variability in Kumaon Himalaya, India over a perspective of ∼300 years. Quat. Int. 2014, 325, 213–219. [Google Scholar] [CrossRef]
- Harris, I. Release Notes for CRU TS v4.01. Available online: https://crudata.uea.ac.uk/cru/data/hrg/cru_ts_4.01/Release_Notes_CRU_TS4.01.txt (accessed on 15 September 2017).
- Department of Hydrology and Meteorology (DHM). Study of Climate and Climatic Variation over Nepal; Department of Hydrology and Meteorology (DHM): Kathmandu, Nepal, 2015. Available online: http://www.dhm.gov.np/uploads/climatic/1407411953Climate%20and%20Climatic%20variability.pdf (accessed on 16 October 2017).
- Natalini, F.; Alejano, R.; Vázquez-Piqué, J.; Pardos, M.; Calama, R.; Büntgen, U. Spatiotemporal variability of stone pine (Pinus pinea L.) growth response to climate across the Iberian Peninsula. Dendrochronologia 2016, 40, 72–84. [Google Scholar] [CrossRef]
- Büntgen, U.; Frank, D.C.; Kaczka, R.J.; Verstege, A.; Zwijacz-Kozica, T.; Esper, J. Growth responses to climate in a multi-species tree-ring network in the Western Carpathian Tatra Mountains, Poland and Slovakia. Tree Physiol. 2007, 27, 689–702. [Google Scholar] [CrossRef] [PubMed]
- Kirdyanov, A.V.; Treydte, K.S.; Nikolaev, A.; Helle, G.; Schleser, G.H. Climate signals in tree-ring width, density and δ13C from larches in Eastern Siberia (Russia). Chem. Geol. 2008, 252, 31–41. [Google Scholar] [CrossRef]
- Krusic, P.J.; Cook, E.R.; Dukpa, D.; Putnam, A.E.; Rupper, S.; Schaefer, J. Six hundred thirty-eight years of summer temperature variability over the Bhutanese Himalaya. Geophys. Res. Lett. 2015, 42, 2015GL063566. [Google Scholar] [CrossRef]
- Sitko, R.; Vido, J.; Škvarenina, J.; Pichler, V.; Scheer, Ĺ.; Škvareninová, J.; Nalevanková, P. Effect of various climate databases on the results of dendroclimatic analysis. Earth Syst. Dyn. 2016, 7, 385–395. [Google Scholar] [CrossRef]
- Carrer, M.; Urbinati, C. Age-dependent tree-ring growth responses to climate in Larix decidua and Pinus cembra. Ecology 2004, 85, 730–740. [Google Scholar] [CrossRef]
- Altman, J.; Fibich, P.; Santruckova, H.; Dolezal, J.; Stepanek, P.; Kopacek, J.; Hunova, I.; Oulehle, F.; Tumajer, J.; Cienciala, E. Environmental factors exert strong control over the climate-growth relationships of Picea abies in Central Europe. Sci. Total Environ. 2017, 609, 506–516. [Google Scholar] [CrossRef] [PubMed]
- Wilmking, M.; Juday, G.P.; Barber, V.A.; Zald, H.S.J. Recent climate warming forces contrasting growth responses of white spruce at treeline in Alaska through temperature thresholds. Glob. Chang. Biol. 2004, 10, 1724–1736. [Google Scholar] [CrossRef]
- Wilmking, M.; Juday, G.P. Longitudinal variation of radial growth at Alaska’s northern treeline—Recent changes and possible scenarios for the 21st century. Glob. Planet. Chang. 2005, 47, 282–300. [Google Scholar] [CrossRef]
- Chhetri, P.K.; Thapa, S. Tree ring and climate change in Langtang National Park, central Nepal. Our Nat. 2010, 8, 139–143. [Google Scholar] [CrossRef]
- Rita, A.; Gentilesca, T.; Ripullone, F.; Todaro, L.; Borghetti, M. Differential climate–growth relationships in Abies alba Mill. and Fagus sylvatica L. in Mediterranean mountain forests. Dendrochronologia 2014, 32, 220–229. [Google Scholar] [CrossRef]
- Jiao, L.; Jiang, Y.; Zhang, W.-T.; Wang, M.-C.; Zhang, L.-N.; Zhao, S.-D. Divergent responses to climate factors in the radial growth of Larix sibirica in the eastern Tianshan Mountains, northwest China. Trees 2015, 29, 1673–1686. [Google Scholar] [CrossRef]
- Martin-Benito, D.; Anchukaitis, K.J.; Evans, M.N.; del Río, M.; Beeckman, H.; Cañellas, I. Effects of drought on xylem anatomy and water-use efficiency of two co-occurring Pine species. Forests 2017, 8, 332. [Google Scholar] [CrossRef]


| Mean Temperature (°C) | Precipitation (mm) | |
|---|---|---|
| January | 1.07 * | 4.68 |
| February | 1.32 * | −4.74 |
| March | 1.36 * | −9.88 |
| April | 0.79 * | 6.40 |
| May | 0.53 * | 44.73 * |
| June | 0.44 | −78.10 * |
| July | 0.05 | 42.82 |
| August | 0.41 * | −103.49 * |
| September | 0.37 * | −2.17 |
| October | 0.97 * | 3.83 |
| November | 1.56 * | −3.44 |
| December | 1.56 * | 8.01 |
| Year | 0.87 * | −7.25 |
| TRW Chronology Interval 1748–2012 | TRW Correlation Analyses Interval 1902–2012 | BI Chronology Interval 1819–2012 | BI Correlation Analyses Interval 1902–2012 | |
|---|---|---|---|---|
| Mean sensitivity | 0.099 | 0.082 | 0.024 | 0.019 |
| Mean R-bar | 0.324 | 0.337 | 0.217 | 0.176 |
| First-order autocorrelation | 0.696 | 0.671 | 0.522 | 0.436 |
| Mean expressed population signal (EPS) | 0.910 | 0.947 | 0.853 | 0.903 |
| Signal-to-noise ratio | NA | 18.031 | NA | 4.358 |
© 2018 by the authors. Licensee MDPI, Basel, Switzerland. This article is an open access article distributed under the terms and conditions of the Creative Commons Attribution (CC BY) license (http://creativecommons.org/licenses/by/4.0/).
Share and Cite
Schwab, N.; Kaczka, R.J.; Janecka, K.; Böhner, J.; Chaudhary, R.P.; Scholten, T.; Schickhoff, U. Climate Change-Induced Shift of Tree Growth Sensitivity at a Central Himalayan Treeline Ecotone. Forests 2018, 9, 267. https://doi.org/10.3390/f9050267
Schwab N, Kaczka RJ, Janecka K, Böhner J, Chaudhary RP, Scholten T, Schickhoff U. Climate Change-Induced Shift of Tree Growth Sensitivity at a Central Himalayan Treeline Ecotone. Forests. 2018; 9(5):267. https://doi.org/10.3390/f9050267
Chicago/Turabian StyleSchwab, Niels, Ryszard J. Kaczka, Karolina Janecka, Jürgen Böhner, Ram P. Chaudhary, Thomas Scholten, and Udo Schickhoff. 2018. "Climate Change-Induced Shift of Tree Growth Sensitivity at a Central Himalayan Treeline Ecotone" Forests 9, no. 5: 267. https://doi.org/10.3390/f9050267