Joint Control of Net Primary Productivity by Climate and Soil Nitrogen in the Forests of Eastern China

1
State Key Laboratory of Soil Erosion and Dryland Farming on Loess Plateau, Institute of Soil and Water Conservation, Northwest A&F University, Yangling 712100, China
2
Institute of Soil and Water Conservation, Chinese Academy of Sciences & Ministry of Water Resources, Yangling 712100, China
*
Author to whom correspondence should be addressed.
Forests 2018, 9(6), 322; https://doi.org/10.3390/f9060322
Submission received: 30 March 2018
/
Revised: 25 May 2018
/
Accepted: 31 May 2018
/
Published: 4 June 2018
(This article belongs to the Special Issue Carbon, Nitrogen and Phosphorus Cycling in Forest Soils)
Abstract
:The nature and extent of climate and soil nutrient controls in Chinese forests remain poorly resolved. Here, we synthesized the data on carbon–climate–soil in eastern China, and litter N was firstly taken into consideration, to examine the variation of net primary productivity (NPP) and its driving forces. Results showed that NPP had significant latitude pattern and varied substantially across climate zones. Bivariate analyses indicated that mean annual temperature (MAT), mean annual precipitation (MAP), soil N content (Nsoil), and annual litter N (Nre) were the main controlling factors in spatial pattern of forest NPP. Notably, partial general linear model analysis revealed that MAT, MAP, and Nre jointly explained 84.8% of the spatial variation of NPP. Among the three major factors, Nre explained more variation of forest NPP than the other two factors, and MAT and MAP affected NPP mainly through the change of litter N rather than via themselves, highlighting the importance of litter N in estimating forest NPP. However, to accurately describe the pattern of forest NPP in China, more detailed field measurements and methodologies on NPP and relevant confounding factors should be addressed in future studies.
1. Introduction
Net primary productivity (NPP) is a key ecosystem variable and a critical component of the regional and global carbon cycle [1,2]. However, the spatial distribution of forest NPP is still uncertain, due to complicated impacts from various environmental and biological factors, e.g., vegetation distribution, climatic variables, and land use change [3,4,5]. Therefore, accurate estimation of NPP and its driving forces is essential to understanding terrestrial carbon pools and responses of forest functions to future climate change [6,7].
At a regional scale, NPP is strongly correlated with climatic factors [8,9,10,11]. Based on global NPP data, Lieth (1975) [8] developed the climate-driven theory, and described the relationship between climatic factors (annual mean temperature, annual precipitation, and annual evapotranspiration) and NPP in logistic functions. However, it is still unclear whether regional NPP across biomes follows the same pattern [12,13], since the driving factors vary among regions [14,15,16]. Further, an international coordination for compilation of global NPP data for model validation and development, the Global Primary Productivity Data Initiative (GPPDI), has worked successfully since 1995. However, inadequate observational NPP data seriously inhibit the estimation and modeling of the global carbon cycle and the validation and evaluation of the global carbon models [17].
Globally, forests represent 80% of plant biomass, and 50–60% of annual NPP in terrestrial ecosystems [5,18]. Chinese forests, which cover about half the total land area of China, contain perhaps the widest range of forest types in the world, ranging from boreal forest and mixed coniferous broad-leaved forest in the north, to subtropical evergreen broad-leaved forest, warm temperate coniferous forest, tropical rainforest, and seasonal forest in the south [19,20]. It is regarded that these forests have a significant influence on carbon budget both regionally and globally [21]. A lot of field measurements of forest biomass and NPP estimations are available from multiple sites for the past two decades. However, these data were mostly published in Chinese journals and reports and not accessible to Western scientists. Also, site-based data of forest NPP in China has not yet been synthesized in a consistent manner.
Located in heavily forested area, the North–South Transect of Eastern China (NSTEC) features a high variation in plant composition, climate, and soil substrate materials [22]. It thus provides wide biome heterogeneity to examine spatial pattern of forest NPP. We synthesized the data in the primary literature on NPP in forests within the NSTEC to produce a consistent dataset on NPP, and amassed the data on mean annual temperature (MAT), mean annual precipitation (MAP), soil N content (Nsoil), and annual litter N (Nre). Hobbie (2015) [23] proposed the plant litter feedback paradigm that changes in plant litter traits reinforce patterns of soil fertility and NPP. Thus, we first introduced litter N as available N for plants, which was an improvement over the past studies. Based on these data, we aim to investigate whether temperature and precipitation characterize the pattern of NPP within the transect, to explore whether soil N is a limiting factor for large-scale distribution of NPP, and to test the applicability of the climate-driven theory in eastern China. Besides understanding the causes of variability in ecosystem productivity, the findings are crucial for assessing the potential responses to global climatic change, and are thus incorporated into statistical and simulation models.
2. Materials and Methods
2.1. Study Area
NSTEC provides an ideal platform for exploring the growth of forest in East Asia’s monsoon region [22]. NSTEC has a spatial distance of more than 3700.0 km in length, ranging from 108.0° E to 118.0° E for latitude below 40.0° N and from 118.0° E to 128.0° E for latitude above 40.0° N (Figure 1). From north to south, MAP increases from 500.0 mm to about 1800.0 mm, and MAT changes from 1.0 to 22.0 °C, correspondingly. Due to the obvious latitudinal gradients for climate, zonal forest ecosystems occur within the NSTEC, which include cold-temperate coniferous forest, temperate mixed forest, warm-temperate deciduous broadleaved forest, subtropical evergreen broad-leaved forest, and tropical monsoon rainforest. Within NSTEC, 87 observations in 34 plots were included in this study, and geographical distribution of the sites was mapped in Figure 1.
2.2. Datasets
Data on the forest ecosystems within the transect were obtained from published literature (Figure 1, Table S1). The sampling years were not mentioned in most of the original literature, and only the publication years of the literature could be obtained, which varied from 1983 to 2010. The information about the publication time could be seen in Table S1. The times were classified into three groups according to the publication year, and they were 1980s (1983–1989), 1990s (1991–1999), and 2000s (2001–2010). Based on the classification, the temporal variations were analyzed, and there were no significances among climatic factor, soil N, and also NPP for different times (Table S2). Therefore, we take no account of temporal variations of forest NPP, and only spatial pattern of forest NPP was involved. To be clear, “major forest biome” was used to represent a higher-level classification of the “ecological zone”, which included boreal, temperate, subtropical, and tropical forests [24]. Each site included site name, latitude, longitude, tree species, MAT, MAP, Nsoil, Nre, and NPP estimations (Table S1). We retrieved missing latitude or longitude information for sites without such data from Google Earth according to site names. Meanwhile, missing MAT and MAP were extracted from the Chinese climate data based on site locations. NPP was expressed, herein, in per unit of oven-dry matter (t ha−1 a−1). In order to compare with other studies, NPP may be expressed in g C m−2 a−1, where 1.0 g carbon is equivalent to 2.2 g oven-dry matter.
2.2.1. Estimation of NPP
Forest NPP was estimated as the sum of increase in the standing crop of vegetation based on the data for biomass, which included net increments of trees, shrubs, and herbs. Biomass data in our study were all from field survey, and data from modeling and regional average were excluded. The sampling methods for measuring forest biomass used by Chinese scientists, however, were quite different. General methods of biomass estimates were given below. Firstly, diameter at breast height (DBH) and the height (H) of each tree in the plot were measured, and then one of the three methods was used: (1) mean tree biomass was measured, and then multiplied by tree density of each plot; (2) allometric equations were used to calculate the biomass of each tree; and (3) allometric equations were used to calculate the mean tree biomass, and multiplied by tree density of each plot [25,26]. Secondly, dead biomass of each tree was the sum of standing dead stem and coarse woody debris [27]. Thirdly, biomass of shrubs and herbs was measured by harvest method within large tree samples. Aboveground tissues were clipped, and the weight of these tissues and the aboveground biomass were calculated based on the plot area. Finally, the biomass of litterfall was determined by monthly collection in three or more 1.0 m × 1.0 m plots, laid out inside a single tree plot. Litterfall components, such as leaf, branch, flower, and fruit, were dried and weighed to estimated total litterfall biomass. After one year, the sampling and the analysis for trees and understory vegetation were repeated, and the increases in biomass were taken as forest NPP.
2.2.2. Measurements of Soil N
Soil sampling depths varied from a few centimeters to several meters in different studies. Considering data availability and distribution of plant roots in the soil, in our study, only the data from the depths of 0–60.0 cm in soil were used. Generally, the soil was sampled from the soil pits selected randomly in each forest ecosystem, and soil bulk density was determined by collecting samples in volumetric rings. In preparation for analysis, soil samples were air-dried and then passed through the mesh sieve for measurement of N concentration. Nsoil was calculated by multiplying the mean concentration of N in each layer with the corresponding mean soil bulk density Equation (1). Annual litter N (Nre) was calculated as litter biomass multiplied by the respective N concentration, and finally, the contents of the individual fractions were summed in Equation (2).
where, Nsoil is soil N content (kg ha−1), Nre is annual litter N (kg N ha−1 a−1).
2.2.3. Climate Data
When investigating the relationship between climate and forest productivity, it would be better to employ climate data for particular sampling years. Hence, synchronous climate data for particular sampling years were collected. However, most sampling sites were far away from weather stations, and thus, climate data were missing. Therefore, the meteorological data from the Meteorological Database of the Chinese Ecological Research Network (CERN) Synthesis Research Center were extracted. Climate data in a grid cell where the sampling site was located was extracted as the climate data of the sampling site. MAP and MAT were the average values of 1980–2000 with a 10-day-0.1° spatial–temporal resolution [28].
2.3. Statistical Analysis
One-way analysis of variance (ANOVA) was adopted to test the differences in forest NPP among different climate zones, and was followed by Fisher’s least significant difference (LSD) comparisons when the differences were significant. Linear regression analysis or dynamic curve fit was used to analyze the relationships between forest NPP and the driving forces. Considering the differences in sample size, we compared R2 and root mean squared error (RMSE), and selected the better-fit functions that had a higher R2 and lower RMSE. The stepwise regression was used to analyze the linear regression on forest NPP with climate and soil N. In the stepwise regression, the minimum p-value for a variable to be recommended for adding to and removing from the model was 0.05. Considering the results of stepwise regression, only MAT, MAP, and Nre were analyzed in the ensuing analysis. To identify the relative effects and interactive effects of the above three factors on forest NPP, we conducted a partial general linear model (GLM) using NPP as dependent variable, and MAT, MAP, and Nre as predictors. The partial regression divides the variation in response variable explained by several predictor variables into independent components (representing the independent effects of an individual explanatory variable when controlling effects of the other explanatory variables) and joint components (usually representing the collinearities between explanatory variables). The variation partitioning with three explanatory matrices leads to the identification of seven fractions in this study, i.e., independent effects of MAT, MAP, and Nre; interactive effects of MAT and MAP, MAT and Nre, MAP and Nre, and the interactive effect of all variables. Further details about the method were given in Heikkinen et al. (2005) [29].
Figure 1 was plotted with ArcGIS 10.1 software (Esri, Realands, CA, USA), and other graphs were performed by Sigma Plot 13.0 software (Systat Software Inc., San Jose, CA, USA). The partial GLM was performed with SAS statistical software and other analyses were conducted by SPSS 16.0 statistical software (SPSS Inc., Chicago, IL, USA).
3. Results
3.1. Latitudinal Pattern and Statistics of NPP
Forest NPP across eastern China exhibited significantly obvious latitudinal patterns (p < 0.001), but no clear longitudinal trend (p = 0.20) (Figure 2). Therefore, we did not elaborate on the longitudinal pattern of forest NPP. Generally, NPP decreased with increasing latitude when latitude was below 35.0° N, but increased when the latitude was higher than the threshold level (Figure 2). As a whole, mean total NPP was 9.5 ± 0.7 t ha−1 a−1 (mean ± SE), ranging from 0.8 to 29.6 t ha−1 a−1, with the variability (coefficient of variation, CV) up to 64.0% (Table 1). In terms of different climate zones, tropical forests below 23.0° N had the highest forest productivity with an average NPP of 15.3 ± 1.3 t ha−1 a−1, but the smallest spatial variability (CV = 31.6%). NPP of temperate forests was, on average, 5.5 ± 0.8 t ha−1 a−1, which tended to be the lowest among the four climate zones. The other climate zones (subtropical forests and boreal forests) were not different from each other, and were intermediate to the others. Specifically, the average NPP of subtropical forests was 10.1 ± 0.9 t ha−1 a−1, which was close to the value of boreal forests (12.1 ± 4.7 t ha−1 a−1), but the latter forests exhibited a higher spatial variability in NPP from available data (CV = 78.4%) (Table 1).
3.2. The Impact of Climatic Factors on the Spatial Pattern of NPP
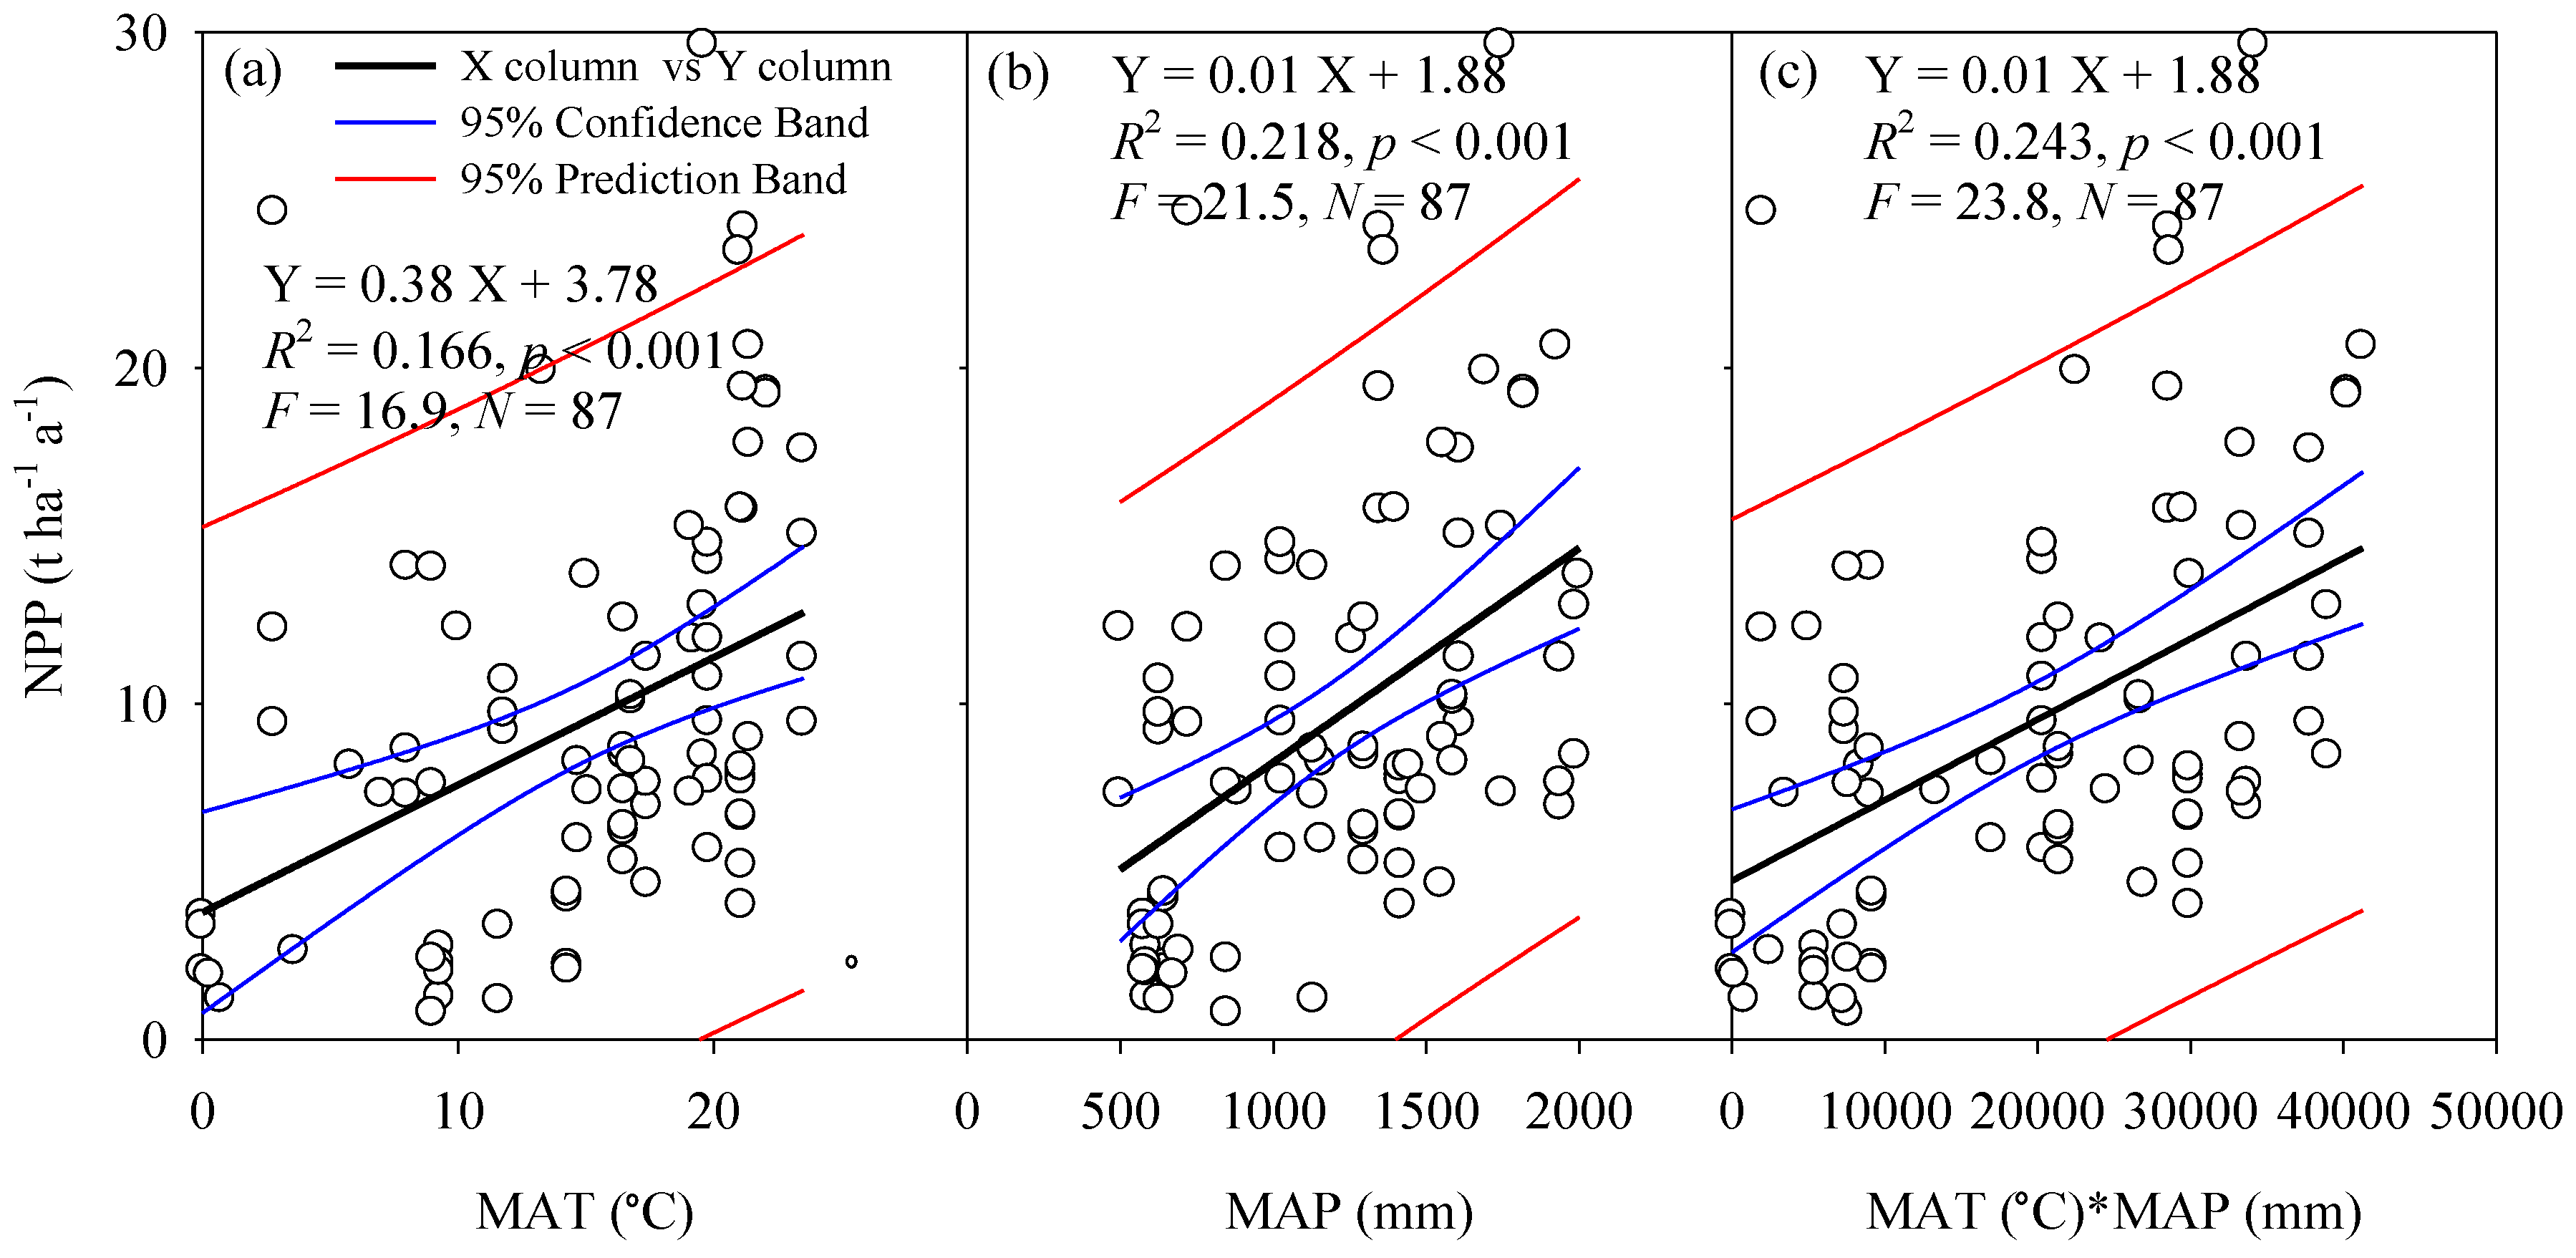
Temperature is an important driving factor for the ecosystem carbon budget, and water is the basic material for maintaining ecosystem structure and functions. As was clearly shown in Figure 3, the plot based forest NPP grew linearly with increasing MAT, MAP, and the combinations, although variation occurred within the climate band and few sites fell out of 95.0% prediction band. On average, MAT and MAP contributed 16.6% and 21.8% of the spatial variation of NPP, respectively (Figure 3, Table 2). We then analyzed the combined contribution of MAT and MAP to the spatial variation of NPP, and found that MAT and MAP jointly explained 24.3% of the spatial variation of NPP, which was only just 2.5% higher in the prediction of NPP than single climatic factor (MAP) alone (Figure 3, Table 2). As for different climate zones, climatic factors were also closely related to the occurrence of NPP. Generally, there was a consistent and significant shift from species with high NPP in warm climate with high MAT and MAP toward species with low NPP in low MAT and MAP conditions, while the trend in boreal forest ecosystems differed (Figure S1). Specifically, for boreal forest, higher NPP occurred with lower MAT and MAP. More speculatively, soil nutrients or other environmental factors might contribute to the variation of forest NPP in this region, and this should be taken into consideration in the ensuing analyses. It is worth noting that the number of boreal forests was quite low, hence, the reliability of the results should be considered carefully.
3.3. The Impact of Soil N on the Spatial Pattern of NPP
Similar to climatic factors, our data illustrated that soil N was also closely related to forest NPP (Figure 4). Generally, positive linear function fitted well the relationship between forest NPP and soil N, and namely, Nsoil and Nre accounted for 10.6% and 28.4% of variation of NPP (Figure 4, Table 2). When examining the combined effect of Nsoil and Nre, we found that Nsoil and Nre in the model jointly explained 38.2% of variation in NPP, a marked improvement over Nsoil or Nre alone. (Figure 4, Table 2). Although forest NPP covaried spatially with soil N, it should be noted that a statistically significant relationship did not necessarily imply causality. Moreover, the occurrence of high Nsoil and Nre rather than MAT and MAP favored the increase of NPP in boreal forest ecosystems (Figure S2). Additionally, across all bivariate analyses above, R2-value and F-value of Nre for NPP were almost always higher than those of NPP versus other factors involved in this study, illustrating that plant litter N played a more important role in determining forest NPP than other environmental factors.
3.4. The Combined Impact of Climate and Soil on the Spatial Pattern of NPP
Even though the climate-NPP and soil-NPP relationships analyzed above were statistically significant, many points were still scattered around the fitted lines, and a great deal of variability for NPP was not captured (Figure 3 and Figure 4). Subsequently, we conducted a stepwise multiple regression to identify the effects of climatic factors and soil N on forest NPP. The results showed that Nsoil was excluded from the linear regression model, and the explanatory power of these three factors (MAT, MAP, and Nre) for NPP was just 49.2%, a marginal decline over four factors together, in Equation (3).
However, there were significant collinearities between these environmental factors. Table 3 summarized correlation coefficients among these variables. Climatic factors for MAT and MAP were highly correlated, and both of them had marked correlations with Nre, but had non-robust correlation with Nsoil, and mutually, Nre had a marginal relationship with Nsoil (Table 3).
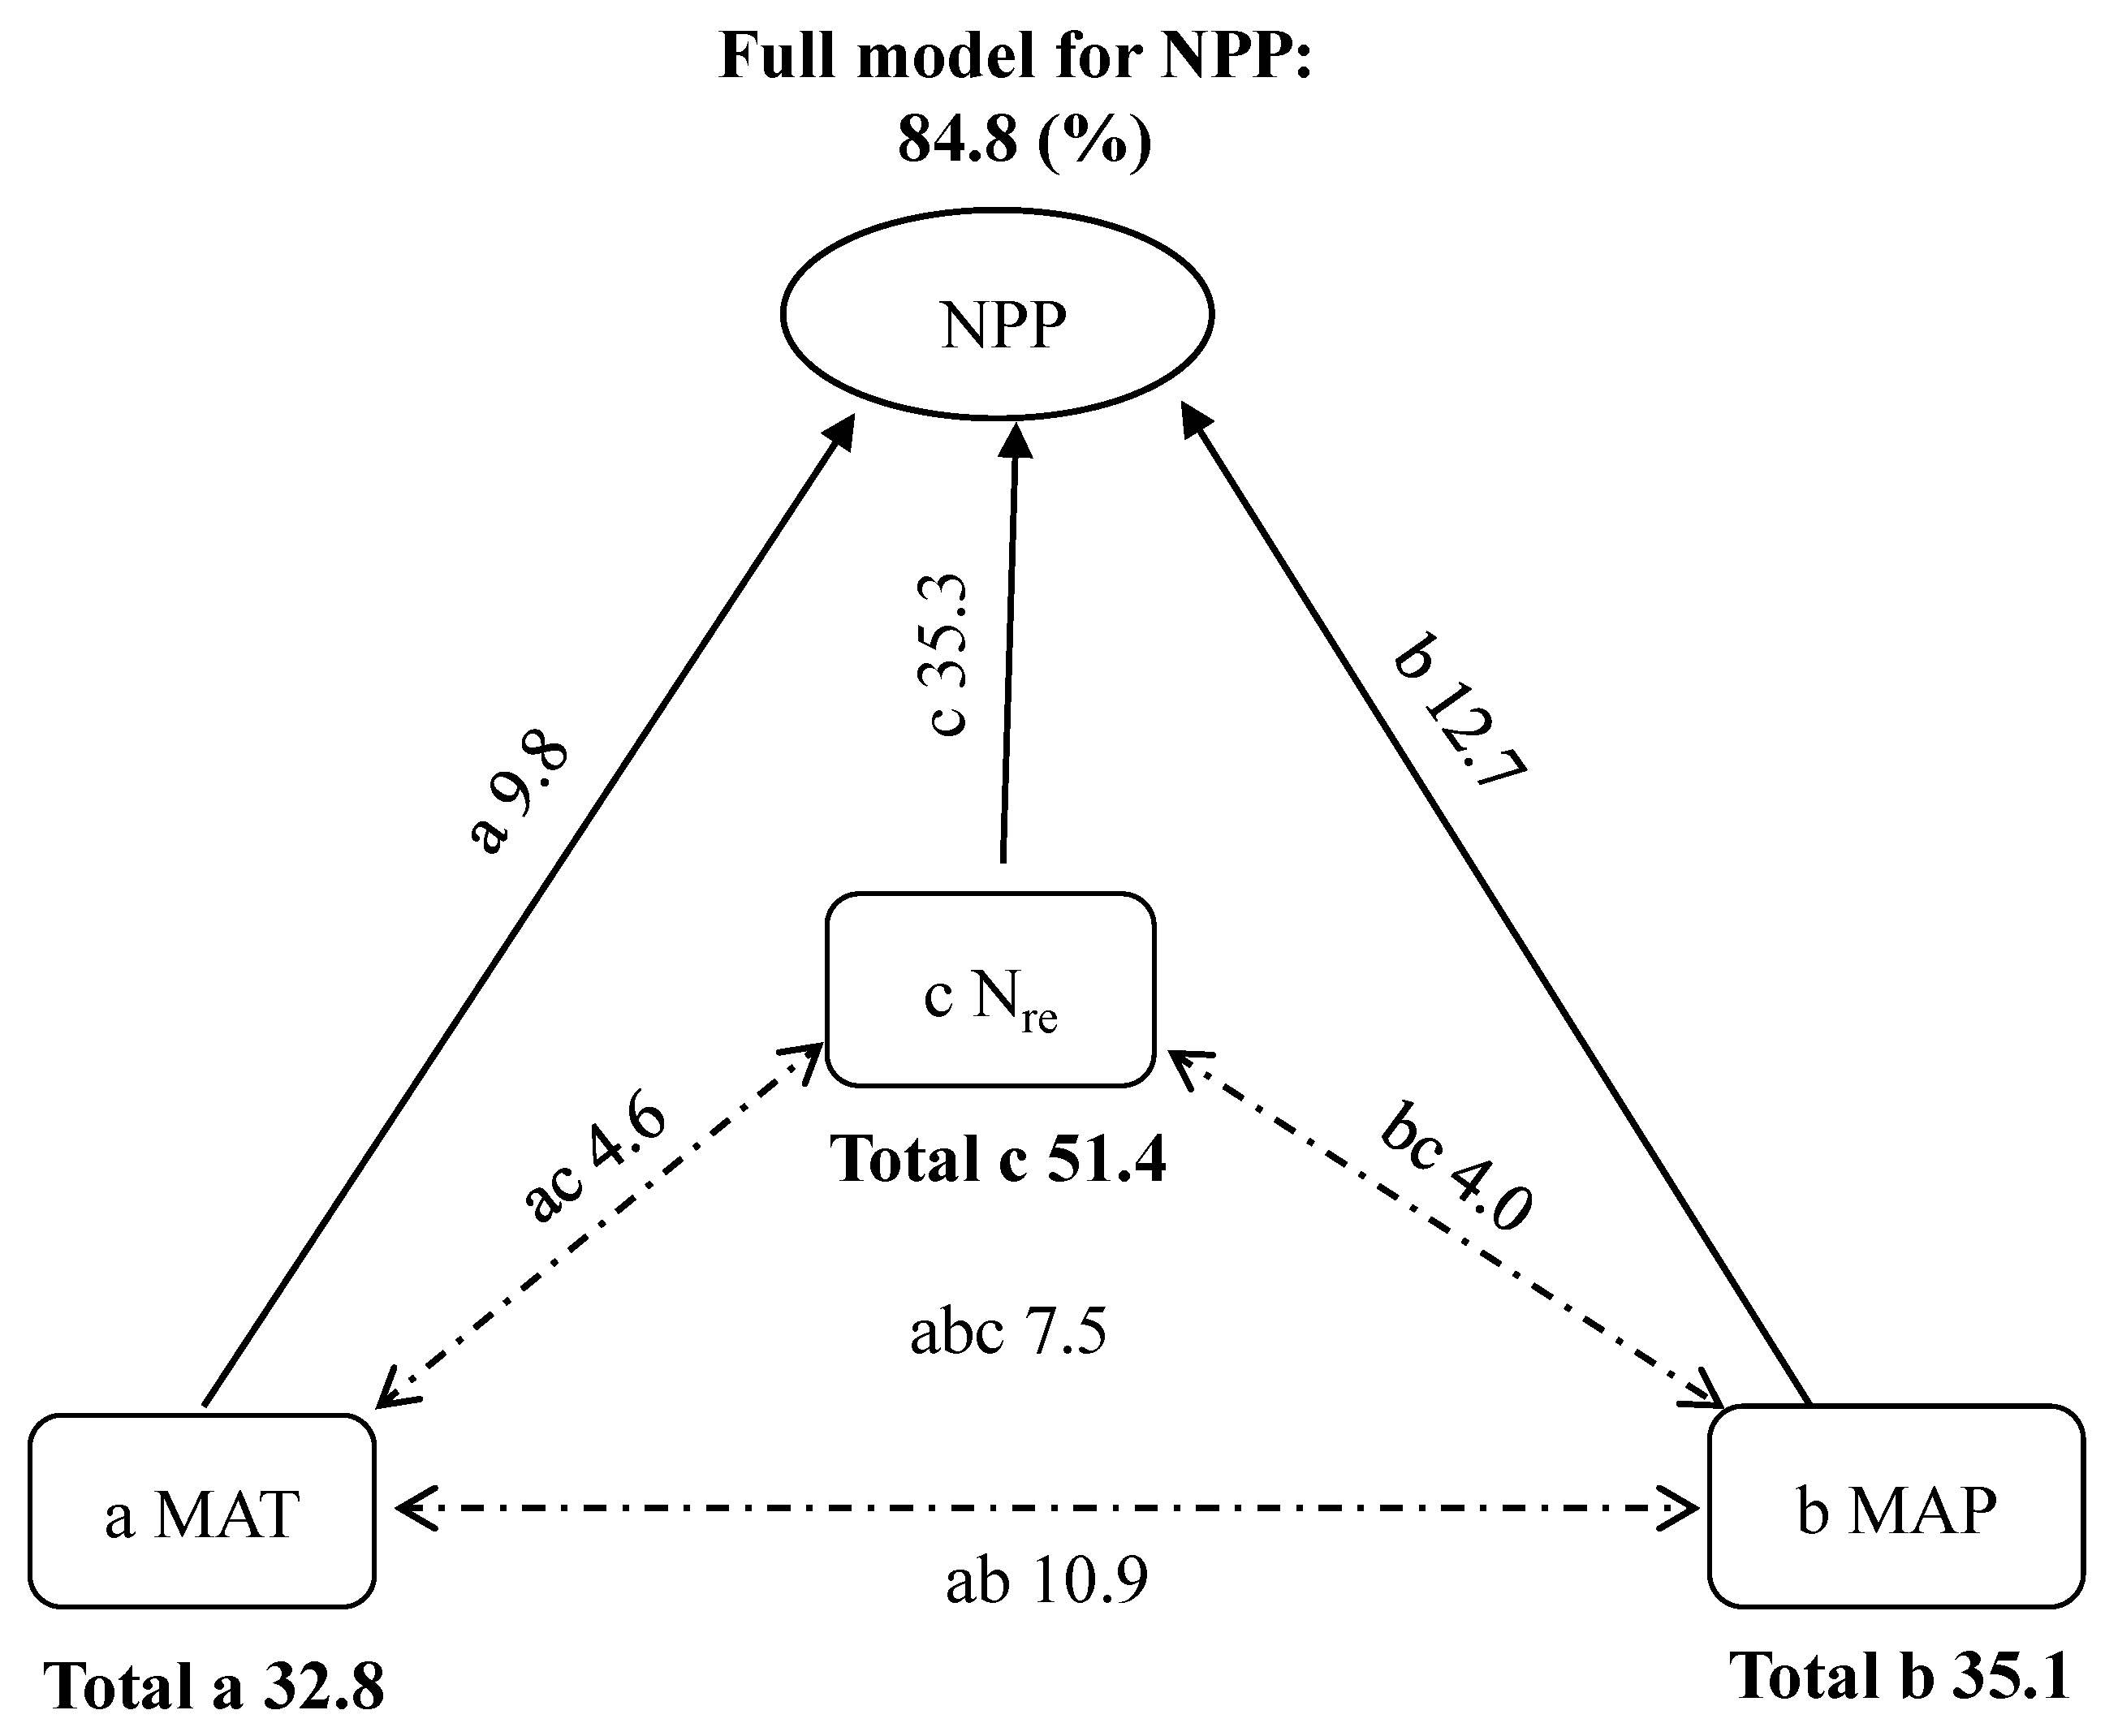
Considering the results of stepwise multiple regression analysis and correlation coefficients above, only MAT, MAP, and Nre were referred to when identifying the combined effects of the drivers on NPP in ensuing analysis. Given the significant collinearities among the three factors, their true roles for NPP could be obscured. Therefore, we used partial GLM to examine their relative causality in the control of spatial pattern of NPP. General linear model involving MAT, MAP and Nre could account for 84.8% of the variation in NPP, and MAT, MAP, and Nre explained 9.8%, 12.7%, and 35.3% of the variation in NPP, respectively; the interactive effects of MAT and MAP (ab), MAT and Nre (ac), MAP and Nre (bc), and MAT, MAP, and Nre (abc) represented 10.9%, 4.6%, 4.0%, and 7.5%, respectively (Figure 5). The results indicated that Nre was much more important in shaping forest NPP than the climatic factors.
4. Discussion
4.1. Carbon Budget
NPP in forests in eastern China in our study were, on average, 4.3 t C ha−1 a−1, which was similar to that in boreal forest ecosystems (4.2 t C ha−1 a−1) [30], but lower than that in European Forest Ecosystems (6.5 t ha−1 a−1) [31]. Actually, considering the number and spatial representation of observation sites in different regions, our results need to be further validated with more data. Based on the 7th national forest inventory data and biomass–volume relationship, we estimated that forest biomass carbon in China was approximately 840.3 Tg C a−1 (forest area was 195.0 × 10⁶ ha), assuming that forests represented potential vegetation in forest regions, and the impact of human disturbance was negligible. Our findings were similar to the result reported by Ni et al. (2003) [20] (738.9 Tg C a−1), but was about two times that estimated by Fang et al. (2001) [19] (461.0 Tg C a−1), and the results might be ascribed to the differences in NPP estimate methods and forest area calculations. As a large country in the world, China contributes much to regional and global carbon budget. Therefore, determining distribution pattern of carbon budget of the forest ecosystems in China will be helpful for exploring the carbon cycle of the terrestrial ecosystem and addressing global warming [32].
4.2. Explanations for the Distribution Pattern of NPP
4.2.1. Climate Control
Temperature is an important factor for regulating potential photosynthetic activity of vegetation, as well as the length of the growing season [33,34], both of which jointly determine ecosystem productivity [35]. In addition to temperature, precipitation is another determinant of the spatial variation of NPP [36,37]. Numerous studies have indicated that NPP increased with both increasing temperature and precipitation, but the response rates and patterns varied in different regions [9,10,36]. Our study found that NPP in the forest ecosystems of China increased linearly at a rate of 0.38 t ha−1 a−1 for a 1.0 °C increase in MAT, and 1 t ha−1 a−1 for a 1.0 mm increase in MAP (Figure 3). Our results were similar to that of Ni et al. (2001) [38], who noted that NPP in the forest ecosystems of China increased by 0.48 kg ha−1 a−1 for 1.0 °C increase in MAT and 0.1 kg ha−1 a−1 for 1.0 mm increase in MAP. Luo et al. (2004) [10] found that NPP increased exponentially, rather than linearly, with an increase in MAT, whereas NPP increased with increasing MAP when MAP was lower than the threshold level of 1490.0 mm, then decreased when MAP was higher than the threshold level. Luyssaert et al. (2007) [36] illustrated that in a global forest study, NPP increased with increasing MAT from 5.0 to 10.0 °C, but appeared to be saturated beyond 10.0 °C. Similarly, NPP increased with increasing MAP until leveling off at 1500.0 mm. Although the responses of NPP to climatic factors were different in a certain extent, the decisive effects of temperature and precipitation on spatial variation of NPP were established in most studies.
4.2.2. N Control
Soil N is a primary factor that limits plant growth owing to the large discrepancy between demand and supply, and its vital role in plant carbon assimilation [39,40]. Significant advances have been made in the past decades toward understanding the relationship between soil N and NPP in terrestrial ecosystems, whereas substantial uncertainties persist, and discrepancies between studies remain unresolved [40,41,42]. Yuan et al. (2006) [43] found a significant positive linear correlation between NPP and soil inorganic N for grassland ecosystems in Mongolia, whereas Luo et al. (2004) [10] found a curved relationship between NPP and total soil N. Our field data indicated that Nsoil alone explained nearly 10.6% of the NPP variation within the transect (Figure 4, Table 2). Hobbie (2015) [23] focused on feedback to NPP operating through litter decomposition, and reported that positive or negative effects of litter N on the later stages of litter decomposition could strengthen or weaken the positive loop of NPP. Therefore, beside Nsoil, we introduced Nre to estimate the effect of soil N on forest NPP, and found that Nre alone accounted for 28.4% of the variation, which had higher explanation for NPP than Nsoil, and the positive effects of Nre on forest NPP were confirmed (Figure 4, Table 2). The role of soil N in shaping forest NPP, in our study, was imperative for models based on mechanism and ecological process, such as CEVSA model, and BIOME-BGC model for NPP estimation. Generally, the plant growth module in CEVSA model described photosynthesis, carbon allocation, leaf area index, and litter production; the biogeochemical module simulated the transformation and decomposition of organic materials, and nitrogen inputs and outputs in soil. BIOME-BGC model was described as the function of temperature, leaf area, water, and soil nitrogen.
Soil N and litter N were involved in the key process of these models. Thus, future efforts should be focused on identifying the role of soil N, litter N, litter nutrient limiting decomposition, and litter nutrient release versus NPP.
4.2.3. Joint Control
The present study identified one geographical trend in forest productivity, and found that MAT and MAP, alone or in combination, explained 16.6–24.3% of the NPP variation within the transect, while Nsoil and Nre explained 10.6–38.2% of the variation (Figure 3 and Figure 4, Table 2). Although forest NPP covaried spatially with climatic factors and soil N, it should be noted that a statistically significant relationship did not necessarily imply causality. Importantly, we found that the trends of the relationships of NPP to soil N were more similar than that of NPP versus climatic factors, especially for boreal forests, indicating that rich soil N, rather than warm climate, stimulated the increase in productivity in this region (Figure 3 and Figure 4). To confirm the effects of climate and soil on NPP, partial GLM was conducted, and the results showed that the overall model including MAT, MAP, and Nre, could account for 84.8% of the spatial variation in NPP (Figure 5). The findings suggest that the combination of temperature and precipitation-related physiology and soil substrate-related N is responsible for the observed pattern of forest productivity, and also reflects pervasive geographic pattern in the structure and function of forest ecosystems [42]. It was worth noting that in the overall model, Nre explained independently more than 35.0% of the total variation for NPP, while MAT and MAP explained independently less than 15.0% (Figure 5). The results above suggest that the geography of NPP was largely controlled by Nre rather than climate, highlighting the role of litter N in shaping the spatial pattern of forest NPP. The finding is valuable for planners and decision-makers in their attempts to evaluate the effects of nutrient status on forest ecosystems and to develop suitable strategies for forest management.
4.3. Uncertainty Analysis
In this study, we synthesized the data in the primary literature on NPP in the forest ecosystems in eastern China to produce a consistent dataset on NPP. With a wide coverage and a reasonable range, the results of this study provide a robust estimate of NPP in this region. However, there was still a great deal of variability in NPP, which might be ascribed to limitations of data and methodology. Firstly, new methods of data collection are still urgently required. Data collection should come directly from the ecologists who measure forest NPP, rather than indirectly from publications. Standard methods in measuring biomass, standard measure time, and suitable methods in estimating NPP are strongly encouraged. Secondly, uneven site distribution could be an important factor contributing to the uncertainty. In this study, the sites tended to be more concentrated in the temperate and subtropical than boreal zone; therefore, limitations in the results of the analysis were introduced by this uneven site distribution. Additionally, when analyzing the spatial variation of NPP at an annual scale, errors were likely to be produced due to different time spans of data collection. Moreover, available field measurements of NPP depend largely on the sum of the positive increments of biomass, since root production was rarely estimated. As a result, existing field-based estimates of forest NPP in our study were likely to be significant underestimates. Furthermore, it is worth noting that although MAT, MAP, and Nre were important factors in the spatial variation of NPP in the forests of eastern China, the total variability that was not captured was 15.2% for NPP (Figure 5). We inferred that NPP showed high spatial variability due to impacts from various environmental factors, and biological factors, such as stand age, vegetation distribution, nitrogen deposition, and disturbance (i.e., thinning harvesting irrigation, and drainage) [44,45,46], could weaken the climate and soil regulation on forest productivity to a certain extent. An intensive study on this aspect is expected to be carried out in the future, which is critical for expanding current analysis and including other carbon cycles related to more environmental factors.
5. Conclusions
Based on published data from Chinese literature and reports, we concluded that NPP increased from north to south within the NSTEC, and high spatial variation of NPP was found among climate zones. Spatially, climate and soil were both significantly linearly correlated to NPP, and the combined effect of MAT, MAP, and Nre accounted for 84.8% of the spatial variation of NPP. Considering the true roles of the controlling factors in NPP, Nre was the most important, followed by MAP and MAT in succession. The findings demonstrate that forest productivity was determined by climate, mainly via the status of soil N, highlighting the role of litter N in shaping the spatial pattern of forest NPP. The results are helpful for elucidating spatial variation of NPP and evaluating potential responses of forest ecosystems to global climatic change. However, further studies need to be carried out to fully understand and verify the causes of variability of NPP in forest ecosystems across wider geographical sites.
Supplementary Materials
The following materials are available online at https://www.mdpi.com/1999-4907/9/6/322/s1. Table S1: Location, mean annual temperature (MAT), mean annual precipitation (MAP), soil N content (Nsoil), annual litter N (Nre) and net primary productivity (NPP) in this study. NOTES: Table S1 is a long table, and we put it in a separate file; Table S2: Summary of analysis of variance (ANOVA) of mean annual temperature (MAT), mean annual precipitation (MAP), soil N content (Nsoil), annual litter N (Nre) and net primary productivity (NPP) among three classification of publication year (1980s (1983–1989), 1990s (1991–1999) and 2000s (2001–2010)). Figure S1: Comparisons of mean annual temperature (MAT), mean annual precipitation (MAP), and net primary productivity (NPP) of forest ecosystems in different climate zones. Different letters above bars indicated significant differences among climate zones, which were determined by Fisher′s least significant difference (LSD) comparisons (p < 0.05). Figure S2: Comparisons of soil N content (Nsoil), annual litter N (Nre), and net primary productivity (NPP) of forest ecosystems in different climate zones. Different letters above bars indicated significant differences among climate zones, which were determined by Fisher′s least significant difference (LSD) comparisons (p < 0.05).
Author Contributions
Z.X. wrote the paper; G.M. collected the data; Z.T. designed the scheme and revised the paper.
Funding
This work was financially supported by National Key R & D Program of China (2017YFA0604803), 13th Five Year Informatization Plan of Chinese Academy of Sciences (XXH13505-07), and National Natural Science Foundation of China (41503078, 51509238).
Acknowledgments
The authors would like to thank all related staffs for their contributions to data collection and data analysis. Deep appreciation goes to anonymous reviewers for presenting valuable suggestions to improve this paper.
Conflicts of Interest
No potential conflict of interest was reported by the authors.
References
- Dixon, R.K.; Brown, S.; Houghton, R.A.; Solomon, A.M.; Trexler, M.C.; Wisniewski, J. Carbon pools and flux of global forest ecosystmes. Science 1994, 263, 185–190. [Google Scholar] [CrossRef] [PubMed]
- Niemeijer, D. Developing indicators for environmental policy: Data-driven and theory-driven approaches examined by example. Environ. Sci. Policy 2002, 5, 91–103. [Google Scholar] [CrossRef]
- Kitayama, K.; Aiba, S.I. Ecosystem structure and productivity of tropical rain forests along altitudinal gradients with contrasting soil phosphorus pools on Mount Kinabalu, Borneo. J. Ecol. 2002, 90, 37–51. [Google Scholar] [CrossRef] [Green Version]
- Raich, J.W.; Russell, A.E.; Kitayama, K.; Parton, W.J.; Vitousek, P.M. Temperature influences carbon accumulation in moist tropical forests. Ecology 2006, 87, 76–87. [Google Scholar] [CrossRef] [PubMed]
- Keeling, H.C.; Phillips, O.L. The global relationship between forest productivity and biomass. Glob. Ecol. Biogeogr. 2007, 16, 618–631. [Google Scholar] [CrossRef]
- Matsushita, B.; Xu, M.; Chen, J.; Kameyama, S.; Tamura, M. Estimation of regional net primary productivity (NPP) using a process-based ecosystem model: How important is the accuracy of climate data? Ecol. Model. 2004, 178, 371–388. [Google Scholar] [CrossRef]
- Chapin, F.S.; McFarland, J.; McGuire, A.D.; Euskirchen, E.S.; Ruess, R.W.; Kielland, K. The changing global carbon cycle: Linking plant-soil carbon dynamics to global consequences. J. Ecol. 2009, 97, 840–850. [Google Scholar]
- Lieth, H. Primary productivity of the biosphere. In Modeling the Primary Productivity of the World; Lieth, H., Whittaker, R.H., Eds.; Springer: New York, NY, USA, 1975; pp. 237–264. [Google Scholar]
- Knapp, A.K.; Smith, M.D. Variation among biomes in temporal dynamics of aboveground primary production. Science 2001, 291, 481–484. [Google Scholar] [CrossRef] [PubMed]
- Luo, T.X.; Pan, Y.D.; Ouyang, H.; Shi, P.L.; Luo, J.; Yu, Z.L.; Lu, Q. Leaf area index and net primary productivity along subtropical to alpine gradients in the Tibetan Plateau. Glob. Ecol. Biogeogr. 2004, 13, 345–358. [Google Scholar] [CrossRef] [Green Version]
- Del Grosso, S.; Parton, W.; Stohlgren, T.; Zheng, D.L.; Bachelet, D.; Prince, S.; Hibbard, K.; Richard Olson, A. Global potential net primary production predicted from vegetation class, precipitation, and temperature. Ecology 2008, 89, 2117–2126. [Google Scholar] [CrossRef] [PubMed]
- Sala, O.E.; Parton, W.J.; Joyce, L.A.; Lauenroth, W.K. Primary production of the central grassland region of the United States. Ecology 1988, 69, 40–45. [Google Scholar] [CrossRef]
- Clark, D.A.; Brown, S.; Kicklighter, D.W.; Chambers, J.Q.; Thomlinson, J.R.; Ni, J.; Holland, E.A. Net primary production in tropical forests: An evaluation and synthesis of existing field data. Ecol. Appl. 2001, 11, 371–384. [Google Scholar] [CrossRef]
- Raich, J.W.; Russell, A.E.; Vitousek, P.M. Primary productivity and ecosystem development along an elevational gradient on Mauna Loa, Hawaii. Ecology 1997, 78, 707–721. [Google Scholar]
- Schuur, E.A.G.; Matson, P.A. Net primary productivity and nutrient cycling across a mesic to wet precipitation gradient in Hawaiian montane forest. Oecologia 2001, 128, 431–442. [Google Scholar] [CrossRef] [PubMed]
- Smith, M.D.; La Pierre, K.J.; Collins, S.L.; Knapp, A.K.; Gross, K.L.; Barrett, J.E.; Frey, S.D.; Gough, L.; Miller, R.J.; Morris, J.T.; et al. Global environmental change and the nature of aboveground net primary productivity responses: Insights from long-term experiments. Oecologia 2015, 177, 935–947. [Google Scholar] [CrossRef] [PubMed]
- Scurlock, J.M.O.; Johnson, K.; Olson, R.J. Estimating net primary productivity from grassland biomass dynamics measurements. Glob. Chang. Biol. 2002, 8, 736–753. [Google Scholar] [CrossRef] [Green Version]
- Field, C.B.; Behrenfeld, M.J.; Randerson, J.T.; Falkowski, P. Primary production of the biosphere: Integrating terrestrial and oceanic components. Science 1998, 281, 237–240. [Google Scholar] [CrossRef] [PubMed]
- Fang, J.Y.; Chen, A.P.; Peng, C.H.; Zhao, S.Q.; Ci, L. Changes in forest biomass carbon storage in China between 1949 and 1998. Science 2001, 292, 2320–2322. [Google Scholar] [CrossRef] [PubMed]
- Ni, J. Net primary productivity in forests of China: Scaling-up of national inventory data and comparison with model predictions. For. Ecol. Manag. 2003, 176, 485–495. [Google Scholar] [CrossRef]
- Fang, J.Y.; Guo, Z.D.; Piao, S.L.; Chen, A.P. Terrestrial vegetation carbon sinks in China, 1981–2000. Sci. China Ser. D 2007, 50, 1341–1350. [Google Scholar] [CrossRef]
- Peng, S.L.; Zhao, P.; Ren, H.; Zheng, F.Y. The possible heat-driven pattern variation of zonal vegetation and agricultural ecosystem, along the north-south of China under the global change. Earth. Sci. Front. 2002, 9, 218–226. [Google Scholar]
- Hobbie, S.E. Plant species effects on nutrient cycling: Revisiting litter feed backs. Trends Ecol. Evol. 2015, 30, 357–363. [Google Scholar] [CrossRef] [PubMed]
- Woodward, F.I.; Lomas, M.R.; Kelly, C.K. Global climate and the distribution of plant biomes. Philos. Trans. Soc. B 2004, 359, 1465–1476. [Google Scholar] [CrossRef] [PubMed] [Green Version]
- Luo, T.X. Patterns of Biological Production and Its Mathematical Models for Main Forest Types of China; Committee of Synthesis Investigation of Natural Resources, Chinese Academy of Sciences: Beijing, China, 1996. [Google Scholar]
- Pan, Y.D.; Luo, T.X.; Birdsey, R.; Hom, J.; Melillo, J. New estimates of carbon storage and sequestration in China’s forests: Effects of age-class and method on inventory-based carbon estimation. Clim. Chang. 2004, 67, 211–236. [Google Scholar] [CrossRef]
- Keith, H.; Mackey, B.G.; Lindenmayer, D.B. Re-evaluation of forest biomass carbon stocks and lessons from the world’s most carbon-dense forests. Proc. Natl. Acad. Sci. USA 2009, 106, 11635–11640. [Google Scholar] [CrossRef] [PubMed]
- Tao, B.; Cao, M.K.; Li, K.R.; Gu, F.X.; Ji, J.J.; Huang, M.; Zhang, L.M. Spatial patterns of terrestrial net ecosystem productivity in China during 1981–2000. Sci. China Ser. D 2007, 50, 745–753. [Google Scholar] [CrossRef]
- Heikkinen, R.K.; Luoto, M.; Kuussaari, M.; Poyry, J. New insights into butterfly-environment relationships using partitioning methods. Proc. Biol. Sci. 2005, 272, 2203–2210. [Google Scholar] [CrossRef] [PubMed]
- Gower, S.T.; Krankina, O.; Olson, R.J.; Apps, M.; Linder, S.; Wang, C. Net primary production and carbon allocation patterns of boreal forest ecosystems. Ecol. Appl. 2001, 11, 1395–1411. [Google Scholar] [CrossRef]
- Scarascia Mugnozza, G.A.B.; Persoon, H.G.; Matteucci, A. Carbon and Nitrogen Cycling in European Forest Ecosystems. In Tree Biomass, Growth and Nutrient Pools; Schulze, E.D., Ed.; Springer: Berlin/Heidelberg, Germany, 2000; pp. 49–62. [Google Scholar]
- Raupach, M.R. Carbon cycle pinning down the land carbon sink. Nat. Clim. Chang. 2011, 1, 148–149. [Google Scholar] [CrossRef]
- Hirata, R.; Saigusa, N.; Yamamoto, S.; Ohtani, Y.; Ide, R.; Asanuma, J.; Gamo, M.; Hirano, T.; Kondo, H.; Kosugi, Y.; et al. Spatial distribution of carbon balance in forest ecosystems across East Asia. Agric. For. Meteorol. 2008, 148, 761–775. [Google Scholar] [CrossRef]
- Saigusa, N.; Yamamoto, S.; Hirata, R.; Ohtani, Y.; Ide, R.; Asanuma, J.; Gamo, M.; Hirano, T.; Kondo, H.; Kosugi, Y.; et al. Temporal and spatial variations in the seasonal patterns of CO2 flux in boreal, temperate, and tropical forests in East Asia. Agric. For. Meteorol. 2008, 148, 700–713. [Google Scholar] [CrossRef]
- Chapin, F.S., III; Matson, P.A.; Mooney, H.A. Principles of Terrestrial Ecosystem Ecology; Springer: New York, NY, USA, 2002. [Google Scholar]
- Luyssaert, S.; Inglima, I.; Jung, M.; Richardson, A.D.; Reichstein, M.; Papale, D.; Piao, S.L.; Schulze, E.D.; Wingate, L.; Matteucci, G.; et al. CO2 balance of boreal, temperate, and tropical forests derived from a global database. Glob. Chang. Biol. 2007, 13, 2509–2537. [Google Scholar] [CrossRef]
- Kato, T.; Tang, Y.H. Spatial variability and major controlling factors of CO2 sink strength in Asian terrestrial ecosystems: Evidence from eddy covariance data. Glob. Chang. Biol. 2008, 14, 2333–2348. [Google Scholar] [CrossRef]
- Ni, J.; Zhang, X.S.; Scurlock, J.M.O. Synthesis and analysis of biomass and net primary productivity in Chinese forests. Ann. For. Sci. 2001, 58, 351–384. [Google Scholar] [CrossRef] [Green Version]
- Matson, P.; Lohse, K.A.; Hall, S.J. The globalization of nitrogen deposition: Consequences for terrestrial ecosystems. Ambio 2002, 31, 113–119. [Google Scholar] [CrossRef] [PubMed]
- LeBauer, D.S.; Treseder, K.K. Nitrogen limitation of net primary productivity in terrestrial ecosystems is globally distributed. Ecology 2008, 89, 371–379. [Google Scholar] [CrossRef] [PubMed]
- Finzi, A.C.; Norby, R.J.; Calfapietra, C.; Gallet-Budynek, A.; Gielen, B.; Holmes, W.E.; Hoosbeek, M.R.; Iversen, C.M.; Jackson, R.B.; Kubiske, M.E.; et al. Increases in nitrogen uptake rather than nitrogen-use efficiency support higher rates of temperate forest productivity under elevated CO2. Proc. Natl. Acad. Sci. USA 2007, 104, 14014–14019. [Google Scholar] [CrossRef] [PubMed]
- Cleveland, C.C.; Townsend, A.R.; Taylor, P.; Alvarez-Clare, S.; Bustamante, M.M.C.; Chuyong, G.; Dobrowski, S.Z.; Grierson, P.; Harms, K.E.; Houlton, B.Z.; et al. Relationships among net primary productivity, nutrients and climate in tropical rain forest: A pan-tropical analysis. Ecol. Lett. 2011, 14, 939–947. [Google Scholar] [CrossRef] [PubMed]
- Yuan, Z.Y.; Li, L.H.; Han, X.G.; Chen, S.P.; Wang, Z.W.; Chen, Q.S.; Wang, Z.W.; Chen, Q.S.; Bai, Y.F. Nitrogen response efficiency increased monotonically with decreasing soil resource availability: A case study from a semiarid grassland in northern China. Oecologia 2006, 148, 564–572. [Google Scholar] [CrossRef] [PubMed]
- Litton, C.M.; Ryan, M.G.; Knight, D.H. Effects of tree density and stand age on carbon allocation patterns in postfire lodgepole pine. Ecol. Appl. 2004, 14, 460–475. [Google Scholar] [CrossRef]
- Wang, S.Q.; Zhou, L.; Chen, J.M.; Ju, W.M.; Feng, X.F.; Wu, W.X. Relationships between net primary productivity and stand age for several forest types and their influence on China’s carbon balance. J. Environ. Manag. 2011, 92, 1651–1662. [Google Scholar] [CrossRef] [PubMed] [Green Version]
- Stevens, C.J.; Lind, E.M.; Hautier, Y.; Harpole, W.S.; Borer, E.T.; Hobbie, S.E.; Seabloom, E.W.; Ladwig, L.M.; Bakker, J.D.; Chu, C.; et al. Anthropogenic nitrogen deposition predicts local grassland primary production worldwide. Ecology 2015, 96, 1459–1465. [Google Scholar] [CrossRef] [Green Version]
Figure 1.
Locations of research plots in this synthesis in eastern China (black dots). The region between the two lines represents the area of the North–South Transect of Eastern China (NSTEC).
Figure 1.
Locations of research plots in this synthesis in eastern China (black dots). The region between the two lines represents the area of the North–South Transect of Eastern China (NSTEC).

Figure 2.
Trends of net primary productivity (NPP) along latitude for forest ecosystems in eastern China. N, number of observations; F, F Values.
Figure 2.
Trends of net primary productivity (NPP) along latitude for forest ecosystems in eastern China. N, number of observations; F, F Values.

Figure 3.
Relationships between net primary productivity (NPP) and mean annual temperature (MAT), mean annual precipitation (MAP), and combinations of MAT and MAP. N, number of observations; F, F Values.
Figure 3.
Relationships between net primary productivity (NPP) and mean annual temperature (MAT), mean annual precipitation (MAP), and combinations of MAT and MAP. N, number of observations; F, F Values.

Figure 4.
Relationships between net primary productivity (NPP) and soil N content (Nsoil), annual litter N (Nre), and combinations of Nsoil and Nre. N, number of observations; F, F Values.
Figure 4.
Relationships between net primary productivity (NPP) and soil N content (Nsoil), annual litter N (Nre), and combinations of Nsoil and Nre. N, number of observations; F, F Values.

Figure 5.
Summary of the partial general linear model (partial GLM) for the effects of mean annual temperature (MAT), mean annual precipitation (MAP), and annual litter N (Nre) on net primary productivity (NPP). In the partial GLM, a, b, and c denoted the independent effects of MAT, MAP and Nre, respectively; ab, ac, and bc indicated respectively the interactive effects between MAT and MAP, MAT, and Nre, MAP and Nre; and abc represented the interactive effects of the three different factors.

Table 1.
Comparisons of net primary productivity (NPP) of forest ecosystems in different climate zones. Tropical zone: <23.0° N; Subtropical zone: 23.0–33.0° N; Temperate zone: 33.0–45.0° N; and Boreal zone: >45.0° N. Number of observations (N), mean value (Mean), maximum value (Max), minimum value (Min), standard error (SE), and coefficient of variation (CV) were reported. Differences among climate zones were tested using one-way ANOVA with Fisher’s LSD comparisons; differences at p < 0.05 were indicated with different letters.
| Climate Zone | N | NPP (t ha−1 a−1) | ||||
|---|---|---|---|---|---|---|
| Mean | Max | Min | SE | CV (%) | ||
| Boreal | 4 | 12.1 ab | 24.6 | 1.9 | 4.7 | 78.4 |
| Temperate | 28 | 5.5 c | 14.1 | 0.8 | 0.8 | 73.2 |
| Subtropical | 42 | 10.1 b | 29.6 | 1.2 | 0.9 | 54.7 |
| Tropical | 13 | 15.3 a | 24.2 | 8.6 | 1.3 | 31.6 |
| Overall | 87 | 9.5 | 29.6 | 0.8 | 0.7 | 64.0 |
Table 2.
Bivariate and multivariate regression models of net primary productivity (NPP) on climatic factors and soil N. MAP, mean annual precipitation; MAT, mean annual temperature; Nsoil, soil N content; Nre, annual litter N; N, number of observations; F, F Values; RMSE, root mean square error.
Table 2.
Bivariate and multivariate regression models of net primary productivity (NPP) on climatic factors and soil N. MAP, mean annual precipitation; MAT, mean annual temperature; Nsoil, soil N content; Nre, annual litter N; N, number of observations; F, F Values; RMSE, root mean square error.
| Variables | Model Type | N | R2 | F | RMSE | p |
|---|---|---|---|---|---|---|
| MAT | linear | 87 | 0.166 | 16.9 | 5.6 | <0.001 |
| exponential | 87 | 0.202 | 22.0 | 5.6 | <0.001 | |
| MAP | linear | 87 | 0.218 | 21.5 | 5.4 | <0.001 |
| exponential | 87 | 0.237 | 23.2 | 5.3 | <0.001 | |
| MAT+MAP | linear | 87 | 0.243 | 23.8 | 4.2 | <0.001 |
| Nsoil | linear | 42 | 0.106 | 4.7 | 7.0 | <0.05 |
| exponential | 42 | 0.148 | 4.5 | 6.7 | <0.05 | |
| Nre | linear | 86 | 0.284 | 30.1 | 3.4 | <0.001 |
| Nsoil + Nre | linear | 42 | 0.382 | 32.7 | 2.2 | <0.001 |
| MAT + MAP + Nsoil + Nre | linear | 42 | 0.543 | 10.6 | 1.6 | <0.001 |
Table 3.
Correlation matrix of independent variables. MAT, mean annual temperature; MAP, mean annual precipitation; Nsoil, soil N content; Nre, annual litter N; **, p < 0.01.
Table 3.
Correlation matrix of independent variables. MAT, mean annual temperature; MAP, mean annual precipitation; Nsoil, soil N content; Nre, annual litter N; **, p < 0.01.
| Variables | Data Range | MAT | MAP | Nsoil |
|---|---|---|---|---|
| MAT (°C) | 0–23.5 | 1 | ||
| MAP (mm) | 500.0–2000.0 | 0.670 ** | ||
| Nsoil (kg ha−1) | 115.6–163.5 | 0.213 | 0.365 | |
| Nre (kg ha−1 a−1) | 1.9–172.2 | 0.288 ** | 0.242 ** | 0.161 |
© 2018 by the authors. Licensee MDPI, Basel, Switzerland. This article is an open access article distributed under the terms and conditions of the Creative Commons Attribution (CC BY) license (http://creativecommons.org/licenses/by/4.0/).
Share and Cite
MDPI and ACS Style
Xiaoyun, Z.; Minghang, G.; Tibin, Z. Joint Control of Net Primary Productivity by Climate and Soil Nitrogen in the Forests of Eastern China. Forests 2018, 9, 322. https://doi.org/10.3390/f9060322
AMA Style
Xiaoyun Z, Minghang G, Tibin Z. Joint Control of Net Primary Productivity by Climate and Soil Nitrogen in the Forests of Eastern China. Forests. 2018; 9(6):322. https://doi.org/10.3390/f9060322
Chicago/Turabian StyleXiaoyun, Zhan, Guo Minghang, and Zhang Tibin. 2018. "Joint Control of Net Primary Productivity by Climate and Soil Nitrogen in the Forests of Eastern China" Forests 9, no. 6: 322. https://doi.org/10.3390/f9060322
Note that from the first issue of 2016, this journal uses article numbers instead of page numbers. See further details here.