Dynamic Patterns of Trees Species in Miombo Forest and Management Perspectives for Sustainable Production—Case Study in Huambo Province, Angola


Faculty of Forestry and Wood Sciences, Department of Forest Management, Czech University of Life Sciences Prague, 165 00 Praha 6–Suchdol, Czech Republic
*
Author to whom correspondence should be addressed.
Forests 2018, 9(6), 321; https://doi.org/10.3390/f9060321
Submission received: 7 April 2018
/
Revised: 22 May 2018
/
Accepted: 30 May 2018
/
Published: 4 June 2018
(This article belongs to the Special Issue Forest Structural Dynamics in the 21st Century)
Abstract
:This paper aims to assess important forest parameters, including tree density, diameter at breast height (DBH), and age distribution, investigate the dynamic growth of miombo tree species, and employ this information to design a management framework in miombo forests. The delineation of the management zones was based on unsupervised land cover classification that began with three zones where ground data was collected and increased to five zones. Eighteen circular plots (25.2 m radius) were randomly distributed over the study areas to assess the current situation and potential growth patterns for each species. The patterns of the six most representative tree species of miombo in Angola were described and we used KORFiT 2.4 software to fit data and develop growth curves for at least three miombo species. Growth function fitness was evaluated by root mean squared error (RMSE), coefficient of determination (R2), significance of the parameters (p < 0.05), and Akaike’s information criterion (AIC). The diameter distribution of miombo tree species resembled a typical distribution of uneven-aged forest stands; higher DBH classes had lower abundances of tree species. Logistic and Gompertz growth functions were the best fits for miombo tree species. Brachystegia spiciformis Benth., is suggested as a potential species for timber management in the region because they displayed high growth potential to more quickly reach an assumed minimum DBH of 20 cm. This study concluded that miombo forest stands present an irregular structure in which DBH distribution illustrated only two patterns: many small stems and a bimodal forest structure.
1. Introduction
In Africa, concerns regarding forest management have led to widespread information regarding the negative aspects of forest cover by degradation and deforestation [1,2,3]. Although abundant information regarding certain aspects of African forests is available, including forest cover change [4,5,6,7,8], forest gains, and forest management guidelines, there is little information available on forest stand structures and dynamics. There is a need to strengthen and integrate national institutions to increase the capacity for countries in Africa to enforce forest laws and control the drivers of deforestation and forest degradation. The Collaborative Partnership on Forests (CPF) addresses the gap concerning the knowledge of forests in Africa [9,10]. Many programs and projects, such as ‘’Reducing Emission from Deforestation and Forest Degradation in developing countries (REDD+), aim to reduce the impact on climate change, conserve biodiversity, and protect ecosystems services by reducing carbon emissions [11,12]. Furthermore, the Food and Agriculture Organization (FAO) is dedicated to assisting developing countries with developing national forest monitoring systems and providing relieve forest resource information for national forest policy development, planning, and sustainable management [13].
In natural forests, the structure and dynamics of forests are the result of a large number of feedback loops and processes caused by disturbance regimes across time and space [14]. However, forest structure and dynamics may also be a result of the interactions among species, environmental factors, and human intervention over long periods. The most common representation of forest dynamics is a spatial distribution of the diameter class structure of trees [15,16,17,18] combined with tree-ring analyses for studies of growth dynamics [19,20,21,22].
Studies addressing miombo woodland management in Africa have targeted difficult issues, including charcoal production and deforestation rates. For example, in Angola, REDD+ initiative project activities include the formulation and implementation of a community forest management plan, introduction of ameliorated kilns to produce charcoal, plantation of native species suitable for firewood and charcoal, agroforestry activities, promotion of agricultural activities, and improvement of bee-keeping activities [23,24]. Unfortunately, growth rates and dynamics of tree species used for charcoal production have received little attention [8,25,26,27,28,29,30,31,32]. Miombo forests have mostly been studied in Zambia [27,33,34], Malawi [35,36], Tanzania [25,37,38], and Mozambique [39,40,41,42].
Miombo woodlands are a significant biome that cover about 10% of the African landmass, and they cover between 2.7 and 3.6 million km2 in 11 African countries [43]. In Angola, miombo woodlands cover more than 45% of the nature forest intermixed with edaphic areas and grasslands [44,45]. They are tropical or near tropical ecosystems characterized by continuous herbaceous cover, which mostly consists of heliophilous C4 grasses and sedges that display clear seasonality related to water stress [46]. It has been somewhat problematic to define the term ‘miombo’. It has been difficult to characterize miombo land use under climate change, and the biome has been inadequately represented in regional and global modeling efforts and policy formation. A mature undisturbed miombo is physiognomically a closed deciduous forest within the spectrum of savannah ecosystems grading into a seasonal dry forest with a mean annual rainfall between 800 and 1400 mm; canopy heights are no more than 15 m. Local vernacular uses terms such as woodland, bushland, wooded grassland, and savanna. However, the use of the term savanna to describe miombo is discontinued because it has been defined in so many different ways that it is no longer possible to use it in a precise classificatory sense [47,48]. The term miombo originated from the Bantu language and it has been used by ecologists in Africa to refer those trees of the genus Brachystegia, including species such as Brachystegia floribunda, Brachystegia glaberrina, Brachystegia longifolia, Jubernardia paniculata, Isoberlian angolensis, and Marquesia macrouura [25,47,49,50].
Most of the miombo trees and shrubs flourish in the same period immediately after the rains. The increasing need for agricultural lands due to population increases, and the unsustainable use and overharvesting of natural resources, combined with the impacts of climate change (e.g., drought, fires), allows for insufficient time for many miombo trees and associated species to regenerate naturally. These stressors have produced areas classified as open and closed miombo areas [51]. This classification system first appeared with the use of aerial photographs dating from 1946, 1967, and 1981 to determine past vegetation patterns and disturbances [52,53]. The classification system has also been used in studies of past assessments of land use and cover change [8,43,54,55]. Semi-arid climate is the main edaphic determinant that leads to a division of dry miombo (located in an area of less than 1000 mm of annual rainfall) and wet miombo (located in areas with more than 1000 mm annual rainfall), which occur in the northern part of the miombo distribution, including eastern Angola, northern Zambia, southwestern Tanzania, and central Malawi [46,56,57]. Ecosystem services (ES) from miombo provide important contributions to the livelihoods of millions in the rural and urban populations, and they help alleviate the poverty in the region. Some of the miombo ES include the provision of fuelwood, building materials, and fruit for rural populations, in addition to charcoal, bush-meat, and medicines that rural and urban populations rely on. However, miombo offer little value for logging because of the low proportion of commercially valuable timber species. The management of miombo areas must address multiple objectives.
Current efforts to improve the management of miombo are misguided and based on poor information, and they serve to distract from science-based efforts to address challenges with the forests [47,58,59,60,61,62]. Challenges of miombo management include low inherent productivity, limited support to develop local forest enterprise, a lack of strong local organization, a legacy of armed conflict, and low resource rents associated with high management transaction costs.
In Angola, miombo forests were mainly assessed on the spatial dynamics of the central-plateau and species diversity [49,54,63,64,65,66]. The overextraction of wood resources, due to clearing for agricultural purposes, charcoal production, indiscriminate burning, and sometimes overgrazing, creates disorder that impacts the health of forests in Angola [54,65] . The land-use change in forests due to human activities has been demonstrated in miombo forests [6,54,64,67,68].
The Angolan civil war, which lasted for 27 years, made people understand the importance of forests because they were a means of survival in periods when people could not work on farms. It is very difficult to imagine life without forest resources. The importance of forest resources is known, but establishing the best forest management policies and practices takes a long time and the best data available. The forests were overexploited during the war and no management was conducted, and many small trees were harvested for charcoal and firewood [69]. The government established a minimum cutting tree diameter (MCD) of 20 cm at diameter at breast height (DBH), thus local peoples are only allowed to cut a tree that is at least 20 cm DBH. Government strategies of forest resources management have focused on prohibitions and restrictions. For instance, no records of certain harvesting techniques, delineation of mature and immature stands, and post-harvest sowing or planting of new trees are available to managers.
During and after the civil war (1975–2002), the acquisition of forest data in miombo forests was difficult due to the presence of landmines. More recently, remote sensing has allowed for the collection of some forest data throughout the country. However, data on tree growth patterns are almost nonexistent because Angola has still not completed the National Forestry Inventory. The country lacks forest laws and an appropriate legal management framework.
To obtain an overview of Angolan miombo forests and to help formulate forest policy and laws, it is imperative to describe the patterns of tree species distributions and dynamics in terms of tree growth. The primary objective of our study is to characterize forest structure, as expressed in terms of tree abundance by tree diameter classes. From that data, we described the patterns of six of the most representative tree species of miombo forests in Angola, and we predicted the minimum harvestable diameter using fitted models to support sustainable forest practices and management in miombo forests of Angola.
2. Materials and Methods
2.1. Description of the Study Area
Angola is located on the southwestern cost of Africa (1.24 million km2), and its climate ranges from tropical wet/humid in the north to extremely arid in the southwest. The global ecoregions map of the World Wildlife Fund recognizes 15 biogeographic units in Angola. In the Central Plateau, miombo forests are the most widespread biogeographic unit [70,71]; our study focused on Huambo province within the Central Plateau (Figure 1). The dominant soils are ferralsols at higher elevations and alluvial fluvisols at lower elevations. With an area of approximately 34,270 km2 and a population of approximately 1.9 million inhabitants, Huambo province is divided into 11 municipalities. It is 1700 m a.s.l. (above sea level) with a mean annual temperature of 20 °C and rainfall ranges from 1200 to 1600 mm per annum [63,72,73,74]. The climate is humid mesothermal with dry winters and warm summers. Most of the precipitation comes during the warmer summer months (between October and April), with heavy precipitation in December and again in March. Six of Angola’s major rivers originate in Huambo, many of which drain into the Atlantic ocean.
The vegetation in Huambo province consists largely of four types; highland forests (Afromontane forests), miombo woodlands, swamps, and dry grasslands [75,76,77,78] The landscape is mainly comprised of miombo and savanna woodlands intercepted by grasslands in lower drained areas. The trees are broad-leaved and deciduous and dominated by the genera Brachystegia, Julbernadia, and Isoberlinia [49,54,66]. In savannas, the dominant grasses are Hyparrehenia spp. and Androgon spp. The trees tend to have similar heights of between 5 to 10 m. In the relicts of Afromontane forests patches (Afromontane archipelago), the most abundant trees species are Podocarpus milanjjianus, Polyscias fulva, Apodytes dimidiate, and Syzygium guineense [49]. Huambo province was selected as our study site for three primary reasons: (i) secure access to the forests; (ii) central miombo is somewhat peculiar because it has some similar features to Afromontane areas with similar tree species [57,72]; and (iii) the combination of high population pressure on miombo forests and the lack of protected and conservation areas in the forest fragments.
2.2. Data Collection
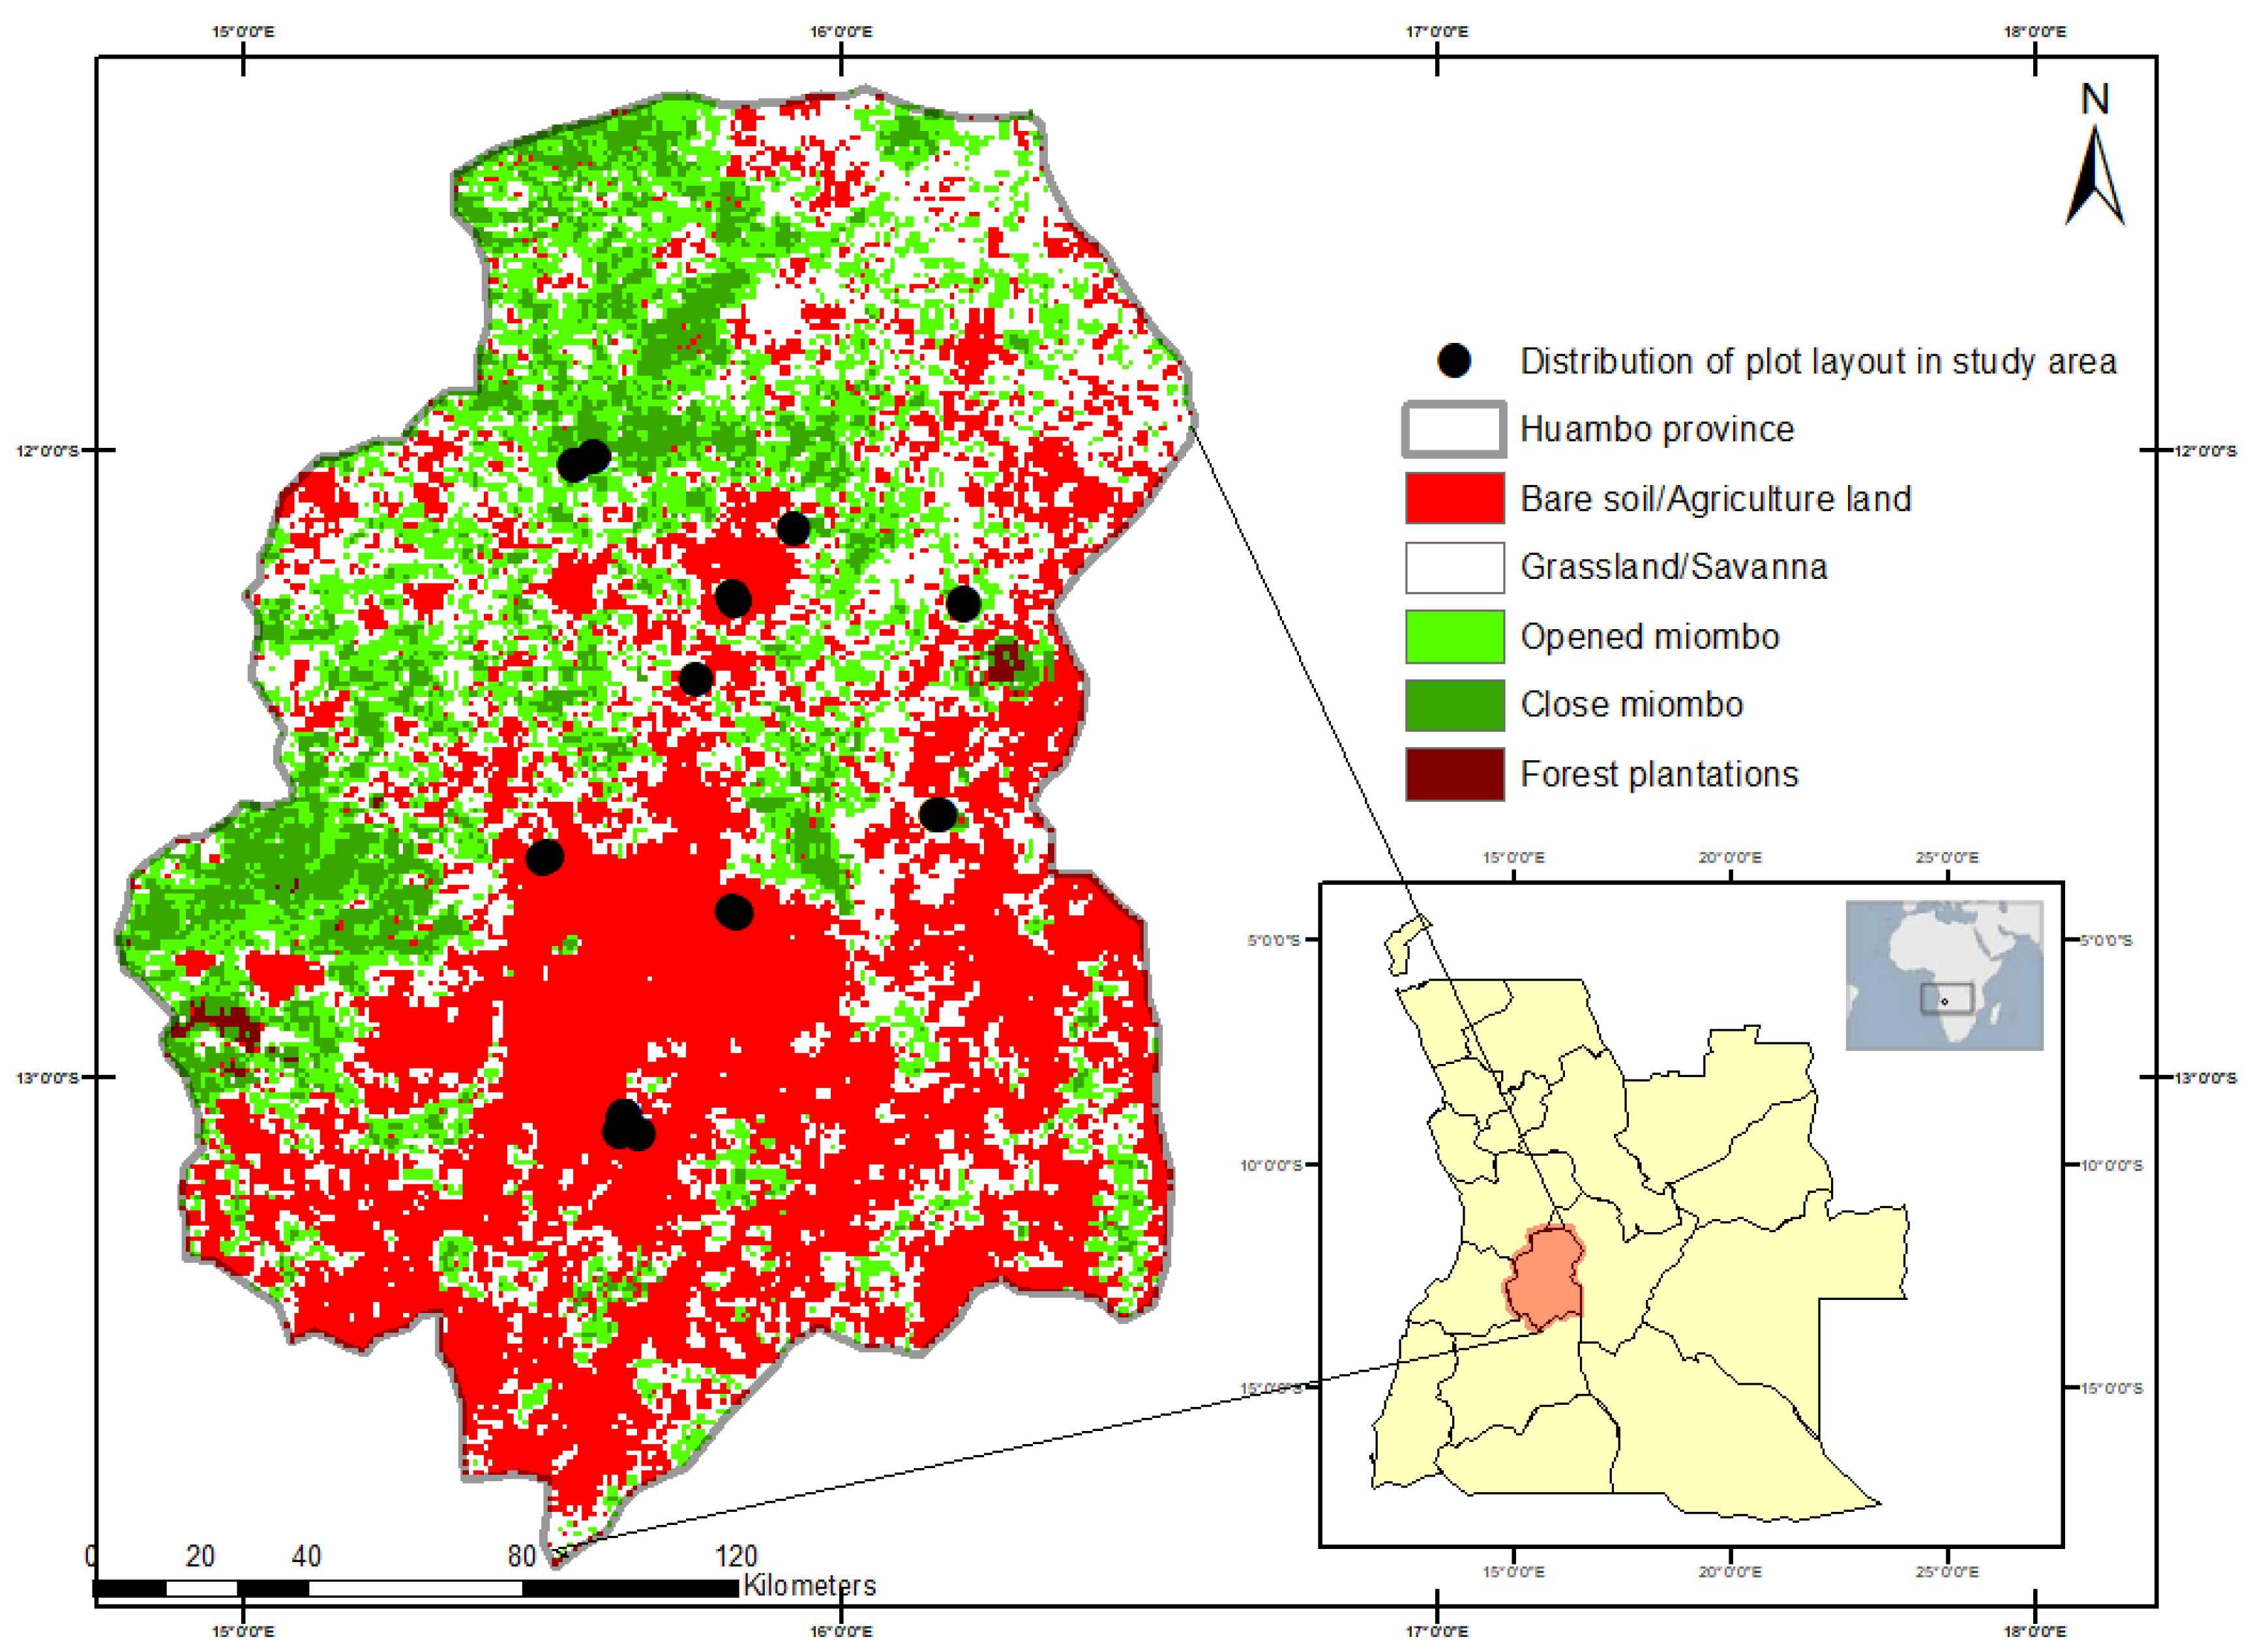
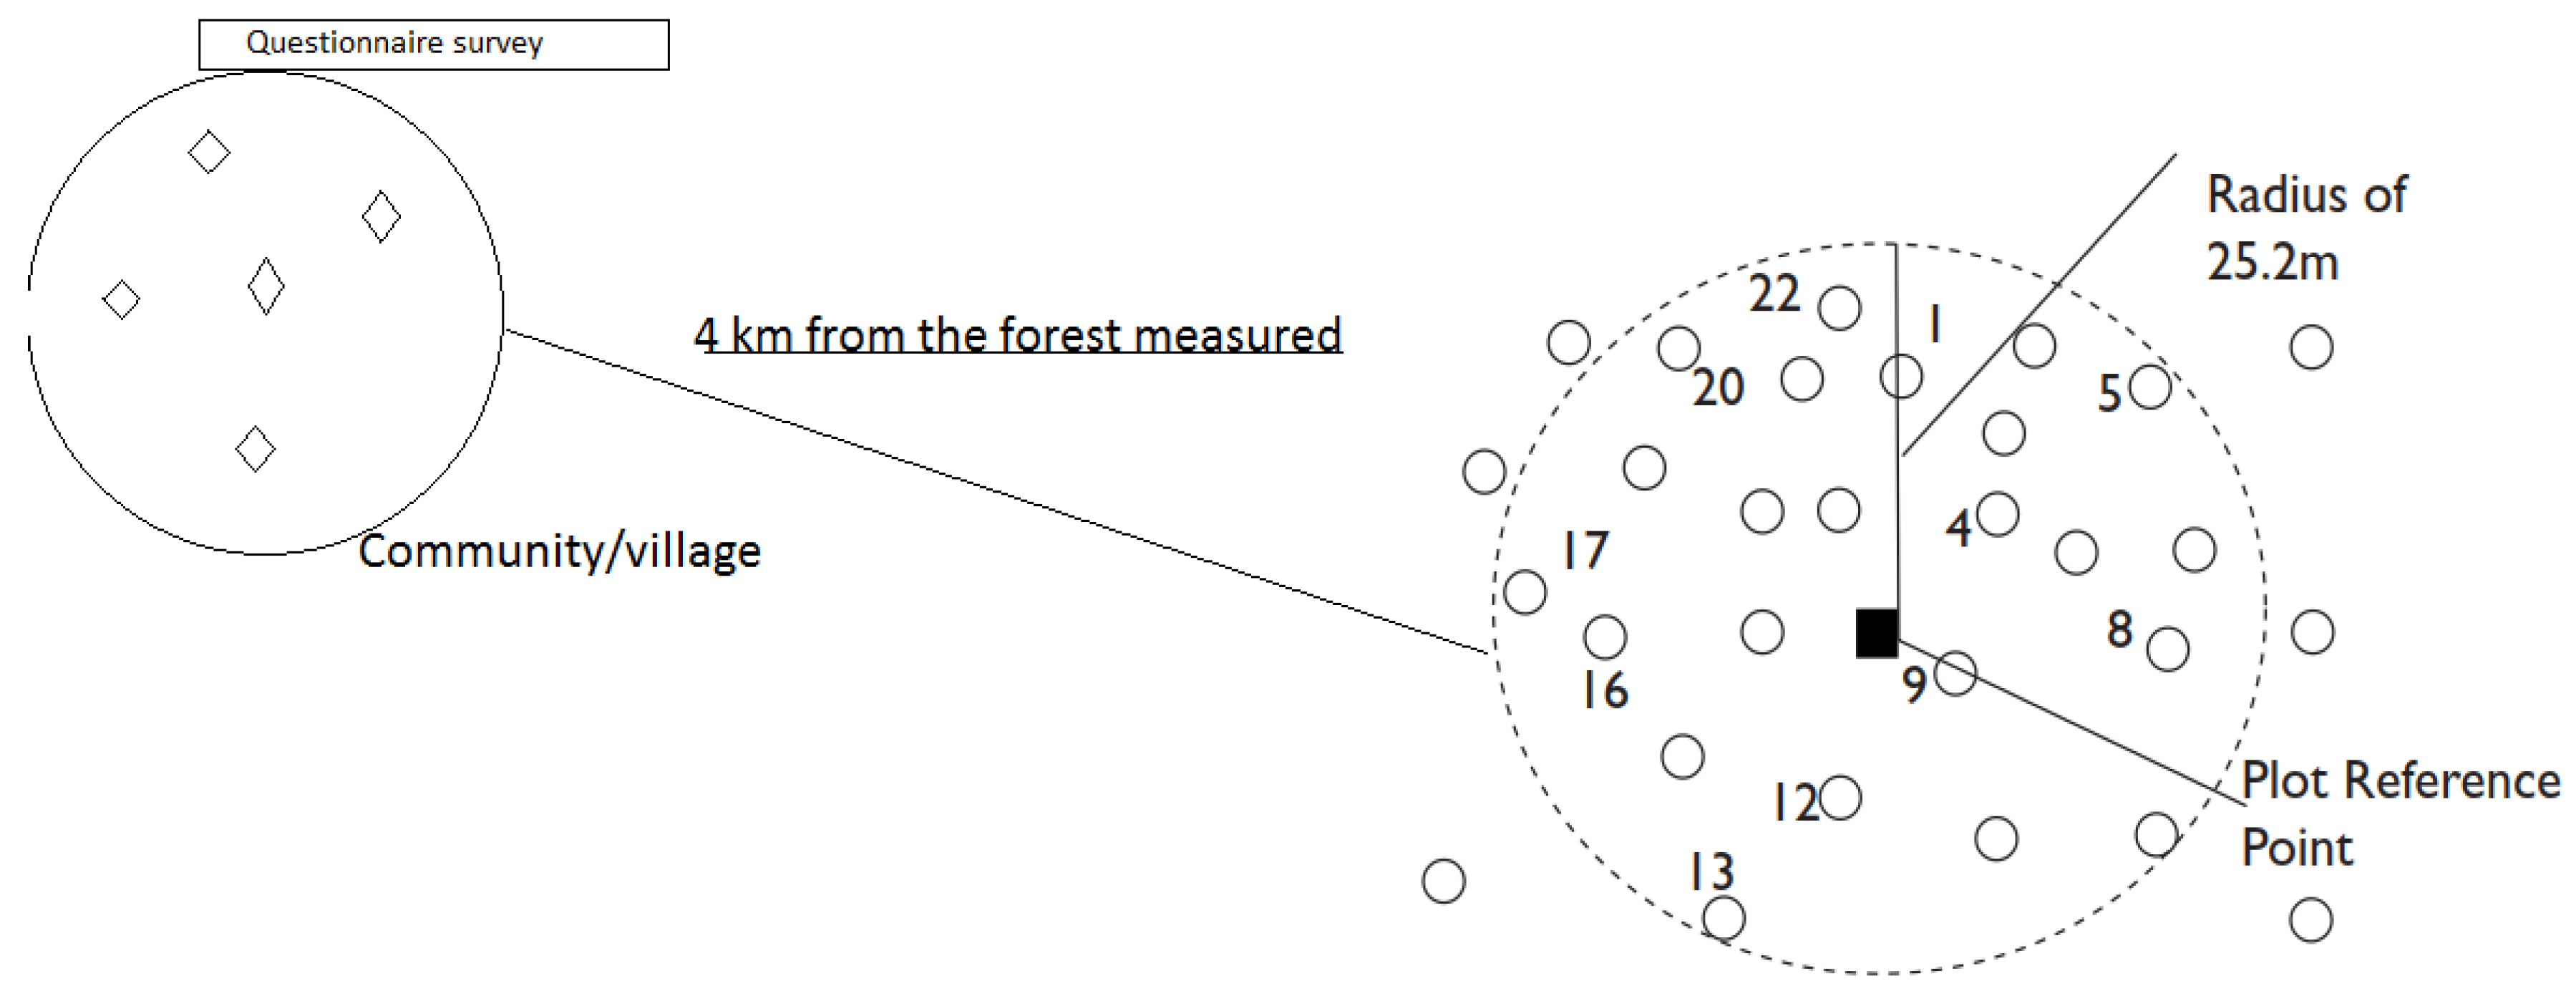
We used satellite images of land cover to delineate the potential forest area for sampling. When possible study sites were identified from the images, we conducted field surveys at the sites to ensure they were suitable for plot establishment. During the field surveys, we collected ground control points, such as road intersections, rivers, lakes, and villages, which we used to help classify land-cover based on the satellite images. The field survey required that we obtain permission from the government and traditional authorities to access the forests and survey the populations within a 4 km radius of the established plots. A total of 18 circular plots (25.2 m radius) were distributed across the following municipalities of Huambo province: Bailundo (12°11′45′′ S 15°51′20′′ E; 7 plots), Katchiungo (12°34′ S 16°14′ E; 2 plots), Caála (12°51′09′′ S 15°33′38′′ E; 2 plots), Cuima (13°14′25′′ S, 15°38′30′′ E; 3 plots), Ekunha (12°20′0′′ S, 15°30′0′′ E; 2 plots), and Huambo (12°45′52.84′′ S, 15°44′6.52′′ E; 2 plots). We established eight plots in open miombo, four plots in closed miombo, and four plots in savannah/grassland. The plots were randomly selected among the classified land cover types (Figure 1) and, within each type, at least 2% of the total forest area was selected for sampling [79,80,81]. At each plot, we measured the DBH, height (measured with Vertex), and age of individual trees, and we tallied the number of regenerating individuals (trees with DBH <20 cm in closed miombo stands and DBH >5 cm in others; Figure 2).
2.2.1. Tree Core-Collection
Prior to coring, we determined the coverage of the three most prominent species growing under similar ecological and environmental conditions; the species included Albizia antunesiana, Brachystegia boehmii, and Brachystegia spiciformis. Species selection was based on the abundance of the applicable species in the forests sampled, dominance of old trees of the same species, and past assessments of those species in the region [49,71]. Cores were extracted at a height of 1.3 m on the trees, and we extracted 50 cores of the selected tree species. At each plot, we selected at least four dominant canopy trees for coring.
2.2.2. Questionnaire Survey
Within a 4 km distance of each plot, we interviewed members of the local populations, specifically in the municipalities of Bailundo (four villages), Caála (two villages), Huambo (one village), and Ekunha (one village); Katchiungo (one village) and Cuima municipalities were not sampled. The short survey (<10 min) was designed to understand how they prioritize what products they collect from the forests (Figure 2).
The survey evaluated the major components of households, such as agricultural and agroforestry activities, livestock, and income assessment, in addition to forest ownership and forest and non- timber products that populations collect from forest. The survey was comprised of 23 open questions and questions and responses were written in Portuguese. The target group was primarily the village chiefs (n = 9) and villagers who own forest. Information about forest ownerships were obtained from the chiefs of the villages surveyed. About 41 forest holders of different villages were contacted.
2.2.3. Satellite Data Collection
The primary source for land-cover classification was Landsat-8 TM images acquired on 13 October 2017 from the USGS website [82]. We collected the images using the Worldwide Reference System (WRS)—defined nominal Landsat satellite track (path and row). The nearest WRS Path and Row to the Line-Of-Sight is the scenes center. This is used primarily for scenes with off-nadir look angles. The center of scene for off-nadir imaging may be several paths and the row left or right of the orbital path or row and the center may even be off the WRS-2 grid when near the poles. This is an estimated value, for reference. The details of the images are available in Table 1. It is recommended for use with Landsat resolution data where thematic maps in raster format can be converted into vector format to generate maps for variable rate application [83,84,85]. The satellite imagery used has a resolution of about 15 m per pixel. This base imagery was 30 m multispectral Landsat, which was pansharpened with the 15 m [panchromatic] Landsat imagery with a geometric RMSE of 7.6 m.
2.3. Data Processing and Analyses
For the data analyses, IBM SPSS Statistics 24 and MS Excel 2016 were used to determine the distribution within diameter classes (divided into intervals of 10 cm), and to calculate the forest parameters, including stem density (trees·ha−1), volume (V·ha−1), and species basal area (BA; m2·ha−1). Tree volume was determined using Equation (1) with a form factor (F) of 0.74, which is frequently used for tree species in miombo forests [86,87,88].
where ‘N’ is the stem density per ha, ‘I’ is the number of trees per ha, ‘A’ is the plot area (m2), and ‘n’ is the number of plots.
V (m3·ha-1) = F × BA × H, where H is the tree height
BA = II × DBH2/4, where ‘BA’ is the tree basal area (m2)
BAtotal = ∑ (BA/A × n)
BA (m2·ha−1) = basal area per hectare
N = ∑ (I/A × n),
N = ∑ (I/A × n),
Due to the focus and scope of the respondents, the questionnaire data was only suitable for qualitative analysis of individual cases. We focused on responses related to the products collected from the forest and the relationship between ages of respondents and forest ownership. Exploratory analysis of the qualitative data was conducted to the assess the primary species used for charcoal production.
The parameters for the fitted models were automatically generated by KORFiT version 2.4, freely available software for fitting experimental data with biological growth curves [89]. We tested twelve growth models in KORFiT and chose the best-fit models to describe the growth patterns of the tree species. For descriptive statistics of individual tree species, the mean, standard deviation, and coefficient of variation were used. The best model was identified based on the following four parameters: R2, RMSE, p-value, and minimum AIC.
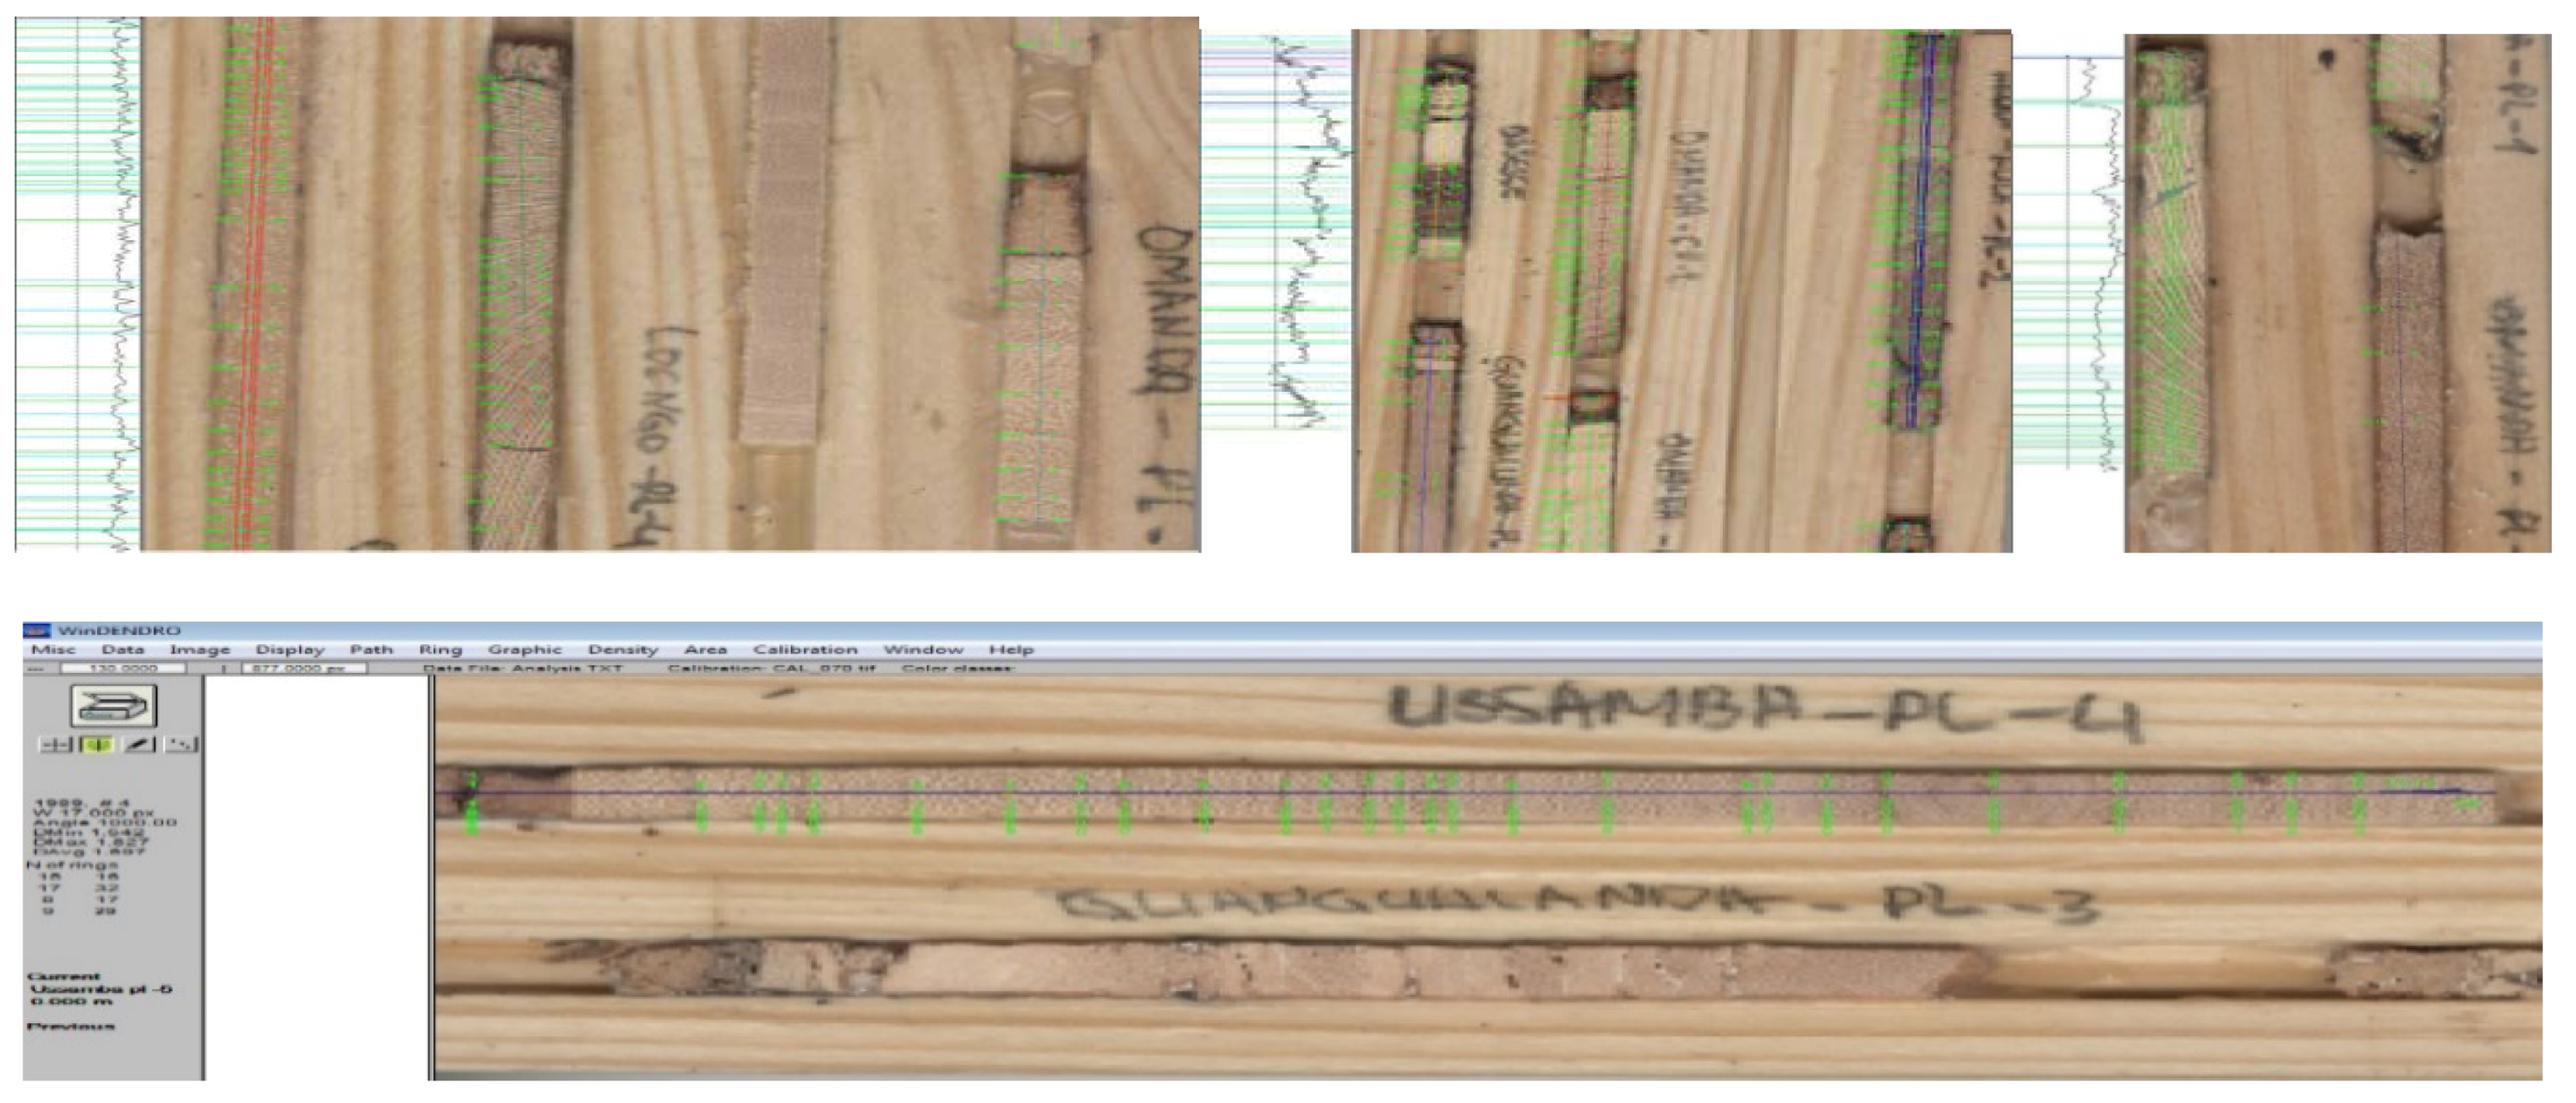
The collected cores were glued to wooden mounts and polished with fine sand paper. We scanned the mounted cores (Epson Expression 10000 TWIN) and analyzed the images with WinDENDRO TM (VERSION 2012B). We manually identified all tree rings in the images in WinDENDRO TM (Appendix C). Cores that were suspected of having false rings were omitted from further analyses.
Delineation of Management Zones
Information on forest zoning does not currently exist. Determining the distribution of land cover types and changes allowed for an assessment of forest and non-forested zones by conducting a comprehensive land cover analysis to identify possible threats to forest conservation efforts. In this study, we stratified land cover to identify the management zones. Each zone represented a land use class projected onto updated orthophoto raster maps for visual interpretation using ArcGIS 10.5 (Esri, Redlands, CA, USA). This classification approach eliminated misclassification error and made the delineation of categories more robust [82,90]. The delineation of management zones was based on an unsupervised land cover classification method, the ISODATA (Iterative Self-Organizing Data Analysis Technique) algorithm, which assigned five zones (Figure 1). The ISODATA method is commonly used for satellite image classification based on spectral reflectance from multiple bands [83,84,91]. The ISODATA classification algorithm is a technique in which the analysis allows the algorithm to commence by large numbers of interactions to generate significant results. The number of classes, k, is assumed to be known in advance. The result is a set of labeled pixels that range from 1 to k values, where k stands for the total number of classes assigned by the classification algorithm [85,92]; we used the default algorithm to delineate classification zones.
3. Results
3.1. Questionnaire Survey Results
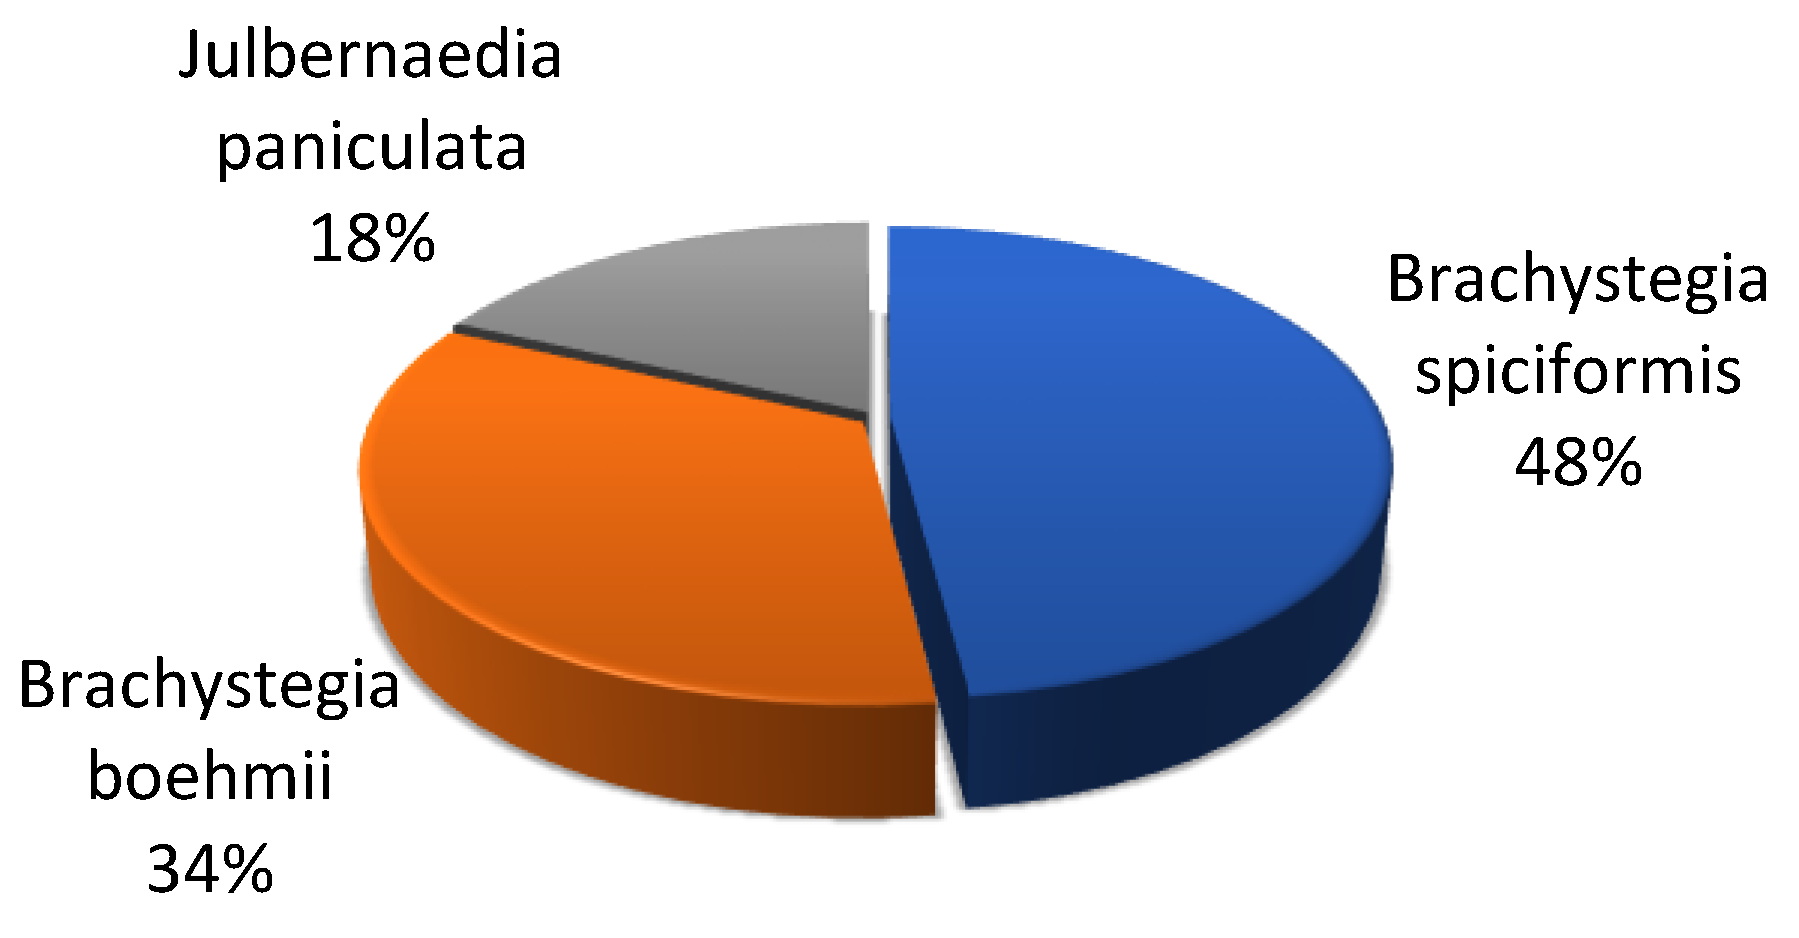
We collected 58 survey responses, and respondents had an average age of 42 (Table 2). The number of villages surveyed was nine and the details of the plots are in Appendix D (Table A1). Moreover, the position of the chief village was always occupied by the older elders of the villages, but not necessarily the oldest. Respondents were famers and charcoal producers who own forests in the villages (except the chiefs). The main agricultural products cultivated were maize, bean, potatoes, and vegetables. The forests belonged to the villager families and were passed down through generations by inheritance. Charcoal was produced primarily for income generation (68.7%) and domestic energy (i.e., heating, cooking mills, ironing, grilling). According to respondents, the preferred tree species used for charcoal production was B. spicioformis (48%), followed by B. Boehmii (34%) and J. paniculata (18%), respectively, and they were mainly found in closed miombo forests (Figure 3).
3.2. Stand Characteristics
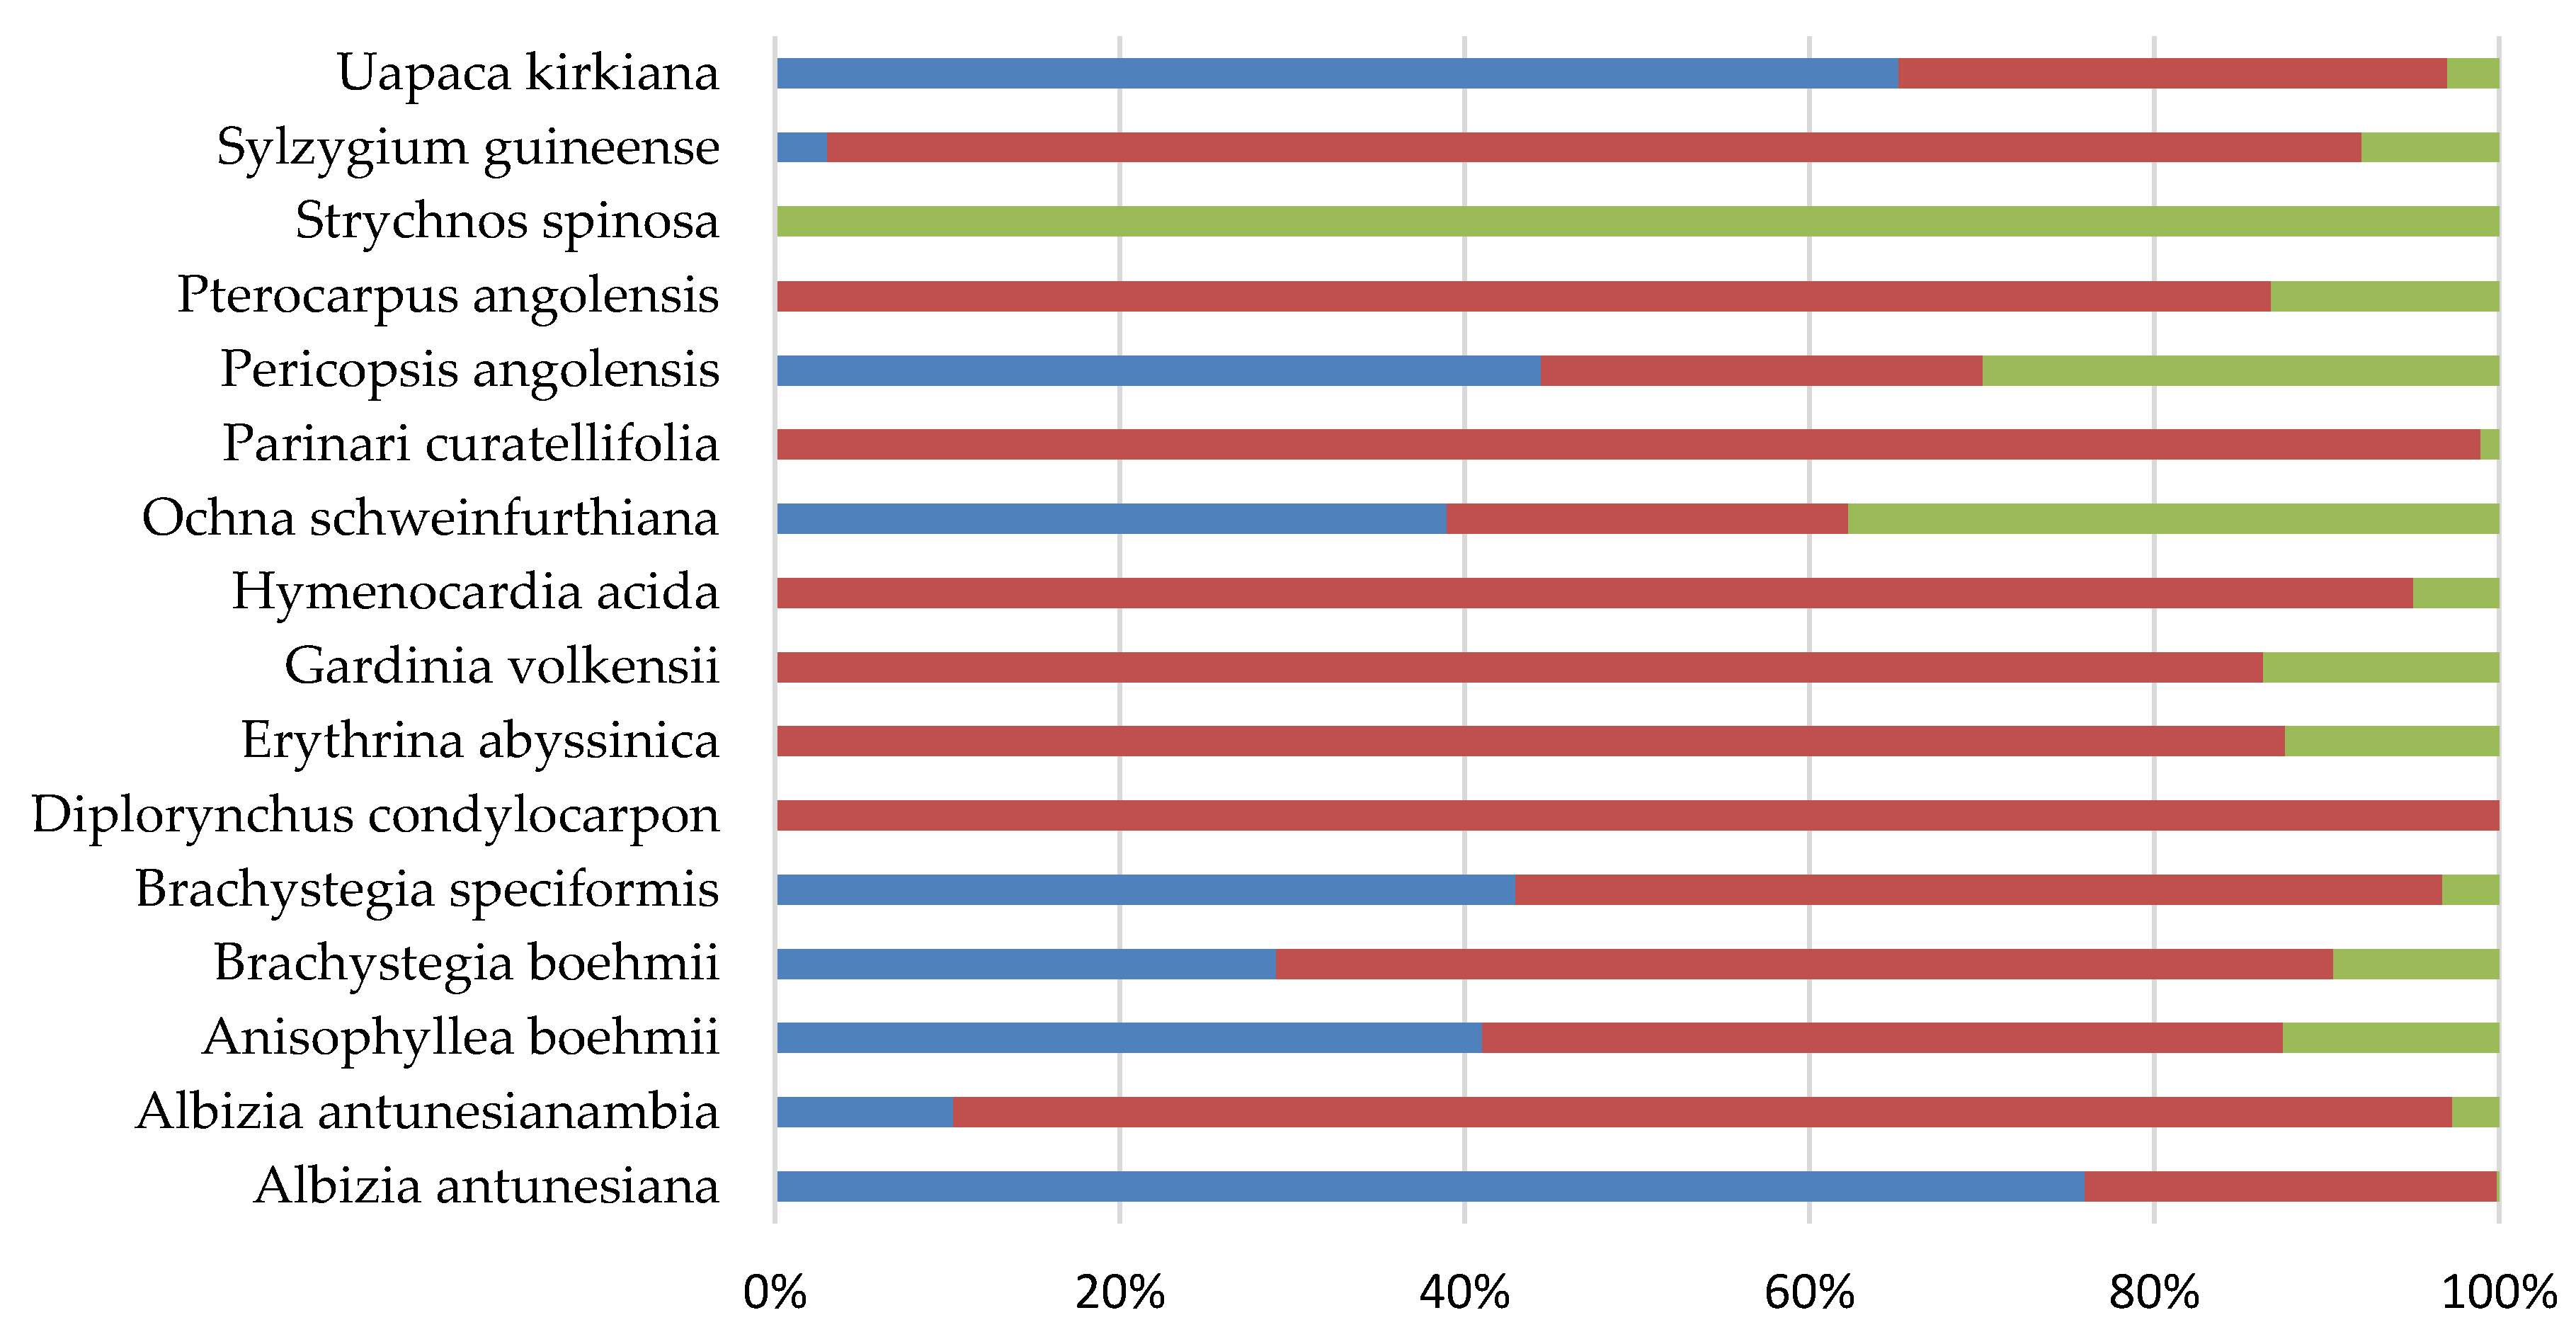
Tree species abundances in the three forest zones are presented in Figure 4, and the frequencies by DBH classes of these same species are presented in Figure 5. About 16 different tree species were recorded and distributed according their availability in the land cover zones. Open miombo had a higher diversity of tree species. We sampled 536 trees in open miombo, 248 trees in closed miombo, and 206 trees in grassland/savanna. On average, tree species height in all three forested zones was about 5 m (maximum height of 17 m) with an average DBH of 30 cm (SD = 15.7 cm); plots sampled had a basal area of 0.87 m2·ha−1 and a mean volume of 0.5 m3·ha (Table 3). We tallied 73 stems·ha−1 of B. spiciformis in open miombo and 82 stems·ha−1 in closed miombo, and it was the most dominant species in the study area.
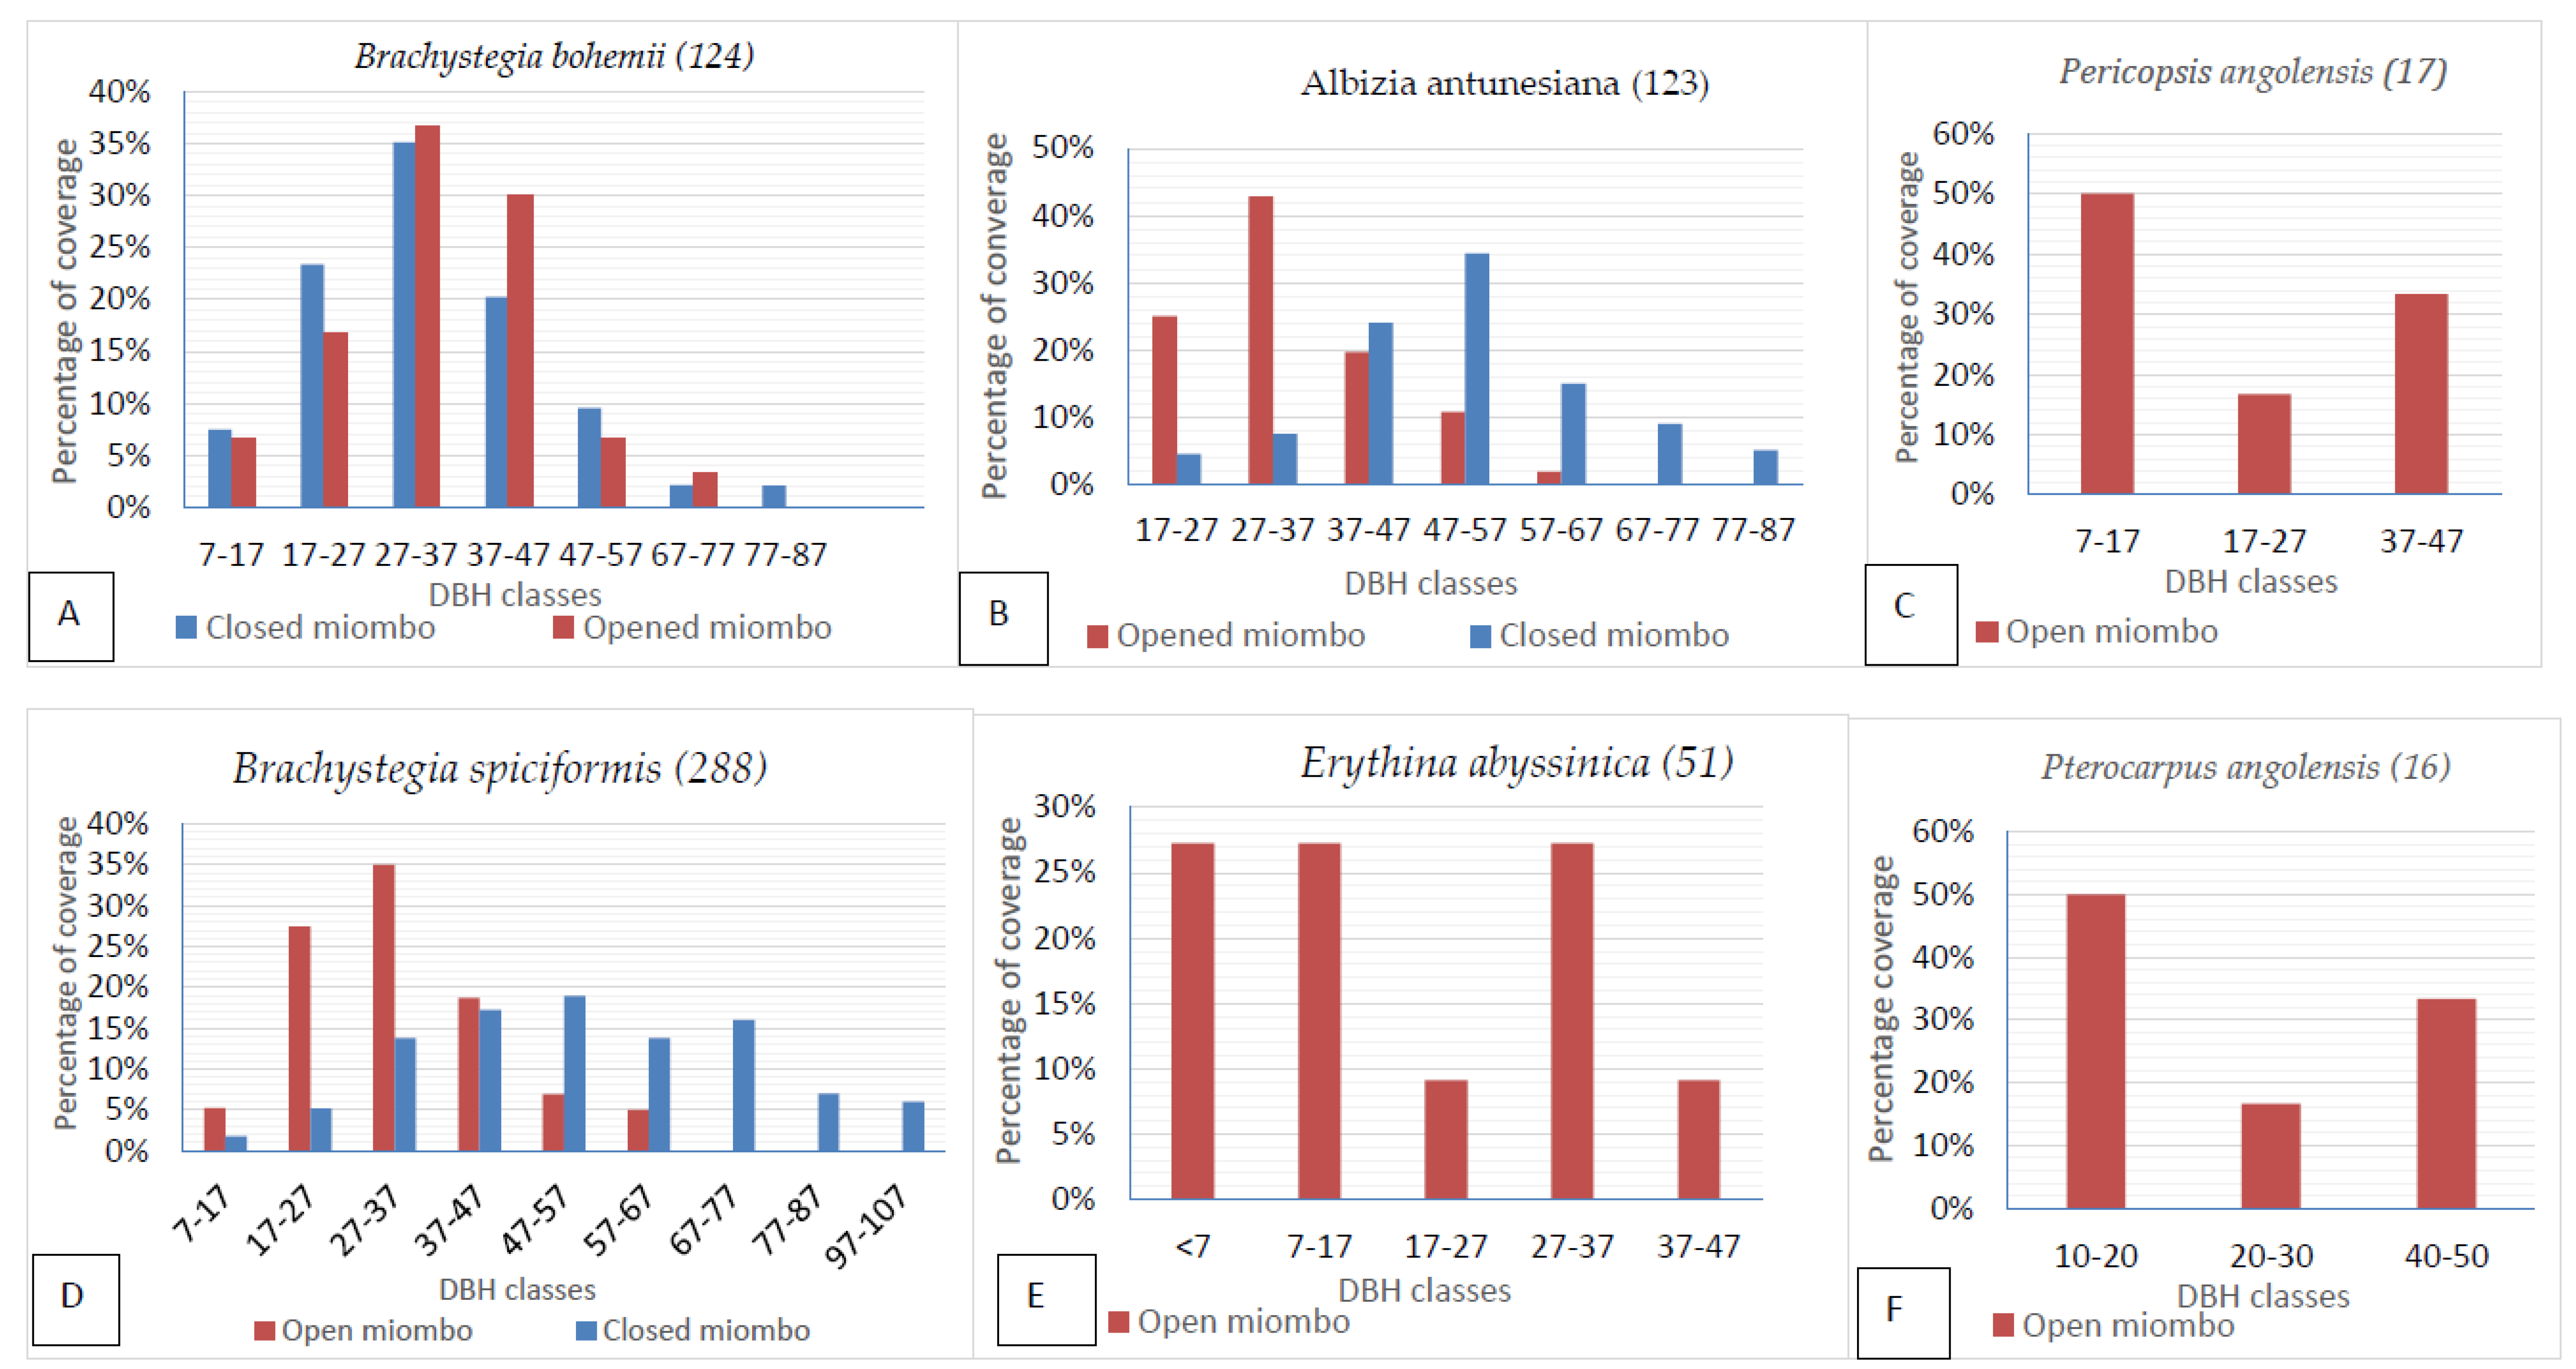
The distribution of Brachystegia spiciformis and Albizia antunesiana across DBH classes indicated a distribution skewed to the right. The number of trees decreased as diameter class size increased, which is typical of stands with selective forest management. Most species were fairly well represented among the natural regeneration and the majority of species had decent regeneration potential in the smallest DBH classes (>7 cm and 7–17 cm). The distribution patterns of species were randomly scattered and there were no discernible distribution patterns within the land cover categories (Figure 5A–C). The majority of the studied species were between 27 and 57 cm DBH on B. boehmii and A. antunesiana. Species with the lowest or highest capability or incapability for regeneration are not present around certain particular zones (Pericopsis angolensis, Erythrina abyssinica, and Pterocarpus angolensis, which were only found in opened miombo). The growth pattern forms of regeneration size classes assessed is a good indicator of ecological success.
3.3. Growth Models and Equilibrium Growth Curves for Miombo Tree Species
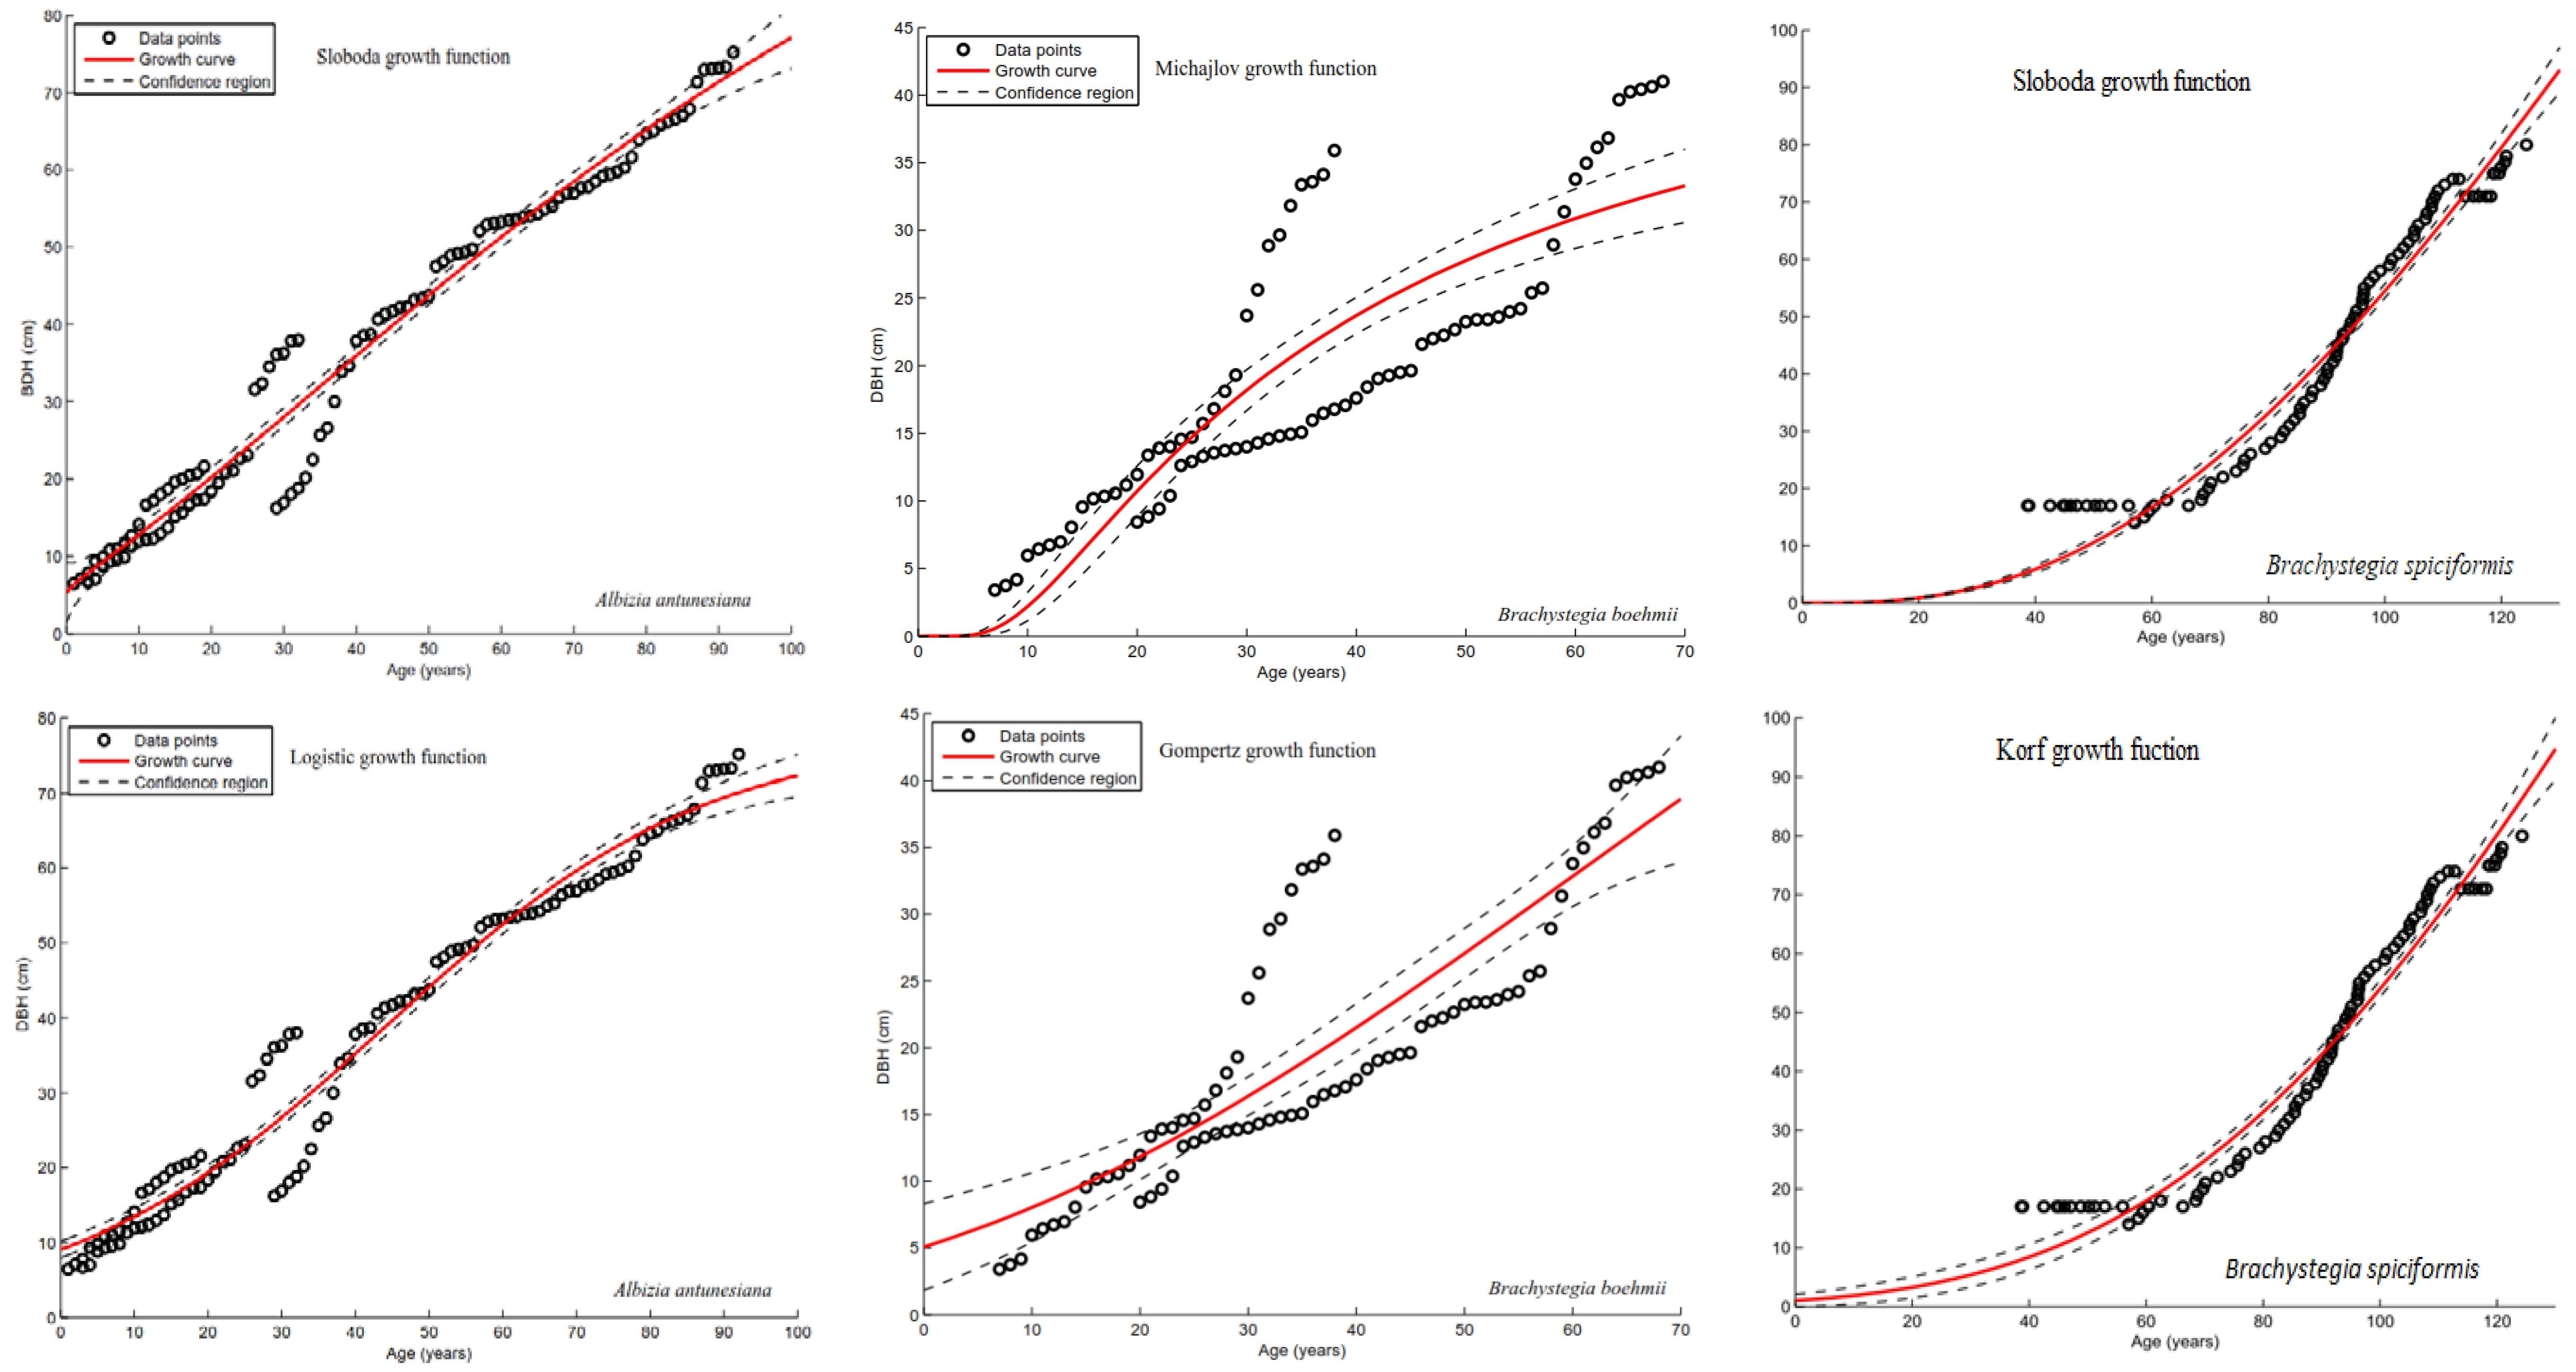
Growth rates derived from tree rings suggested that the age required to reach the assumed minimum allowable cut diameter varied among the tree species. For B. spiciformis it takes approximately 15 to 30 years to reach the minimum assumed allowable cut diameter; the lowest growth rate was for B. boehmii and time to the minimum diameter ranged from 30 to 60 years (Table 4). The tree ring measurements indicated that species exhibited differing rates of growth. The most illustrative pattern was seen for A. antunesiana and B. spiciformis (Figure 6).
Table 5 displays the growth parameters and values of R2, RMSE, AIC, and p-values for each data set for individual tree species for the best-fitted growth model. From the models used, the highest RMSE (3.95) was estimated for the B. boehmii selecting logistic growth function. However, the AIC value was lower compared to another logistic function for A. antunesiana. Of the 20 models tested in Korfit, only three growth models were satisfactory to fit miombo tree species, where the lower RMSE (2.12–2.95) in B. boehmii and B. spiciformis suggested the Gompertz and Korf growth function. The Michajlov growth function presented the lowest RMSE and AIC. It shows the accuracy of the models in fitting these miombo data (higher R2 and lower RMSE values, as well as lower AIC). The significance of the parameters was similar for all trees species and models (Table 5).
3.4. Forest Management Zones for Miombo in Huambo Province
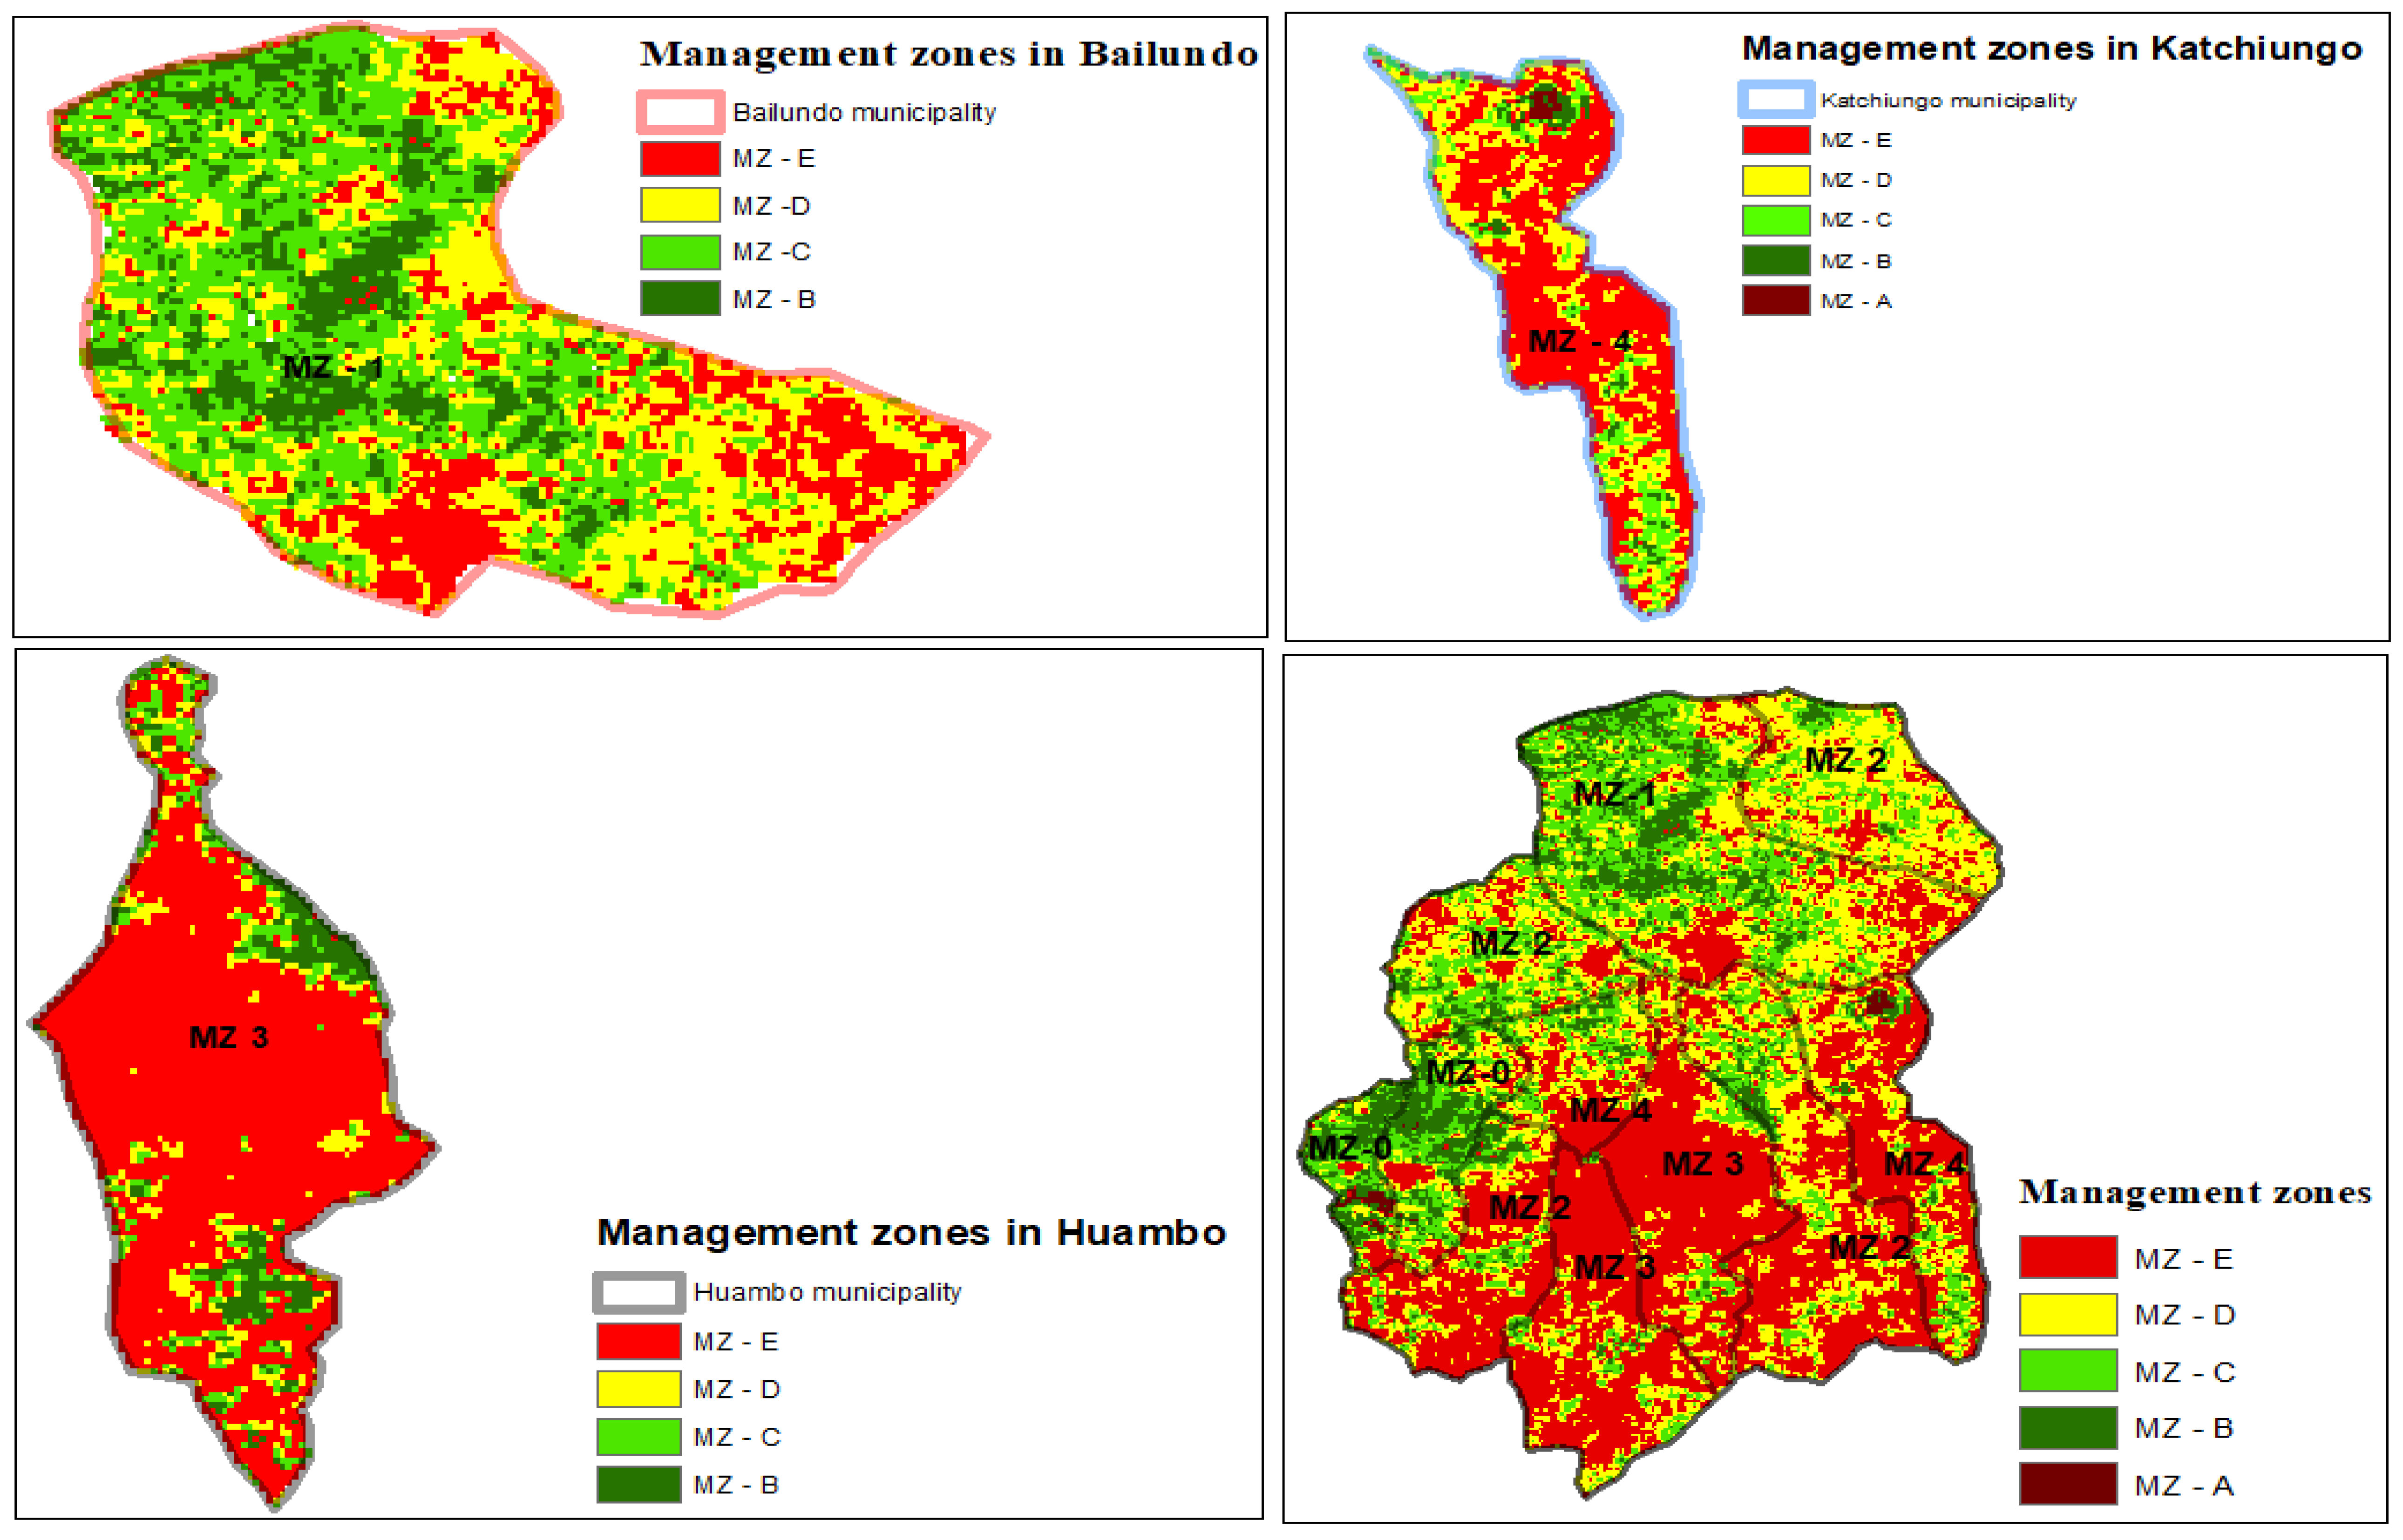
Forest management zoning is a classification system that assigns a land cover based on the given priorities of individual forest values. We extrapolated the land cover zones where we collected the data and delimited five management zones (MZ): MZ A, MZ B, MZ C, MZ D, and MZ E. The numbers (1–4) in the management zone names represent the municipalities that administer the forest. The zones that fall into the same category and present the same characteristics were assigned the same numbering (Figure 7). The alphabetic order represents the characterization of the suggested management zones and common activities in these zones (Table 6, Figure 7).
4. Discussion
The diameter distribution is a common approach used to describe the structure and growth of a stand. It illustrates the structure of a stand in terms of DBH and abundance of individual tree species in a forest. It can also help identify species that can regenerate in a given ecosystem. When diameter distribution characterizes a single peak that is left skewed, then this pattern must be maintained (because the median is the most descriptive measure of the central tendency) through silvicultural interventions (Figure 5). However, the dynamic patterns of most species begin more vigorous growth at around the age of 20, with a DBH of 20 to 30 cm (Table 3). Some species displayed a narrow inverted-J distribution, which represents a typical distribution for uneven-aged forests [93,94,95,96]. A U-shaped distribution was observed for species like P. angolensis and E. abyssinica, which suggests that forest stand dynamics are primarily controlled by competition (Figure 5C,E,F). Irregularity of the diameter distribution reflects the importance that each tree species represents to local communities, which explains the abundance of non-charcoal production tree species in open miombo forests (Figure 4). The categorization of open or closed miombo is related to its land use for settlement and infrastructure development, including arable and pastoral agriculture, cutting of live wood resources for building poles and fencing materials, and unsustainable fuel wood harvesting [97]. These anthropogenic activities represent the major factors that determine the structure and dynamic of miombo forests. The main tree species used for charcoal production were not common in open miombo (Figure 3 and Figure 4). Brachystegia speciformis, B. boehmii, A. antunesiana, and G. abyssinica best characterized the forest structure and species composition. The reduced presence of a particular species in the management zones is attributed to the selective or unsustainable harvesting for charcoal production. This finding is in agreement with the finding of several other studies of the structure, dynamics, and composition of miombo forests [34,52,66,97,98]. However, P. angolensis, an important timber species, was a very important species in the past for people living around miombo forests [99]. Based on the questionnaire survey, forest ownership mostly depends on family wealth in terms of land possession, which is passed on by inheritance.
By fitting separate models in KORFit, we were able to establish different growth patterns and predict the number of years each tree species needed to attain a certain diameter. The growth curves presented had relatively good fit for the selected tree species in our study area. For instance, trees need at least 25 to 35 years to achieve the assumed allowable minimum cut diameter (DBH 20 cm), as established by the Angolan government (Institute for Forest Development). Logistic and Gompertz growth functions provided the best fits for the miombo tree species, as confirmed by the higher RMSE (3.86–3.96) and lower AIC (628.83) values compared to other models. The lowest RMSE, 2.12–2.96, and AIC was found in B. boehmii for Gompertz and Korf functions (Table 5). Similar studies have been published that examined the relationships between species, tree diameter, height, and age [31,100,101,102].
The model selection criteria, AIC, RMSE, and p-value, tended to select complex model functions that were overfit in KORFit software. However, it is important to recognize that growth functions for miombo tree species are still hard to perform due to the difficulty of collecting data for growth modeling. It is also important to remember that the more complex the mode is, the more difficult the results are in terms of predictive values.
The pattern of annual ring development provides a means to determine the age for regrowth stands in miombo and predict the merchantable age for the species for timber or charcoal production in miombo. It is difficult to detect the growth rings of miombo species [103]. Therefore, allometric models are often used for the prediction and estimation of volume and biomass of miombo tree species [37,104,105]. The results of this study can be used to determine the appropriate allowable cut in each management zone and the future cutting cycles in miombo forests (in open and closed miombo).
4.1. Description of the Structure for Management Planning Zones
Management zoning helps farmers, managers, and policy makers identify and address the major problems in each area. Similar studies that have suggested management zoning as an introductive framework for management come from Sweden [106,107,108], the Czech Republic [109,110,111,112], and Poland [19,113,114,115]. Forest zoning consists of separating the land base into different management zones to address specific objectives; for example, conservation zones, intensive production zones, or even unmanaged zones (Figure 7). The categorization of open and closed miombo has been discussed in many published works and most do not describe the characteristics of these miombo categories [3,43,116,117,118]. In addition, the distribution of land management zone regimes and specific tree species growing in each zone have not been described [98]. The development of a matrix model will help promote better decisions in the management of miombo [119,120]. The finding of our studies suggest that models should focus on the development of management approaches tailored to each management zone (open or closed miombo) based on actual tree species presence, abundances, and its importance to local communities. We suggest managing the miombo with policies, incentives, and options for local rural communities within the framework of management zones to facilitate the establishment of forest management guidelines.
4.1.1. Management zones A (MZ 0—A)
Administrated from Ukuma municipality, however, this zone also covers Tchindjende municipality. In these zones, only firewood collection that targets fallen branches or the dead trees shall be allowed. The guidelines for management shall be to coordinate from Ukuma municipality, under the control of the Ministry of Agriculture. This zone represents plantations with potential timber production. Therefore, coppice forestry, with different silvicultural treatments, such as thinning, is recommended. The incentives for these management zones shall consist of technical assistance to optimize the harvest schedule.
4.1.2. Management Zone B (MZ 1—B)
Administrated from Bailundo municipality, management zone B represents closed miombo, which are areas still suitable for charcoal production. In these zones, the presence of the preferred species used for timber and charcoal production is much higher. Therefore, from a long-term perspective, we suggest to have this zone a conservation area for timber production only. It is recommended that these zones be conserved for timber production for at least 25 to 35 years without charcoal production (Figure 6) and allow for the collection of firewood only.
4.1.3. Management Zone C (MZ 2—C)
There are four MZ 2 areas with similar patterns of tree species distributions and stages of degradation. The administration shall be from Londuimbali municipality and it will cover the areas of Mungo and Longojo with similar management guidelines (Figure 7). The Management zone C represents open miombo, which is the main zone where charcoal and firewood comes from. Due to the intense production of charcoal, these zones shall be limited to the collection of firewood only. The silvicultural approach recommended for these areas is a coppice system, which allows for regeneration that can later serve as firewood. The government shall provide incentives for farmers that decide not to produce charcoal within this zone for at least 10 to 20 years.
4.1.4. Management Zone D (MZ 3—D)
Management zone D covers two municipalities and it shall be administrated from Huambo municipality. It represents the grassland or savannas left for pastoral activities. The extraction of firewood and charcoal is intense in this zone due to the expansion of agricultural activities. This zone represents a conversion of miombo forest to agricultural lands [64]. The agricultural period in this zone begins after the original miombo forest is slashed and burned (Appendix A), and then new fertile areas are opened. After four to 15 years of cultivation, the land becomes poor and unsuitable for agricultural activities [121,122], and it is covered by grass and small shrubs. If natural regeneration processes are not interrupted, this zone becomes an MZ—C with areas of open miombo where shrubs and small miombo trees persist (Appendix A and Appendix C).
4.1.5. Management Zone E (MZ 4—E)
Management zone E is represented by two zones and it could be administered from Ekunha municipality. This zone is a transition of MZ—D to MZ—E and is mainly a combination of agricultural lands and grassy vegetation. Agricultural lands become useless after five periods of continued cultivation and the fields are eventually only used for pastoral activities [122]. It is recommended that agroforestry systems would be a good fit in this zone.
To manage miombo woodlands needs sustainably, good knowledge of forest structure, composition, and tree growth rates within each management zone is critical. In the past, the creation of cutting rotation cycles for miombo species has been hindered by difficulties in determining the age of the trees because it was assumed that many tree species do not form annual rings [123,124]. However, dendrochronological studies have proven that miombo tree species produce distinct annual growth rings, and many of these studies encourage the use of tree ring analysis as a tool to understand the age structure and growth dynamics of miombo for sustainable management [125].
5. Conclusions
Assessing tree species patterns of miombo gave us an overview of the forest structure in miombo (DBH and height). Miombo forest stands presented an irregular structure where DBH distribution primarily illustrated two patterns: forests dominated by smaller trees and bimodal forest structures. The models tested constitute a good tool to identify potential high-growth species to generate management plans for multiple objectives.
Management zones identified in this study are the key piece of information providing detailed knowledge to design forest management plans. The delineated management zones minimize potential conflicts because the zones are not based on prohibitions of the exploitation of certain forest resources; in contrast, they suggest incentives for farmers that decide to conserve portions of the forest. This emphasizes the need for the local government to fund conservation projects that apply detailed management planning. REDD+ initiative projects may present an important opportunity for further forest data collection to enrich our understanding of Angolan forests and establish appropriate management strategies to sustain their many benefits and services. However, we recognize that the management of natural resources is always experimental and we can learn from the implemented activities to improve policies and practices by learning from the outcomes. No matter the quality of a management plan, one has to start by developing a framework.
Future research should concentrate on the development of models or production functions for firewood and charcoal production curves of annual increment within the suggested management zones. Future studies should also investigate the current patterns of miombo users and indicate the optimal allowable cuts for firewood, charcoal, and timber in the various management zones.
Author Contributions
V.C. collected the ground measurements, conducted the data analyses and interpretations, and wrote the manuscript. P.S. analyzed the remote sensed data and images and supervised the manuscript.
Acknowledgments
We gratefully acknowledge the Czech University of Life Sciences Prague for mobility financial support for data acquisition in Angola. The work was partially funded by project QJ1520187 (Ministry of Agriculture of Czech Republic). We would also like to acknowledge the Faculty of Agriculture in Huambo, University José Eduardo dos Santos, especially the five students that participated in the field data collection in Huambo. Our thanks also to the Institute for Forest Development for their help identifying in the secure locations for data collection in Huambo province.
Conflicts of interest
The authors declare no conflict of interest.
Appendix A
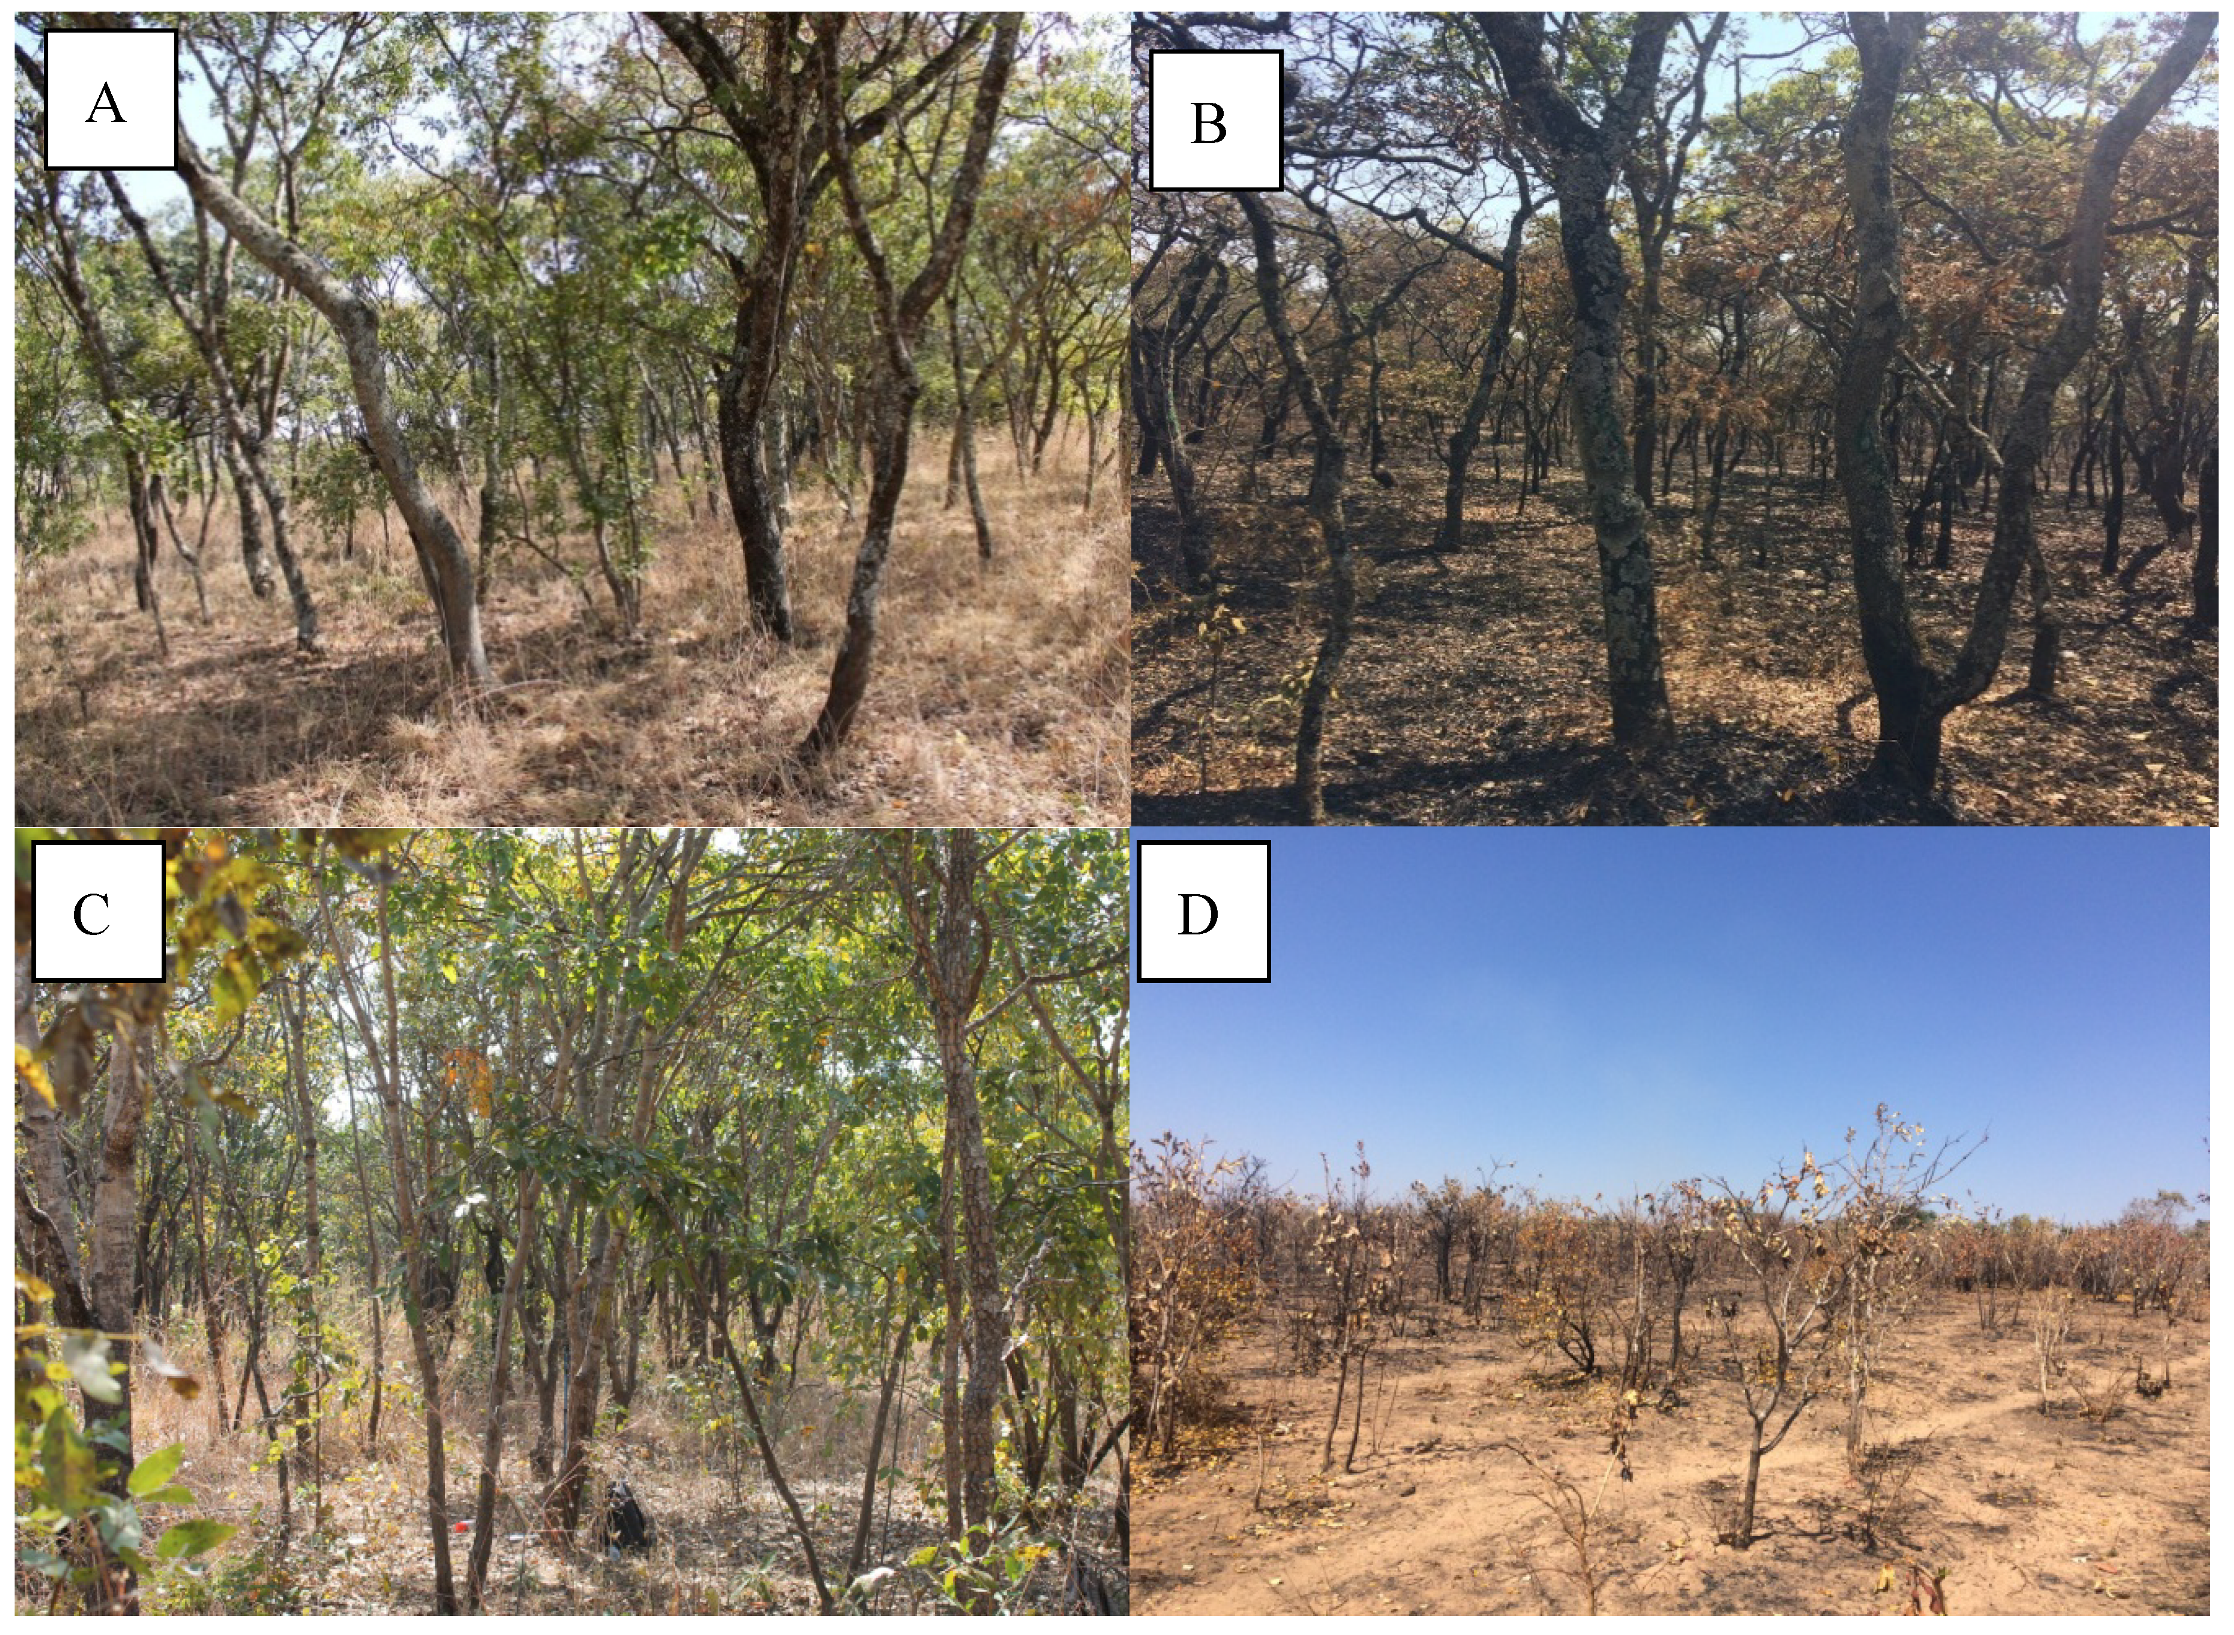
Figure A1.
(A) Closed miombo before fire; (B) Closed miombo after fire; (C) Regeneration in opened miombo; (D) Grassland after fire
Figure A1.
(A) Closed miombo before fire; (B) Closed miombo after fire; (C) Regeneration in opened miombo; (D) Grassland after fire

Appendix B
Figure A2.
Illustration of an Image with Tree Rings Analysis in WinDENDRO TM.

Appendix C. Questionnaire Survey
- Questionario dirigido ao popuplação vivendo no raio de 4 km de distancia da floresta ser inquirida (Questionnaire directed to population living in a radius of 4 km of the forest measured)
- Nome _(Name)______________________________________
- Aldeia (Village) _____________________ Idade (Age)________ Masculino __(Male) □ Femenino_(Female)_ □
Aspectos dos agregados familiares (Aspects of households)
- Quanto tempo você vive nesta aldeia? (How long have you lived in this village?)__________________________________________________________________________________________________________________________________________
- Quantos fillhos você tem? (How many kids do you have?)__________________________________________________________________________________________________________________________________________
- Qual e o teu nivel de educação? (What is your level of education?)
- □
- Escola Primaria
- □
- Escola Secundaria
- □
- Ensino Medio
- □
- Ensino Universitario
- □
- Outros
- Você tem alguma educação no ramo agririo? (Do you have any education training in agriculture?)
- □
- Sim
- □
- Não
- □
- Talvez
- □
- Outros ________________________________________________________
- Quão distance è a tua aldeia para a floresta? (How far is the forest from the village?)
- □
- 30 min–1 h
- □
- 1–2 h
- □
- 3–4 h
- □
- Outros _______________________________________________________
- Quais são as tuas fontes de energia domestica para a preparação dos alimentos? (What source of domestic energy do you use to prepare food?)
- □
- Gerador de energia
- □
- Batteria ou panel solar
- □
- Electricidade
- □
- Carvão e lenha
- □
- Other _______________________________________________________
Aspecto da Agricultural
- 7.
- Você e campones? (Are you a farmer?)
- □
- Sim
- □
- Não
- □
- Talvez
- □
- Outros ________________________________________________________
- 8.
- Se sim, quantos hectares você tem? (If yes, how many of hectares do you have?)__________________________________________________________________________________________________________________________________________
- 9.
- Quantas pessoas da tua familia trabalham contigo no campo? (How many people in your family work on the farm?)__________________________________________________________________________________________________________________________________________
- 10.
- O que você normalmente cultiva? (What do you normally cultivate?)_____________________________________________________________________
- 11.
- O que é que vocè faz com os produtos colhidos no campo? (What do you do with products you collect from the farm?)
- □
- Consumo pròprio (%) (Own consuption)
- □
- Vende (%) (Sell)
- □
- Outros _______(Others)_______________________________________________
- 12.
- Aliste os produtos que vende e o preco dos mesmos? (List the products you sell and at what price)
| Orden | Produto | Quantidade(kg) | Preço (per kg) | Lugar | Cliente |
| 1. | |||||
| 2. | |||||
| 3. | |||||
| 4. | |||||
| 5. | |||||
| 6. | |||||
| 7. |
- 13.
- Quais animais você cria? (What animals do you create?)
- □
- Bois (Cow)
- □
- Cabras (Goat)
- □
- Galinhas (Chicken)
- □
- Porcos (Pig)
- □
- Ovelhas (Sheep)
- □
- Outros _(Others)_____________________________________________________
- 14.
- Quanto de cada um você tem? (How many of each do you have?)_____________________________________________________________________
- 15.
- Quanto voce vende a cada um desses animais? (How much can you sell of each of the animals?)
- □
- Bois
- □
- Cabras
- □
- Galinhas
- □
- Porcos
- □
- Ovelhas
- □
- Outros _________________________________________________________
Produção do charcoal (Production of charcoal)
- 16.
- Você produz o carvão? Com que frequencia você produz o carvão? (Do you produce charcoal? How often?)_____________________________________________________________________
- 17.
- Considerando a ordem de importancia, o que e mais importante para voce na floresta? (Note que cada razão esta escada de 1 a 9. Sendo 9 o mais alto) (Considering the order of importance, what is more important for you, note that the scale goes from 1 to 9, where 9 is the highest).
| Razões | 1 | 2 | 3 | 4 | 5 | 6 | 7 | 8 | 9 |
| Lenha vs. Carvão | □ | □ | □ | □ | □ | □ | □ | □ | □ |
| Carvão vs. Madeira | □ | □ | □ | □ | □ | □ | □ | □ | □ |
| Madeira vs. Lenha | □ | □ | □ | □ | □ | □ | □ | □ | □ |
| Outros | □ | □ | □ | □ | □ | □ | □ | □ | □ |
- 18.
- Para que você use o carvão? (What do you use charcoal for?)
- □
- Vender (%) (Sell)
- □
- Preparar alimentos (%) (Own consumption)
- □
- Aquecimento da casa (Heating house)
- □
- Outros (Others) _____________________________________________________________
- 19.
- Com excepção do carvão quais são os outros productos que você recolha da floresta? (What products do you collect from the forest?)_________________________________________________________________
- 20.
- Quanto tempo você gasta na floresta por dia? (How much time do you spend in the forest?)_________________________________________________________________
- 21.
- Quantos membros da familia estão tambem engajados an produção do carvão? (How many members of your family are engaged in charcoal production?)__________________________________________________________________
- 22.
- Quem è o dono da floresta onde você extrai o carvão? (How is the owner of the forest where you collect charcoal?)
- □
- Governo (Government)
- □
- Floreta da aldeia (Village forest)
- □
- Dono (Own forest)
- □
- Outros (Other)_____________________________________________________
- 23.
- Quais são as especies voce usa para a produção do carvão? (What are the species you use for charcoal production?)____________________________________________________________________
- A)
- Quais são as espeices mais preferidas e porque? (What are the most preferable species?)__________________________________________________________________________________________________________________________________________
- 24.
- Qual é o preço de um soco de carvão? (What is the price of one bag of charcoal?)_____________________________________________________________________
- 25.
- Quantos sacos de carvão vocè pode vender por dia? (How many sacks of charcoal can you sell per day?)__________________________________________________________________________________________________________________________________________
Appendix D

Table A1.
Number of Plots Sampled in Each Land Cover.
| Study Site | Number of Plots | Land Cover | Purpose of the Forest |
|---|---|---|---|
| Bailundo | Plot 1 | Open miombo | Charcoal and Firewood |
| Plot 2 | Open miombo | Charcoal and Firewood | |
| Plot 3 | Open miombo | Charcoal and Firewood | |
| Plot 4 | Closed miombo | Charcoal and Firewood | |
| Plot 5 | Savanna/Grassland | Firewood | |
| Plot 6 | Open miombo | Charcoal and Firewood | |
| Plot 7 | Open miombo | Charcoal and Firewood | |
| Huambo | Plot 1 | Closed miombo | Conserved for academic purposes |
| Plot 2 | Closed miombo | Conserved for academic purposes | |
| Cuima | Plot2 | Savanna/Grassland | Firewood |
| Plot 1 | Savanna/Grassland | Firewood | |
| Plot 3 | Open miombo | Charcoal and Firewood | |
| Katchiungo | Plot 1 | Open miombo | Charcoal and Firewood |
| Plot 2 | Savanna/Grassland | Firewood | |
| Ekunha | Plot 1 | Closed miombo | Charcoal and Firewood |
| Plot 2 | Closed miombo | Charcoal and Firewood | |
| Caala | Plot 1 | Savanna/Grassland | Firewood |
| Plot 2 | Open miombo | Charcoal and Firewood |
References
- Geldenhuys, C.J.; Ham, C.; Ham, H. Sustainable management in Africa: Some Solutions to Natural Forest Management Problems in Africa; Department of Forest and Wood Science Stellenbosch University: Stellenbosch, South Africa, 2008; ISBN 9780797213456. [Google Scholar]
- Bau, D.E. Deforestation and Forest Degradation in Southern Burkina Faso: Understanding the Drivers of Change and Options for Revegetation. Ph.D. Thesis, University of Helsinki, Helsinki, Finland, 2016. [Google Scholar]
- Ryan, C.M.; Hill, T.; Woollen, E.; Ghee, C.; Mitchard, E.; Cassells, G.; Grace, J.; Woodhouse, I.H.; Williams, M. Quantifying small-scale deforestation and forest degradation in African woodlands using radar imagery. Glob. Chang. Biol. 2012, 18, 243–257. [Google Scholar] [CrossRef]
- Al-Hamdan, M.Z.; Oduor, P.; Flores, A.I.; Kotikot, S.M.; Mugo, R.; Ababu, J.; Farah, H. Evaluating land cover changes in Eastern and Southern Africa from 2000 to 2010 using validated Landsat and MODIS data. Int. J. Appl. Earth Obs. Geoinform. 2017, 62, 8–26. [Google Scholar] [CrossRef]
- Akinyemi, F.O. Land change in the central Albertine rift: Insights from analysis and mapping of land use-land cover change in north-western Rwanda. Appl. Geogr. 2017, 87, 127–138. [Google Scholar] [CrossRef]
- Cabral, A.I. Cartografia de coberto do solo para o território Angolano utilizando imagens de satélite Modis. Estud. Reg. 2003, 15, 65–78. [Google Scholar]
- Gross, D.; Dubois, G.; Pekel, J.F.; Mayaux, P.; Holmgren, M.; Prins, H.H.T.; Rondinini, C.; Boitani, L. Monitoring land cover changes in African protected areas in the 21st century. Ecol. Inform. 2013, 14, 31–37. [Google Scholar] [CrossRef]
- Mayes, M.T.; Mustard, J.F.; Melillo, J.M. Remote Sensing of Environment Forest cover change in Miombo Woodlands: Modeling land cover of African dry tropical forests with linear spectral mixture analysis. Remote Sens. Environ. 2015, 165, 203–215. [Google Scholar] [CrossRef]
- Monitorização e Avaliação de Recursos Florestais Nacionais de Angola—Guia para Recolha de Dados. National Forest Monitoring and Assessment. Available online: http://www.fao.org/docrep/016/ap156p/ap156p.pdf (accessed on 20 April 2018).
- Center for International Forestry Research (CIFOR). The Collaborative Partnership on Forest. Available online: https://www.cifor.org/partners/collaborative-partnership-forests-cpf/ (accessed on 23 April 2018).
- Schneibel, A.; Frantz, D.; Röder, A.; Stellmes, M.; Fischer, K.; Hill, J. Using annual landsat time series for the detection of dry forest degradation processes in south-central Angola. Remote Sens. 2017, 9, 905. [Google Scholar] [CrossRef]
- Gibbs, H.K.; Brown, S.; Niles, J.O.; Foley, J.A. Monitoring and estimating tropical forest carbon stocks: Making REDD a reality. Environ. Res. Lett. 2007, 2, 045023. [Google Scholar] [CrossRef]
- Holmgren, P. Global Forest Survey Concept Paper; Food and Agriculture Organization of United Nations: Rome, Italy, 2000. [Google Scholar]
- Ghalandarayeshi, S.; Nord-Larsen, T.; Johannsen, V.K.; Larsen, J.B. Spatial patterns of tree species in Suserup Skov—A semi-natural forest in Denmark. For. Ecol. Manag. 2017, 406, 391–401. [Google Scholar] [CrossRef]
- Kang, D.; Guo, Y.; Ren, C.; Zhao, F.; Feng, Y.; Han, X.; Yang, G. Population structure and spatial pattern of main tree species in secondary betula platyphylla forest in Ziwuling Mountains, China. Sci. Rep. 2014, 4, 6873. [Google Scholar] [CrossRef] [PubMed]
- Higuchi, P.; Silva, A.; Louzada, J.; Machado, E. Spatial patterns of a tropical tree species growing under an eucalyptus plantation in South-East Brazil. Braz. J. Biol. 2010, 70, 271–277. [Google Scholar] [CrossRef] [PubMed] [Green Version]
- Liu, J.J.; Slik, J.W.F. Forest fragment spatial distribution matters for tropical tree conservation. Biol. Conserv. 2014, 171, 99–106. [Google Scholar] [CrossRef]
- Condit, R. Spatial patterns in the distribution of tropical tree species. Science 2000, 288, 1414–1418. [Google Scholar] [CrossRef] [PubMed]
- Pretzsch, H.; Biber, P.; Schütze, G.; Uhl, E.; Rötzer, T. Forest stand growth dynamics in Central Europe have accelerated since 1870. Nat. Commun. 2014, 5, 4967. [Google Scholar] [CrossRef] [PubMed] [Green Version]
- Vlam, M.; van der Sleen, P.; Groenendijk, P.; Zuidema, P.A. Tree Age Distributions Reveal Large-Scale Disturbance-Recovery Cycles in Three Tropical Forests. Front. Plant Sci. 2017, 7, 1–12. [Google Scholar] [CrossRef] [PubMed]
- Groenendijk, P.; Sass-Klaassen, U.; Bongers, F.; Zuidema, P.A. Potential of tree-ring analysis in a wet tropical forest: A case study on 22 commercial tree species in Central Africa. For. Ecol. Manag. 2014, 323, 65–68. [Google Scholar] [CrossRef]
- Scolforo, H.F.; Scolforo, J.R.S.; Thiersch, C.R.; Thiersch, M.F.; McTague, J.P.; Burkhart, H.; Ferraz Filho, A.C.; de Mello, J.M.; Roise, J. A new model of tropical tree diameter growth rate and its application to identify fast-growing native tree species. For. Ecol. Manag. 2017, 400, 578–586. [Google Scholar] [CrossRef]
- International Database on REDD Projects Projects @ ifri.snre.umich.edu. Available online: http://ifri.snre.umich.edu/redd/view/projects.php?id=24&name=Angola (accessed on 02 May 2018).
- African Development Bank. REDD + IN AFRICA Context, Challenges and Next Steps of REDD+ Mechanisms in the Continent; African Development Bank: Abidjan, Cote d’Ivoire, 2016. [Google Scholar]
- Abdallah, J.; Monela, G. Overview of Miombo woodlands in Tanzania. In Proceedings of the First MITMIOMBO Project Work-Shop, Morogoro, Tanzania, 6–12 February 2007; Volume 50, pp. 9–23. [Google Scholar]
- Anang, B.T.; Akuriba, M.A.; Alerigesane, A.A. Charcoal production in Gushegu District, Northern Region, Ghana: Lessons for sustainable forest management. Int. J. Environ. Sci. 2011, 1, 1944–1953. [Google Scholar]
- Chidumayo, E.N.; Gumbo, D.J. The environmental impacts of charcoal production in tropical ecosystems of the world: A synthesis. Energy Sustain. Dev. 2013, 17, 86–94. [Google Scholar] [CrossRef]
- Kutsch, W.L.; Merbold, L.; Ziegler, W.; Mukelabai, M.M.; Muchinda, M.; Kolle, O.; Scholes, R.J. The charcoal trap: Miombo forests and the energy needs of people. Carbon Balance Manag. 2011, 6, 5. [Google Scholar] [CrossRef] [PubMed]
- Lupala, Z.J.; Lusambo, L.P.; Ngaga, Y.M. Management, Growth, and Carbon Storage in Miombo Woodlands of Tanzania. Int. J. For. Res. 2014, 2014, 1–11. [Google Scholar] [CrossRef] [Green Version]
- Shively, G.; Jagger, P.; Sserunkuuma, D.; Arinaitwe, A.; Chibwana, C. Profits and margins along Uganda’s charcoal value chain. Int. For. Rev. 2010, 12, 270–283. [Google Scholar] [CrossRef]
- Therrell, M.D.; Stahle, D.W.; Mukelabai, M.M.; Shugart, H.H. Age, and radial growth dynamics of Pterocarpus angolensis in southern Africa. For. Ecol. Manag. 2007, 244, 24–31. [Google Scholar] [CrossRef]
- Syampungani, S.; Geldenhuys, C.J.; Chirwa, P.W. Regeneration dynamics of miombo woodland in response to different anthropogenic disturbances: Forest characterisation for sustainable management. Agrofor. Syst. 2016, 90, 563–576. [Google Scholar] [CrossRef]
- Stromgaard, P. Biomass estimation equations for miombo woodland, Zambia. Agrofor. Syst. 1985, 3, 3–13, 19–20. [Google Scholar] [CrossRef]
- Syampungani, S. Opportunities and challenges for sustainable management of miombo woodlands: The Zambian perspective. Work. Pap. Finn. For. Res. Inst. 2008, 98, 125–130. [Google Scholar]
- Kachamba, D.J.; Eid, T.; Gobakken, T. Above- and belowground biomass models for trees in the miombo woodlands of Malawi. Forests 2016, 7, 38. [Google Scholar] [CrossRef]
- Abbot, P.; Lowore, J.; Werren, M. Models for the estimation of single tree volume in four Miombo woodland types. For. Ecol. Manag. 1997, 97, 25–37. [Google Scholar] [CrossRef]
- Puliti, S.; Solberg, S.; Næsset, E.; Gobakken, T.; Zahabu, E. Modelling above ground biomass in Tanzanian miombo woodlands using TanDEM-X WorldDEM and field data. Remote Sens. 2017, 9, 984. [Google Scholar] [CrossRef]
- Malimbwi, C. Contribution of Charcoal Extraction to Deforestation: Experience from CHAPOSA Research Project; Sokoine University of Agriculture: Morogoro, Tanzania, 2005; pp. 1–14. [Google Scholar]
- Nhantumbo, I.; Dent, J.; Kowero, G. Goal programming: Application in the management of the miombo woodland in Mozambique. Eur. J. Oper. Res. 2001, 133, 310–322. [Google Scholar] [CrossRef]
- Ryan, C.M.; Berry, N.J.; Joshi, N. Quantifying the causes of deforestation and degradation and creating transparent REDD+ baselines: A method and case study from central Mozambique. Appl. Geogr. 2014, 53, 45–54. [Google Scholar] [CrossRef] [Green Version]
- Williams, M.; Ryan, C.M.; Rees, R.M.; Sambane, E.; Fernando, J.; Grace, J. Carbon sequestration and biodiversity of re-growing miombo woodlands in Mozambique. For. Ecol. Manag. 2008, 254, 145–155. [Google Scholar] [CrossRef]
- Mcnicol, I.; Ball, S.; Williams, M.; Ryan, C. Accurately assessing biomass carbon in Miombo woodlands. ARC J. 2014, 4, 18–21. [Google Scholar]
- Kamusoko, C.; Gamba, J.; Murakami, H. Mapping Woodland Cover in the Miombo Ecosystem: A Comparison of Machine Learning Classifiers. Land 2014, 3, 524–540. [Google Scholar] [CrossRef] [Green Version]
- Chiteculo, V.; Hájek, M.; Kubová, P. Production and Commercialization of Timber in Angola after the Declaration of Independence. Sci. Agric. Bohem. 2018, 49, 38–45. [Google Scholar] [CrossRef] [Green Version]
- Buza, A.G.; Tourinho, M.M.; Silva, J.N.M. Caracterização da colheita florestal em cabinda, Angola. Rev. Cienc. Agrar. Belen 2006, 45, 59–78. [Google Scholar]
- Malmer, A. General ecological features of miombo woodlands and considerations for utilization and management. In Proceedings of the First MITMIOMBO Project Work-Shop, Morogoro, Tanzania, 6–12 February 2007; Volume 50. [Google Scholar]
- Campbell, B.M. The Miombo in Transition: Woodlands and Welfare in Africa; Center for International Forestry Research: Bogor, Indonesia, 1996; Volume 72, ISBN 9798764072. [Google Scholar]
- Torello-Raventos, M.; Feldpausch, T.R.; Veenendaal, E.; Schrodt, F.; Saiz, G.; Domingues, T.F.; Djagbletey, G.; Ford, A.; Kemp, J.; Marimon, B.S.; et al. On the delineation of tropical vegetation types with an emphasis on forest/savanna transitions. Plant Ecol. Divers. 2013, 6, 101–137. [Google Scholar] [CrossRef]
- Huntley, B.; Matos, E.M. Botanical diversity and its conservation in Angola. Bot. Divers. South. Afr. 1994, 1, 53–74. [Google Scholar]
- The University of Edinburch. A Very Brief Introduction to Miombo Woodlands. Available online: https://www.geos.ed.ac.uk/homes/cryan/miombo (accessed on 24 April 2018).
- Gumbo, D.J.; Dumas-Johansen, M.; Muir, G.; Boerstler, F.; Xia, Z. Sustainable Management of Miombo Woodlands; Food Security, Nutrition and Wood Energy; The Food and Agriculture Organization (FAO): Rome, Italy, 2018. [Google Scholar]
- Campbell, B.M.; Cunliffe, R.N.; Gambiza, J. Vegetation structure and small-scale pattern in Miombo Woodland, Marondera, Zimbabwe. Bothalia 1995, 25, 121–126. [Google Scholar] [CrossRef]
- Abbot, J.I.O.; Homewood, K. A history of change: Causes of miombo woodland decline in a protected area in Malawi. J. Appl. Ecol. 1999, 36, 422–433. [Google Scholar] [CrossRef]
- Cabral, A.I.R.; Vasconcelos, M.J.; Oom, D.; Sardinha, R. Spatial dynamics and quantification of deforestation in the central-plateau woodlands of Angola (1990–2009). Appl. Geogr. 2011, 31, 1185–1193. [Google Scholar] [CrossRef]
- Lupala, Z.J.; Lusambo, L.P.; Ngaga, Y.M.; Makatta, A.A. The Land Use and Cover Change in Miombo Woodlands under Community Based Forest Management and Its Implication to Climate Change Mitigation: A Case of Southern Highlands of Tanzania. Int. J. For. Res. 2015, 2015, 459102. [Google Scholar] [CrossRef]
- Chidumayo, E.N. Species Structure in Zambian Miombo Woodland. J. Trop. Ecol. 1987, 3, 109–118. [Google Scholar] [CrossRef]
- Ryan, C.M.; Pritchard, R.; McNicol, I.; Owen, M.; Fisher, J.A.; Lehmann, C. Ecosystem services from southern African woodlands and their future under global change. Philos. Trans. R. Soc. B Biol. Sci. 2016, 371. [Google Scholar] [CrossRef] [PubMed]
- Tanz, J.; Howard, A. Meaningful public participation in the planning and management of publicly owned forests. For. Chron. 1991, 67, 125–130. [Google Scholar] [CrossRef] [Green Version]
- Campbell, B.M.; Angelsen, A.; Cunningham, A.B.; Katerere, Y.; Sitoe, A.; Wunder, S. Miombo woodlands—Opportunities and barriers to sustainable forest management. Observatory 2007, 41, 1–37. [Google Scholar]
- Michon, G.; de Foresta, H.; Levang, P.; Verdeaux, F. Domestic forests: A new paradigm for integrating local communities’ forestry into tropical forest science. Ecol. Soc. 2007, 12, 1. [Google Scholar] [CrossRef]
- Khan, T. Forest Management Paradigms and Resource Rights in Historical Perspective: Evidence from the Swat District; Working Paper Series 116; SDPI: Islamabad, Pakistan, 2010. [Google Scholar]
- Parrotta, J.; Yeo-Chang, Y.; Camacho, L.D. Traditional knowledge for sustainable forest management and provision of ecosystem services. Int. J. Biodivers. Sci. Ecosyst. Serv. Manag. 2016, 12, 1–4. [Google Scholar] [CrossRef] [Green Version]
- International Energy Agency. Angola, Towards an Energy Strategy; OECD Publishing: Paris, France, 2006; p. 172. Available online: https://www.iea.org/publications/freepublications/publication/angola2006.pdf/ (accessed on 3 Jun 2018).
- Schneibel, A.; Stellmes, M.; Röder, A.; Finckh, M.; Revermann, R.; Frantz, D.; Hill, J. Evaluating the trade-off between food and timber resulting from the conversion of Miombo forests to agricultural land in Angola using multi-temporal Landsat data. Sci. Total Environ. 2016, 548–549, 390–401. [Google Scholar] [CrossRef] [PubMed]
- Revermann, R.; Goncalves, F.M.; Gomes, A.L.; Finckh, M. Woody species of the Miombo woodlands and geoxylic grasslands of the Cusseque area, south-central Angola. Check List 2017, 13. [Google Scholar] [CrossRef]
- Gonçalves, F.M.P.; Revermann, R.; Gomes, A.L.; Aidar, M.P.; Finckh, M.; Jürgens, N. Tree species diversity and composition of Miombo woodlands in south-central Angola, a chronosequence of forest recovery after shifting cultivation. Int. J. For. Res. 2017, 2017, 6202093. [Google Scholar] [CrossRef]
- Gonçalves, F.M.P.; Goyder, D.J. A brief botanical survey into Kumbira forest, an isolated patch of Guineo-Congolian biome. PhytoKeys 2016, 65, 1–14. [Google Scholar] [CrossRef] [PubMed] [Green Version]
- Dupont, L.M.; Behling, H.; Kim, J.-H. Thirty thousand years of vegetation development and climate change in Angola (Ocean Drilling Program Site 1078). Clim. Past 2008, 4, 107–124. [Google Scholar] [CrossRef] [Green Version]
- Chiteculo, V.; Surovy, P.; Panagiotidis, D. Does Management matter? Assessment on Miombo Forests in Angola. Sci. Agric. Bohem. 2018, in press. [Google Scholar]
- FAO. Nationa Forest Assessments-Country Projects. Available online: http://www.fao.org/forestry/17847/en/ago/ (accessed on 23 April 018).
- Romeiras, M.M.; Figueira, R.; Duarte, M.C.; Beja, P.; Darbyshire, I. Documenting biogeographical patterns of African timber species using herbarium records: A conservation perspective based on native trees from Angola. PLoS ONE 2014, 9, e103403. [Google Scholar] [CrossRef] [PubMed]
- Rodrigues, P.; Figueira, R.; Vaz Pinto, P.; Araújo, M.B.; Beja, P. A biogeographical regionalization of Angolan mammals. Mammal Rev. 2015, 45, 103–116. [Google Scholar] [CrossRef] [Green Version]
- Delgado-Matas, C.; Pukkala, T. Growth and yield of nine pine species in Angola. J. For. Res. 2012, 23, 197–204. [Google Scholar] [CrossRef]
- USAID. 118/119 Biodiversity and Tropical Forest Assessment for Angola; United States Agency for International Development: Washington, DC, USA, 2008.
- USAID. 118/119 Biodiversity and Tropical Forest Assessment for Benin; United States Agency for International Development: Washington, DC, USA, 2007.
- A Preliminary Atlas and Profile of Huambo. Development Workshop: Angola. 2012. Available online: http://www.ao.undp.org/content/angola/en/home/library/environment_energy/atlas_huambo.html (accessed on 27 April 2018).
- The Word Conservation Union. Environmental Synopsi: Angola. 1993. Available online: https://portals.iucn.org/library/efiles/documents/Co-AO-Env-002.pdf (accessed on 27 April 2018).
- West, P.W. Tree and Forest Measurement, 2nd ed.; Springer-Verlag: Berlin, Germany, 2009. [Google Scholar]
- Henttonen, H.M.; Kangas, A. Optimal plot design in a multipurpose forest inventory. For. Ecosyst. 2015, 2, 31. [Google Scholar] [CrossRef] [Green Version]
- Mehtätalo, L.; Gregoire, T.G.; de Miguel Magaña, S. Modeling height-diameter curves for prediction. Can. J. For. Res. 2015, 45, 826–837. [Google Scholar] [CrossRef]
- Chamshama, S.A.O.; Mugasha, A.G.; Zahabu, E. Stand biomass and volume estimation for Miombo Woodlands at Kitulangalo, Morogoro, Tanzania. South. Afr. For. J. 2004, 200, 59–70. [Google Scholar] [CrossRef]
- Li, Y.; Shi, Z.; Wu, C.; Li, H.; Li, F. Determination of potential management zones from soil electrical conductivity, yield and crop data. J. Zhejiang Univ. Sci. B 2008, 9, 68–76. [Google Scholar] [CrossRef] [PubMed] [Green Version]
- Mieza, M.S.; Cravero, W.R.; Kovac, F.D.; Bargiano, P.G. Delineation of site-specific management units for operational applications using the topographic position index in La Pampa, Argentina. Comput. Electron. Agric. 2016, 127, 158–167. [Google Scholar] [CrossRef] [Green Version]
- Abbas, A.W.; Minallh, N.A.; Abid, S.A.R.; Khan, M.A.A. K-Means and ISODATA Clustering Algorithms for Landcover Classification Using Remote Sensing. Sindh Univ. Res. J. (Sci. Ser.) 2016, 48, 315–318. [Google Scholar]
- Liu, Q.; Zhao, Z.; Li, Y.X.; Li, Y. Feature selection based on sensitivity analysis of fuzzy ISODATA. Neurocomputing 2012, 85, 29–37. [Google Scholar] [CrossRef]
- Mauya, E.W.; Mugasha, W.A.; Zahabu, E.; Bollandsås, O.M.; Eid, T. Models for estimation of tree volume in the miombo woodlands of Tanzania. South. For. 2014, 76, 209–219. [Google Scholar] [CrossRef]
- Kashindye, A.; Mtalo, E.; Mpanda, M.M.; Liwa, E.; Giliba, R. Multi-temporal assessment of forest cover, stocking parameters and above-ground tree biomass dynamics in Miombo Woodlands of Tanzania. Afr. J. Environ. Sci. Technol. 2013, 7, 611–623. [Google Scholar] [CrossRef]
- Kuželka, K.; Marušák, R. KORFit: An efficient growth function fitting tool. Comput. Electron. Agric. 2015, 116, 187–190. [Google Scholar] [CrossRef]
- Rozenstein, O.; Karnieli, A. Comparison of methods for land-use classification incorporating remote sensing and GIS inputs. Appl. Geogr. 2011, 31, 533–544. [Google Scholar] [CrossRef]
- Leguizamón, S.; Pelgrum, H.; Azzali, S. Unsupervised Fuzzy C-means classification for the determination of dynamically homogeneous areas. Rev. SELPER 1996, 12, 20–24. [Google Scholar]
- Fraisse, C.W.; Sudduth, K.A.; Kitchen, N.R. Delineation of Site-Specific Management Zones by Unsupervised Classification of Topographic Attributes and Soil Electrical Conductivity. Trans. ASAE 2001, 44, 155–166. [Google Scholar] [CrossRef]
- Dhodhi, M.K.; Saghri, J.A.; Ahmad, I.; Ul-mustafa, R. D-ISODATA: A Distributed Algorithm for Unsupervised Classification of Remotely Sensed Data on Network of Workstations. J. Parallel Distrib. Comput. 1999, 301, 280–301. [Google Scholar] [CrossRef]
- Alessandrini, A.; Biondi, F.; Di Filippo, A.; Ziaco, E.; Piovesan, G. Tree size distribution at increasing spatial scales converges to the rotated sigmoid curve in two old-growth beech stands of the Italian Apennines. For. Ecol. Manag. 2011, 262, 1950–1962. [Google Scholar] [CrossRef]
- De Lima, R.B.; Bufalino, L.; Alves Júnior, F.T.; da Silva, J.A.A.; Ferreira, R.L.C. Diameter distribution in a Brazilian tropical dry forest domain: Predictions for the stand and species. An. Acad. Bras. Cienc. 2017, 89, 1189–1203. [Google Scholar] [CrossRef] [PubMed]
- Felfili, J.M. Diameter and height distributions in a gallery forest tree community and some of its main species in central Brazil over a six-year period (1985–1991). Rev. Bras. Bot. 1997, 20, 155–162. [Google Scholar] [CrossRef]
- Bohn, F.J.; Huth, A. The importance of forest structure to biodiversity—Productivity relationships. R. Soc. Open Sci. 2017, 4, 160521. [Google Scholar] [CrossRef] [PubMed]
- Nduwayezu, J.B.; Mafoko, G.J.; Mojeremane, W.; Mhaladi, L.O. Vanishing multipurpose indigenous trees in Chobe and Kasane Forest Reserves of Botswana. Resour. Environ. 2015, 5, 167–172. [Google Scholar] [CrossRef]
- Kalaba, F.K.; Quinn, C.H.; Dougill, A.J.; Vinya, R. Floristic composition, species diversity and carbon storage in charcoal and agriculture fallows and management implications in Miombo woodlands of Zambia. For. Ecol. Manag. 2013, 304, 99–109. [Google Scholar] [CrossRef] [Green Version]
- Sanfilippo, M. Trinta Árvores e Arbustos do Miombo Angolano; COSPE Firenze: Firenze, Italy, 2014. [Google Scholar]
- Astrup, R.; Coates, K.D.; Hall, E. Finding the appropriate level of complexity for a simulation model: An example with a forest growth model. For. Ecol. Manag. 2008, 256, 1659–1665. [Google Scholar] [CrossRef]
- Barreto, C.G.; Drummond, J.A.L. Strategic planning in Brazilian protected areas: Uses and adjustments. J. Environ. Manag. 2017, 200, 79–87. [Google Scholar] [CrossRef] [PubMed]
- Edwards, D.; de Abreu, G.C.G.; Labouriau, R. Selecting high-dimensional mixed graphical models using minimal AIC or BIC forests. BMC Bioinform. 2010, 11, 18. [Google Scholar] [CrossRef] [PubMed]
- Hofstad, O.; Araya, M.M. Optimal wood harvest in miombo woodland considering REDD + payments—A case study at Kitulangalo Forest Reserve, Tanzania. For. Policy Econ. 2015, 51, 9–16. [Google Scholar] [CrossRef]
- Abbot, P.G.; Lowore, J.; Werren, M. Models For the Estimation of Single Tree Volume in Four Miombo Woodland Types (Vol 97, Pg 25, 1997). For. Ecol. Manag. 1998, 107, 325–326. [Google Scholar]
- Chabi, A.; Lautenbach, S.; Orekan, V.O.A.; Kyei-Baffour, N. Allometric models and aboveground biomass stocks of a West African Sudan Savannah watershed in Benin. Carbon Balance Manag. 2016, 11, 16. [Google Scholar] [CrossRef] [PubMed]
- Truax, B.; Gagnon, D.; Lambert, F.; Fortier, J. Multiple-use zoning model for private forest owners in agricultural landscapes: A case study. Forests 2015, 6, 3614–3664. [Google Scholar] [CrossRef]
- Nylund, J.-E. Forestry Legislation in Sweden; Swedish University of Agricultural Sciences, Institutionen för Skogens Produkter: Uppsala, Sweden, 2009. [Google Scholar]
- Barklund, Å. The Swedish Forestry Mode; Royal Swedish Academy of Agriculture and Forestry: Stockholm, Sweden, 2009. [Google Scholar]
- UHUL. Regional-Plans-of-Forest-Development @ www.uhul.cz. Available online: http://www.uhul.cz/what-we-do/regional-plans-of-forest-development (accessed on 27 April 2018).
- UHUL. Pracovní Postupy Pozemního Šetření NIL2. 2013. Available online: http://www.uhul.cz/images/nil/pracovni_postupy/pp_NIL2_2_2013.pdf (accessed on 27 April 2018).
- Tuček, P.; Caha, J.; Janoška, Z.; Vondráková, A.; Samec, P.; Bojko, J.; Voženílek, V. Forest vulnerability zones in the Czech Republic. J. Maps 2014, 10, 179–182. [Google Scholar] [CrossRef]
- Gnip, P.; Charvat, K. Management of zones in precision farming. Zemed. Ekon. (Agric. Econ.) 2003, 49, 416–418. [Google Scholar] [CrossRef]
- Nilsson, M.; Wästerlund, D.; Wahlberg, O.; Eriksson, L. Forest planning in a Swedish company–a knowledge management analysis of forest information. Silva Fenn. 2012, 46, 717–732. [Google Scholar] [CrossRef]
- Helmfrid, S. Forests and forestry in Sweden. GeoJournal 1991, 24, 432. [Google Scholar] [CrossRef]
- Wilhelmsson, E. Forest Management Planning for Private Forest Owners in Sweden. In Proceedings of the ELAV seminar, Koli, Finland, 23–24 March 2006; Volume 1993, pp. 52–60. [Google Scholar]
- Elz, I.; Tansey, K.; Page, S.; Trivedi, M. Modelling Deforestation and Land Cover Transitions of Tropical Peatlands in Sumatra, Indonesia Using Remote Sensed Land Cover Data Sets. Land 2015, 4, 670–687. [Google Scholar] [CrossRef] [Green Version]
- Winterbach, H.E.K.; Winterbach, C.W.; Somers, M.J. Landscape suitability in Botswana for the conservation of its six large African carnivores. PLoS ONE 2014, 9, e100202. [Google Scholar] [CrossRef] [PubMed]
- Namukonde, N.; Kuebler, D.; Ganzhorn, J.U. Differential Effects of Fire on Small Mammal Communities in the Busanga Flood Plain, Zambia. Trop. Conserv. Sci. 2017, 10, 194008291772543. [Google Scholar] [CrossRef]
- Mugasha, W.A.; Bollandsås, O.M.; Gobakken, T.; Zahabu, E.; Katani, J.Z.; Eid, T. Decision-support tool for management of miombo woodlands: A matrix model approach. South. For. J. For. Sci. 2017, 79, 65–77. [Google Scholar] [CrossRef]
- Dewees, P.A.; Campbell, B.M.; Katerere, Y.; Sitoe, A.; Cunningham, A.B.; Angelsen, A.; Wunder, S. Managing the miombo woodlands of Southern Africa: Policies, incentives and options for the rural poor. J. Nat. Resour. Policy Res. 2010, 2, 57–73. [Google Scholar] [CrossRef]
- Chirwa, P.W.; Syampungani, S.; Geldenhuys, C.J. The ecology and management of the Miombo woodlands for sustainable livelihoods in southern Africa: The case for non-timber forest products. South. For. 2008, 70, 237–245. [Google Scholar] [CrossRef]
- Delgado-Matas, C. Optimal Management of the Umbundu Traditional Land Use System in the Central Highlands Region of Angola. Ph.D. thesis, University of Eastern Finland, Kuopio, Finland, 2015. [Google Scholar]
- Grundy, I. Regeneration and Management of Brachystegia spiciformis and Julbernardia globiflora in Miombo Woodlands of Zimbabwe. Ph.D. Thesis, University of Oxford, Oxford, UK, 1995. [Google Scholar]
- Syampungani, S.; Geledenhuys, C.; Chirwa, P.W. Age and growth rate determination using growth rings of selected miombo woodland species in charcoal and, slash and burn regrowth stands in Zambia. Ecol. Nat. Environ. 2010, 2, 167–174. [Google Scholar]
- Tetemke, B.A.; Gebremedhin, K.G.; Gebremedhin, D.G. Determination of Growth Rate and Age Structure of Boswellia papyrifera from Tree Ring Analysis: Implications for Sustainable Harvest Scheduling. Momona Ethiop. J. Sci. 2016, 8, 50. [Google Scholar] [CrossRef]
Figure 1.
Study area and distribution of plots Layout into classified land cover zones.

Figure 2.
Representation of data collection in miombo. The circle on the right represents the plot area and the small circles inside represent individual trees. The other small circle on the left represents the villages surveyed with a questionnaire survey (minimum distance 4 km from plots).
Figure 2.
Representation of data collection in miombo. The circle on the right represents the plot area and the small circles inside represent individual trees. The other small circle on the left represents the villages surveyed with a questionnaire survey (minimum distance 4 km from plots).

Figure 3.
Preferred species for charcoal production.

Figure 4.
Abundance of the tree species in the classified land cover zones.

Figure 5.
Diameter class distribution of miombo tree species The numbers in the parentheses represent the total count of the species collected. Part (A) shows Brachystegia boehmii (94 trees in open miombo and 30 trees in closed miombo), part (B): Albizia antuneziana (56 trees in open miombo and 67 in closed miombo), part (C): Pericopsis angolensis (17 trees in open miombo), part (D): Brachystegia spiciformis (230 trees in open miombo and 58 in closed miombo), part (E): Erythina spp. (51 individuals in open miomno) and part (F): Pterocarpus angolensis (16 trees in open miombo).

Figure 6.
Illustration of time required for individual trees to reach DBH by different models.

Figure 7.
Representation of the suggested management zones.

Table 1.
Details of the Landsat-8 images used; all images had a resolution of 15 m.
| ID Product | Acquisition Date | Path | Row |
|---|---|---|---|
| LC08_L1TP_180068_20171013_20171024_01_T1 | 13 October 17 | 180 | 68 |
| LC08_L1TP_180070_20171013_20171024_01_T1 | 13 October 17 | 180 | 70 |
| LC08_L1TP_180069_20171013_20171024_01_T1 | 13 October 17 | 180 | 69 |
| LC08_L1TP_179069_20171006_20171023_01_T1 | 6 October 17 | 179 | 69 |
| LC08_L1TP_179070_20171006_20171023_01_T1 | 6 October 17 | 179 | 70 |
Table 2.
Major characteristics of the respondents.
| Variables | Respondents |
|---|---|
| Gender (% female) | 15.5 |
| Age (average value) | 42 |
| Household size (average number of persons) | 6 |
| Education (Average year of schooling) | 2 |
| Forest ownership (% inheritance) | 68 |
| Producer of charcoal (%) | 35 |
Table 3.
Characteristics of trees species in the study area.
| Species Name | DBH (cm) | Height (m) | Volume/ha (m3·ha−1) | ||||
|---|---|---|---|---|---|---|---|
| Mean ± SD | Min | Max | Mean ± SD | Min | Max | Mean | |
| Albizia antunesiana | 31.85 ± 15.43 | 14.3 | 75.2 | 6.33 ± 3.51 | 3.5 | 15.7 | 0.4 |
| Anisophyllea boehmii | 30.89 ± 16.7 | 7.5 | 41.6 | 6.17 ± 3.58 | 3 | 7.8 | 0.45 |
| Ansophia boehmii | 25.8 ± 9.2 | 16.5 | 41.2 | 4.94 ± 1.56 | 3.1 | 6.7 | 0.39 |
| Brachystegia boehmii | 28.96 ± 16.4 | 6.6 | 86.4 | 5.3 ± 2.52 | 1.7 | 14.2 | 0.45 |
| Brachystegia spiciformis | 28.95 ± 16.3 | 15.7 | 65.95 | 6.05 ± 3.5 | 2.5 | 17.2 | 0.55 |
| Erythrina abyssinica | 29.6 ± 16.35 | 6.3 | 40.5 | 6.33 ± 3.5 | 3.2 | 9.8 | 0.39 |
| Gardinia volkensii | 29.14 ± 16.4 | 19.8 | 39.2 | 6.02 ± 3.5 | 3.3 | 13.2 | 0.4 |
| Hymenocardia acida | 27.6 ± 11.8 | 7.8 | 86.4 | 5.24 ± 2.52 | 1.6 | 17.2 | 0.38 |
| Ochna schweinfurthiana | 29.6 ± 16.4 | 6.7 | 39 | 6.2 ± 3.54 | 1.4 | 12.2 | 0.39 |
| Parinari curatellifolia | 28.09 ± 10.95 | 6 | 54.9 | 5.52 ± 2.35 | 1.36 | 9.8 | 0.4 |
| Pericopsis angolensis | 31.2 ± 18.7 | 9.7 | 43.9 | 6.1 ± 3.5 | 2.18 | 8 | 0.39 |
| Pterocarpus angolensis | 31.54 ± 18.7 | 14.3 | 115.2 | 6.7 ± 4.2 | 1.5 | 13.2 | 0.39 |
| Sylzygium guineense | 29.7 ± 16.2 | 8.4 | 124.3 | 6.11 ± 3.56 | 1.9 | 17.2 | 0.42 |
| Uapaca kirkiana | 29.89 ±16.4 | 12.4 | 64 | 6.3 ± 3.5 | 1.6 | 11.2 | 0.39 |
Table 4.
Growth rate rings of the species investigated.
| Species | Family | Local Name | Samples (Cores) | Growth Rate Rings (cm/year) | MCD * (Growth Range Year) | Main Utilization |
|---|---|---|---|---|---|---|
| Albizia antunesiana | Fabaceae | Osesse | 5 | 0.96 | 20 (25–45) | Charcoal, firewood, and sculpture manufacturing |
| Brachystegia boehmii | Fabaceae | Ussamba | 6 | 0.7 | 20 (30–60) | Most preferred for charcoal production |
| Brachystegia spiciformis | Fabaceae | Omanda | 10 | 1.2 | 20 (15–30) | Timber, charcoal |
* MCD is the minimum cutting diameter. The number in parentheses indicates the growth range a particular tree needs to reach the minimum cutting diameter of at least 20 cm.
Table 5.
Fitted statistics parameters for miombo tree species.
| Tree Species | Model Growth Function | Fit Statistics | |||||||
|---|---|---|---|---|---|---|---|---|---|
| b1 | b2 | b3 | b4 | R-Square | RMSE | AIC | p-Value | ||
| Albizia antunesiana | Logistic y = (b1/(1 + b3 × exp (−b2 × DBH))) | 77.92 | 0.046 | 7.58 | 0.96 | 3.86 | 628.83 | 0.00001 | |
| Sloboda y = (b1 × exp (1 − b2 × exp (b3 × DBHb4))) | 129.37 | 3.19 | 0.057 | 0.75 | 0.97 | 3.70 | 620.2 | 0.0063 | |
| Brachystegia boehmii | Logistic y = (b1/(1 + b3 × exp (−b2 × DBH))) | 78.10 | 0.045 | 7.58 | 0.96 | 3.93 | 599.0 | 0.00015 | |
| Michajlov y = b1 × exp (−b2/H) | 18.07 | 23.98 | 0.55 | 1.67 | 90.9 | 0.004 | |||
| Gompertz y = b1 × exp (−b2) × exp(−b3.H) | 76.05 | 4.58 | 0.042 | 0.95 | 2.95 | 323.06 | 0.0004 | ||
| Brachystegia spiciformis | Sloboda y = (b1 × exp (1 − b2 × exp (b3 × DBHb4))) | 185.83 | 199.9 | 3.16 | 0.14 | 0.98 | 3.78 | 663.74 | 0.0002 |
| Korf y = b1 × exp(b2)/(1 − b3) × H (b3 − 1) | 92.66 | 38.48 | 2.4 | 0.99 | 2.12 | 397.90 | 0.0021 | ||
Table 6.
Characterization of the suggested management zones.
| Management Zones (MZ) | Main Characteristics |
|---|---|
| MZ 0—A |
|
| MZ 1—B |
|
| MZ 2—C |
|
| MZ 3—D |
|
| MZ 4—E |
|
© 2018 by the authors. Licensee MDPI, Basel, Switzerland. This article is an open access article distributed under the terms and conditions of the Creative Commons Attribution (CC BY) license (http://creativecommons.org/licenses/by/4.0/).
Share and Cite
MDPI and ACS Style
Chiteculo, V.; Surovy, P. Dynamic Patterns of Trees Species in Miombo Forest and Management Perspectives for Sustainable Production—Case Study in Huambo Province, Angola. Forests 2018, 9, 321. https://doi.org/10.3390/f9060321
AMA Style
Chiteculo V, Surovy P. Dynamic Patterns of Trees Species in Miombo Forest and Management Perspectives for Sustainable Production—Case Study in Huambo Province, Angola. Forests. 2018; 9(6):321. https://doi.org/10.3390/f9060321
Chicago/Turabian StyleChiteculo, Vasco, and Peter Surovy. 2018. "Dynamic Patterns of Trees Species in Miombo Forest and Management Perspectives for Sustainable Production—Case Study in Huambo Province, Angola" Forests 9, no. 6: 321. https://doi.org/10.3390/f9060321
Note that from the first issue of 2016, this journal uses article numbers instead of page numbers. See further details here.