Sustainability Assessment of Alternative Thinning Operations in Mediterranean Softwood Plantations
by
 , ,
, ,
Janine Schweier
1,* ,
,
Raffaele Spinelli
2,
Natascia Magagnotti
2,
Bernhard Wolfslehner
3 and
Manfred J. Lexer
4 1
Albert-Ludwigs-University of Freiburg, Werthmannstraße 6, 79085 Freiburg, Germany
2
CNR–IVALSA, Via Madonna del Piano 10, I-50019 Sesto Fiorentino (FI), Italy
3
Central-East and South-East European Regional Office of the European Forest Institute, Department of Economics and Social Sciences, University of Natural Resources and Life Sciences, Vienna (BOKU), Feistmantelstr. 4, A-1180 Vienna, Austria
4
Department of Forest and Soil Sciences, University of Natural Resources and Life Sciences, Vienna (BOKU), Peter-Jordan-Strasse 82, A-1190 Vienna, Austria
*
Author to whom correspondence should be addressed.
Forests 2018, 9(7), 375; https://doi.org/10.3390/f9070375
Submission received: 20 April 2018
/
Revised: 13 June 2018
/
Accepted: 15 June 2018
/
Published: 21 June 2018
(This article belongs to the Special Issue Ecological Management of Pine Forests)
Abstract
:Mediterranean pines account for 14,000 ha in Tuscany alone, where they form large and homogeneous stands and represent an important resource for the forest economy. Among the harvesting systems applied to thinning operations, the most popular are whole-tree and cut-to-length harvestings. Both systems can be deployed with different levels of mechanization. The decision about which system might be the best option in a specific case possibly leads to conflicts due to different management goals, for instance when the shift from cut-to-length to whole-tree harvesting systems results in a decrease of costs and an increase of environmental burdens. Thus, an accurate determination of economic, environmental and social indicators is crucial to make balanced decisions. With that in mind, we carried out a sustainability impact assessment of typical forest-wood chain alternatives applied to young Mediterranean pine plantations and made a comparative evaluation by means of multi-criteria analyses. Trials were carried out in umbrella pine (Pinus pinea L.) plantations in Tuscany. The analyzed cases considered four thinning operations and included the processes of harvesting, extraction and chipping. In the analysis, 12 indicators were considered (e.g., global warming potential, fatal accidents). Results of the investigation allow quantifying possible sustainability impacts and, thus, supporting management decisions.
1. Introduction
Mediterranean pines represent a group of highly adaptable species that include Pinus brutia, Pinus halepensis, Pinus nigra, Pinus pinaster and others such as Pinus pinea L. as the main representatives. These are specifically adapted to the fire regime that characterizes the area and play a central role in the vegetation dynamics of the Mediterranean regions [1]. Their aggressive colonizing strategy explains the rapid occupation of abandoned fields, as well as a relatively simple silviculture [2]. The total surface occupied by these pines is estimated at 13 million ha, or 25% of the total forest area of the Mediterranean basin. In regions like North Africa and Anatolia, Mediterranean pines may account for up to 75% of the total forest area [3]. The adaptability, rapid early growth and general colonizing capacity explain why Mediterranean pines have been traditionally used for reforestation projects and often form extensive plantations.
Umbrella pine (Pinus pinea L.) likely occupies the smallest area among Mediterranean pines, and yet, it accounts for almost 14,000 ha in Tuscany alone, where it forms large and homogeneous stands along the coastal region and represents an important resource for the forest economy [4].
The mainstream silvicultural prescription for umbrella pine stands is two to four thinning operations, followed by clear-cutting and replanting or re-naturalization, if the quality of the hardwood understory is good [5]. Among the many harvesting systems applied to thinning operations, the most popular are whole-tree (WT) and cut-to-length (CTL) harvesting. The former consists of felling trees and extracting them whole (stem, top and branches) to the landing, which offers the advantages of simplified in-forest handling and increased volume recovery. The latter describes a logging method where the felled trees are processed into commercial assortments already in the forest [6]: that requires laborious in-stand tree processing, but results in lower organic matter removals, which is especially desirable for poorer sites, where organic fertility may be a serious issue [7,8].
Both WT and CTL harvesting can be deployed with different levels of mechanization. In the motor-manual (MM) version, trees are felled or felled and processed with chainsaws, and the product is extracted with skidders, forwarders or forestry-fitted farm tractors [9]. Motor-manual harvesting is especially suited to self-employed forest owners and small contractors, with limited investment capacity [10]. At the other end of the scale, fully-mechanized (FM) harvesting is implemented: fully-mechanized whole-tree (FM-WT) harvesting is applied by feller-bunchers and grapple skidders. Self-propelled feller-bunchers are designed to fell standing trees and arrange them in bunches along skid roads, ready for pick-up by grapple skidders. Fully-mechanized cut-to-length (FM-CTL) harvesting is applied by harvesters, which are designed to combine felling and processing. Harvesters are also capable of stacking cut logs into neat piles by the strip road, where forwarders pick them up and carry them to the landing.
The intersection of the two harvesting systems with the two mechanization levels generates four possible options, each with its own specific pros and cons, especially as concerns financial performance, environmental impact and social consequences. These should be discussed carefully before deciding for or against any specific option.
Different management goals will favor different aspects of system performance, and yet, most managers will aim at financial sustainability and minimum adverse impacts on the natural environment and the community. For this reason, it is important to determine with some accuracy the financial, environmental and social performance of each individual option. With that in mind, we carried out a sustainability impact assessment (SIA) for the product obtained from the thinning of umbrella pine plantations, under the four technical choices derived from the intersection of the two harvesting systems and the two mechanizations described above and customarily applied to these stands. SIA methods have been specifically developed for this task, namely to evaluate how management choices influence the economic, environmental and social dimensions of system sustainability [11]. In addition, a multi-criteria analysis (MCA) was applied to compare alternative management scenarios on a cumulative preference scale. The results of our investigation will support management decisions by offering accurate information about sustainability indicators. Results for different indicators are often conflicting, and an accurate determination of these indicators is crucial to make balanced decisions that may reflect specific management goals. In particular, the specific objectives of this study are to apply an SIA to the typical forest-wood chain alternatives that can be applied to the thinning of umbrella pine plantations and to make comprehensive evaluations of the alternative forest-wood chains. Strictly speaking, the external validity of the study results is limited to umbrella pine plantations under similar conditions to those encountered in the study. However, the general trends found with this experiment could be extended to young pine plantations, although with much caution.
2. Materials and Methods
2.1. Approach
The SIA was carried out to determine the impacts with regard to sustainability of four alternative forest-wood chains, applied to umbrella pine plantations in Central Italy. This method was proposed by [12,13]. According to them, a proper SIA should be comprised of the following characteristics: (i) supply chains are described as a set of processes; (ii) each process is characterized by a set of sustainability indicators; (iii) the total amount of material flowing through the processes is the basis for assessing the overall sustainability impact; and (iv) an analysis of the trade-offs between the characteristics is carried out to assess holistically the impact of changes between the proposed alternatives.
2.2. Supply Chain Modelling
The so-called “cradle-to-gate” approach was applied, meaning that the analysis was restricted to a selected life cycle stage [14]. In our case, the study concentrates on the harvesting, extraction and chipping of trees. Four alternative thinning operations were modelled as forest-wood chains, as follows: Chain 1 = 1-MM-WT (motor-manual whole-tree harvesting); Chain 2 = 2-MM-CTL (motor-manual cut-to-length harvesting); Chain 3 = 3-FM-WT (fully-mechanized whole-tree harvesting) and Chain 4 = 4-FM-CTL (fully-mechanized cut-to-length harvesting). The chipping operations did not differ between the cases. According to the modelling rules [13] in each process, the wood material changes its appearance and/or moves to another location. Thus, the SIA builds on the conceptual representation of forest-wood chains as chains of value-adding production processes [15].
Modelling was carried out with the dedicated software Umberto (v 5.6), developed by IFU Hamburg GmbH [16]. With Umberto, material flow networks are created allowing one to model material and energy flows occurring in the system.
2.3. System Description and Boundaries
In all cases, the system boundaries covered the felling, extraction and chipping processes used in four alternative second thinning operations. In 1-MM-WT and 2-MM-CTL, trees were felled with chainsaws (Husqvarna 357XP, 3.2 kW) by professional operators and skidded to the roadside landing with a forestry-fitted farm tractor (Valtra 6400, 75 kW), equipped with a forestry winch. In 2-MM-CTL, trees were also delimbed and crosscut into random lengths (4–7 m) before skidding. In 3-FM-WT, trees were felled and bunched with a 27-t tracked feller buncher (JD759 J, 164 kW) and skidded to the roadside with a rubber-tired grapple skidder (JD460 G, 127 kW). In 4-FM-CTL, trees were felled, delimbed and crosscut to random lengths (4–7 m) with a 14-t four-wheel harvester (JD870 B, 114 kW), while logs were extracted to the roadside with a 10-t capacity forwarder (JD1110 B, 121 kW). In all cases, chipping was performed about four months after harvesting and extraction by a forwarder-mounted drum chipper (Erjo 12/90, 370/129 kW).
System boundaries were designated to be from where machines are brought to the working sites to where the wood chips are discharged into chip vans. Therefore, transport of personnel and equipment to the work site, as well as transport of the chips to the final destination were not considered. The building of roads and road maintenance were not included. In contrast, the production of materials and machines, so-called indirect or upstream processes, was considered within the boundaries. The CO2 uptake due to tree growth and its release to the environment after biomass oxidation at the end of the life cycle was not considered, as well as changes in the soil organic matter stocks, the latter due to rare long-term data.
2.4. Selection of Sustainability Indicators
The indicators selected for the calculations were relevant and balanced with regard to economic, environmental and social sustainability, as well as feasibility in terms of data availability and quality [17]. In the present study, a set of 12 indicators was chosen (Table 1) to be analyzed based on existing indicator sets, e.g., [18,19]. The most relevant economic indicators were production costs, productivity and working delays. Production costs include all fixed and variable machine costs, as well as personnel costs. Productivity describes the machine performance per productive machine hour, and delays express nonproductive working times caused by mechanical, personnel or operational issues.
Concerning site impact, field measurements covered tree damage (frequency and severity), soil compaction and biomass retention, i.e., the amount of tops and branches left on site after harvesting. Biomass retention may offer a first indication about the potential for nutrient depletion, even when the actual amount of nutrients left on site is not determined. Biomass retention is relatively easy to gauge and is used here for comparing the risk for soil nutrient impact under the two treatments considered with this study. The basic concept is that a larger biomass retention for one of the treatments will point at a proportionally lower risk for soil nutrient depletion compared with the other treatment. This indicator does not define risk in absolute terms (i.e., quantity of nutrients released per ha), but only in relative terms, which is consistent with the comparative character of the study.
Besides the well-known environmental impact category global warming potential (GWP) and the cumulated energy demand (CED) of fossil energy, results were presented in the following environmental impact categories: eutrophication potential (EP), acidification potential (AP) and photochemical ozone creation potential (POPC). All of them are important categories for biomass cultivation and distribution and are highly influenced by nitrous and carbon oxides, which are of special interest to coastal pine plantations along the Tyrrhenian coast and generally in Central Italy, where most of such stands are included within natural reserves, under special conservation rules (e.g., Parco Regionale di San Rossore, Tenuta di Castel Porziano, Parco Nazionale del Circeo).
When it comes to societal aspects, attention was focused on fatal accident and employment rate, both of which are strongly impacted by the treatment of young stands.
2.5. Indicator Calculation
The system modelling outcome served as the basis for the comparative environmental and social-economic analysis. The analysis of environmental impacts (GWP, EP, AP, POPC) focused on technical aspects of the alternative operations and followed the ISO 14040 guidelines [20], which prescribe the inclusion of indirect impacts (e.g., machinery used, material transportation; cf. [11]). The database Ecoinvent (vs. 2.3) developed by the Swiss Centre for Life Cycle Inventories [21] was used to determine the impacts of the different thinning operations. Thereby, specific characteristics of the analyzed machines (weight, lifetime, duration of use) were considered. The Ecoinvent database is implemented in the modelling software Umberto and provides emission data for numerous materials (e.g., diesel). These emission data are then linked to the environmental categories to which they contribute (e.g., CO2 to GWP).
In order to report the energy efficiency (EE), the CED of fossil energy was calculated, also by use of Umberto and Ecoinvent. The EE shows how much fossil energy is required to produce one unit of renewable energy.
Damage of trees by the harvest operations was determined by inspecting all residual trees according to the method described by [22]. Results refer to the total amount of trees damaged and, thus, do not relate to single operations. Wounds with an exposed surface <10 cm² were not recorded. Soil compaction was determined by collecting undisturbed core samples before and after harvests, as described in detail in [23]. Samples do not refer to single operations, but to the total area.
Statistical data are neither available for the accidents occurring during the thinning of Italian coastal pine plantations, nor for working accidents in Italian forestry in general, since the Italian work accident statistics lump forestry and agriculture together. Therefore, it is not possible to determine with any accuracy the number and severity of work accidents per unit product, nor to discriminate between different forest-wood chains and mechanization levels. However, a good proxy was found in the statistical data provided in the international scientific literature. In particular, Ref. [24] provide the fatal accidents among professional forest workers reported in the national statistics of Austria, Finland, Slovenia, Sweden and Switzerland. While these data do not discriminate between different forest-wood chains (i.e., CTL- vs. WT harvesting), they can be used to discriminate between mechanized and motor-manual operations, on the assumption that over 90% of the operations in Finland and Sweden are fully mechanized, while operations in the other countries are motor-manual to a large extent [25]. Based on this reasoning, the number of fatalities per m³ recorded in the two Nordic countries was converted into a per tonne figure and the result, 0.03 fatalities per million tonnes, was assumed as the reference for mechanized operations. The fatality rate for motor-manual operations was estimated from the mean data for Austria, Slovenia and Switzerland and amounted to 0.22 fatalities per million green tonnes (10−6 gt).
The effect of the alternative operations on employment rate was calculated from the productivity data actually recorded in the study, after inflating these data for crew size and assuming 1510 h per year as full employment of one worker unit (FTE). Machine costs referred to Euros (€) per productive machine hour (PMH) and were calculated with the harmonized method developed within the scope of European COST Action FP0902 [26]. Delay time was reported separately in order to calculate delay factors [27,28], i.e., the ratio of delay time to productive working time. Data related to time input, fuel consumption and machine productivity were determined with a time study as reported in detail in [23] (see the Data Collection Section).
2.6. Biomass Removal and Retention
Table 2 indicates how much biomass was removed per alternative; cf. [23]. The concentration of nutrients within different biomass components was not determined. Conversely, biomass retention (tops and branches) was determined on twenty 1 × 1-m sample plots per treatment, using an improved version of the protocol developed by the Australian Forest Operations Research Alliance at the University of the Sunshine Coast [29]. Before locating the plots, the sampled area was divided in two strata according to the residual biomass load, in order to increase the accuracy of sampling and reduce the number of required sample plots. After that, 50 sample plots per corridor were located systematically on the terrain, and each of them was attributed to one of the strata. From the original 50 plots, 20 plots were selected randomly for measurement, reflecting the proportion between the strata. Then, all tops and branches on each plot were manually collected and weighed, using a portable electronic scale, accurate to ±10 g. Since stumps were not harvested under either treatment and the assessment was a comparative one, stump biomass was not determined.
2.7. Multi-Criteria Analysis
MCA is a methodology to structure a decision problem (e.g., by means of indicators) and provide a formal model to compare a finite number of alternatives on a one-dimensional preference scale [30]. MCA has been richly taken up as a decision-support tool in forest management planning and practice as documented in scientific literature; cf. [31,32]. As in [33], the Promethee method [34] was employed in this application to compare four thinning operations via 12 environmental, economic and social impact indicators. In this method, preference information is required at two levels: (i) weights of importance for indicators; and (ii) preferences regarding when one alternative dominates another with regard to one of the indicators (i.e., the selection and definition of preference functions). The pair-wise comparisons of alternatives with regard to the evaluation criteria (i.e., indicators) result in a summed-up and weighed degree of dominance of one alternative over another and a cardinal ranking of all examined alternatives.
These two sources of preference information were modelled in an experimental way. First, we assumed equal weights for clusters of economic, environmental and social indicators (1/3 each). This means that in clusters with more indicators (4 economic, 6 environmental, 2 social indicators), these have a lower relative weight because of the distributive effect, which is a feasible way to smoothen an imbalance of representation in a decision-making problem [35]. A second arrangement, in absence of empirical preference information, is to set the preference threshold, i.e., where strict preference of one alternative over another will be applied, for each indicator to 10% of the highest value. For all indicators, a V-shape preference function has been applied; cf. [34].
2.8. Stand
Comparative trials were carried out in pine plantations located near Pisa, Italy, inside the Regional Park of San Rossore, which encloses a surface of about 3000 ha and is covered in a large part by umbrella pine plantations. This area is a typical example for the wider cohort of pine plantations growing along the coastlines of Southern Europe, where they have been established and managed for many centuries [3].
When the first thinning was conducted in 2002, all alternate rows had been removed, so that spacing at the time of the second thinning was 5 × 2.5 m. In the second thinning in 2014, trials were conducted of a 15-hectare tract, consisting of a 21-year old umbrella pine plantation. Selection of trees to remove was left to the logger, whose main task was to create enough space around candidate trees. Detailed information regarding site and thinning characteristics, as well as machineries is reported in [23,36].
2.9. Data Collection and Assumptions
Fuel input was determined by refilling all machine tanks at the end of each working day and recording the amount of fuel used during that day. This figure was divided by stopwatch hours and prorated to each plot based on the hours actually needed to harvest it. Wood moisture content was determined according to the European standard CEN/TS 14774-2 on the determination of moisture content, on one 500-g chip samples per load. These samples were obtained from the reduction of larger 3 L samples collected at different places within the same load. Data about utilization and maintenance of machines and value recovery were obtained directly from the machine owners and are described in [23].
3. Results
3.1. Material Flow and System Productivity
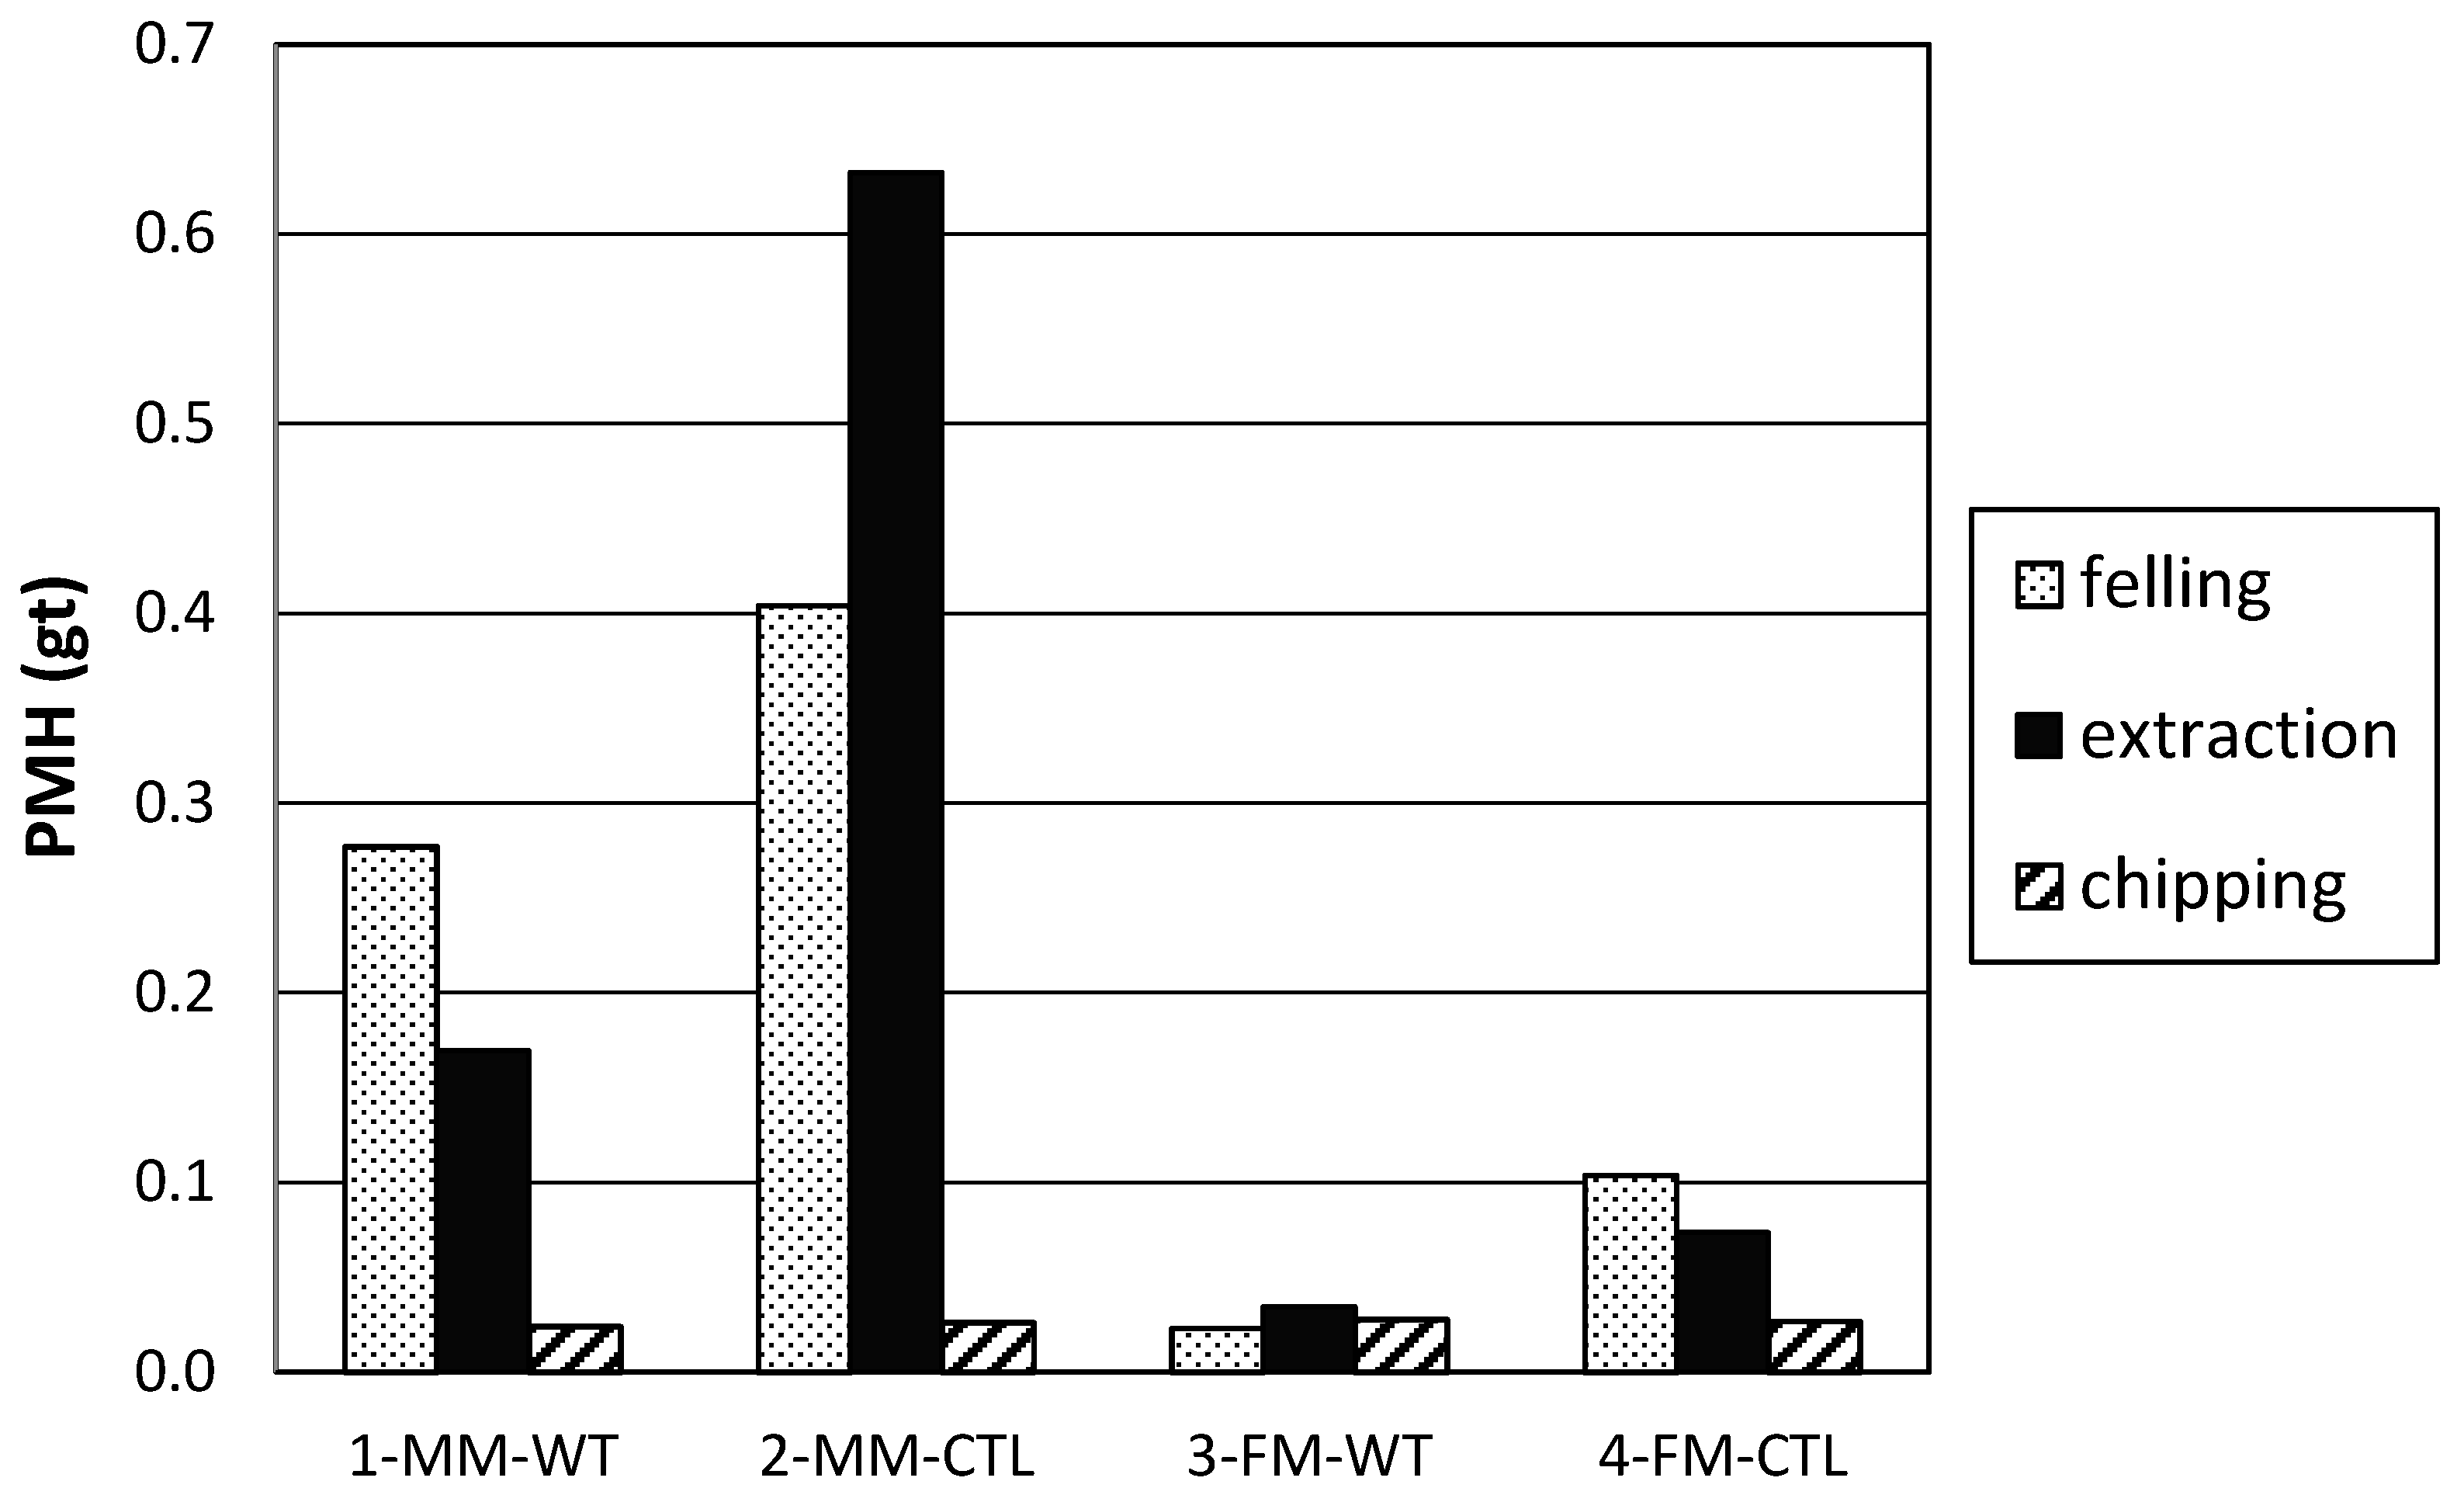
Table 2 shows the amount of harvested biomass for each alternative. The volume harvested was much lower when CTL harvesting was applied, compared with WT harvesting. Average productivity was also lower with CTL, for the same mechanization level (0.0237–0.0165 PMH gt−1 in 2-MM-CTL and 4-FM-CTL compared to 0.0196–0.0092 PMH gt−1 in 1-MM-WT and 3-FM-WT). Figure 1 shows the specific productivity by treatment and work phase. As reported by [23], felling and extraction productivity were significantly different between treatments, whereas chipping productivity was not. Mechanization allowed a dramatic increase of labor productivity. With mechanization, felling-processing productivity increased eight times and felling-bunching productivity 20 times. Extraction productivity increased from 6–8 times, as a result of mechanization. Shifting from CTL to WT harvesting resulted in productivity increases between 40% and 270%, depending on the work step and mechanization level.
The highest share of delays occurred in the chains with manual harvesting operations. In both cases, delay time was 29.7% of the total working time compared to 11.7–14.4% in the mechanized cases (4-FM-CTL, 3-FM-WT) (Table 3). When looking at the harvesting process only, the share of delays was 54.0% in 1-MM-WT and 2-MM-CTL, while it was 10.0–19.0% in 4-FM-CTL and 3-FM-WT. The resulting delay factors were 42 in 1-MM-WT and 2-MM-CTL, 17 in 3-FM-WT and 13 in 4-FM-CTL.
3.2. Indicator Results
Relative indicator results per gt of wood chips are presented in Table 3. The sum is shown in bold letters, and the process causing highest impacts in each chain is highlighted in italic letters.
The economic indicator production costs followed the same pattern as the system productivity: forest-wood chains with motor-manual harvesting operations were significantly more expensive (40.36–77.19 € gt−1 in 1-MM-WT and 2-MM-CTL) than those applying fully-mechanized harvesting systems (9.99–19.28 € gt−1 in 3-FM-WT and 4-FM-CTL, Table 3): in 1-MM-WT, the manual felling was responsible for 69% and in 2-MM-CTL for 52% of the production costs. In the latter case, extraction was very time consuming and expensive (42% of costs).
When considering social indicators, the amounts of fatal accidents and FTEs were significantly higher in manual than in mechanized systems. The rate of accidents varied between 0.2108 and 0.2168 fatalities 10−6 gt−1 (2-MM-CTL, 1-MM-WT) compared to 0.0283–0.0259 fatalities 10−6 gt−1 (4-FM-CTL, 3-FM-WT) and, thus, was 7.5–8.4 times higher in manual cases (Table 3).
The rate of FTE 1000 gt−1 was 6.4–14.7-times higher in manual cases, as well, compared to mechanized cases: indicator results varied between 1.7659 and 0.9729 FTE 1000 gt−1 (2-MM-CTL, 1-MM-WT) vs. 0.1520 and 0.0664 FTE 1000 gt−1 (4-FM-CTL, 3-FM-WT) (Table 3).
It turned out that the percentage of tree damage also increased when shifting from FM to MM and from CTL to WT harvesting. Between 1.5% and 15% of the residual trees presented wounds larger than 10 cm² (Table 3). However, the 15% figure (2-MM-CTL) could be excluded from the comparison (cf. [23]), which results in a wounding frequency range between 1.5% and 6%.
In contrast, the other environmental indicators significantly depended on the choice of the applied system (CTL/WT). The GWP is highly influenced by the fuel consumption. As shown previously [23], mechanization entailed a reduction of fuel consumption between 10% and 40%. Shifting from mechanized CTL to manual WT harvesting allowed reducing fuel consumption by 19%. Differences were statistically significant between motor-manual CTL harvesting and all other treatments, as well as of harvesting system and mechanization level. The calculated GWP was 2.37–2.49 kg CO2-eq. gt−1 (3-FM-WT, 1-MM-WT) when WT harvesting was applied and 3.85–5.55 kg CO2-eq. gt−1 (4-FM-CTL, 2-MM-CTL) when CTL harvesting was applied (Table 3). Potential impacts caused by the extraction process in 2-MM-CTL were seven-times higher compared to the best case (3-FM-WT). In 2-MM-CTL, the use of fuel and lubricants contributed 43% to this result and the machinery 57%, while it was almost the opposite (58% and 42%) in the case of 3-FM-WT, which shows that the extraction process was sub-optimal in 2-MM-CTL.
The CED of fossil energy (Table 3) was much lower, as well, when WT harvesting was applied. It varied between 137.75 and 156.14 MJ gt−1 (3-FM-WT, 1-MM-WT) compared to 227.92 and 314.27 MJ gt−1 (4-FM-CTL, 2-MM-CTL). Assuming an average energy content of about 9200 MJ per tonne (moisture content = 45%), the resulting energy ratios are respectively 66.7, 59.0, 40.4 and 20.3. In the first named, 3-FM-WT, this means that 66.7 units of fossil energy are necessary to generate one unit of renewable energy from biomass. The analysis of the other environmental categories EP, POPC and AP confirmed that the CTL harvesting system led to significantly higher impacts than WT harvesting systems (Table 3), in the manual case (2-MM-CTL) due to the low productivity in the extraction system and in the mechanized case (4-FM-CTL) due to the high fuel consumption during the harvesting operation. Furthermore, results showed that only CTL harvesting caused soil compaction. However, the increase was low, ranging from 8.8–11.9% of the original value (Table 3). In 1-MM-WT, soil compaction was indicated to be negative (−1.2%) because the machines loosened up the soil and, thus, caused disturbance.
When looking at the total indicator results per hectare (Table 4), one needs to have in mind that a comparable amount of trees was harvested in all cases, but a greater amount of biomass was mobilized in 1-MM-WT and 3-FM-WT (Table 2). This may lead to changing results, e.g., in the category EP, the lowest impacts were expected in 3-FM-WT when looking at results per gt, while the value was equal in 3-FM-WT and 4-FM-CTL when looking at the results per ha (cf. GWP and accidents) (Table 4).
3.3. Multi-Criteria Analysis of Harvesting Operations
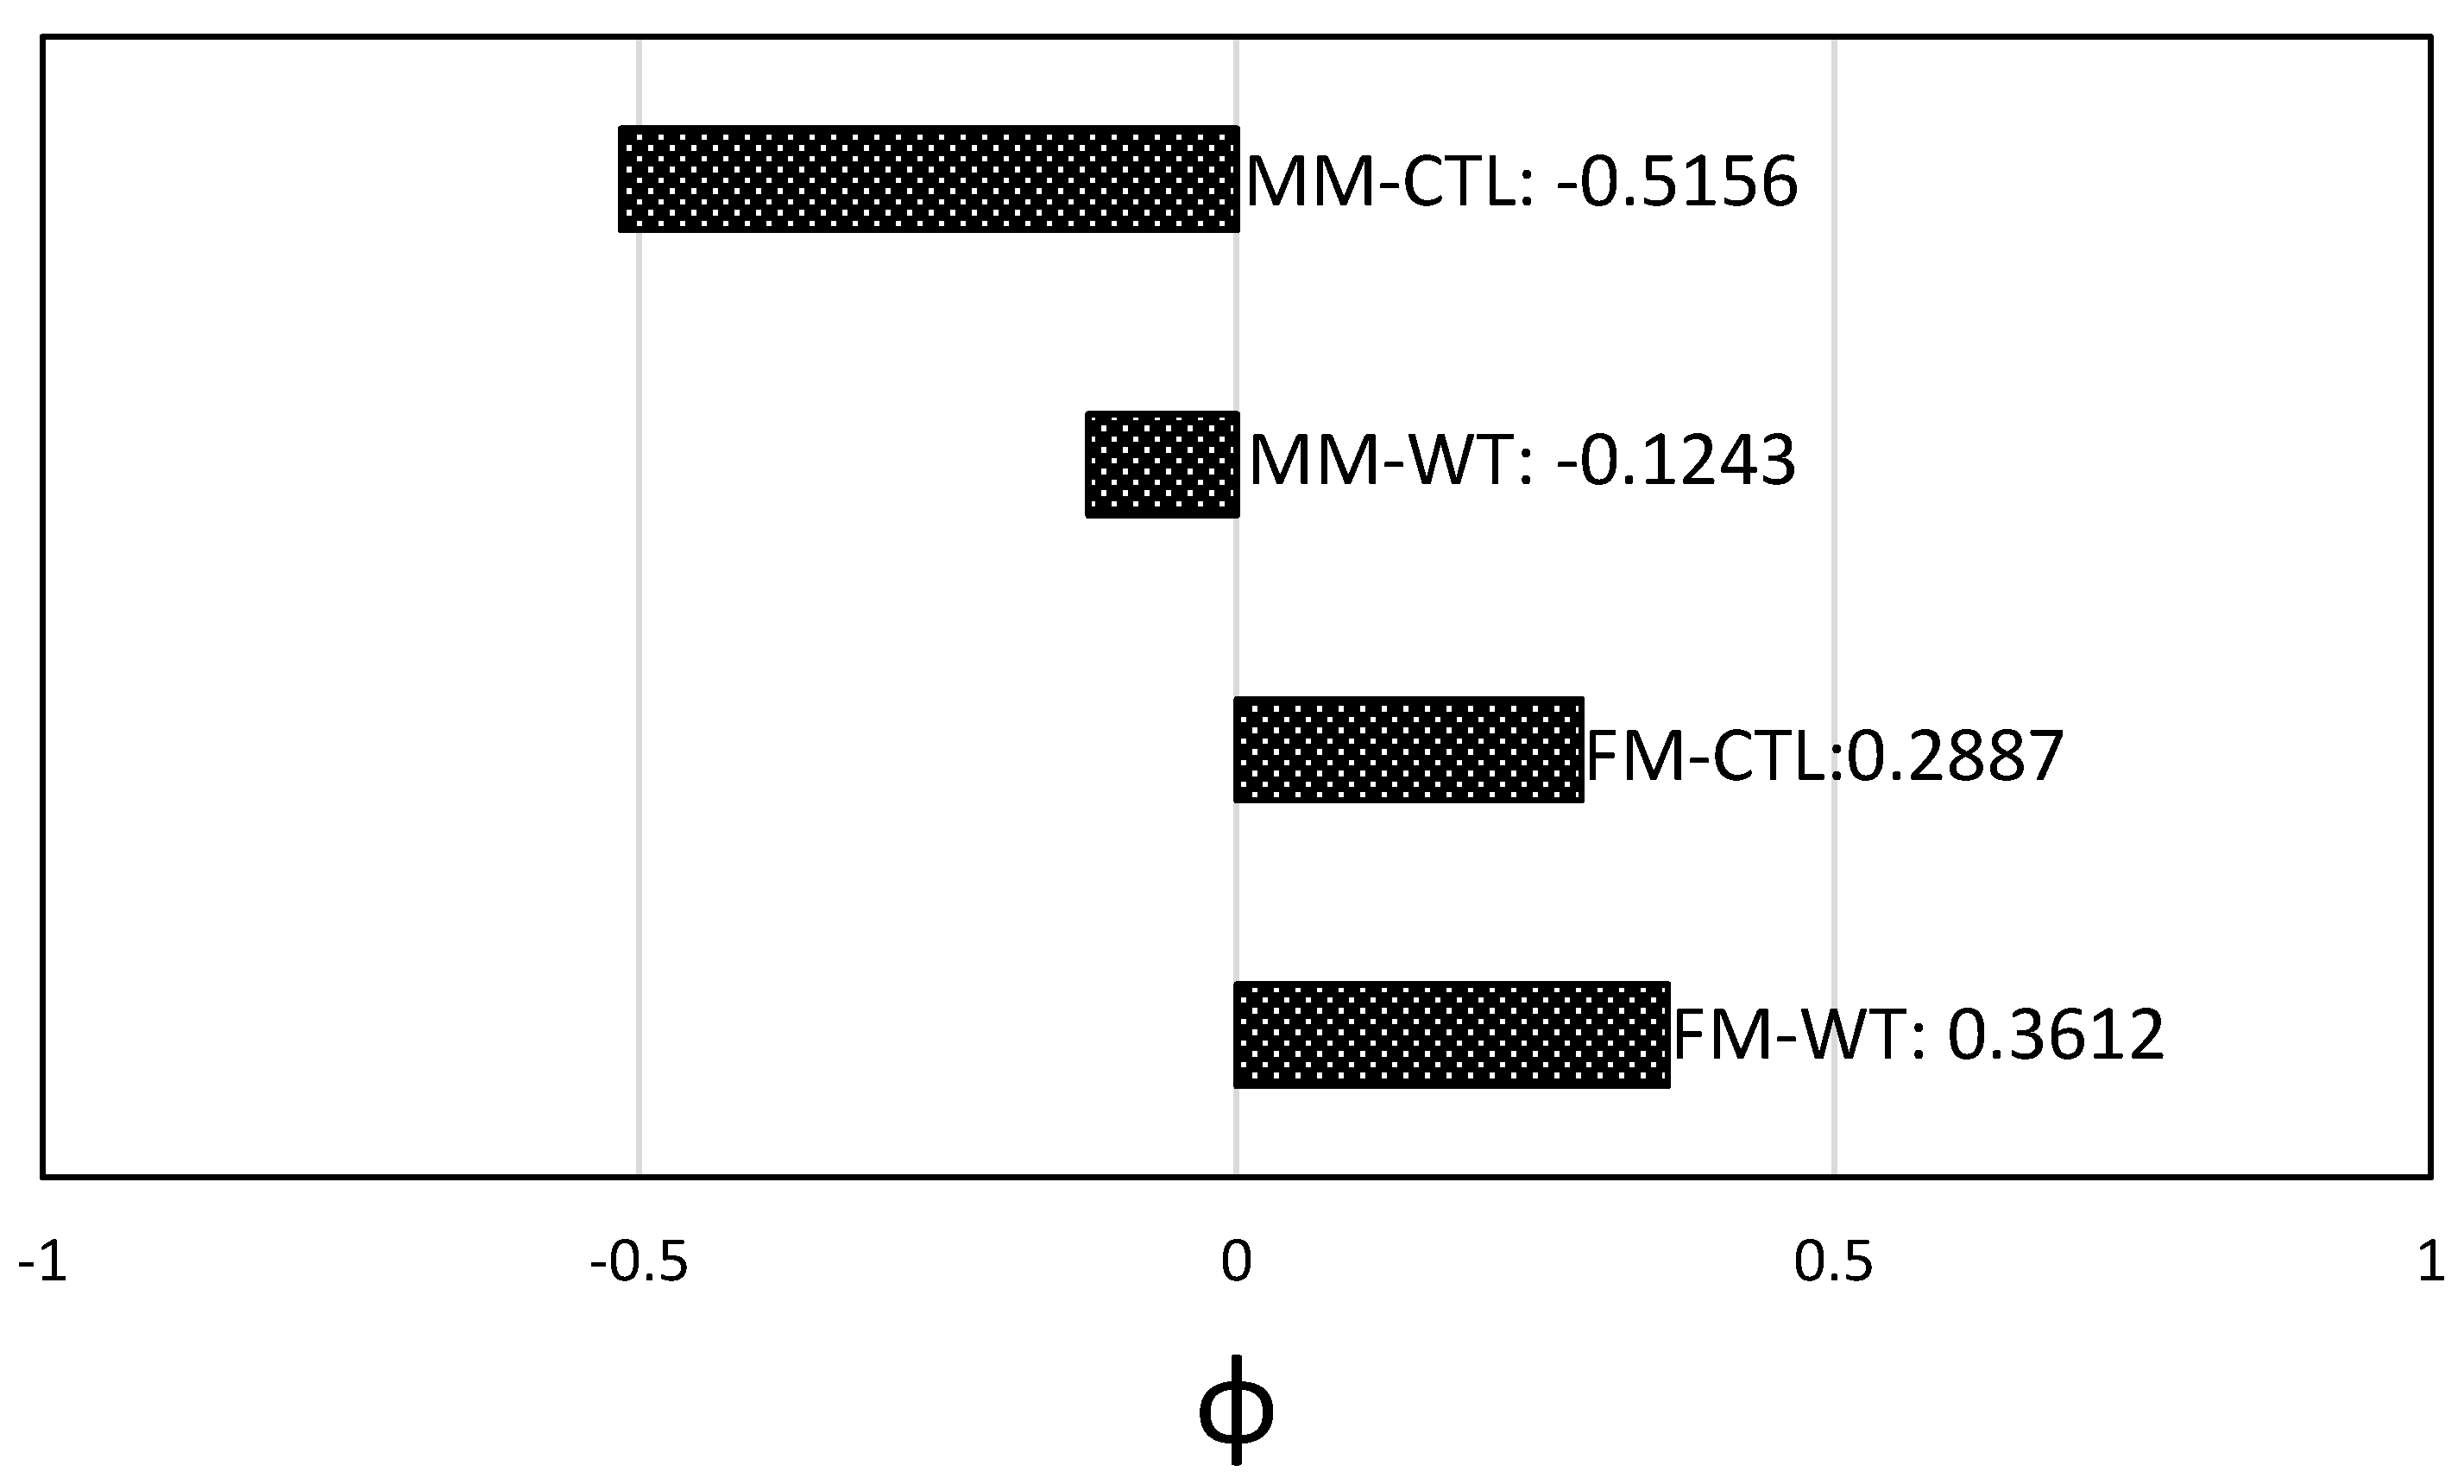
The MCA of the four harvesting alternatives (Figure 2 and Figure 3) was based on per hectare results for the 12 indicators (Table 1).
The overall ranking results of the four alternative thinning operations showed a robust preference for both FM alternatives (Figure 2). The difference in the overall preference value ϕ between FM-WT (0.3612) and FM-CLT (0.2887) was relatively small, while MM alternatives showed both negative overall preference values with MM-CLT (−0.5156) having a much larger preference than MM-WT (−0.1343) (Figure 2).
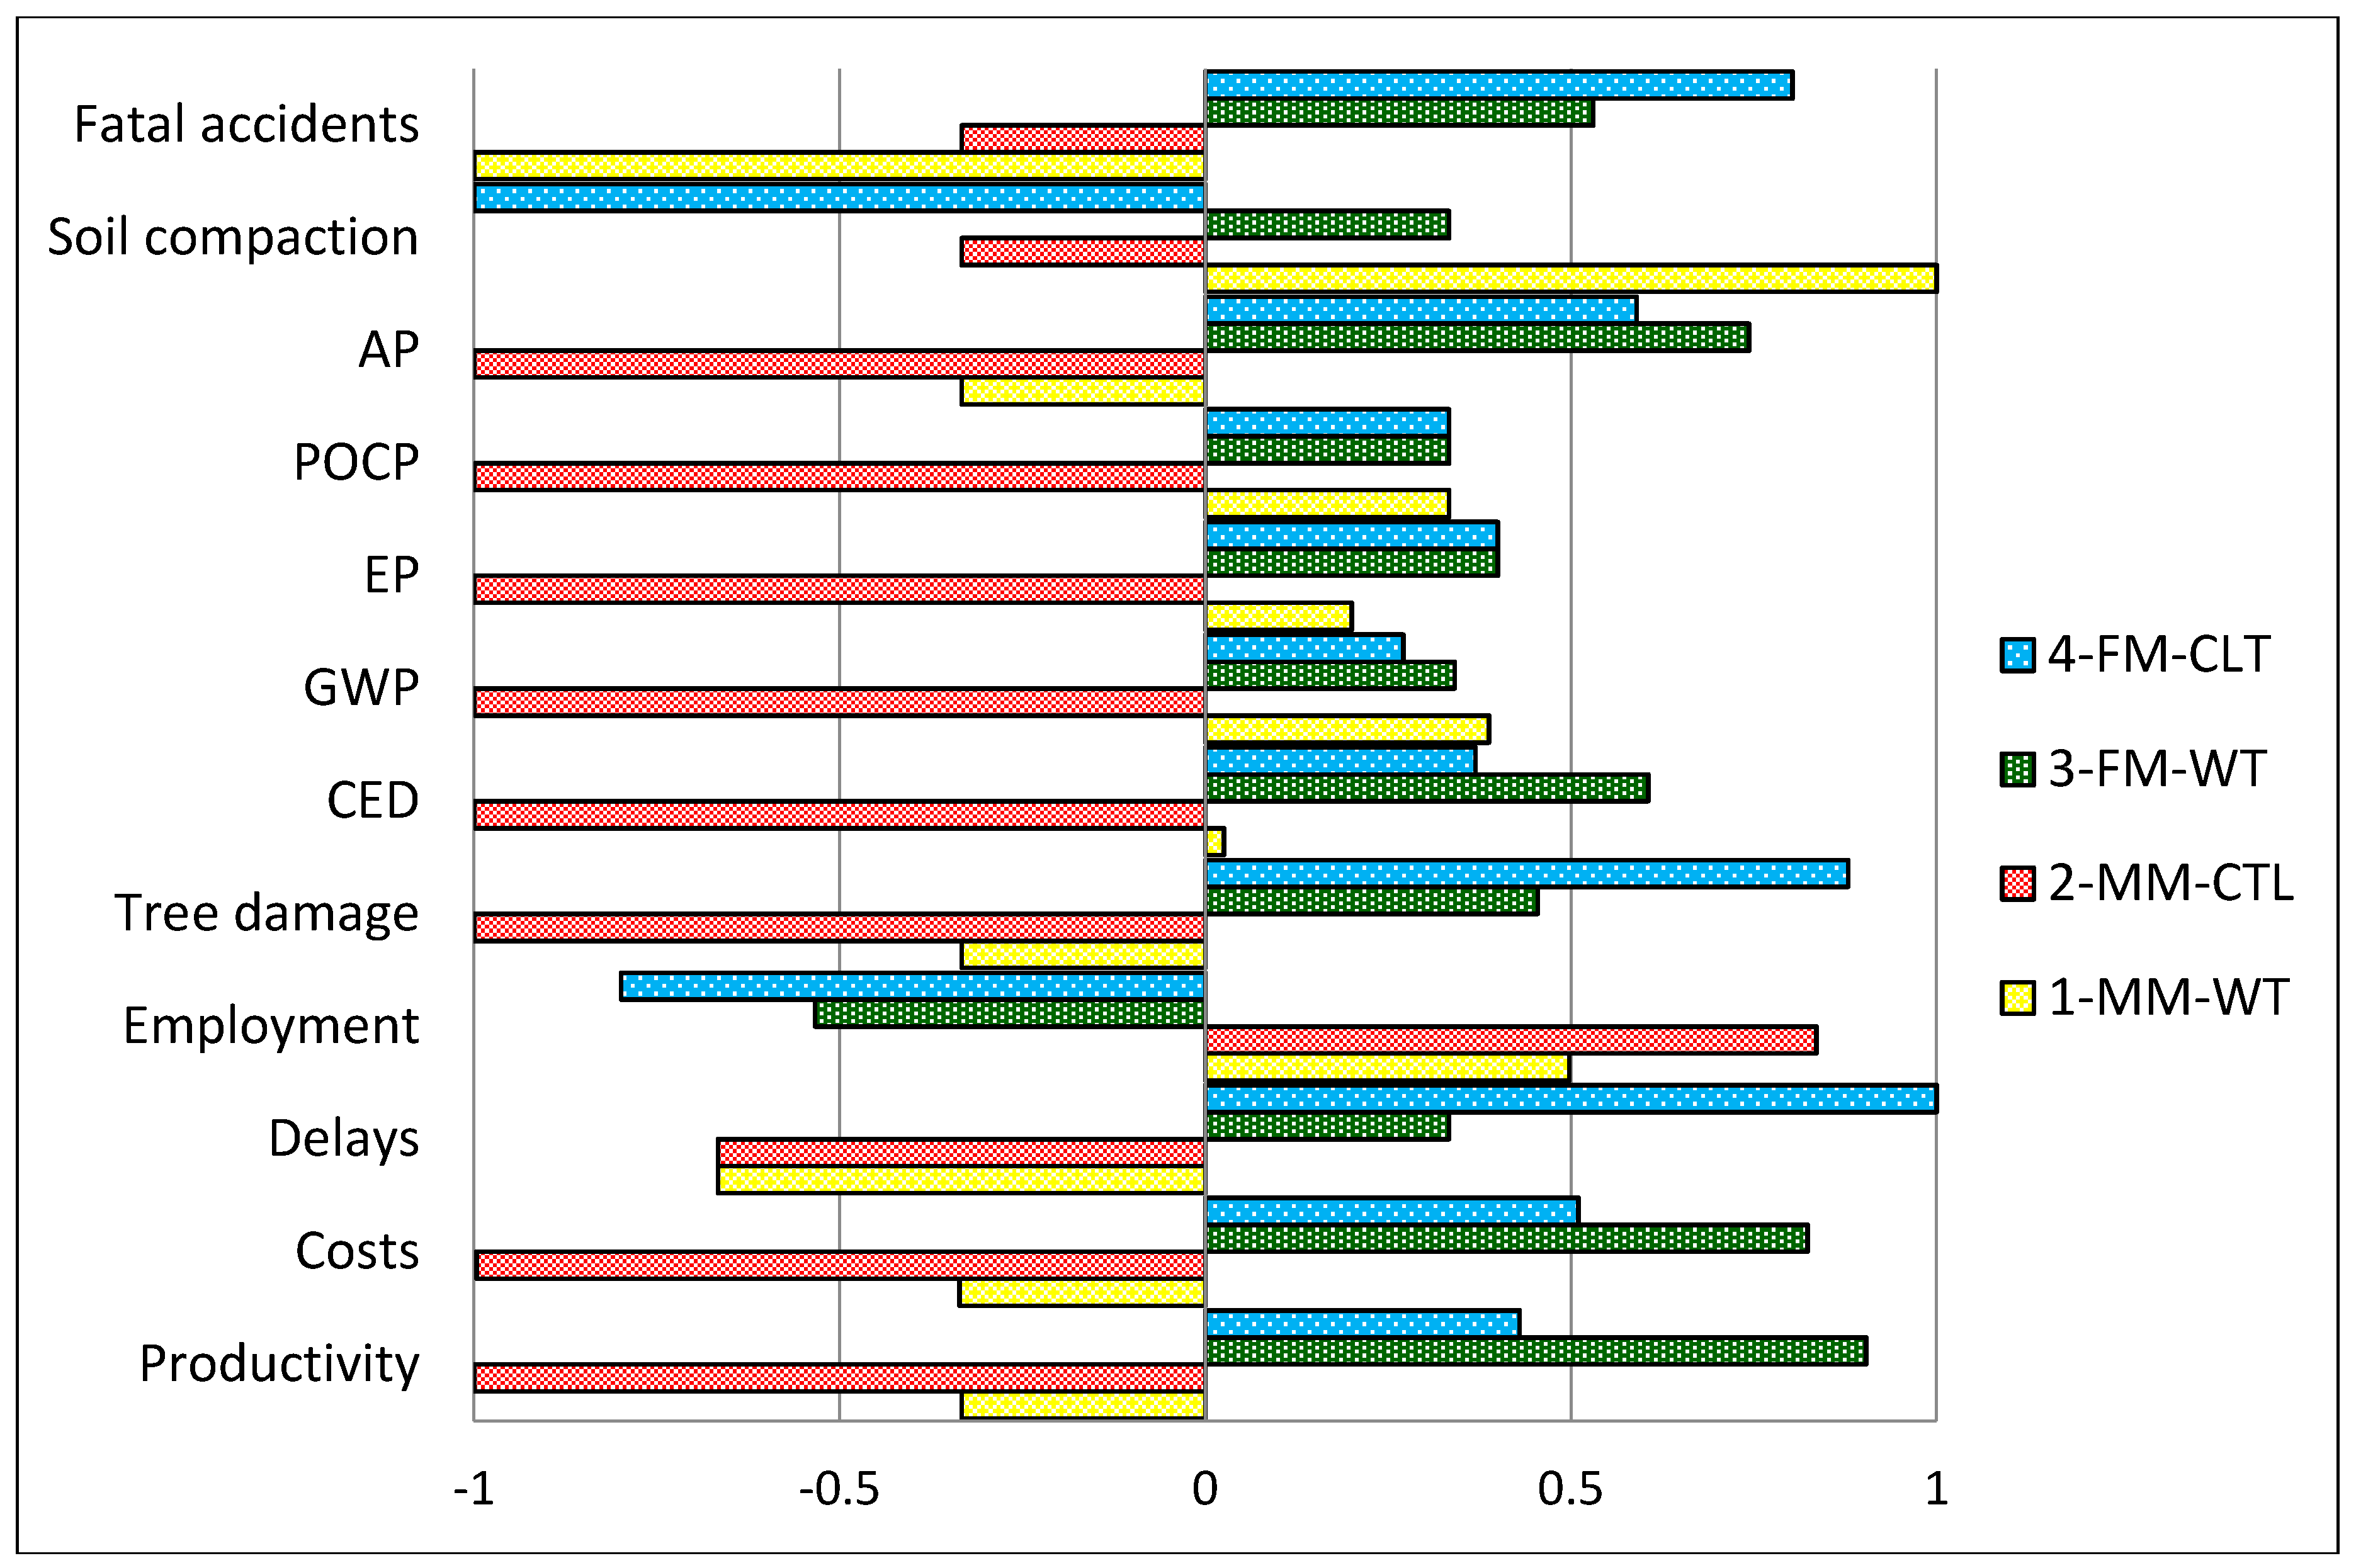
A deeper look into the action profiles of the alternatives, i.e., their performance in each indicator, reveals the reasons for the overall ranking (Figure 3). It shows that FM alternatives consequently have positive net flows apart from employment, while MM-CTL is not competitive in eight out of 12 indicators.
Pre-empting a full sensitivity analysis, the examination of stability intervals unravels the sensitivity of the ranking of alternatives to changing indicator weights. This analysis shows only increased weights for indicators ‘tree damage’ (weight > 21.69%), ‘GWP’ (weight > 79.52%), ‘soil compaction’ (weight > 22.02%), ‘fatal accidents’ (weight > 34.24%) and ‘employment’ (weight > 37.24%), while maintaining the initial weight relations in other indicators could change the overall ranking results.
4. Discussion
A major challenge of forest management is to consider the consequences of different management strategies and to estimate the financial, environmental and social performance of each individual option before an action is carried out. It is important to consider different pillars of sustainability and to link environmental impacts to socio-economic activities in order to guide decision-makers in their actions and to ensure that the impacts of their decisions are measured. With that in mind, we carried out an SIA for felling, processing and extraction of four alternative thinning operations in Mediterranean softwood plantations. The system boundaries included all steps necessary for turning standing trees in the forest into whole-tree chips loaded on trucks and ready for delivery to the mill.
Twelve indicators were considered to be important and feasible with regard to data collection. Input data were gathered mainly from field studies and in the case of fatal accidents from statistics. Respective indicator values were calculated by the use of different tools, e.g., potential environmental impacts of exhaust gases under the use of the Ecoinvent database and Umberto, a tool for life cycle assessments. Previous studies have shown that the use of several indicators and the combination of different methods to calculate indicator values lead to a strong analytical power for embracing financial, technological, environmental and other aspects of a production system, e.g., [37]. In particular, the feature of Umberto to include ‘own’ indicators and data, as well as data from the database Ecoinvent turned out to be efficient and productive. However, although a significant effort was made to collect realistic input data, there were some limitations, e.g., in the accuracy of the indicators, as results reflect average cost and emission values only or in the generalization of the results, as soil compaction for example is highly complex. Furthermore, system boundaries need to be considered when interpreting results. For instance, the transport of personnel and equipment to the work site was not included in our study, which would be a weak point if this were of major importance. There are numerous variables influencing the overall sustainability of a product, a process or a system, and the challenge is to find the most important ones in a specific case.
Furthermore, it is well known that WT harvesting leads to a higher removal of biomass (cf. Table 2) and, thus, of nutrients [38], because branches and foliage account for a significant proportion of the total nutrients bound in trees. However, it is still uncertain whether the lower biomass retention after WT harvesting actually has any visible effects on forest growth, stability or diversity. Kaarakk et al. [39] assessed the effects of WT harvesting and conventional stem-only harvesting and found out that 10 years after the final harvest, repeated WT harvesting had a decreasing effect on total carbon and nitrogen pools in the combined organic and mineral soil layer. In another study [40], the effects of WT harvesting (needles left on site) and conventional stem-only harvesting were compared 30 years after clear-cutting of Norway spruces, and any significant treatment effects with regard to the amount of organic matter, the amounts of nutrients in the forest floor or the concentrations of foliar nutrients were found. In [41], the impacts of WT harvesting were distinguished according to the harvesting intensity (thinning, clear-cutting). The authors figured out that negative effects of WT harvesting were lower in thinning than in clear-cutting operations [41]. In [42], soil carbon and nitrogen contents were determined over a period of 15–16 years after clear-cutting of conifers in Sweden, and any conclusive evidence was obtained about a general effect of harvest intensity on soil carbon or nitrogen pools, but only site-specific impacts. To conclude, the long-term impacts of intensified forest harvesting on nutrient losses are not clear (cf. [43]), and it is most likely that regional site interactions influence the overall effect of increased removal [42,43]. As we did not determine the concentration of nutrients within the different biomass components, we can state from our results only that seven-times more residue biomass (34 vs. 4.3 t ha−1) was retained with CTL harvesting compared to WT harvesting.
The results have shown that highest productivities were reached in FM harvesting operations. Shifting from CTL to WT harvesting systems resulted in further productivity increases (Figure 1). The resulting monetary cost of felling, processing and extraction varied between 10 and 77 € gt−1 (Table 3) (≙ 19–147 € per oven dry tonne). Forest-wood chains with motor-manual harvesting operations were significantly more expensive (40–77 € gt−1 in 1-MM-WT and 2-MM-CTL, Table 3) than those applying fully-mechanized harvesting systems (10–19 € gt−1 in 3-FM-WT and 4-FM-CTL, Table 3). In addition, the highest share of delays occurred in the manual cases, in particular in the felling processes (Table 3 and Table 4). However, not only the level of mechanization, but also the applied harvesting system had a significant effect on the costs, as well as on the productivity: it decreased with increasing level of mechanization and when shifting from CTL to WT harvesting. Other studies comparing WT and CTL harvesting confirm the better performance of forest-wood chains applying WT harvesting, e.g., [44,45].
In contrast, environmental indicator values (CED, GWP, EP, POPC, AP) depended on the applied harvesting system and were much better when WT harvesting was applied compared to CTL harvesting. This can be explained due mainly to the productivity: in 4-FM-CTL, the felling process was four-times less productive than in 3-FM-WT, and in 2-MM-CTL, the extraction process was 3.7-times less productive and, thus, more fuel consuming than in 1-MM-WT (Table 3). As stated above, the use of a forestry trailer would have been more appropriate. As potential environmental impacts strongly depend on exhaust gases and the use of machineries, an increase in productivity would result in lower impacts at the same time.
With regard to soil compaction, it should be noted that only the CTL treatments caused a compaction. However, such an increase was very low, ranging from 8.8–11.9% of the original value. The density increase recorded for the mechanized CTL treatment was significantly higher than for the manual CTL treatment. As soil compaction is highly complex and a very recent research topic [46,47,48,49,50], further analysis should be conducted if this indicator is of crucial importance.
The rate of FTE 1000 gt−1 was 9.8–14.6-times higher in the manual cases (Table 4). However, one should have in mind that it is increasingly difficult to find skilled labor in many regions. A very important argument to further support the process of mechanization in felling operations is that many fatal accidents occur during manual felling operations [51], as also shown in this study. Therefore, replacing manual with mechanized felling is likely to result in a reduction of accident frequency and severity.
Based on the indicator results, an MCA was carried out. In general, an MCA provides a proven suite of methods for sustainability evaluation in the context of forest management [31,52,53,54,55]. In particular, its use in SIA of forest-wood chains has been demonstrated previously [33,56,57]. MCA strives at contributing a cumulative assessment of alternative options that combines all indicator performances into one common preference ranking. Having in mind that the total surface occupied by homogeneous pine stands is estimated at about 25% of the total forest area of the Mediterranean basin (=ca. 13 million ha), indicator results per hectare (Table 4) were quite impressive, such that the MCA is a very useful method to support the comparison of given alternatives, because associated impacts were huge and conflicting in some cases (e.g., 3-FM-WT and 2-MM-CTL). To give one example: managing “just” the 13,800-ha umbrella pine plantations in Italy with the thinning system presented in 3-FM-WT would result in overall production costs of 7.4 million €. In contrast, managing them with 2-MM-CTL would cost 31.5 million €.
The MCA results in the current application showed very robust preferences for the FM harvesting operations, while the difference between FM-WT and FM-CLT was rather small (<0.1 of total preference value ϕ). This indicates that a final selection of the most appropriate option cannot be generalized, but has to be scrutinized in more detail in a specific decision-making context. It is remarkable that MM-CLT is by far the least preferred option, since it has the highest negative preference values in eight out of 12 indicators. MM-WT might be a compromise solution, if entrepreneurial limitations (e.g., investment capital for mechanization, skills and workforce) are a major obstacle to pursue FM options. MCA has been used is an exploratory way, i.e., no real indicator weights by decision-makers or stakeholders were used. While this renders the MCA application incomplete to a certain extent, the sensitivity analysis is to give insights into the impact of changing weights. In this respect, the analysis of stability intervals shows very robust rankings, unless indicator weights for five of the indicators are increased beyond 100% of what has been assumed for the preference modelling. Even if a decision maker would state such preferences in a specific decision-making situation, such an unbalanced weighting scheme might compromise the underlying assumptions of a well-balanced concept of all sustainability aspects within the current understanding of sustainable forest management.
5. Conclusions
An SIA was conducted for typical forest-wood chain alternatives that can be applied to the thinning of pine plantations, which are widespread in the Mediterranean region. Four technical choices derived from the intersection of the two harvesting systems and two levels of them were analyzed with regard to 12 indicators considering economic, environmental and social aspects.
The results offered quantitative support to the assessments made by field experts, namely that mechanized harvesting operations should be preferred unless there are entrepreneurial limitations to pursue mechanized options and that motor-manual harvesting with a cut-to-length system is by far the least preferred option, due mainly to the time-extraction process by the forestry-fitted farm tractor.
Author Contributions
R.S. and N.M. performed the field experiments and calculated the economic indicators. J.S. set up the outline of the manuscript and performed the LCA. B.W. and M.J.L. ran the MCA. J.S., R.S. and N.M. analyzed the data. J.S. wrote the paper with contributions from all authors.
Acknowledgments
The corresponding author is supported by the European Social Fund and by the Ministry of Science, Research and Arts Baden-Württemberg. This research received no external funding.
Conflicts of Interest
The authors declare no conflict of interest. The founding sponsors had no role in the design of the study; the collection, analyses or interpretation of the data; the writing of the manuscript; nor in the decision to publish the results.
Abbreviations
| MM | motor-manual |
| FM | fully-mechanized |
| WT | whole-tree |
| CTL | cut-to-length |
| SIA | sustainability impact assessment |
| MCA | multi-criteria analysis |
| PMH | productive machine hours, exclusive of delays |
| gt | green tonne (fresh weight) |
| CED | cumulated energy demand |
| MJ | megajoules |
| EE | energy efficiency |
| GWP | global warming potential |
| CO2 | carbon dioxide |
| EP | eutrophication potential |
| PO4 | phosphate |
| POPC | photochemical ozone creation potential |
| AP | acidification potential |
| SO2 | sulfur dioxide |
| FTE | full-time equivalent |
References
- Tapias, R.; Climent, J.; Pardos, J.; Gil, L. Life histories of Mediterranean pines. Plant Ecol. 2004, 171, 53–68. [Google Scholar] [CrossRef]
- Mercurio, R.; Spinelli, R. Exploring the silvicultural and economic viability of gap cutting in Mediterranean softwood plantations. For. Stud. China 2012, 14, 63–69. [Google Scholar] [CrossRef]
- Barbero, M.; Loiser, R.; Quezel, P.; Richardson, D.; Romane, F. Pines of the Mediterranean basin. In Ecology and Biogeography of Pinus; Richardson, D., Ed.; Cambridge University Press: Cambridge, UK, 1998; pp. 153–170. ISBN 052-155-176-5. [Google Scholar]
- Mondino, G.; Bernetti, G. I tipi Forestali (Forest types); Regione Toscana, Giunta Regionale, Dipartimento dello Sviluppo Economico: Firenze, Italy, 1998; Available online: http://www.regione.toscana.it/-/i-tipi-forestali (accessed on 15 October 2017).
- Zerbe, S. Restoration of natural broad-leaved woodland in Central Europe on sites with coniferous forest plantations. For. Ecol. Manag. 2002, 167, 27–42. [Google Scholar] [CrossRef]
- Klvač, R. Forest Biomass Glossary; Cost Action FP0902; 2013. Available online: http://www.forestenergy.org/pages/cost-action-fp0902/glossary/ (accessed on 16 May 2018).
- Jacobson, S.; Kukkola, M.; Mälkönen, E.; Tveite, B. Impact of whole-tree harvesting and compensatory fertilization on growth of coniferous thinning stands. For. Ecol. Manag. 2000, 129, 41–51. [Google Scholar] [CrossRef]
- Smolander, A.; Kitunen, V.; Tamminen, P.; Kukkola, M. Removal of logging residue in Norway spruce thinning stands: Long-term changes in organic layer properties. Soil Biol. Biochem. 2010, 42, 1222–1228. [Google Scholar] [CrossRef]
- Kellogg, L.D.; Bettinger, P.; Studier, D. Terminology of Ground-Based Mechanized Logging in the Pacific Northwest; Research Contribution 1; Forest Research Laboratory, Oregon State University: Corvallis, OR, USA, 1993. [Google Scholar]
- Lindroos, O.; Lidestav, G.; Nordfjell, T. Swedish non-industrial private forest owners: A survey of self-employment and equipment investments. Small-Scale For. Econ. Manag. Policy 2005, 4, 409–425. [Google Scholar] [CrossRef]
- Tuomasjukka, D.; Athanassiadis, D.; Vis, M. Threefold sustainability impact assessment method comparison for renewable energy value chains. Int. J. For. Eng. 2017, 28, 116–122. [Google Scholar] [CrossRef]
- Lindner, M.; Suominen, T.; Palosuo, T.; Garcia-Gonzalo, J.; Verweij, P.; Zudin, S.; Päivinen, R. ToSIA. A tool for sustainability impact assessment of forest-wood-chains. Ecol. Model. 2010, 221, 2197–2205. [Google Scholar] [CrossRef]
- Päivinen, R.; Lindner, M.; Rosén, K.; Lexer, M.J. A concept for assessing sustainability impacts of forestry-wood chains. Eur. J. For. Res. 2012, 131, 7–19. [Google Scholar] [CrossRef]
- Institute for Environment, and Sustainability of European Commission. ILCD Handbook: Specific Guide for Life Cycle Inventory Data Sets; Publication Office of the European Union: Luxembourg, 2010; ISBN 978-92-79-19093-3. [Google Scholar]
- Päivinen, R.; Lindner, M. Assessment of sustainability of forestwood chains. In The Multifunctional Role of Forests-Policies, Methods and Case Studies; EFI Proceedings; Cesaro, L., Gatto, P., Pettenella, D., Eds.; European Forest Institute: Joensuu, Finland, 2008; pp. 153–160. [Google Scholar]
- Institut für Umweltinformatik (IFU). Umberto 5.6; IFU: Hamburg, Germany, 2011. [Google Scholar]
- Pülzl, H.; Prokofieva, I.; Berg, S.; Rametsteiner, E.; Aggestam, F.; Wolfslehner, B. Indicator development in sustainability impact assessment: Balancing theory and practice. Eur. J. For. Res. 2012, 131, 35–46. [Google Scholar] [CrossRef]
- OECD. Environmental Indicators. Towards Sustainable Development; OECD Publications: Paris, France, 2001. [Google Scholar]
- MCPFE (Ministerial Conference on the Protection of Forests in Europe). Improved Pan-European Indicators for Sustainable Forest Management; MCPFE Liaison Unit: Vienna, Austria, 2003; Available online: http://www.foresteurope.org/documentos/improved_indicators.pdf (accessed on 18 October 2017).
- International Organization of Standardization. ISO 14040: 2006. Environmental Management—Life Cycle Assessment—Principles and Framework; ISO: Geneva, Switzerland, 2006. [Google Scholar]
- Ecoinvent. Swiss Centre for Life Cycle Inventories; Ecoinvent Centre, Empa: St. Gallen, Switzerland, 2010; Available online: http://www.ecoinvent.org/ (accessed on 1 October 2014).
- Meng, W. Baumverletzungen durch Transportvorgänge bei der Holzernte—Ausmaß und Verteilung, Folgeschäden am Holz und Versuch ihrer Bewertung. Doctoral thesis, Selbstverl. d. Landesforstverwaltung Baden-Württemberg, Stuttgart, Germany, 1978; p. 159. [Google Scholar]
- Spinelli, R.; Lombardini, C.; Magagnotti, N. Effect of mechanization level and harvesting system on the thinning cost of Mediterranean softwood plantations. Silva Fenn. 2014, 48. [Google Scholar] [CrossRef]
- Klun, J.; Medved, M. Fatal accidents in forestry in some European countries. Croat. J. For. Eng. 2007, 28, 55–62. [Google Scholar]
- Blombäck, P.; Poschen, P.; Lövgren, M. Employment Trends and Prospects in the European Forest Sector; Geneva Timber and Forest Discussion Papers, European Forest Sector Outlook Study (EFSOS); United Nations: Geneva, Switzerland, 2003. [Google Scholar]
- Ackerman, P.; Belbo, H.; Eliasson, L.; de Jong, A.; Lazdins, A.; Lyons, J. The COST model for calculation of forest operations costs. Int. J. For. Eng. 2014, 25, 75–81. [Google Scholar] [CrossRef]
- Björheden, R.; Apel, K.; Shiba, M.; Thompson, M.A. IUFRO Forest Work Study Nomenclature; Swedish University of Agricultural Science, Department of Operational Efficiency: Garpenberg, Sweden, 1995. [Google Scholar]
- Spinelli, R.; Visser, R. Analyzing and estimating delays in harvester operations. Int. J. For. Eng. 2008, 19, 35–40. [Google Scholar]
- Ghaffariyan, M.R.; Andonovski, V.; Brown, M. Application of slash-bundler for collecting harvest restudies in Eucalyptus plantation. Silva Balcan 2011, 1–2, 83–89. [Google Scholar]
- Triantaphyllou, E.; Shu, B.; Nieto Sanchez, S.; Ray, T. Multi-Criteria Decision Making: An Operations Research Approach. In Encyclopedia of Electrical and Electronics Engineering; John Wiley & Sons: New York, NY, USA, 2015; Volume 15, pp. 175–186. [Google Scholar]
- Diaz-Balteiro, L.; Romero, C. Making forestry decisions with multiple criteria: A review and an assessment. For. Ecol. Manag. 2008, 255, 3222–3241. [Google Scholar] [CrossRef]
- Acosta, M.; Corral, S. Multicriteria decision analysis and participatory decision support systems in forest management. Forests 2017, 8, 116. [Google Scholar] [CrossRef]
- Wolfslehner, B.; Brüchert, F.; Fischbach, J.; Rammer, W.; Becker, G.; Lindner, M.; Lexer, M.J. Exploratory multi-criteria analysis in sustainability impact assessment of forest-wood chains: The example of a regional case study in Baden-Württemberg. Eur. J. For. Res. 2012, 131, 47–56. [Google Scholar] [CrossRef]
- Brans, J.P.; Vincke, P.; Mareschal, B. How to select and how to rank projects: The PROMETHEE method. Eur. J. Oper. Res. 1986, 24, 228–238. [Google Scholar] [CrossRef]
- Wolfslehner, B.; Vacik, H.; Lexer, M.J. Application of the Analytic Network Process in multi-criteria analysis of sustainable forest management. For. Ecol. Manag. 2005, 207, 157–170. [Google Scholar] [CrossRef]
- Spinelli, R.; Magagnotti, N.; Picchi, G. Complete tree harvesting as an alternative to mulching in early thinnings. For. Prod. J. 2009, 59, 79–84. [Google Scholar]
- Schweier, J.; Molina-Herrera, S.; Ghirardo, A.; Grote, R.; Díaz-Pinés, E.; Kreuzwieser, J.; Haas, E.; Butterbach-Bahl, K.; Rennenberg, H.; Schnitzler, J.-P.; et al. Environmental impacts of bioenergy wood production from poplar short rotation coppice grown at a marginal agricultural site in Germany. GCB Bioenergy 2016, 9, 1207–1221. [Google Scholar] [CrossRef]
- Achat, D.L.; Deleuze, C.; Landmann, G.; Pousse, N.; Ranger, J.; Augusto, L. Quantifying consequences of removing harvesting residues on forest soils and tree growth—A meta-analysis. For. Ecol. Manag. 2015, 348, 124–141. [Google Scholar] [CrossRef]
- Kaarakka, L.; Tamminen, P.; Saarsalmi, A.; Kukkola, M.; Helmisaari, H.-S.; Burton, A.J. Effects of repeated whole-tree harvesting on soil properties and tree growth in a Norway spruce (Picea abies (L.) Karst.) stand. For. Ecol. Manag. 2014, 313, 180–187. [Google Scholar] [CrossRef]
- Wall, A.; Hytönen, J. The long-term effects of logging residue removal on forest floor nutrient capital, foliar chemistry and growth of a Norway spruce stand. Biomass Bioenergy 2011, 35, 3328–3334. [Google Scholar] [CrossRef]
- Wall, A. Risk analysis of effects of whole-tree harvesting on site productivity. For. Ecol. Manag. 2012, 282, 175–184. [Google Scholar] [CrossRef]
- Olsson, B.A.; Staaf, H.; Lundkvist, H.; Bengtsson, J.; Rosen, K. Carbon and nitrogen in coniferous forest soils after clear-felling and harvests of different intensity. For. Ecol. Manag. 1996, 82, 19–32. [Google Scholar] [CrossRef]
- Clarke, N.; Gundersen, P.; Jönsson-Belyazid, U.; Kjønaas, O.J.; Persson, T.; Sigurdsson, B.D.; Stupak, I.; Vesterdal, L. Influence of different tree-harvesting intensities on forest soil carbon stocks in boreal and northern temperate forest ecosystems. For. Ecol. Manag. 2015, 351, 9–19. [Google Scholar] [CrossRef]
- Adebayo, A.; Han, H.; Johnson, L. Productivity and cost of cut-to-length and whole-tree harvesting in a mixed-conifer stand. For. Prod. J. 2007, 57, 59–69. [Google Scholar]
- Coates, E.; Cronin, B.; Kent, T. A comparison of biomass production and machine system productivity using three harvesting methods in a conifer first thinning. Irish For. 2016, 73, 122–140. [Google Scholar]
- Labelle, E.R.; Jaeger, D. Soil compaction caused by cut-to-length forest operations and possible short-term natural rehabilitation of soil density. Soil Sci. Soc. Am. J. 2011, 75, 2314–2329. [Google Scholar] [CrossRef]
- Kleibl, M.; Klvač, R.; Lombardini, C.; Porhaly, J.; Spinelli, R. Soil Compaction and Recovery after Mechanized Final Felling of Italian Coastal Pine Plantations. Croat. J. For. Eng. 2014, 35, 63–71. [Google Scholar]
- Allman, M.; Jankovský, M.; Messingerová, V.; Allmanová, Z.; Ferenčík, M. Soil compaction of various Central European forest soils caused by traffic of forestry machines with various chassis. For. Syst. 2015, 24, e038. [Google Scholar] [CrossRef]
- Jourgholami, M.; Fathi, K.; Labelle, E.R. Effects of foliage and traffic intensity on runoff and sediment in skid trails after trafficking in a deciduous forest. Eur. J. For. Res. 2018. [Google Scholar] [CrossRef]
- Rodrigues, C.K.; da Silva Lopes, E.; Polizeli, K.M.V.C.; Müller, M.M.L. Soil compaction due to wood harvesting traffic at different extraction distances. Floresta e Ambiente 2018, 25, e20160045. [Google Scholar] [CrossRef]
- Albizu-Urionabarrenetxea, P.M.; Tolosana-Esteban, E.; Roman-Jordan, E. Safety and health in forest harvesting operations. Diagnosis and preventive actions. A review. For. Syst. 2013, 22, 392–400. [Google Scholar] [CrossRef]
- Huth, A.; Drechsler, M.; Köhler, P. Using multicriteria decision analysis and a forest growth model to assess impacts of tree harvesting in Dipterocarp lowland rain forests. For. Ecol. Manag. 2005, 207, 215–232. [Google Scholar] [CrossRef]
- Kiker, G.A.; Bridges, T.S.; Varghese, A.; Seager, T.P.; Linkovjj, I. Application of Multicriteria Decision Analysis in Environmental Decision Making. Integr. Environ. Assess. Manag. 2005, 1, 95–108. [Google Scholar] [CrossRef] [PubMed]
- Nordström, E.-M.; Eriksson, L.O.; Öhman, K. Integrating multiple criteria decision analysis in participatory forest planning: Experience from a case study in northern Sweden. For. Policy Econ. 2010, 12, 562–574. [Google Scholar] [CrossRef] [Green Version]
- Eggers, J.; Holmgren, S.; Nordström, E.-M.; Lämås, T.; Lind, T.; Öhman, K. Balancing different forest values: Evaluation of forest management scenarios in a multi-criteria decision analysis framework. For. Policy Econ. 2017. [Google Scholar] [CrossRef]
- Wolfslehner, B.; Huber, P.; Lexer, M.J. Smart use of small-diameter hardwood—A forestry-wood chain sustainability impact assessment in Austria. Scand. J. For. Res. 2013, 28, 184–192. [Google Scholar] [CrossRef]
- Ghaffariyan, M.R.; Brown, M. Selecting the efficient harvesting method using multiple-criteria analysis: A case study in south-west Western Australia. J. For. Sci. 2013, 12, 479–486. [Google Scholar] [CrossRef]
Figure 1.
Specific productivity by treatment and work phase. Note: MM-WT = motor-manual whole-tree harvesting; MM-CTL = motor-manual cut-to-length harvesting; FM-WT = fully-mechanized whole-tree harvesting; FM-CTL = fully-mechanized cut-to-length harvesting.
Figure 1.
Specific productivity by treatment and work phase. Note: MM-WT = motor-manual whole-tree harvesting; MM-CTL = motor-manual cut-to-length harvesting; FM-WT = fully-mechanized whole-tree harvesting; FM-CTL = fully-mechanized cut-to-length harvesting.

Figure 2.
Ranking results of the multi-criteria analysis. Overall ranking of four alternative thinning operations. Phi (ϕ) indicates the degree of dominance of one alternative over another. Equal weights for the economic, environmental and social indicator cluster. Note: MM-WT = motor-manual whole-tree harvesting; MM-CTL = motor-manual cut-to-length harvesting; FM-WT = fully-mechanized whole-tree harvesting; FM-CTL = fully-mechanized cut-to-length harvesting.

Figure 3.
Preference results of the multi-criteria analysis. Preferences (Phi-values) for the four alternative thinning operations over all impact indicators. Note: MM-WT = motor-manual whole-tree harvesting; MM-CTL = motor-manual cut-to-length harvesting; FM-WT = fully-mechanized whole-tree harvesting; FM-CTL = fully-mechanized cut-to-length harvesting.


Table 1.
Applied sustainability indicators.
| No. | Indicator | Description | Unit |
|---|---|---|---|
| 1 | Productivity | Rate of product output per unit of time for a production system. A productivity ratio may also be calculated for resources other than time. | PMH gt−1 |
| 2 | Costs | Sum of production costs (fixed costs accruing regardless of the rate of activity inclusive of personnel costs, as well as variable costs that vary with the quantity of production). | € gt−1 |
| 3 | Delays | Interruptions of the work process that can be related back to the organization of the work; commonly subdivided into the categories mechanical (e.g., repair), personnel (e.g., rest breaks) and operational delays (e.g., waiting times). | % of total working time |
| 4 | GWP | The potential of global warming is mainly caused by the release of greenhouse gas emissions due to anthropogenic activities such as fossil fuel combustion, chemical processing and transportation. | kg CO2-eq. gt−1 |
| 5 | CED of fossil energy | The cumulative energy demand of fossil energy investigates the energy use throughout the overall life cycle, including the use of direct and indirect consumption of energy due to the use of materials. | MJ gt−1 |
| 6 | EP | Potential eutrophication due to some substances, calculated through the conversion factor of phosphorous and nitrogen compounds into phosphorous equivalents. | kg PO4-eq. gt−1 |
| 7 | POPC (low NOx) | The potential of photochemical ozone creation, also known as summer smog, contains nitrogen oxides and volatile organic compounds. | kg ethylene gt−1 |
| 8 | AP | Potential acidification due to atmospheric deposition of sulfur and nitrogen. | kg SO2-eq. gt−1 |
| 9 | Employment | Rate of full-time employments related to forest operations. | FTE 1000 gt−1 |
| 10 | Fatal accident | Fatal accidents related to forest operations. | Fatalities 10−6 gt−1 |
| 11 | Tree damage | Percentage of stand damage after forest operations (excluding wounds with an exposed surface <10 cm²). | % of total trees |
| 12 | Soil compaction | The increase of bulk density was used to show possible soil compaction. | Difference in % (untrafficked/trafficked) |
Note: PMH = productive machine hours, exclusive of delays; gt = green tonnes (fresh weight); min = minutes; CED = cumulated energy demand; MJ = megajoules; EE = energy efficiency; GWP = global warming potential; CO2 = carbon dioxide; EP = eutrophication potential; PO4 = phosphate; POPC = Photochemical ozone creation potential; AP = acidification potential; SO2 = sulfur dioxide; FTE = full-time equivalent.
Table 2.
Biomass removal, in green tonnes (fresh weight).
| Forest-Wood Chain | Biomass Volume (gt ha−1) |
|---|---|
| 1-MM-WT | 51.0 |
| 2-MM-CTL | 29.6 |
| 3-FM-WT | 53.9 |
| 4-FM-CTL | 33.5 |
Note: MM-WT = motor-manual whole-tree harvesting; MM-CTL = motor-manual cut-to-length harvesting; FM-WT = fully-mechanized whole-tree harvesting; FM-CTL = fully-mechanized cut-to-length harvesting.
Table 3.
Relative indicator results.
| Indicator | Unit | Process | 1-MM-WT | 2-MM-CTL | 3-FM-WT | 4-FM-CTL |
|---|---|---|---|---|---|---|
| Costs | € gt−1 | felling | 27.70 | 40.40 | 2.76 | 8.99 |
| extraction | 8.72 | 32.50 | 2.69 | 5.90 | ||
| chipping | 3.94 | 4.29 | 4.55 | 4.39 | ||
| total value | 40.36 | 77.19 | 9.99 | 19.28 | ||
| Delay | % | felling | 54.00 | 54.00 | 19.00 | 10.00 |
| extraction | 28.00 | 28.00 | 10.00 | 10.00 | ||
| chipping | 17.00 | 17.00 | 17.00 | 17.00 | ||
| total value | 29.70 | 29.70 | 14.40 | 11.70 | ||
| GWP | kg CO2-eq. gt−1 | felling | 0.43 | 0.58 | 0.68 | 1.73 |
| extraction | 1.16 | 4.01 | 0.58 | 1.01 | ||
| chipping | 0.89 | 0.96 | 1.12 | 1.11 | ||
| total value | 2.49 | 5.55 | 2.37 | 3.85 | ||
| CED of | MJ gt−1 | felling | 29.89 | 39.98 | 34.93 | 100.50 |
| fossil energy | extraction | 65.04 | 209.23 | 33.02 | 57.37 | |
| chipping | 61.21 | 65.06 | 69.80 | 70.05 | ||
| total value | 156.14 | 314.27 | 137.75 | 227,92 | ||
| EP | kg PO4-eq gt−1 | felling | 0.0006 | 0.0021 | 0.0012 | 0.0031 |
| extraction | 0.0023 | 0.0120 | 0.0010 | 0.0017 | ||
| chipping | 0.0017 | 0.0034 | 0.0018 | 0.0018 | ||
| total value | 0.0046 | 0.0175 | 0.0040 | 0.0066 | ||
| POPC | kg ethylene gt−1 | felling | 0.0001 | 0.0001 | 0.0002 | 0.0005 |
| (low NOx) | extraction | 0.0004 | 0.0010 | 0.0002 | 0.0003 | |
| chipping | 0.0003 | 0.0007 | 0.0004 | 0.0004 | ||
| total value | 0.0008 | 0.0019 | 0.0008 | 0.0012 | ||
| AP | kg SO2-eq gt−1 | felling | 0.0038 | 0.0051 | 0.0042 | 0.0120 |
| extraction | 0.0091 | 0.0301 | 0.0036 | 0.0065 | ||
| chipping | 0.0079 | 0.0084 | 0.0077 | 0.0075 | ||
| total value | 0.0208 | 0.0437 | 0.0156 | 0.0260 | ||
| Employment | FTE 1000 gt−1 | felling | 0.7976 | 1.1634 | 0.0188 | 0.0764 |
| extraction | 0.1561 | 0.5817 | 0.0254 | 0.0542 | ||
| chipping | 0.0192 | 0.0209 | 0.0221 | 0.0214 | ||
| total value | 0.9729 | 1.7659 | 0.0664 | 0.1520 | ||
| Fatal | fatalities 10−6 gt−1 | felling | n.a. | n.a. | n.a. | n.a. |
| accident | extraction | n.a. | n.a. | n.a. | n.a. | |
| chipping | n.a. | n.a. | n.a. | n.a. | ||
| total value | 0.2168 | 0.2108 | 0.0259 | 0.0283 | ||
| Tree damage | % trees | felling | n.a. | n.a. | n.a. | n.a. |
| extraction | n.a. | n.a. | n.a. | n.a. | ||
| chipping | n.a. | n.a. | n.a. | n.a. | ||
| total value | 6.0 | 15.7 | 2.5 | 1.5 | ||
| Soil | % difference | felling | n.a. | n.a. | n.a. | n.a. |
| compaction | (untrafficked/ | extraction | n.a. | n.a. | n.a. | n.a. |
| trafficked) | chipping | n.a. | n.a. | n.a. | n.a. | |
| total value | −1.2 | 8.8 | 2.5 | 11.9 |
Note: The sum is shown in bold. The highest value in each alternative is shown in italics. The incidence of delay time over total harvesting time is the average delay incidence recorded for each single work step, weighted for the contribution of each work step to total harvesting time. MM-WT = motor-manual whole-tree harvesting; MM-CTL = motor-manual cut-to-length harvesting; FM-WT = fully-mechanized whole-tree harvesting; FM-CTL = fully-mechanized cut-to-length harvesting; PMH = productive machine hours; CED = cumulated energy demand; GWP = global warming potential; CO2 = carbon dioxide; EP = eutrophication potential; PO4 = phosphate; POPC = photochemical ozone creation potential; AP = acidification potential; SO2 = sulfur dioxide; FTE = full-time equivalent.
Table 4.
Total indicator results per hectare.
| Indicator | Unit | 1-MM-WT | 2-MM-CTL | 3-FM-WT | 4-FM-CTL |
|---|---|---|---|---|---|
| Productivity | PMH ha−1 | 24.01 | 31.45 | 4.60 | 6.84 |
| Costs | € ha−1 | 2058.52 | 2284.92 | 538.55 | 645.89 |
| Delays | % | 29.70 | 29.70 | 14.40 | 11.70 |
| GWP | kg CO2-eq. ha−1 | 126.91 | 164.21 | 127.68 | 128.83 |
| CED of fossil energy | GJ-eq. ha−1 | 7.96 | 16.03 | 7.03 | 11.62 |
| EP | kg PO4-eq. ha−1 | 0.23 | 0.52 | 0.22 | 0.22 |
| POPC (low NOx) | kg ethylene ha−1 | 0.04 | 0.06 | 0.04 | 0.04 |
| AP | kg SO2-eq. ha−1 | 1.06 | 1.29 | 0.84 | 0.87 |
| Employment | FTE 1000 ha−1 | 49.62 | 52.27 | 3.58 | 5.09 |
| Fatal accident | fatalities 10−6 ha−1 | 11.06 | 6.24 | 1.40 | 0.95 |
| Tree damage | % trees | 6.00 | 15.70 | 2.50 | 1.50 |
| Soil compaction | % difference | −1.20 | 8.80 | 2.50 | 11.90 |
Note: MM-WT = motor-manual whole-tree harvesting; MM-CTL = motor-manual cut-to-length harvesting; FM-WT = fully-mechanized whole-tree harvesting; FM-CTL = fully-mechanized cut-to-length harvesting. PMH = productive machine hours; CED = cumulated energy demand; GWP = global warming potential; CO2 = carbon dioxide; EP = eutrophication potential; PO4 = phosphate; POPC = photochemical ozone creation potential; AP = acidification potential; SO2 = sulfur dioxide; FTE = full-time equivalent.
© 2018 by the authors. Licensee MDPI, Basel, Switzerland. This article is an open access article distributed under the terms and conditions of the Creative Commons Attribution (CC BY) license (http://creativecommons.org/licenses/by/4.0/).
Share and Cite
MDPI and ACS Style
Schweier, J.; Spinelli, R.; Magagnotti, N.; Wolfslehner, B.; Lexer, M.J. Sustainability Assessment of Alternative Thinning Operations in Mediterranean Softwood Plantations. Forests 2018, 9, 375. https://doi.org/10.3390/f9070375
AMA Style
Schweier J, Spinelli R, Magagnotti N, Wolfslehner B, Lexer MJ. Sustainability Assessment of Alternative Thinning Operations in Mediterranean Softwood Plantations. Forests. 2018; 9(7):375. https://doi.org/10.3390/f9070375
Chicago/Turabian StyleSchweier, Janine, Raffaele Spinelli, Natascia Magagnotti, Bernhard Wolfslehner, and Manfred J. Lexer. 2018. "Sustainability Assessment of Alternative Thinning Operations in Mediterranean Softwood Plantations" Forests 9, no. 7: 375. https://doi.org/10.3390/f9070375
Note that from the first issue of 2016, this journal uses article numbers instead of page numbers. See further details here.