Assessing the Driving Forces in Vegetation Dynamics Using Net Primary Productivity as the Indicator: A Case Study in Jinghe River Basin in the Loess Plateau


Abstract
:1. Introduction
2. Data and Methods
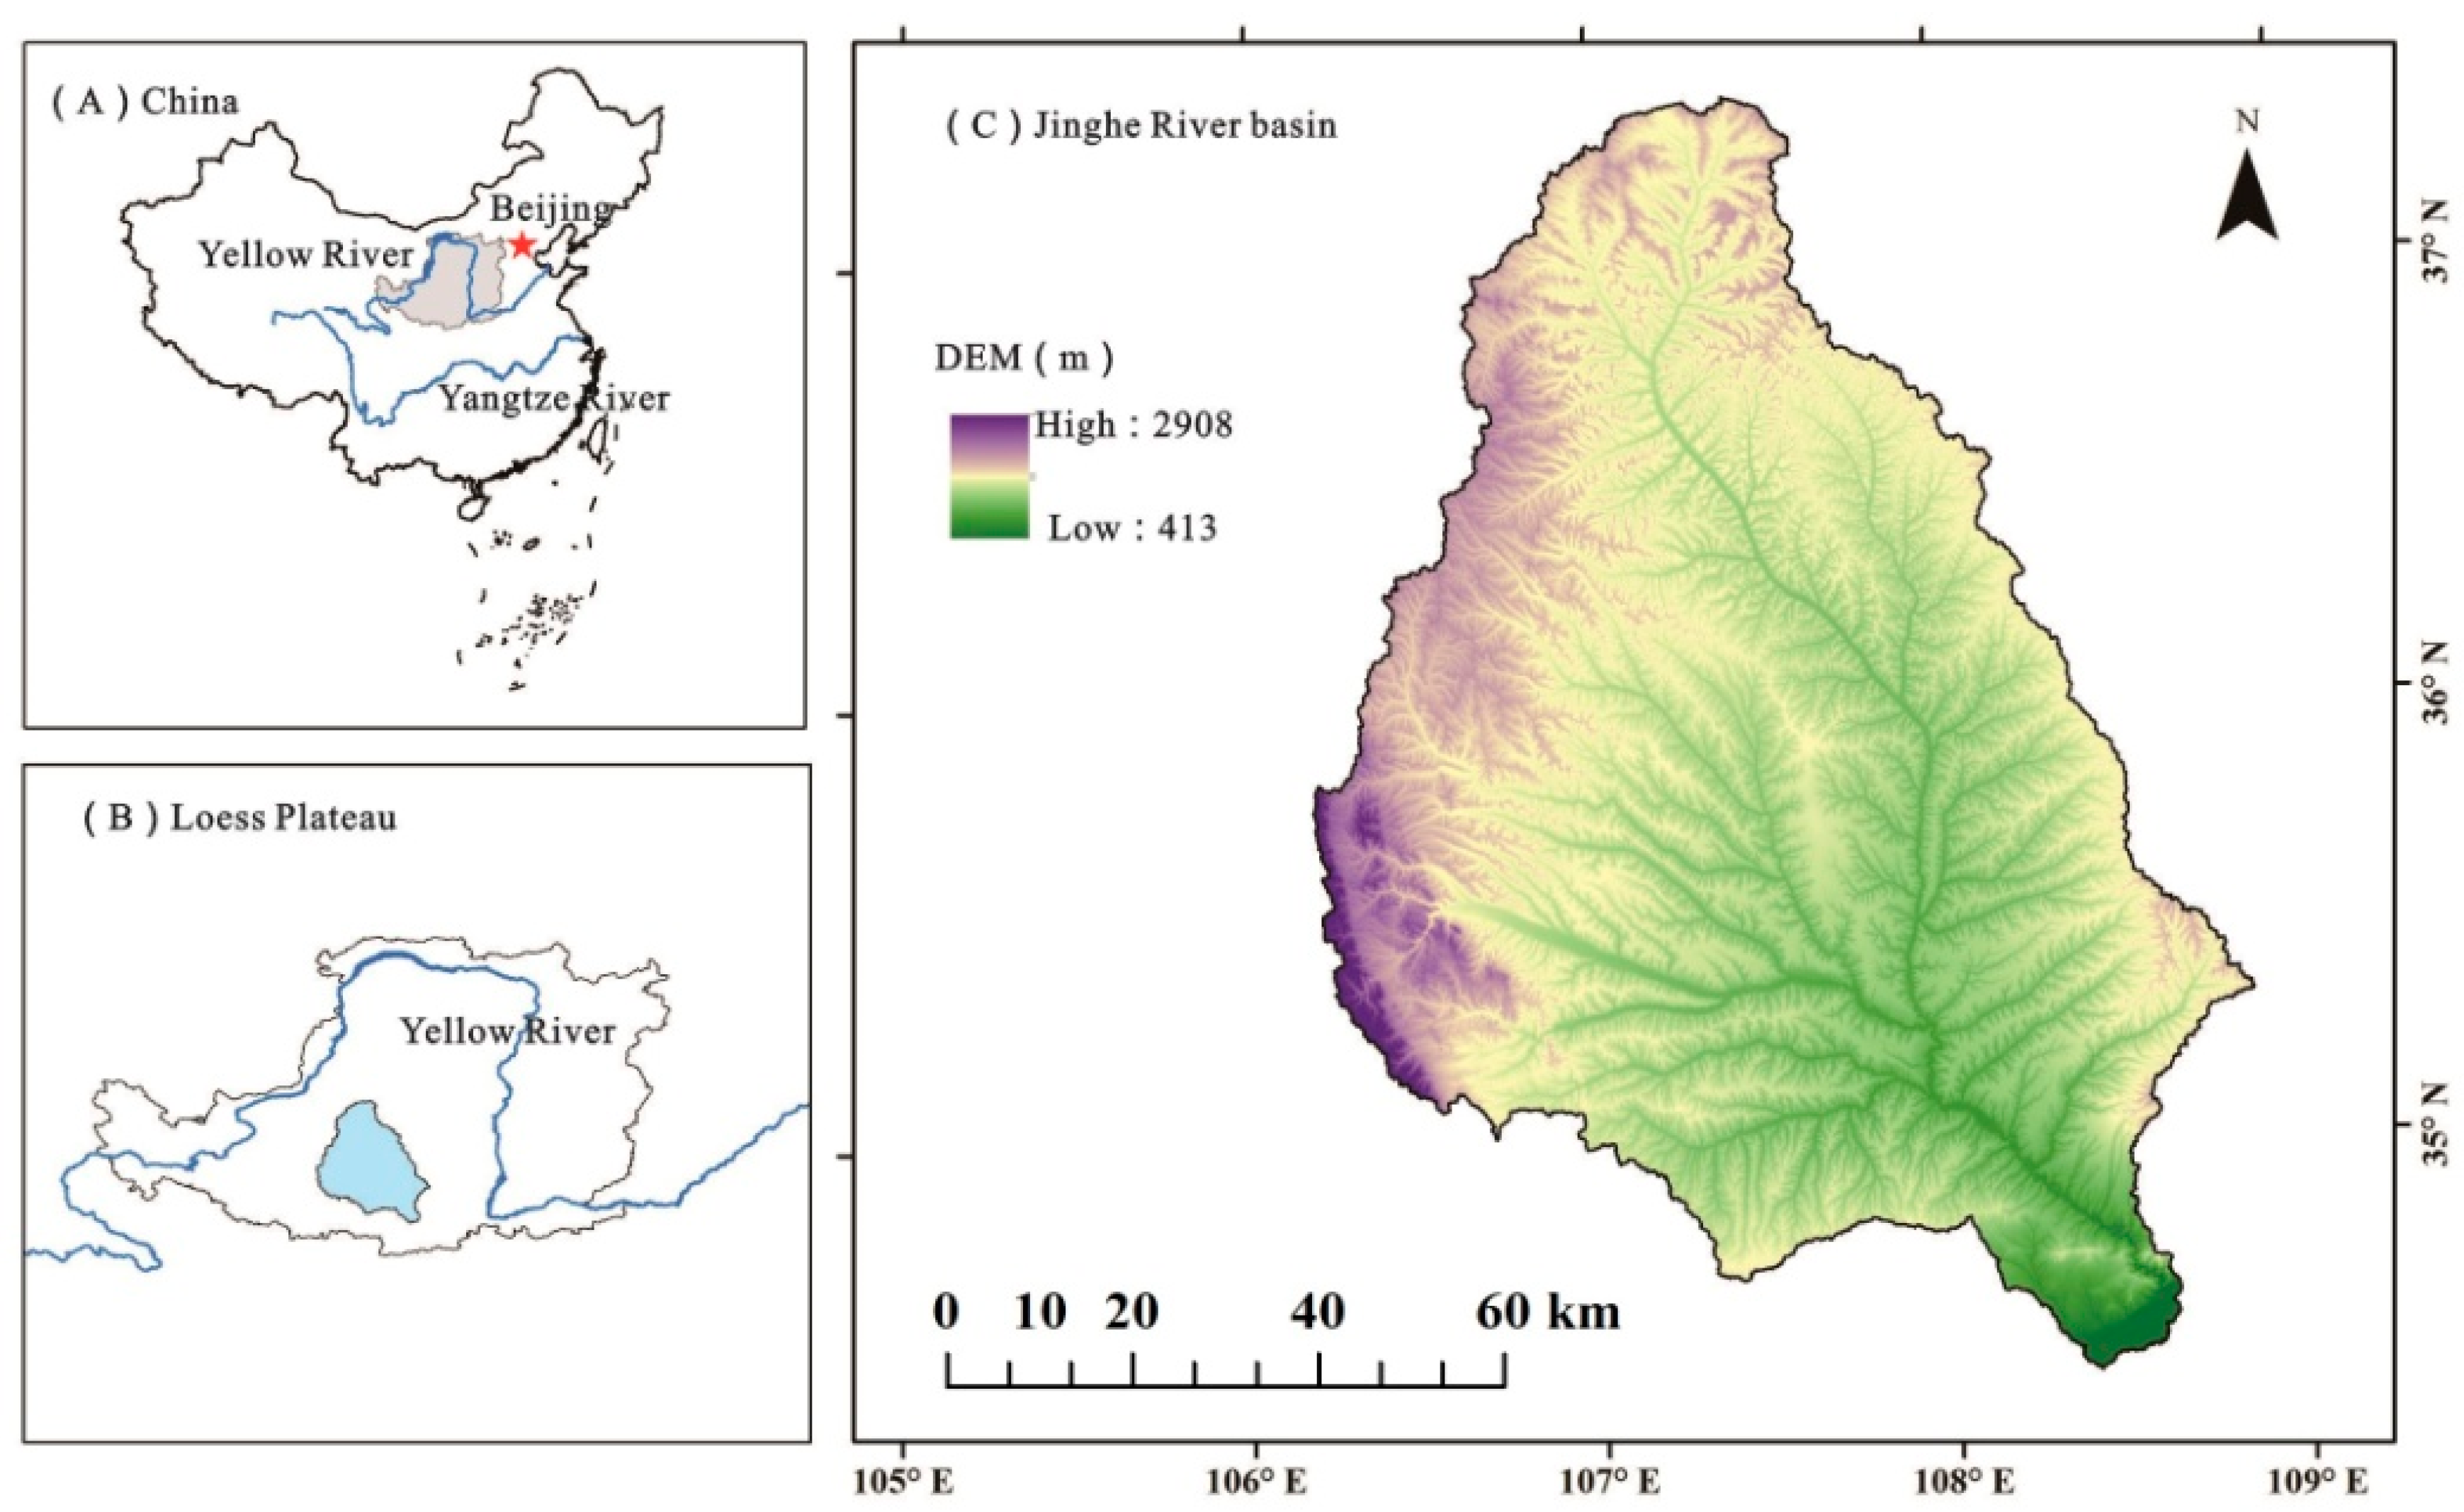
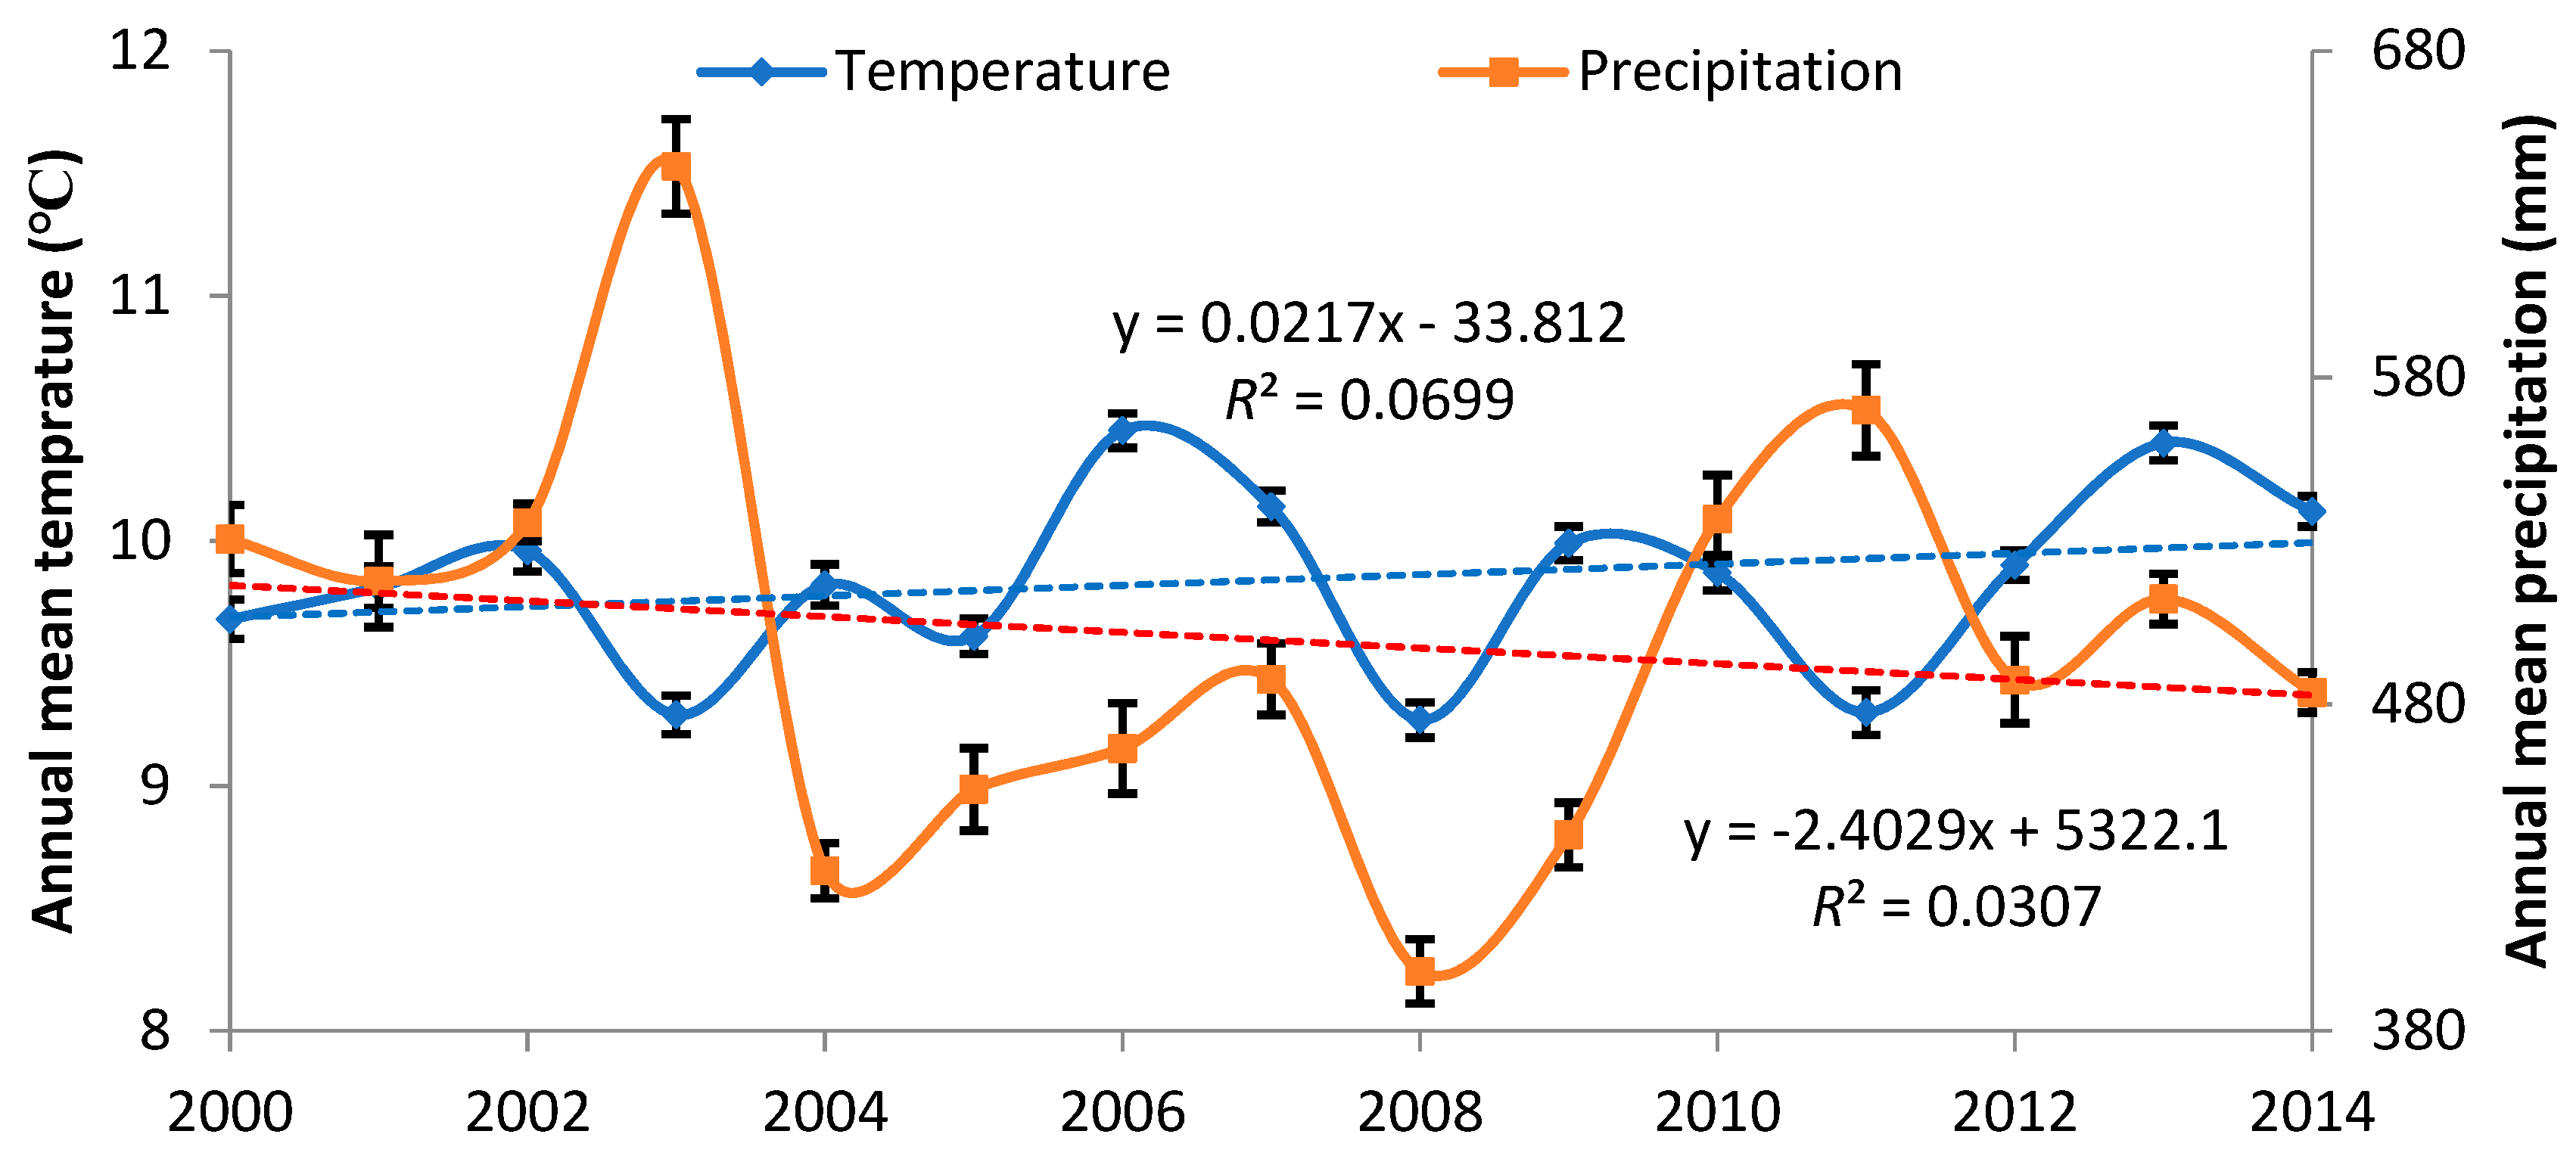
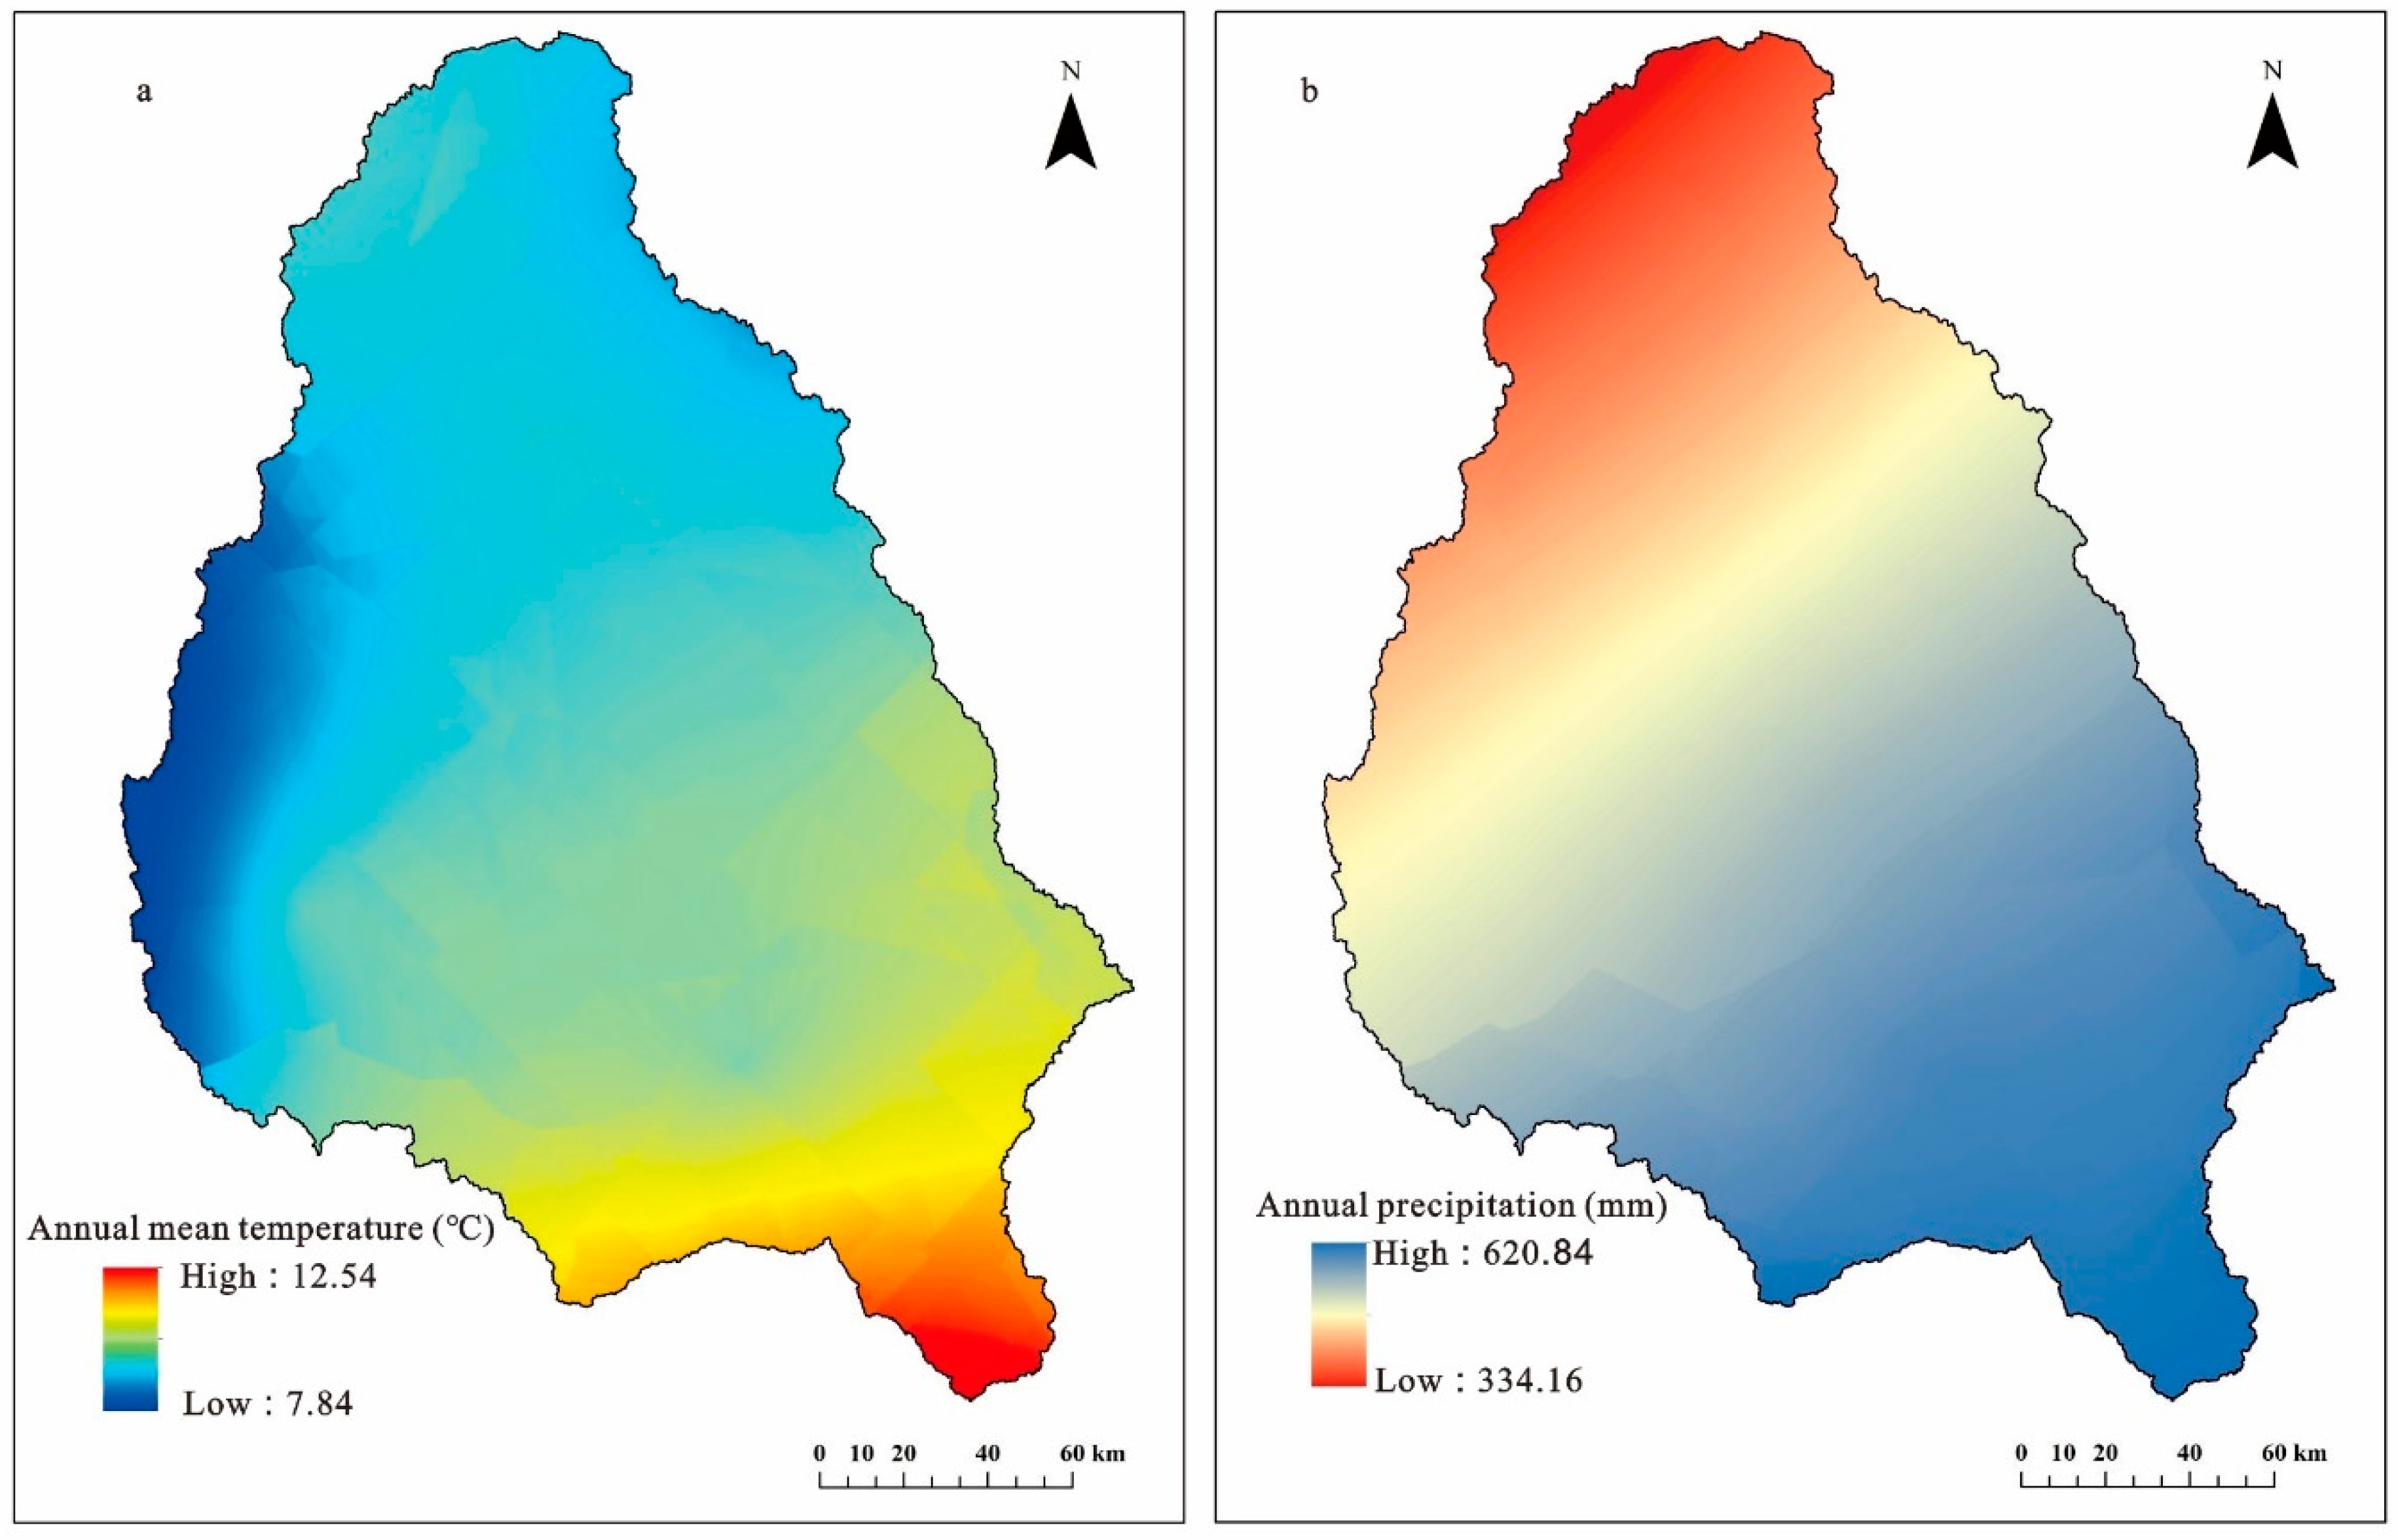
2.1. Study Area
2.2. Remote Sensing Data Sets
2.3. Net Primary Production Estimates
2.3.1. Estimation of the Expected NPP
2.3.2. Estimation of the Actual NPP
2.3.3. Estimation of the NPPh and Condition Analysis
2.4. Correlation Coefficient and Significance Test
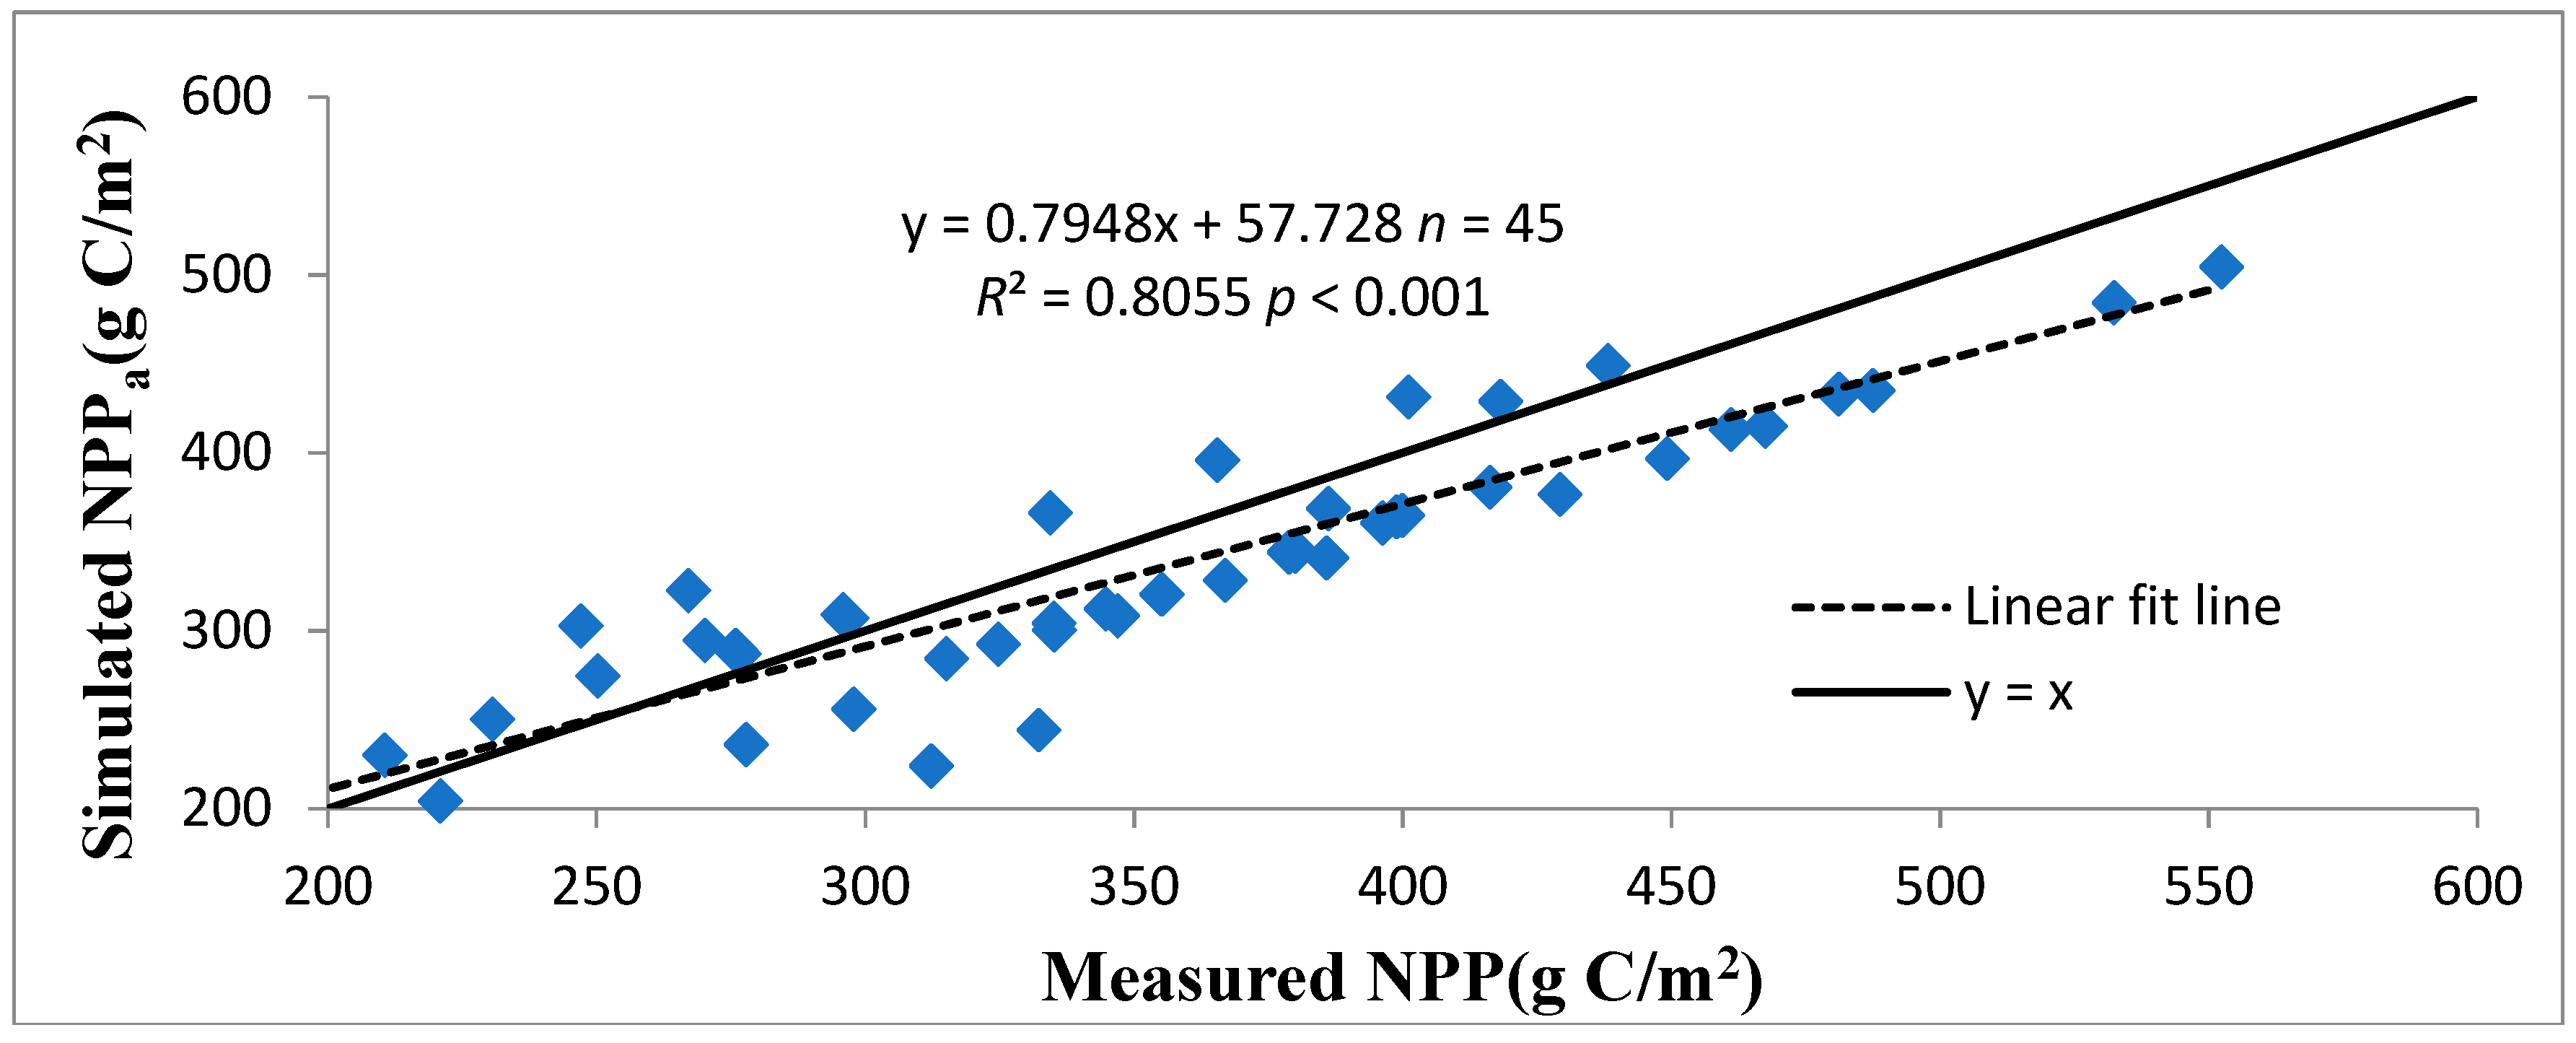
2.5. Validating NPP
3. Results
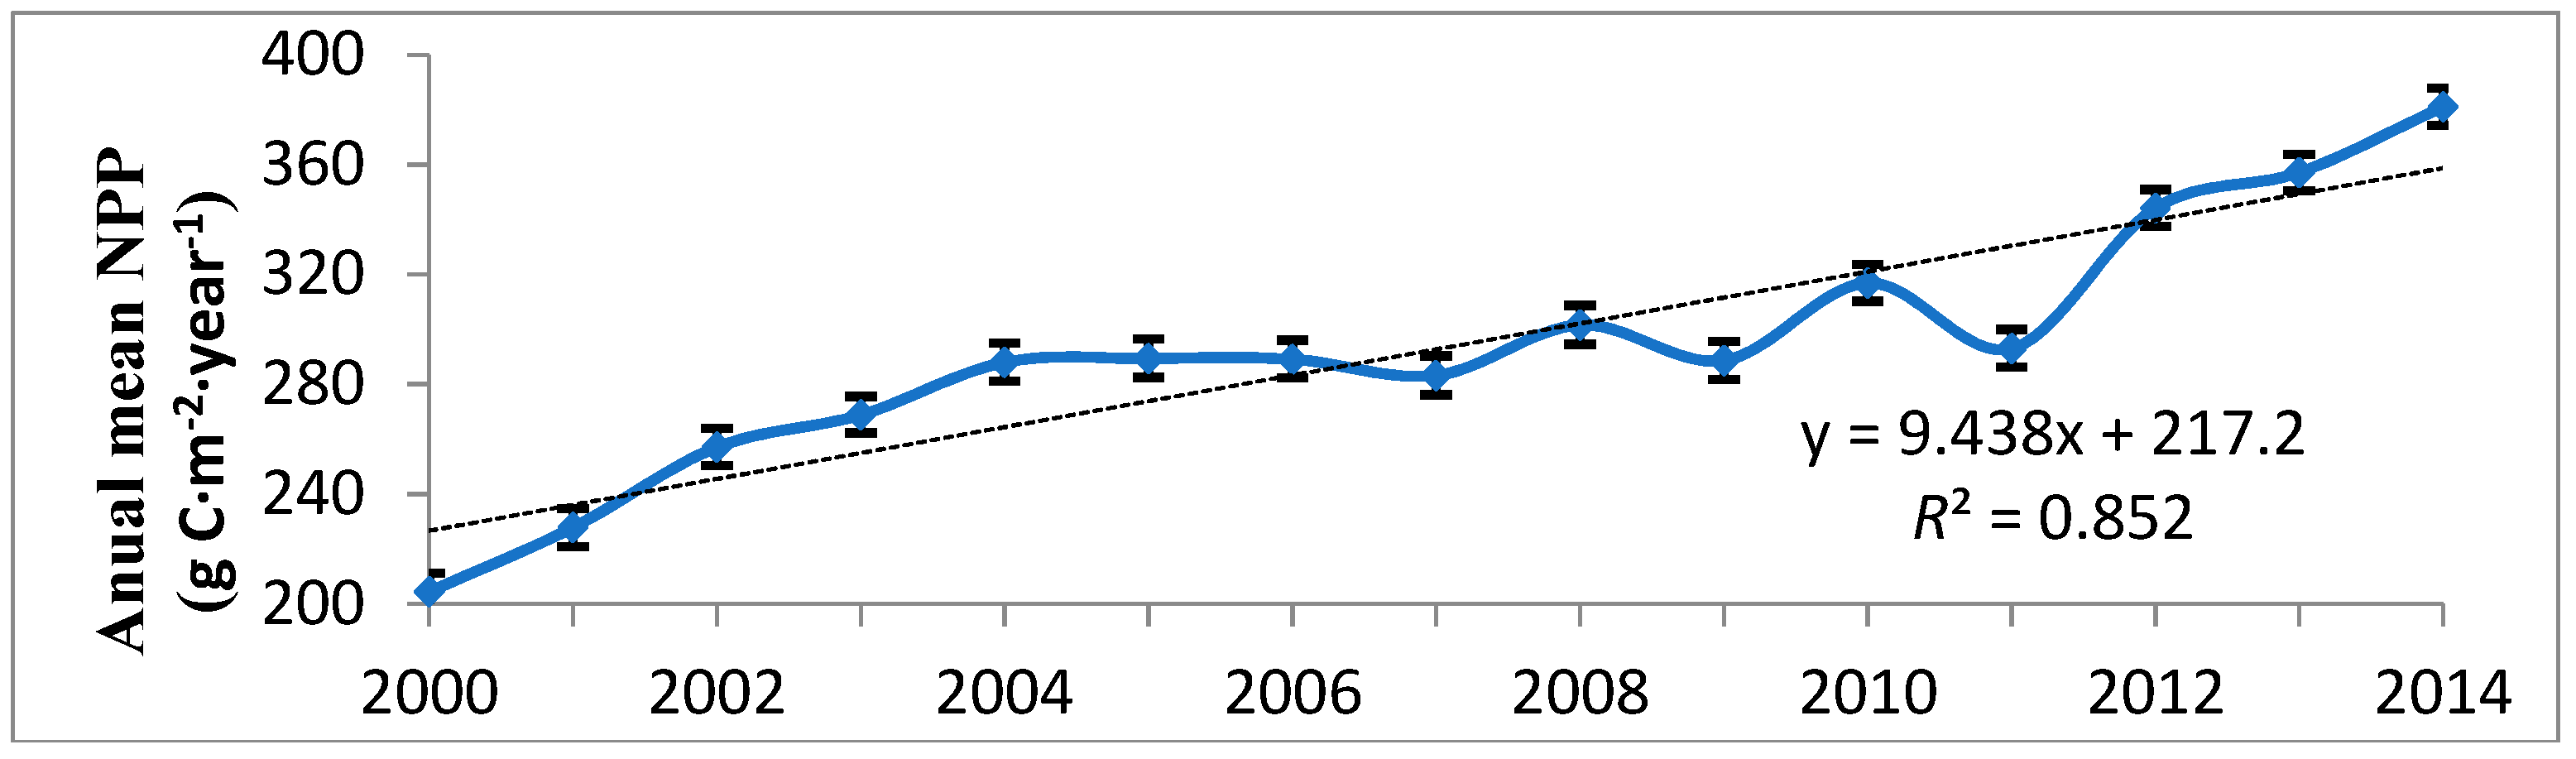
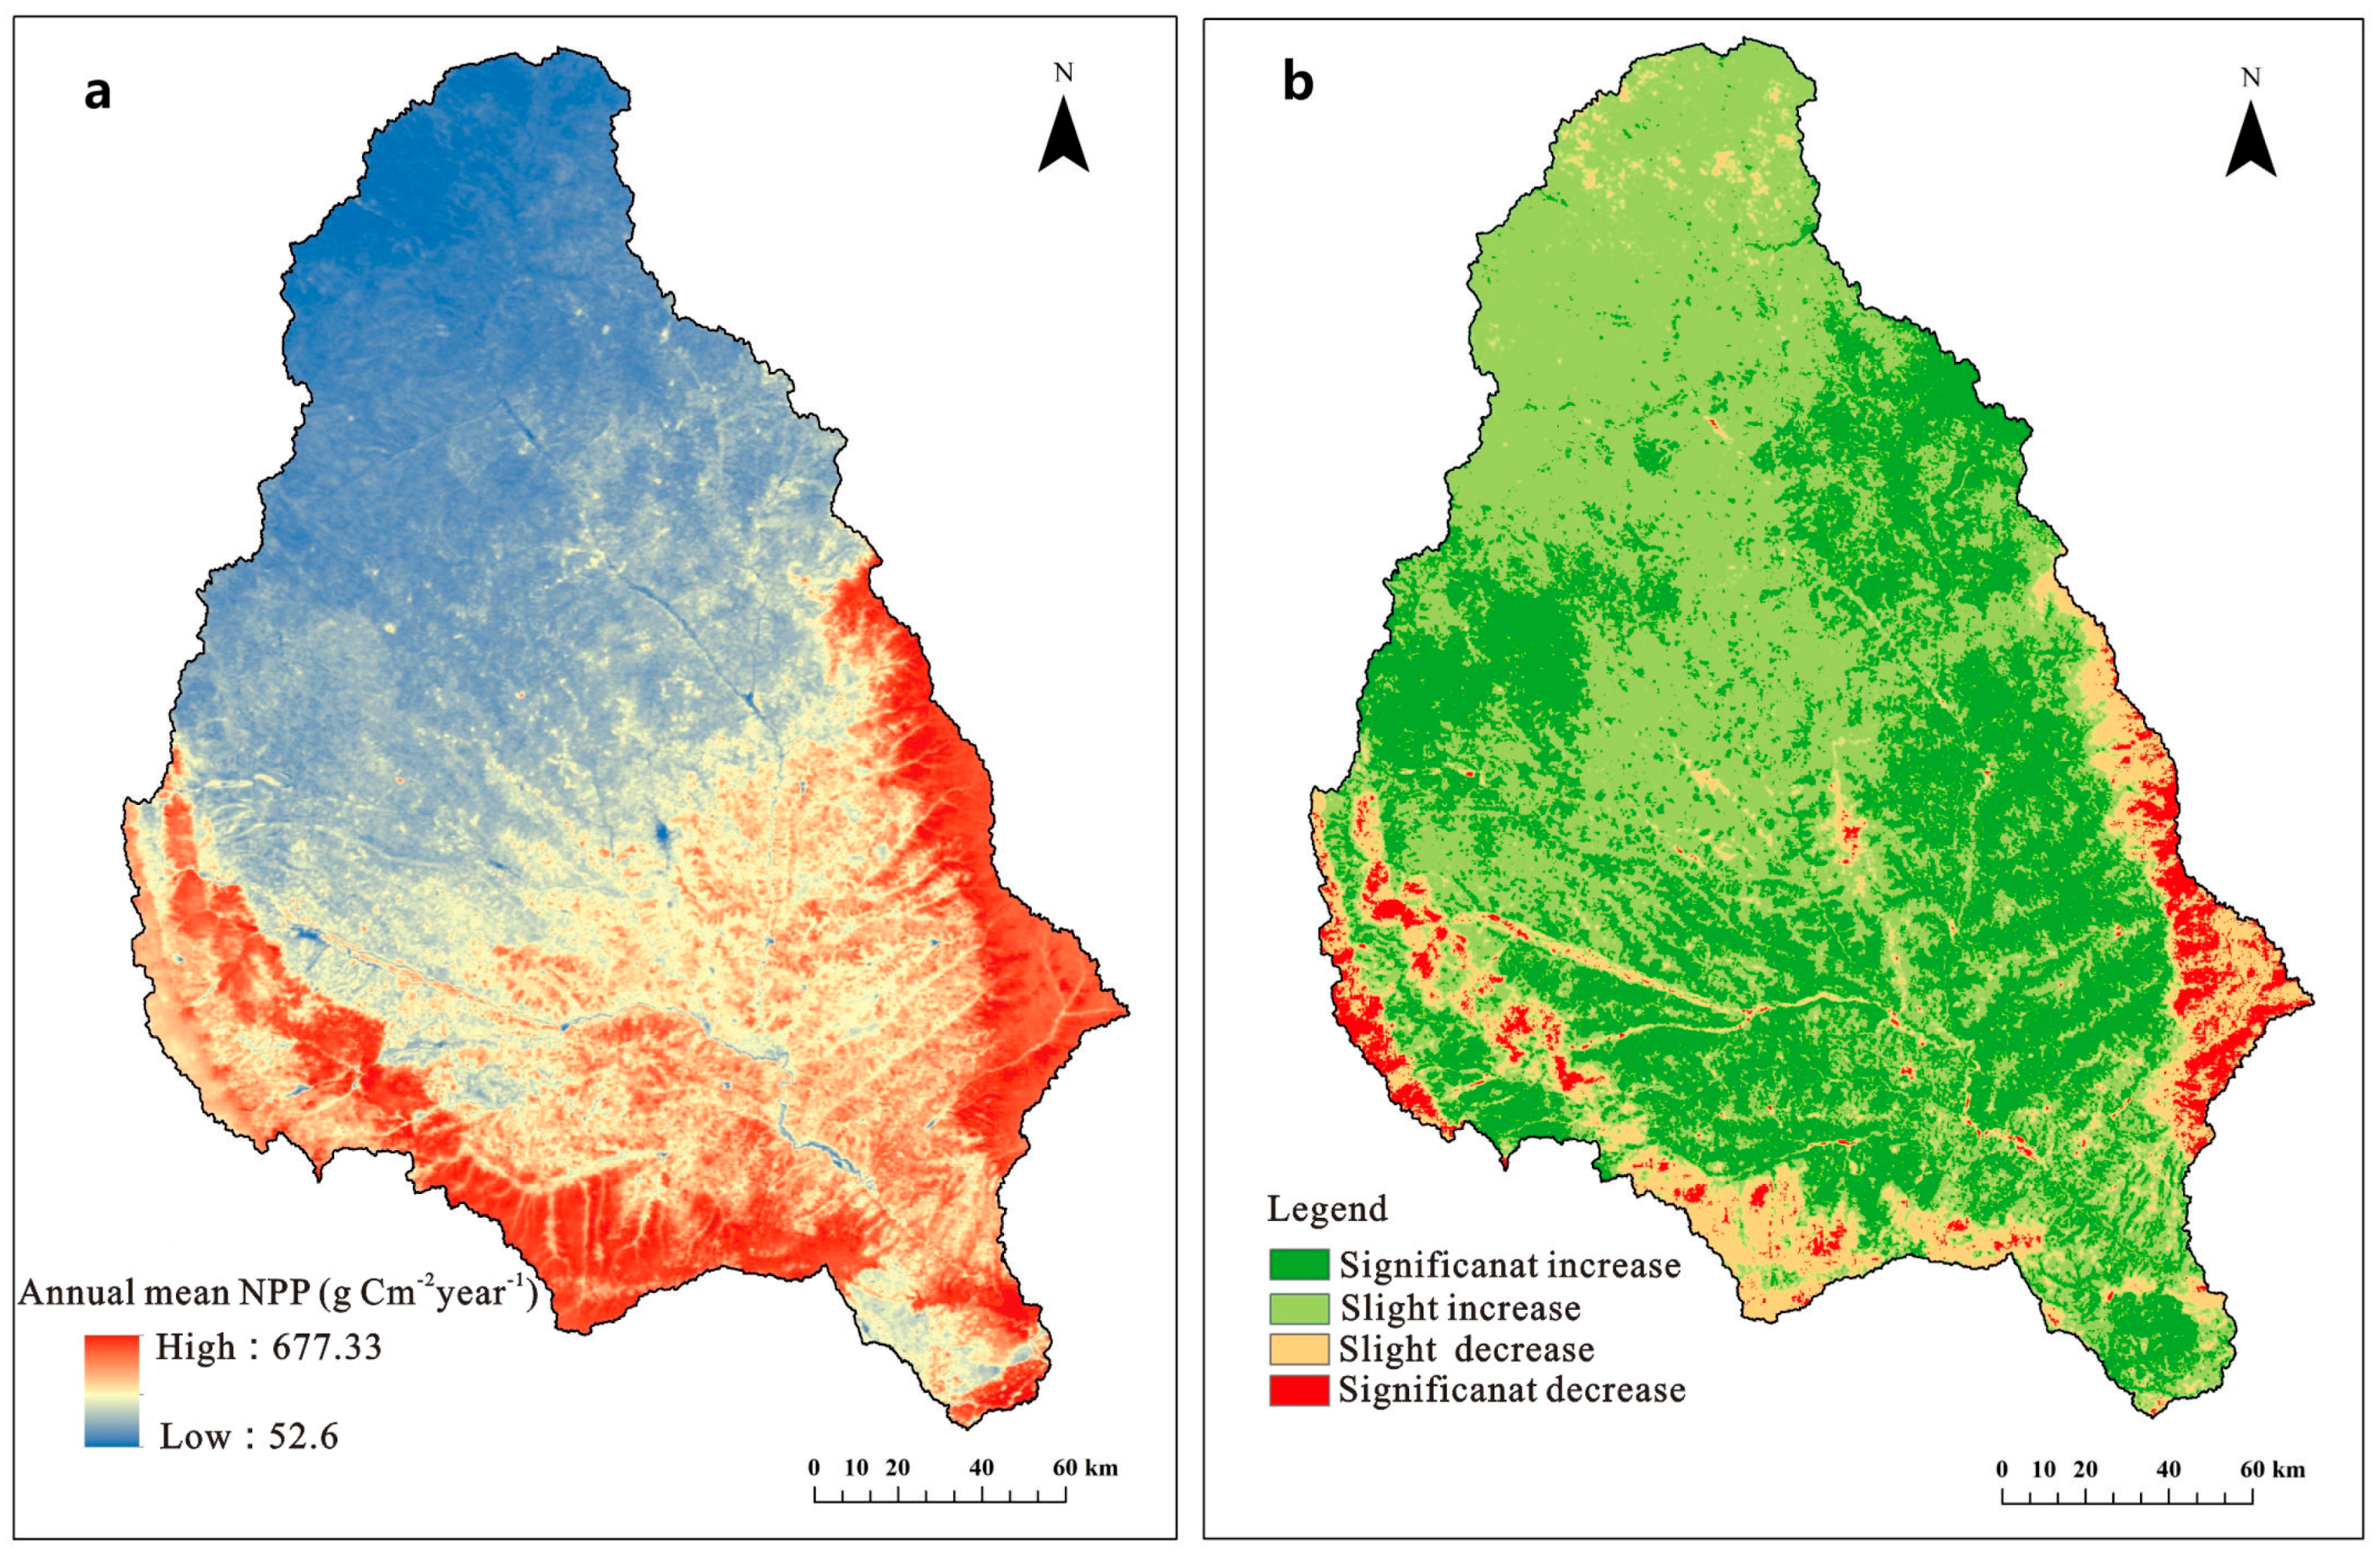
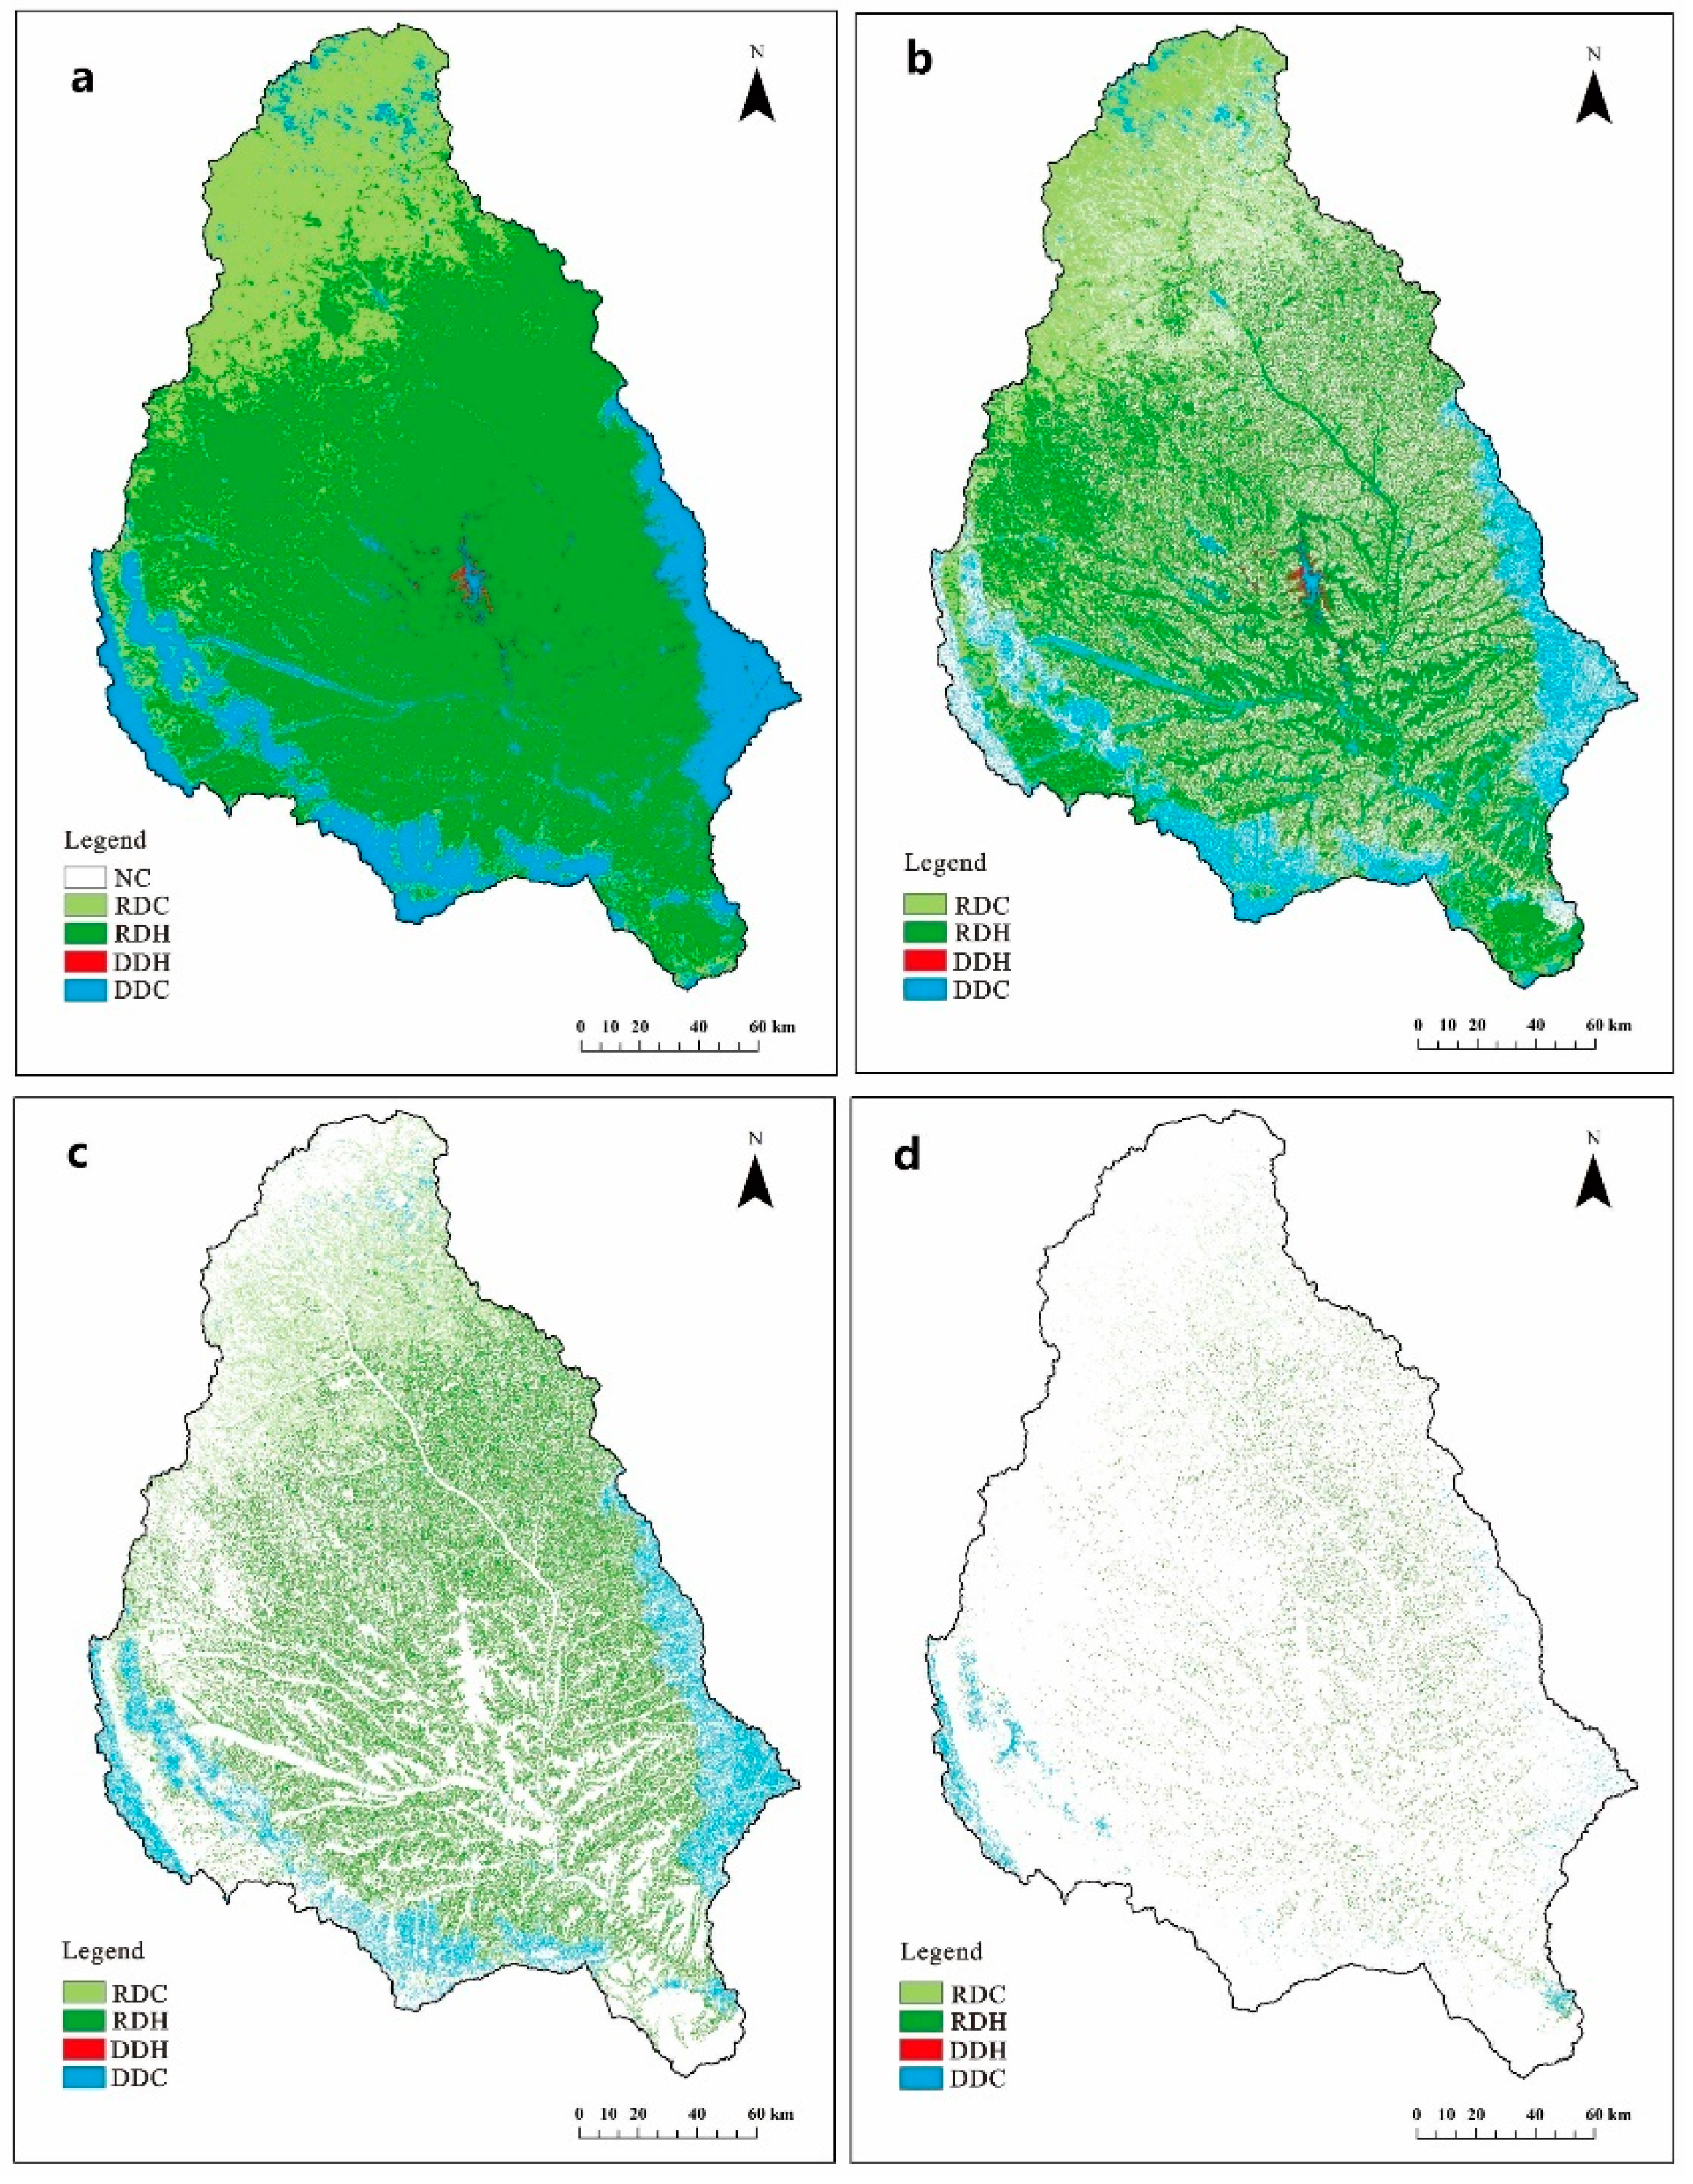
3.1. Spatio-Temporal Trends of NPP
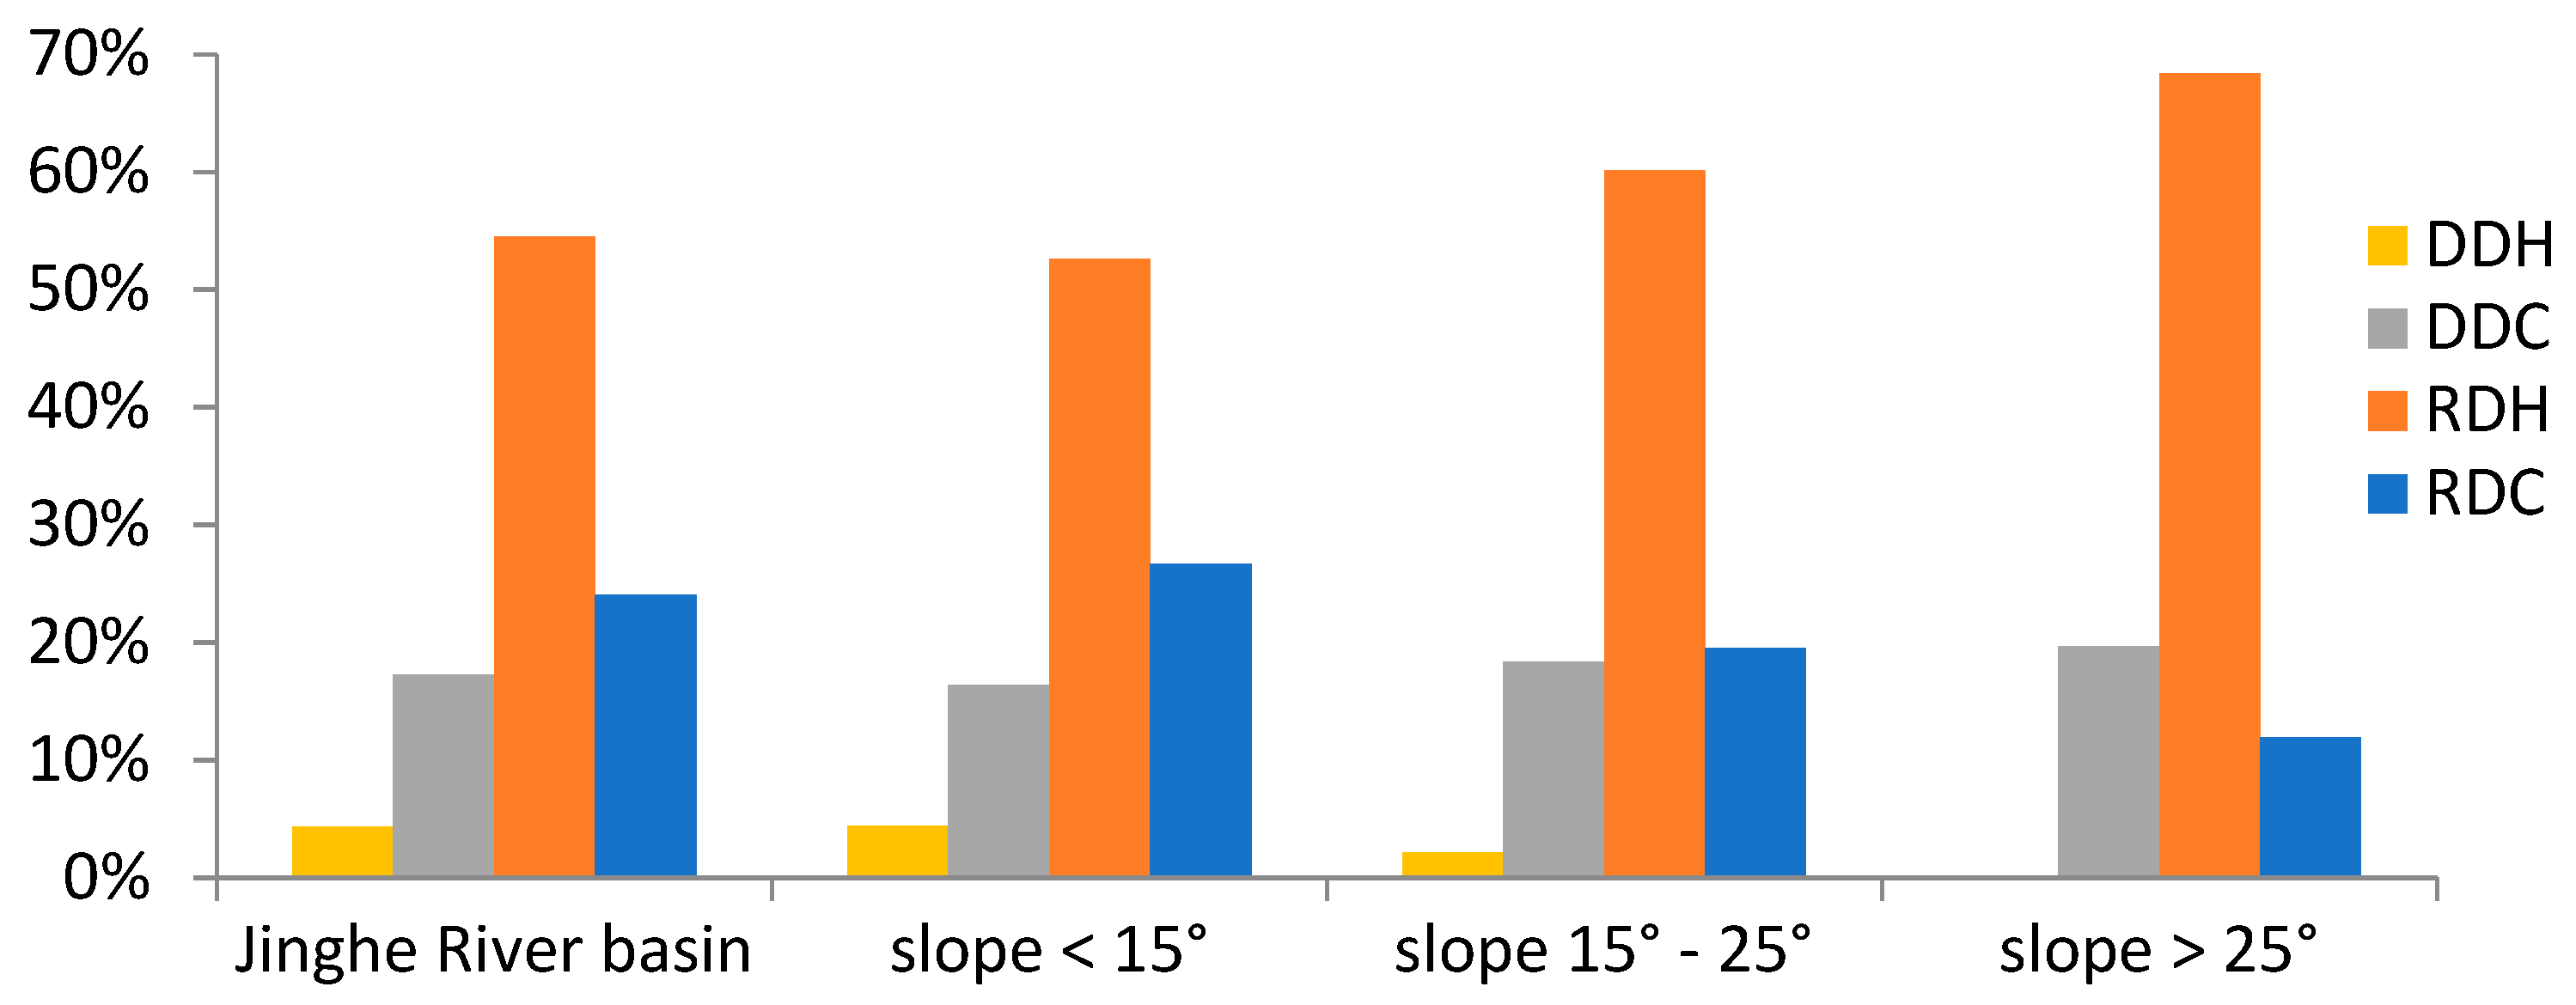
3.2. Driving Forces in Vegetation Dynamics
4. Discussion
4.1. Methodology
4.2. Driving Forces
5. Conclusions
Author Contributions
Acknowledgments
Conflicts of Interest
References
- Field, C.B. Global change. Sharing the garden. Science 2001, 294, 2490–2491. [Google Scholar] [CrossRef] [PubMed]
- Root, T.L.; Price, J.T.; Hall, K.R.; Schneider, S.H.; Rosenzweig, C.; Pounds, J.A. Fingerprints of global warming on wild animals and plants. Nature 2003, 421, 47–60. [Google Scholar] [CrossRef] [PubMed]
- Li, A.; Wu, J.G.; Huang, J.H. Distinguishing between human-induced and climate-driven vegetation changes: A critical application of RESTREND in Inner Mongolia. Landsc. Ecol. 2012, 27, 969–982. [Google Scholar] [CrossRef]
- Zhang, Y.; Zhang, C.; Wang, Z.; Chen, Y.; Gang, C.; An, R.; Li, J. Vegetation dynamics and its driving forces from climate change and human activities in the Three-River Source Region, China from 1982 to 2012. Sci. Total Environ. 2016, 563–564, 210–220. [Google Scholar] [CrossRef] [PubMed]
- Ma, W.; Wang, X.; Zhou, N.; Jiao, L. Relative importance of climate factors and human activities in impacting vegetation dynamics during 2000–2015 in the Otindag Sandy Land, northern China. J. Arid Land 2017, 9, 558–567. [Google Scholar] [CrossRef]
- Huang, K.; Zhang, Y.; Zhu, J.; Liu, Y.; Zu, J.; Zhang, J. The Influences of Climate Change and Human Activities on Vegetation Dynamics in the Qinghai-Tibet Plateau. Remote Sens. 2016, 8, 876. [Google Scholar] [CrossRef]
- Wessels, K.J.; Prince, S.D.; Malherbe, J.; Small, J.; Frost, P.E.; VanZyl, D. Can human-induced land degradation be distinguishedfrom the effects of rainfall variability? A case study in South Africa. J. Arid Environ. 2007, 68, 271–297. [Google Scholar] [CrossRef]
- Yao, J.Q.; Yang, Q.; Chen, Y.N. Climate change in arid areas of Northwest China in past 50 years and its effects on the local ecological environment. Chin. J. Ecol. 2013, 32, 1283–1291. [Google Scholar]
- Wang, H.; Liu, G.H.; Li, Z.S.; Ye, X.; Wang, M.; Gong, L. Driving force and changing trends of vegetation phenology in the Loess Plateau of China from 2000 to 2010. J. Mt. Sci. 2016, 13, 844–856. [Google Scholar] [CrossRef] [Green Version]
- An, R.; Wang, H.L.; Feng, X.Z.; Wu, H.; Wang, Z.; Wang, Y.; Shen, X.J.; Lu, C.H.; Quaye-Ballard, J.A.; Chen, Y.H.; et al. Monitoring rangeland degradation using a novel local NPP scaling based scheme over the “Three-River Headwaters” region, hinterland of the Qinghai-Tibetan Plateau. Quat. Int. 2017, 444, 97–114. [Google Scholar] [CrossRef] [Green Version]
- Zhang, B.; Wu, P.; Zhao, X.; Wang, Y.; Gao, X. Changes in vegetation condition in areas with different gradients (1980–2010) on the Loess Plateau, China. Environ. Earth Sci. 2012, 68, 2427–2438. [Google Scholar] [CrossRef]
- Zhang, J.; Wang, T.; Ge, J. Assessing Vegetation Cover Dynamics Induced by Policy-Driven Ecological Restoration and Implication to Soil Erosion in Southern China. PLoS ONE 2015, 10, e0131352. [Google Scholar] [CrossRef] [PubMed]
- Yang, H.F.; Yao, L.; Wang, Y.D.; Li, J.L. Relative contribution of climate change and human activities to vegetation degradation and restoration in North Xinjiang, China. Rangel. J. 2017, 39, 289–302. [Google Scholar] [CrossRef]
- Cao, S.; Chen, L.; Shankman, D.; Wang, C.; Wang, X.; Zhang, H. Excessive reliance on afforestation in China’s arid and semi-arid regions: Lessons in ecological restoration. Earth-Sci. Rev. 2011, 104, 240–245. [Google Scholar] [CrossRef]
- Wang, H.; Liu, G.; Li, Z.; Ye, X.; Fu, B.; Lü, Y. Analysis of the Driving Forces in Vegetation Variation in the Grain for Green Program Region, China. Sustainability 2017, 9, 1853. [Google Scholar] [CrossRef]
- Wang, H.; Liu, G.; Li, Z.; Ye, X.; Fu, B.; Lv, Y. Impacts of Drought and Human Activity on Vegetation Growth in the Grain for Green Program Region, China. Chin. Geogr. Sci. 2018, 28, 470–481. [Google Scholar] [CrossRef]
- Feng, X.; Fu, B.; Lu, N.; Zeng, Y.; Wu, B. How ecological restoration alters ecosystem services: An analysis of carbon sequestration in China’s Loess Plateau. Sci. Rep. 2013, 3, 2846. [Google Scholar] [CrossRef] [PubMed]
- Deng, L.; Shangguan, Z.P.; Sweeney, S. “Grain for Green” driven land use change and carbon sequestration on the Loess Plateau, China. Sci. Rep. 2014, 4, 7039. [Google Scholar] [CrossRef] [PubMed] [Green Version]
- Feng, X.M.; Fu, B.J.; Piao, S.L.; Wang, S.; Ciais, P.; Zeng, Z.Z.; Lv, Y.H.; Zeng, Y.; Li, Y.; Jiang, X.H.; et al. Revegetation in China’s Loess Plateau is approaching sustainable water resource limits. Nat. Clim. Chang. 2016, 6, 1019–1022. [Google Scholar] [CrossRef]
- Wang, Y.; Cao, S. Carbon sequestration may have negative impacts on ecosystem health. Environ. Sci. Technol. 2011, 45, 1759–1760. [Google Scholar] [CrossRef] [PubMed]
- Cao, S.; Chen, L.; Yu, X. Impact of China’s Grain for Green Project on the landscape of vulnerable arid and semi-arid agricultural regions: A case study in northern Shaanxi Province. J. Appl. Ecol. 2009, 46, 536–543. [Google Scholar] [CrossRef]
- Wang, X.M.; Zhang, C.X.; Hasi, E.; Dong, Z.B. Has the Three Norths Forest Shelterbelt Program solved the desertification and dust storm problems in arid and semiarid China? J. Arid Environ. 2010, 74, 13–22. [Google Scholar] [CrossRef]
- Aldous, A.; Fitzsimons, J.; Richter, B.; Bach, L. Droughts, floods and freshwater ecosystems: Evaluating climate change impacts and developing adaptation strategies. Mar. Freshw. Res. 2011, 62, 223–231. [Google Scholar] [CrossRef]
- Lawler, J.J. Climate change adaptation strategies for resource managementand conservation planning. Ann. N. Y. Acad. Sci. 2009, 1162, 79–98. [Google Scholar] [CrossRef] [PubMed]
- Chang, X.L.; Lu, C.X.; Gao, Y.B. Impacts of human economic activities on wind and sand environment in Kerqin sandy land. Resour. Sci. 2003, 25, 78–83. (In Chinese) [Google Scholar]
- Ma, Y.H.; Fan, S.Y.; Zhou, L.H.; Dong, Z.H.; Zhang, K.C.; Feng, J.M. The temporal change of driving factors during the course of land desertification in arid region of North China: The case of Minqin County. Environ. Geol. 2007, 51, 999–1008. [Google Scholar] [CrossRef]
- Zhang, Y.S.; Wang, L.X.; Zhang, H.Q.; Li, X.Y. Influence of environmental factor changes on desertification process in Shule River. Resour. Sci. 2003, 25, 60–65. (In Chinese) [Google Scholar]
- Gang, C.; Zhou, W.; Chen, Y.; Wang, Z.; Sun, Z.; Li, J.; Qi, J.; Odeh, I. Quantitative assessment of the contributions of climate change and human activities on global grassland degradation. Environ. Earth Sci. 2014, 72, 4273–4282. [Google Scholar] [CrossRef]
- Evans, J.; Geerken, R. Discrimination between climate and human-induced dryland degradation. J. Arid Environ. 2004, 57, 535–554. [Google Scholar] [CrossRef]
- Prince, S.D.; Wessels, K.J.; Tucker, C.J.; Nicholson, S.E. Desertification in the Sahel: A reinterpretation of a reinterpretation. Glob. Chang. Biol. 2007, 13, 1308–1313. [Google Scholar] [CrossRef]
- Wessels, K.J.; Prince, S.D.; Frost, P.E.; Zyl, D. Assessing the effects of human-induced land degradation in the former homelands of northern South Africa with a 1 km AVHRR NDVI time-series. Remote Sens. Environ. 2004, 91, 47–67. [Google Scholar] [CrossRef]
- Chen, B.; Zhang, X.; Tao, J.; Wu, J.; Wang, J.; Shi, P.; Zhang, Y.; Yu, C. The impact of climate change and anthropogenic activities on alpine grassland over the Qinghai-Tibet Plateau. Agric. For. Meteorol. 2014, 189–190, 11–18. [Google Scholar] [CrossRef]
- Wessels, K.J.; Prince, S.D.; Reshef, I. Mapping land degradation by comparison of vegetation production to spatially derived estimates of potential production. J. Arid Environ. 2008, 72, 1940–1949. [Google Scholar] [CrossRef]
- Yeganeh, H.; Khajedein, S.J.; Amiri, F.; Shariff, A.R.B.M. Monitoring rangeland ground cover vegetation using multitemporal MODIS data. Arabian J. Geosci. 2014, 7, 287–298. [Google Scholar] [CrossRef]
- Zheng, Y.R.; Xie, Z.X.; Robert, C.; Jiang, L.H.; Shimizu, H. Did climate drive ecosystem change and induce desertification in Otindag sandy land, China over the past 40 years? J. Arid Environ. 2006, 64, 523–541. [Google Scholar] [CrossRef]
- Wang, H.; Liu, G.; Li, Z.; Ye, X.; Wang, M.; Gong, L. Impacts of climate change on net primary productivity in arid and semiarid regions of China. Chin. Geogr. Sci. 2015, 26, 35–47. [Google Scholar] [CrossRef] [Green Version]
- Nemani, R.R.; Keeling, C.D.; Hashimoto, H.; Jolly, W.M.; Piper, S.C.; Tucker, C.J.; Myneni, R.B.; Running, S.W. Climate driven increases in global terrestrial net primary production from 1982 to 1999. Science 2003, 300, 1560–1563. [Google Scholar] [CrossRef] [PubMed]
- Li, S.; Yan, J.; Liu, X.; Wan, J. Response of vegetation restoration to climate change and human activities in Shaanxi-Gansu-Ningxia Region. J. Geogr. Sci. 2013, 23, 98–112. [Google Scholar] [CrossRef]
- Haberl, H.; Krausmann, F.; Erb, K.; Schulz, N.B. Human Appropriation of Net Primary Production. Science 2002, 296, 1968–1969. [Google Scholar] [CrossRef] [PubMed]
- Zhou, W.; Gang, C.; Zhou, F.; Li, J.; Dong, X.; Zhao, C. Quantitative assessment of the individual contribution of climate and human factors to desertification in northwest China using net primary productivity as an indicator. Ecol. Indic. 2015, 48, 560–569. [Google Scholar] [CrossRef]
- Haberl, H.; Erb, K.; Krausmann, F.; Gaube, V.; Bondeau, A.; Plutzar, C.; Gingrich, S.; Lucht, W.; Fischer-Kowalski, M. Quantifying and Mapping the Human Appropriation of Net Primary Production in Earth’s Terrestrial Ecosystems. Proc. Natl. Acad. Sci. USA 2007, 104, 12942–12947. [Google Scholar] [CrossRef] [PubMed]
- Yang, Y.; Wang, Z.; Li, J.; Gang, C.; Zhang, Y.; Zhang, Y.; Odeh, I.; Qi, J. Comparative assessment of grassland degradation dynamics in response to climate variation and human activities in China, Mongolia, Pakistan and Uzbekistan from 2000 to 2013. J. Arid Environ. 2016, 135, 164–172. [Google Scholar] [CrossRef]
- Xu, D.; Kang, X.; Liu, Z.; Zhuang, D.; Pan, J. Assessing the relative role of climate change and human activities in sandy desertification of Ordos region, China. Sci. China 2009, 52, 855–868. (In Chinese) [Google Scholar] [CrossRef]
- Xie, F.; Qiu, G.; Yin, J.; Xiong, Y.J.; Wang, P. Comparison of Land Use/Land Cover Change in Three Sections of the Jinghe River Basin between the 1970s and 2006. J. Nat. Resour. 2009, 24, 1354–1365. (In Chinese) [Google Scholar]
- Yue, D.X.; Du, J.; Liu, J.Y.; Gou, J.J.; Zhang, J.J.; Ma, J.H. Spatio-temporal analysis of ecological carrying capacity in Jinghe Watershed based on Remote Sensing and Transfer Matrix. Acta Ecol. Sin. 2011, 31, 2550–2558. (In Chinese) [Google Scholar]
- Qi, Q.; Wang, T.; Kou, X.J.; Ge, J.P. Temporal and spatial changes of vegetation cover and the relationship with precipitation in Jinghe watershed of china. J. Plant Ecol. 2009, 33, 246–253. (In Chinese) [Google Scholar]
- Zhang, Y.S.; Chen, X.; Gao, M.; Zhang, Z.C.; Cheng, Q.B. Detecting Temporal Variations of Temperature Characteristics in Jinghe Watershed. J. Water Resour. Res. 2017, 6, 33–41. (In Chinese) [Google Scholar] [CrossRef]
- Slayback, D.A.; Pinzon, J.E.; Los, S.O.; Tucker, C.J. Northern hemisphere photosynthetic trends 1982–99. Glob. Chang. Biol. 2003, 9, 1–15. [Google Scholar] [CrossRef]
- Wang, X.; Piao, S.L.; Ciais, P.; Li, J.; Friedlingstein, P.; Koven, C.; Chen, A. Spring temperature change and its implication in the change of vegetation growth in North America from 1982 to 2006. Proc. Natl. Acad. Sci. USA 2011, 108, 1240–1245. [Google Scholar] [CrossRef] [PubMed] [Green Version]
- Lieth, H. Primary production: Terrestrial ecosystems. Hum. Ecol. 1973, 1, 303–332. [Google Scholar] [CrossRef]
- Lin, H.; Feng, Q.; Liang, T.; Ren, J. Modelling global-scale potential grassland changes in spatio-temporal patterns to global climate change. Int. J. Sustain. Dev. World Ecol. 2012, 20, 83–96. [Google Scholar] [CrossRef]
- Adams, B.; White, A.; Lenton, T.M. An analysis of some diverse approaches to modelling terrestrial net primary productivity. Ecol. Model. 2004, 177, 353–391. [Google Scholar] [CrossRef]
- Mu, S.; Zhou, S.; Chen, Y.; Li, J.; Ju, W.; Odeh, I.O.A. Assessing the impact of restoration-induced land conversion and management alternatives on net primary productivity in Inner Mongolian grassland, China. Glob. Planet. Chang. 2013, 108, 29–41. [Google Scholar] [CrossRef]
- Monteith, J.L. Solar Radiation and Porductivity in Tropical Exosystems. J. Appl. Ecol. 1972, 9, 747–766. [Google Scholar] [CrossRef]
- Potter, C.S.; Randerson, J.T.; Field, C.B.; Matson, P.A.; Vitousek, P.M.; Mooney, H.A.; Klooster, S.A. Terrestrial ecosystem production: A process model based on global satellite and surface data. Glob. Biogeochem. Cycles 1993, 7, 811–841. [Google Scholar] [CrossRef]
- Wen, Y.; Liu, X.; Du, G. Nonuniform Time-Lag Effects of Asymmetric Warming on Net Primary Productivity across Global Terrestrial Biomes. Earth Interact. 2018, 22, 1–26. [Google Scholar] [CrossRef]
- Shi, Y.; Shen, Y.; Kang, E.; Li, D.; Ding, Y.; Zhang, G.; Hu, R. Recent and Future Climate Change in Northwest China. Clim. Chang. 2006, 80, 379–393. [Google Scholar] [CrossRef]
- Zhang, C.X.; Wang, X.; Li, J.C.; Hua, T. Roles of climate changes and human interventions in land degradation: A case study by net primary productivity analysis in China’s Shiyanghe Basin. Environ. Earth Sci. 2011, 64, 2183–2193. [Google Scholar] [CrossRef]
- Zhou, W.; Li, J.; Mu, S.J.; Gang, C.C.; Sun, Z.G. Effects of ecological restoration-induced land-use change and improved management on grassland net primary productivity in the Shiyanghe River Basin, north-west China. Grass Forage Sci. 2013, 10, 1111. [Google Scholar] [CrossRef]
- Lu, Y.; Fu, B.; Feng, X.; Zeng, Y.; Liu, Y.; Chang, R.; Sun, G.; Wu, B. A policy-driven large scale ecological restoration: Quantifying ecosystem services changes in the Loess Plateau of China. PLoS ONE 2012, 7, e31782. [Google Scholar]
- Wu, S.H.; Zhou, S.L.; Chen, D.X.; Wei, Z.Q.; Dai, L.; Li, X.G. Determining the contributions of urbanisation and climate change to NPP variations over the last decade in the Yangtze River Delta, China. Sci. Total Environ. 2014, 472, 397–406. [Google Scholar] [CrossRef] [PubMed]
- Mu, S.J.; Chen, Y.Z.; Li, J.L.; Ju, W.M.; Odeh, I.O.A.; Zou, X.L. Grassland dynamics in response to climate change and human activities in Inner Mongolia, China between 1985 and 2009. Rangel. J. 2013, 35, 315–329. [Google Scholar] [CrossRef]
- Zhu, W.Q.; Pan, Y.Z.; Zhang, J.S. Estimation of net primary productivity of Chinese terrestrial vegetation based on remote sensing. J. Plant Ecol. 2007, 31, 413–424. (In Chinese) [Google Scholar]
- Yu, D.Y.; Shi, P.J.; Shao, H.B.; Zhu, W.Q.; Pan, Y.Z. Modelling net primary productivity of terrestrial ecosystems in East Asia based on an improved CASA ecosystem model. Int. J. Remote Sens. 2009, 30, 4851–4866. [Google Scholar] [CrossRef] [Green Version]
- Zaks, D.P.; Ramankutty, N.; Barford, C.C.; Foley, J.A. From Miami to Madison: Investigating the relationship between climate and terrestrial net primary production. Glob. Biogeochem. Cycles 2007, 21, GB3004. [Google Scholar] [CrossRef]
- Cao, X.; Gu, Z.H.; Chen, J.; Liu, J.; Shi, P.J. Analysis of human-induced steppe degradation based on remote sensing in Xilin Gole, Inner Mongolia, China. J. Plant Ecol. 2006, 30, 268–277. (In Chinese) [Google Scholar]
- Yi, L.; Ren, Z.Y.; Zhang, C.; Liu, W. Vegetation cover, climate and human activities on the loess plateau. Resour. Sci. 2014, 36, 166–174. (In Chinese) [Google Scholar]
- Wang, Q.; Zhang, B.; Dai, S.P.; Zhang, F.F.; Zhao, Y.F.; Yin, H.X.; He, X.Q. Analysis of the vegetation cover chang and its relationship with factors in the Three-North Shelter Forest Program. China Environ. Sci. 2012, 32, 1302–1308. (In Chinese) [Google Scholar]
- Su, C.; Fu, B. Evolution of ecosystem services in the Chinese Loess Plateau under climatic and land use changes. Glob. Planet. Chang. 2013, 101, 119–128. [Google Scholar] [CrossRef] [Green Version]
- Wang, Y.; Fu, B.; Lü, Y.; Chen, L. Effects of vegetation restoration on soil organic carbon sequestration at multiple scales in semi-arid Loess Plateau, China. Catena 2011, 85, 58–66. [Google Scholar] [CrossRef] [Green Version]
- Li, S.; Liang, W.; Fu, B.; Lu, Y.; Fu, S.; Wang, S.; Su, H. Vegetation changes in recent large-scale ecological restoration projects and subsequent impact on water resources in China’s Loess Plateau. Sci. Total Environ. 2016, 569–570, 1032–1039. [Google Scholar] [CrossRef] [PubMed]
- Li, J.; Peng, S.; Li, Z. Detecting and attributing vegetation changes on China’s Loess Plateau. Agric. For. Meteorol. 2017, 247, 260–270. [Google Scholar] [CrossRef]
- Li, J.; Li, Z.; Lü, Z. Analysis of spatiotemporal variations in land use on the Loess Plateau of China during 1986–2010. Environ. Earth Sci. 2016, 75, 997. [Google Scholar] [CrossRef]
- Deng, L.; Liu, G.B.; Shangguan, Z.P. Land-use conversion and changing soil carbon stocks in China’s ‘Grain-for-Green’ Program: A synthesis. Glob. Chang. Biol. 2014, 20, 3544–3556. [Google Scholar] [CrossRef] [PubMed]
- Luck, G.W.; Smallbone, L.T.; O’Brien, R. Socio-Economics and Vegetation Change in Urban Ecosystems: Patterns in Space and Time. Ecosystems 2009, 12, 604–620. [Google Scholar] [CrossRef]
- Li, Z.; Wang, J.; Liu, W.Z. Climate Changes in Jinghe Watershed and Its Relationship with ENSO. Prog. Geogr. 2010, 29, 833–839. (In Chinese) [Google Scholar]
- Zhao, C.; Li, Z.; Liu, W.Z. Downscaling GCMs to Project the Potential Changes of Precipitation in Jinghe Basin. Res. Soil Water Conserv. 2014, 21, 23–28. (In Chinese) [Google Scholar]
- Zhang, H.B.; Gu, L.; Xin, C.; Yu, Q.J. Investigation on the Spatial-temporal Variation of Drought Characteristics in Jinghe River Basin. J. North China Univ. Water Resour. Electr. Power 2016, 37, 1–10. (In Chinese) [Google Scholar]
- Lal, R. Carbon Sequestration in Dryland Ecosystems. Environ. Manag. 2004, 33, 528–544. [Google Scholar] [CrossRef] [PubMed]
- Wang, H.S.; Huang, M.; Zhang, L. Impacts of re-vegetation on water cycle in a small watershed of the Loess Plateau. J. Nat. Resour. 2004, 19, 344–350. [Google Scholar]
- Tian, F.; Feng, X.; Zhang, L.; Fu, B.; Wang, S.; Lv, Y.; Wang, P. Effects of revegetation on soil moisture under different precipitation gradients in the Loess Plateau, China. Hydrol. Res. 2017, 48, 1378–1390. [Google Scholar] [CrossRef]


| Land Use Types | Forest | Shrub | Grassland | Farmland | Others |
|---|---|---|---|---|---|
| Area in percentage | 28.7 | 10.2 | 32.1 | 27.3 | 1.7 |
| Number | Method | Cause of Vegetation Dynamics Change |
|---|---|---|
| Condition 1 | Sa = 0 | the vegetation had no change (NC) |
| Condition 2 | Sa > 0 and Se > Sh | the restoration of vegetation dominated by climate factors (RDC) |
| Condition 3 | Sa > 0 and Se < Sh | the restoration of vegetation dominated by human factors (RDH) |
| Condition 4 | Sa < 0 and Se > Sh | the degradation of vegetation dominated by climate factors (DDC) |
| Condition 5 | Sa < 0 and Se < Sh | the degradation of vegetation dominated by human factors (DDH) |
© 2018 by the authors. Licensee MDPI, Basel, Switzerland. This article is an open access article distributed under the terms and conditions of the Creative Commons Attribution (CC BY) license (http://creativecommons.org/licenses/by/4.0/).
Share and Cite
Wang, H.; Liu, G.; Li, Z.; Wang, P.; Wang, Z. Assessing the Driving Forces in Vegetation Dynamics Using Net Primary Productivity as the Indicator: A Case Study in Jinghe River Basin in the Loess Plateau. Forests 2018, 9, 374. https://doi.org/10.3390/f9070374
Wang H, Liu G, Li Z, Wang P, Wang Z. Assessing the Driving Forces in Vegetation Dynamics Using Net Primary Productivity as the Indicator: A Case Study in Jinghe River Basin in the Loess Plateau. Forests. 2018; 9(7):374. https://doi.org/10.3390/f9070374
Chicago/Turabian StyleWang, Hao, Guohua Liu, Zongshan Li, Pengtao Wang, and Zhuangzhuang Wang. 2018. "Assessing the Driving Forces in Vegetation Dynamics Using Net Primary Productivity as the Indicator: A Case Study in Jinghe River Basin in the Loess Plateau" Forests 9, no. 7: 374. https://doi.org/10.3390/f9070374