Investment Uncertainty Analysis in Eucalyptus Bole Biomass Production in Brazil


1
School of Agriculture, São Paulo State University (Unesp), Botucatu 18610-307, Brazil
2
Campus of Uruguaiana, Federal University of Pampa (Unipampa), Uruguaiana 97508-000, Brazil
*
Author to whom correspondence should be addressed.
Forests 2018, 9(7), 384; https://doi.org/10.3390/f9070384
Submission received: 24 March 2018
/
Revised: 19 May 2018
/
Accepted: 25 June 2018
/
Published: 27 June 2018
(This article belongs to the Special Issue At the Frontiers of Knowledge in Forest Economics)
Abstract
:Forestry investment projects for the biomass production of the eucalyptus bole can be characterized by uncertain environments, which result in economic risk to the forest producer, however that can be measured by applying probabilistic techniques. This was our motivation and justification for analyzing the economic-financial viability of different silvicultural practices for eucalyptus bole biomass production under conditions of uncertainties, running Monte Carlo method for risk management. The experiment was carried out in the state of São Paulo, Brazil, using 5 treatments with spacings of 3 m × 2 m; 3 m × 1 m; 1.5 m × 2 m; 3 m × 0.5 m; and 1.5 m × 1.0 m, i.e., different spacings between planting lines and plants. These treatments were characterized as investment projects. To develop stochastic models, we relied on technical-economic deterministic variables. We evaluated the investment projects based on the cash flows under conditions of uncertainty, discounted at the attractiveness rate calculated by capital asset pricing model. With the results of these economic flows, the net present value, the modified internal rate of return and the profitability index values were estimated, commonly used in the analysis of investments in projects. The results showed that based on economic metrics, the three-year rotation cycle for forest stands for biomass production of the main bole of eucalyptus, with a spacing of three meters between rows and two meters between plants, had an 83% probability of economic success. The sensitivity analysis showed that the bole biomass of eucalyptus is the most important variable for determining the economic-financial feasibility of the investment project.
1. Introduction
In recent years, the Brazilian forestry sector, specifically in the production of forest biomass used as raw material for the generation of energy, has presented important advances that have contributed to forest improvement, with a view to the process of converting wood to energy, based on the triple bottom line.
In Brazil, a potential alternative energy source is biomass from forests, particularly from the genus Eucalyptus, which has several selected clonal stands for energy production [1]. The need for a biomass that is fast growing, relatively low cost, and highly productive has been the main motivation to explore the potential for bioenergy production from eucalyptus [2].
However, if the bioenergy supply is not viewed from the perspective of the production process, some judgments about their economic value may be inaccurate [3]. Thus, understanding of the production system is necessary to seek opportunities while minimizing costs and ultimately maximizing profits [4]. The estimated revenues and expenses based on wood production predictions can contribute to this knowledge [5]. The economic viability analysis in forestry is therefore important for identifying the items that most affect cash flow, and for proposing alternatives and alerting the tree grower about project risks [6]. In addition, the understanding of forest economics requires applied studies focusing on different regions and species [7].
Given this perspective, the analysis should focus on stand density, silvicultural treatments, and the forestry rotation that influence the analysis of profitability and sensitivity of the project. In addition, depending on the purpose, one can also consider weather and environmental factors, such as climate change, variability in rainfall, insect calamities, among others; however, these factors have associated uncertainties, which may lead to a mistaken economic profitability.
Economic profitability is the most important factor for the adoption of short rotation biomass energy forests, with the volume of wood and production costs as the probable determinants of this profitability. Short rotation forestry (SRF) in Brazil consists basically of the production of forests of the eucalyptus from 24 to 36 months.
Yet, scant empirical evidence is available about how uncertainty intrinsic to this type of investment affects the adoption of bioenergy perennials. In reality, few studies have quantified the financial risk for forest investments. Therefore, the scientific community needs to supply decision makers with simulations that include uncertainty analysis due to their central role in the characterization and quantification of risk [8,9,10,11,12].
Applications of computer simulation have emerged as a promising method for characterizing uncertainty. These computational methods are known to be more expressive and provide important insights in the areas of natural sciences, engineering, finance, and many others. Furthermore, a successful analysis method should be able to reduce simulation data to its essential scientific features, without oversimplification [13,14,15,16]. A widely used example is the Monte Carlo simulation technique to consider unpredictable situations, considered a state-of-the-art methodology in risk analysis, useful for forecasts and estimates, as for economic factors [17,18,19].
Monte Carlo (MC) simulation is used to account for uncertainties in the data and assumptions. This means that random samples are taken from the assumed distributions of the uncertain parameters, and the model is solved for each set of such random parameter values. The procedure is repeated as many times as is necessary [20], using a random uniformly distributed number generator in the [0, 1] interval and also by using the cumulative distribution function associated with these stochastic variables [21]. The Monte Carlo simulation is used to address technical parameters, price and cost projections, and simulate scenarios with probabilities of the financial performance of the analyzed model, presenting a better picture of the expected outcome and the related uncertainties [22,23].
In this context, the main focus of this study was to analyze the economic-financial viability of different silvicultural practices for eucalyptus bole biomass production, varying economic metrics, and production parameters, running the Monte Carlo method for risk management. Our hypothesis is that the production of bole biomass is economically viable, both with conventional and high planting densities. Thus, stochastic models were created from data about five planting arrangements in a short-rotation system, which allowed an analysis of the most important variables. This type of modeling provides a framework for risk assessment and allows the identification of adverse consequences and their associated probabilities, and can be applied to biomass crop investment decision analysis [24].
2. Materials and Methods
2.1. Study Stands
To measure the economic-financial risk intrinsic to the biomass production forestry projects of the main bole, the premise of the stochastic models is the construction of deterministic models from the technical-economic coefficients of a productive cycle from a clonal hybrid of Eucalyptus urophylla S. T. Blake (clone AEC 144). This hybrid stands out in short-rotation energy plantations in tropical climates, due to its high productivity [25,26]. The short-rotation plantation was planted in the municipality of Borebi in the state of São Paulo, Brazil, located at 22°34′44″ S and 48°57′58″ W, at an altitude of 590 m above sea level. In this area, the predominant soil type is a red-yellow sandy phase latosol [27]. The average annual temperature is 22 °C, while relative total annual rainfall is 1355 mm.
2.2. Silvicultural System
The experimental area was prepared with a 40-cm deep furrow shank with the application of dolomitic limestone (1.5 t/ha) in continuous band placement. The eucalyptus seedlings were planted using manual seed introducers, without irrigation, due to the amount of rainfall during planting. At 30 days, survival was evaluated with total area count. After 42 days after planting, seedling mortality was assessed for the total area, and required the replanting of approximately 17% of the plants.
After the replanting, base fertilization with 300 kg/ha−1 of nitrogen, phosphorus, and potassium (NPK 06:30:06), 0.3% boron (B), and 0.3% zinc (Zn) was completed in small side pits according to the stand density. Cover fertilization was performed three and six months after planting, with a total of 250 kg/ha of NPK 19:00:19 per hectare according to the stand density.
The planning of the study was based on the establishment of mutually exclusive experimental plots, characterized as investment projects in forest stands for the biomass production of the main bole of eucalyptus. Thus, the choice of a project eliminates the possibility of implementing another concurrent project, even if all plots showed economic attractiveness [28].
The production of wood is commonly evaluated by the volume of wood produced per unit area over a specified time period. Additionally, the choice of tree spacing may be a differential, and profits may be increased by decreasing harvesting age by using a short rotation [29,30]. Thus, the investment projects had different spacing between planting lines and plants. The planting spacing was: Plot 1 (P1): 3 m × 2 m; P2: 3 m × 1 m; P3: 1.5 m × 2 m; P4: 3 m × 0.5 m; P5: 1.5 m × 1.0 m. Therefore, the number of plants in the forest stands per financial investment project were 1667 (P1), 3333 (P2 and P3), and 6667 (P4 and P5) per hectare, requiring a total area of 0.7 hectares. The bole biomass (dry weight, in ton/ha) was obtained in the time limit for short rotation forestry, i.e., 36 months after planting at cutting age, from the determination of the basic density of the wood, according to Barbosa and Breitschaft [31].
2.3. Experimental Design
The experiment was carried out using a split plot design, with 4 blocks and 5 treatments. The treatments with a spacing of 3 m between rows formed a plot and the treatments with a spacing of 1.5 m between rows formed the other plot within each block. In the treatments with 3 m between lines, 100 cuttings were planted per treatment (10 cuttings per row × 10 rows) in each block and in the treatments with 1.5 m between lines 152 cuttings were planted per treatment (8 cuttings per row × 19 rows) in each block, adding up to 2416 plants in an area of 7080 m² (120 m × 59 m).
2.4. Economic-Financial Analysis
The economic analysis was computed from the outflows of cash and the revenue, or inflow of cash, generated in the last year of the project, assuming a financial investment lifetime of three years. The outflows of cash included the cost of cultivation and maintenance of the forest stand that was proportionally modified according to the level of the operations required for the forestry production.
The biomass price (USD/m3) was obtained from the historical eucalyptus wood prices for energy received by the rural producers in São Paulo State between January 2011 and September 2017, according to information from the Agricultural Economics Institute [32]. The average land value for reforestation (2774.95 per hectare) in the studied region was used as the basis for the estimation of land remuneration, according to data provided by the Agricultural Economics Institute [33] and using the discount rate of investments. These nominal prices were deflated based on the respective weighted periods, through the National Broad Consumer Price Index (IPCA), according to the Central Bank of Brazil [34].
Therefore, to determine the discount rate for the measurement of investment proposals [35], the capital asset pricing model (CAPM) model was adopted, which, according to Villadsen et al. [36], estimates the cost of capital as the sum of a risk-free rate and a premium for the risk of the particular security. Formally, it is defined by:
where is the risk-adjusted discount rate; is the risk free rate (three year T-Bills rates); is the systematic risk of the forest products industry; is the expected return assumed to be the forest products industry; is the risk premium; and is the country risk premium.
2.5. Quantitative Methods of Investment Analysis
We considered quantitative methods of investment analysis which take into account the discounted cash flows, therefore, the amounts were updated to the present date through the discount rate. We used the net present value (NPV) to determine the most attractive option. So, the merit of the project is measured considering its contribution to the creation of economic value [37], which is defined as:
where is the net present value (USD/dry ton/ha); is the duration of the investment project; is the time period in which costs and revenues occur; is the cash flow for j periods; is the interest rate; and is the deployment costs processed at time zero.
As investment projects in forest stands have unconventional cash flows, the profitability of these projects was analyzed based on the modified internal rate of return (MIRR). This method is achieved by adding all the positive interim cash flows to the end of the project lifecycle and discounting all the negative interim cash flows to the beginning of the project life cycle [38]. Notably, MIRR was developed by Duvillard in 1787 [39], expressed as:
where is the modified internal rate of return (%); is the reinvestment rate; is the reinvestment financing; is the revenue (positive net value, in each period “j” of cash flow); and is costs (negative net value, in each period “j” of cash flow).
Due to the possibility of using different rates for cash flows with positive and negative values, it was adopted as reinvestment rate of a historical series of income credited to the Total Savings Account between 1 February 2006 and 18 September 2017. To determine the rate of financing used to decapitalize the negative cash flows (non-conventional cash flow), we considered data from the economic-financial time series referring to the rate of the Special Clearance and Escrow System (SELIC) observed between January 2006 and August 2017. Both series are available from the Central Bank of Brazil [40].
2.6. Risk Analysis
The mathematical model includes deterministic and dynamic variables. The deterministic variables were bole biomass (dry ton/ha), deployment costs (USD/ha), cultural treatment costs for 1st year (USD/ha), cultural treatment costs for 2nd year (USD/ha), administration costs (USD/ha), and land remuneration (USD/ha). Due to lack of information for these variables, we assumed the distribution followed a symmetrical triangular distribution [45,46,47,48]. The probability distribution is the building block for risk models that calculates the probability distribution of output random variables based on the probability distribution of input random variables [49]. Therefore, a variant of ±15.0% of the deterministic values was delimited, based on the opinion of forestry experts.
Dynamic variables that consider time-varying [50] were biomass price (USD/m3), rate of financing (%), and interest rate (%) decomposed using trending [51]. The integrated autoregressive moving averages (ARIMA) process (p.d.q.) [52] was used because this mathematical model allows us to describe the behavior of the stationary and non-stationary series and, based on this behavior, to make future forecasts. This gives versatility to a variety of situations [53,54], with the statistical model criteria selected by the Bayesian Information Criterion (BIC), successfully employed for model selection and hypothesis testing procedures [55].
As for the output variables of the stochastic models (probabilistic variables), we applied the three quantitative methods of investment analysis mentioned above. In this study, the sensitivity analysis was based on the correlation coefficients proposed by Franzblau [56] of the deterministic and dynamic variables that most influence the NPV of each financial investment project. The NPV can be considered as one of the preferred methods for financial feasibility studies of investment projects, which is determined to take into account the intrinsic uncertainties of these projects, allowing quantification of the risks that can affect the results of the evaluation. In addition, the NPV probabilistic value is used as the key output variable to compare and rank the scenarios, as it summarizes the economic feasibility of the business across a multiple-year planning horizon [57,58].
The simulations, the descriptive statistics of the data and Spearman coefficient, used to verify the interrelationship of the input variables, were obtained through @Risk 7.5.2 software (Copyright © 2017 Palisade Corporation, Ithaca, NY, USA) [59]. The software was used to generate 100,000 pseudorandom numbers with probability distribution using Monte Carlo method. The default of the random number generator of the @Risk was the Mersenne Twister proposed by Matsumoto and Nishimura [60] as a strong uniform pseudorandom number generator, ensuring the same initial parameter for all investment projects in the forest stands for biomass production of the main bole of eucalyptus.
3. Results
From the bole biomass obtained 36 months after planting and the triangular distribution, the descriptive measures were obtained for each project in the forest stands (Table 1). The highest modal value of the bole biomass, that is, the most frequently observed value in a dataset, was obtained in P4, although the number of trees per hectare in P4 and P5 projects was identical (6667).
The return required for investment projects based on CAPM considered the 1.5% risk-free interest rate issued by the US Treasury Department for the 3-year period, the weighted coefficient = 0.82 for forest products industries and Brazil’s risk premium of 3.46%, obtained from Damodaran [61]; the market risk premium is assumed to be the S & P Global Timber & Forestry Index for the same period, which provides an annualized return of 6.48%. From those values, it was possible to determine the return on risk-free assets, that is, the cost of equity, of 9.04%. The reinvestment rate projected to reapply positive cash flows used was 7.5% per year and the financing rate used to raise funds, due to negative cash flows over the useful life of the investments, was 13.8% per year.
The intrinsic modal values of the cost of cultivation (USD/ha) of the forest stand, delimited by the investment projects (Table 2), were modified due to the spacing required by distinct silvicultural practices, mainly due to the number of forest seedlings. The costs of seedlings and fertilizers represented the highest percentages in the total costs of cultivation, averaging 21.2% and 28.4%, respectively. Regarding the price of land for the region of this study, the stochastic analysis of the time series estimated the value of USD2126.78 per hectare.
The biomass price, measured over a period of 69 months, allowed us to estimate the price at 30.76 USD/dry ton, thus making it possible to calculate the gross revenue generated for each experimental plot and, consequently, the NPV. For clarity, only five stochastic variables with the largest influence on the NPV are presented in Figure 1. Consequently, those not shown had negligible correlation coefficients. The bole biomass is the stochastic variable that most impacted the NPV because it presented a moderate correlation coefficient (<0.7) for the financial investments P5 and correlation coefficients considered strong (0.7 < |r| < 0.8) for the other investments.
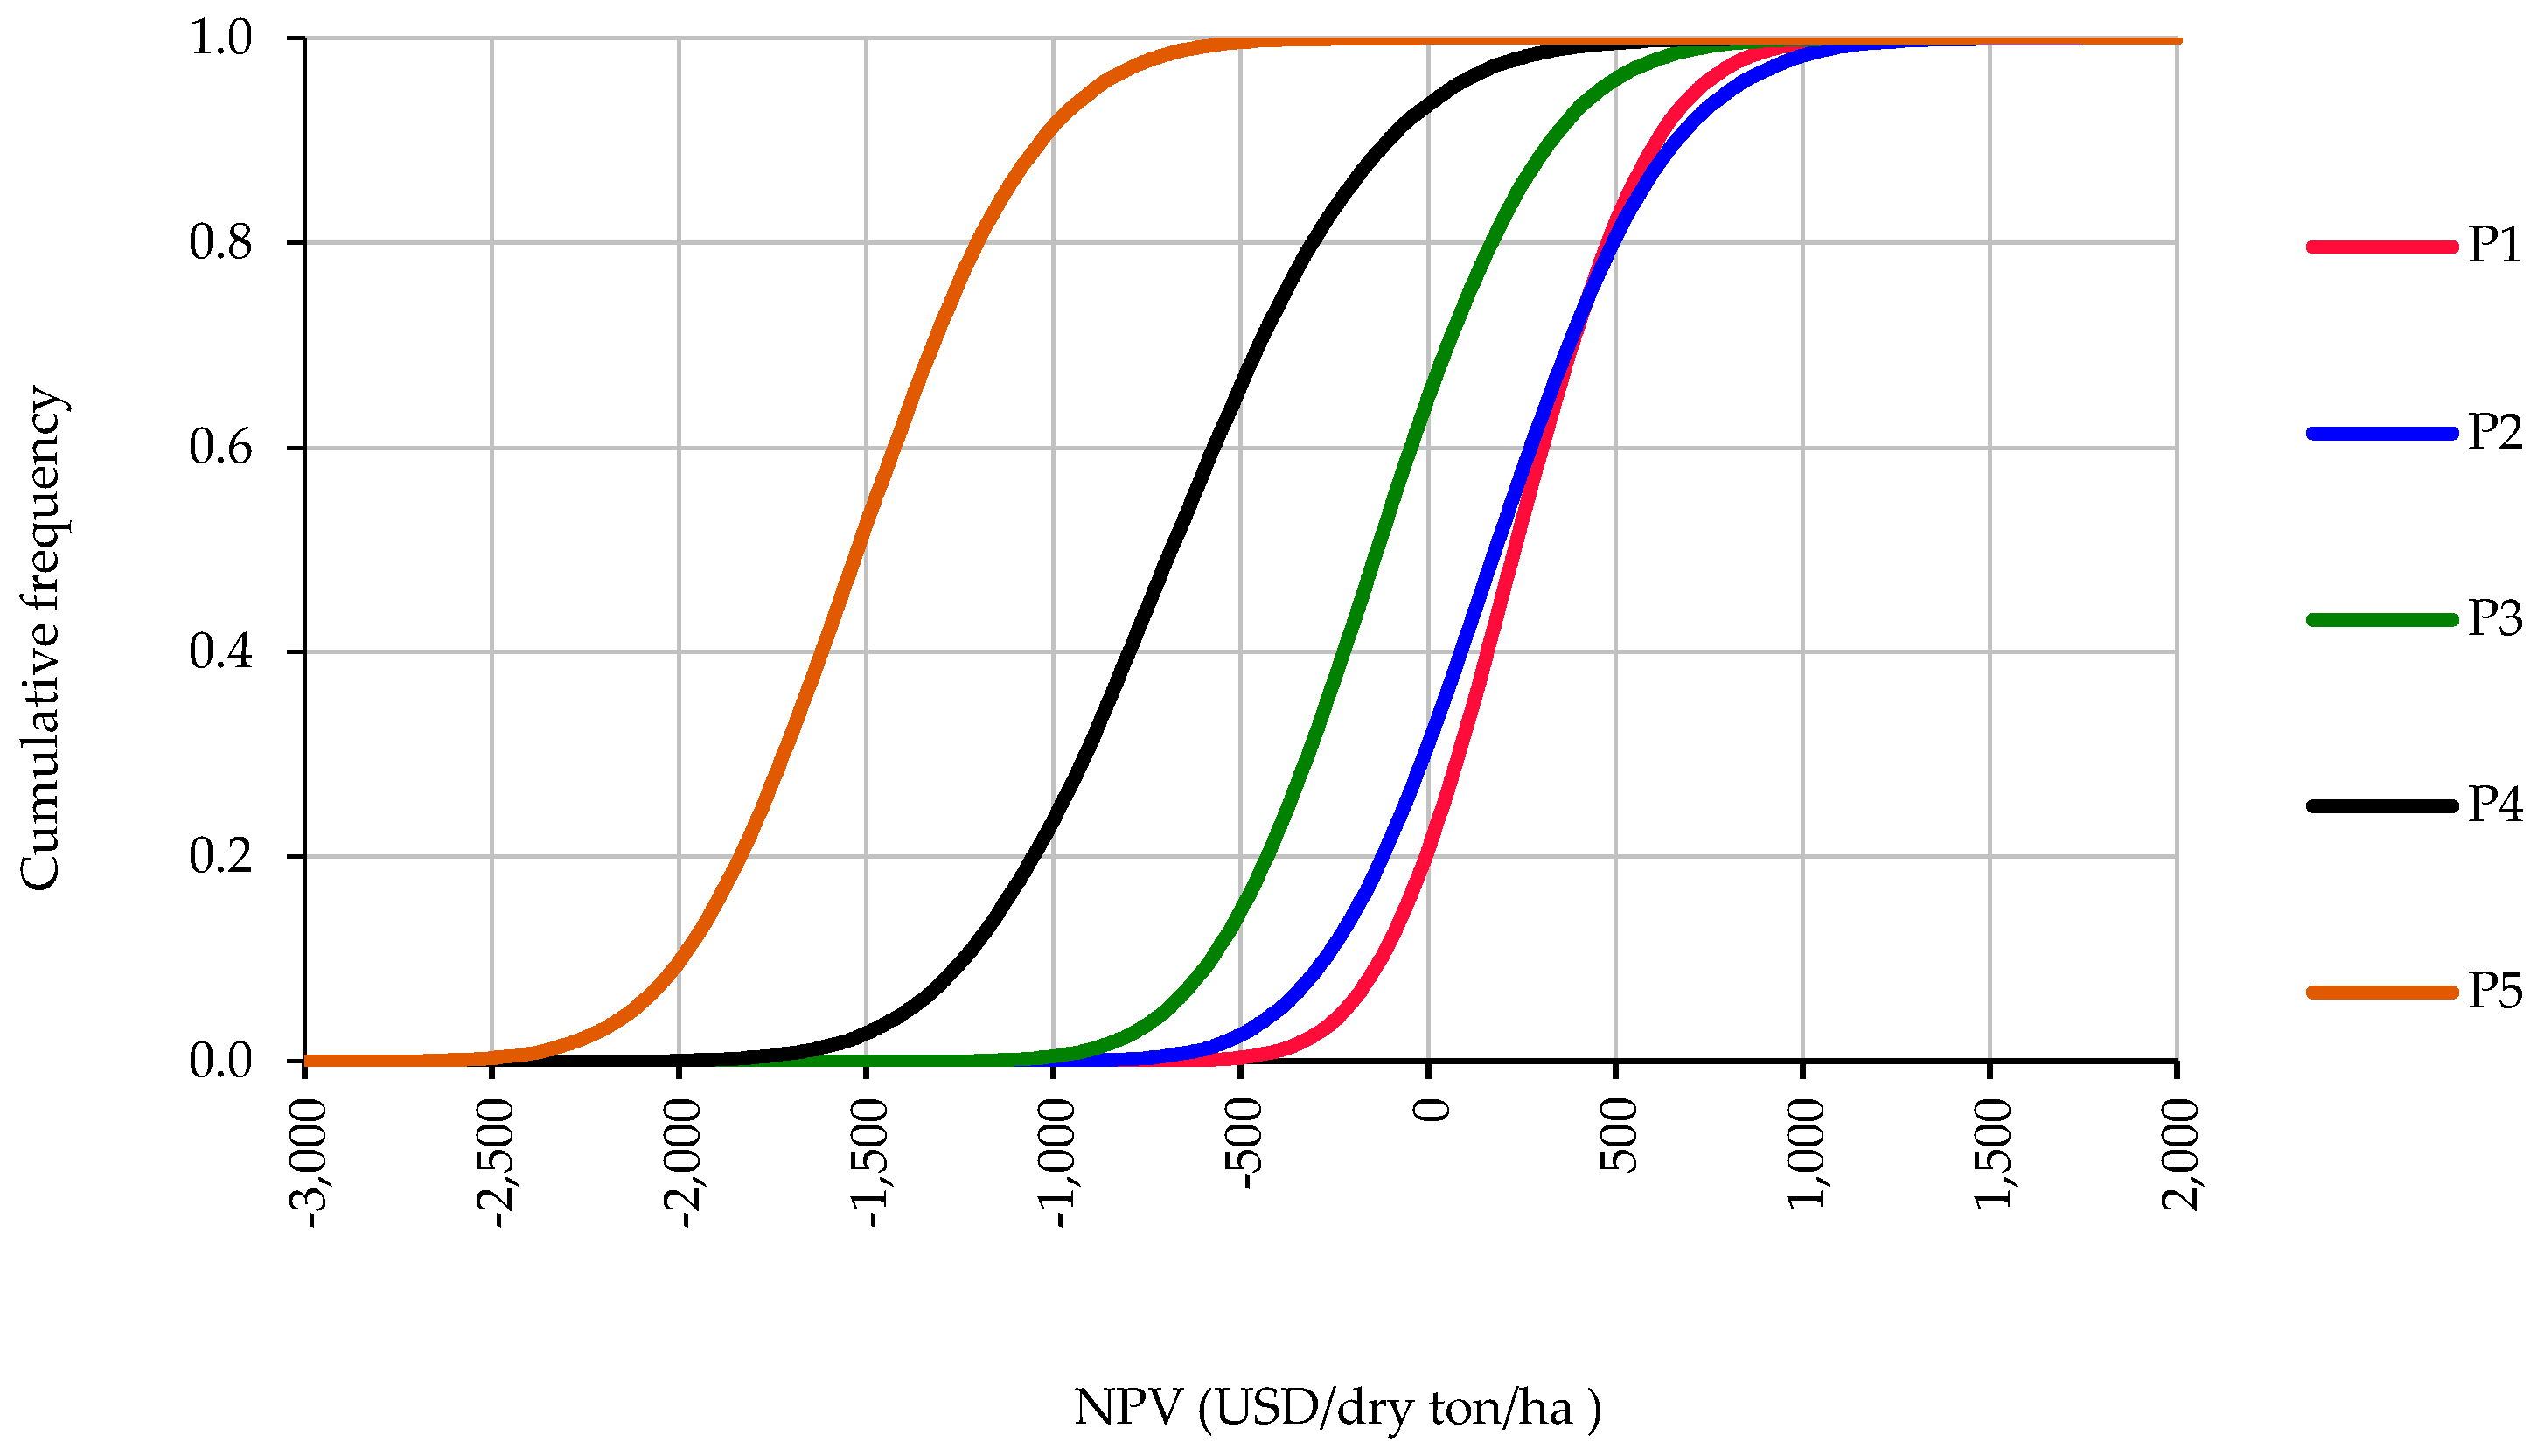
Only the P1 and P2 investment projects (Figure 2) had cumulative probability distribution functions in between 74.4% and 61.4%, respectively, meaning they add economic value to the eucalyptus main bole biomass production investment projects. The modal NPV values were are 234.02 USD/dry ton/ha and 212.04 USD/dry ton/ha, with a risk of loss of 20.6% and 30.9% for P1 and P2, respectively.
When analyzing P3, the project presents a relative risk, since the probability of earning a profit in relation to the investment realized is 64.9%, with a modal NPV value of (166.53 USD/dry ton/ha). The P4 investment project has an extremely high probability (93.5%) of an NPV less than zero. Following this perspective, the negative modal NPV value (781.83 USD/dry ton/ha) is not enough to offset the expenses incurred. As for P5, the probability of a positive NPV is zero (0.0%).
Only the projects P1 and P2 have a higher MIRR (Table 3) than CAPM, which represents the rate of return on capital used to evaluate financial investment projects. It should be emphasized that there exists a probability of 16.3% and 26.6%, respectively, to be less than this discount rate, unlike P3, P4 and P5 projects, which have risks greater of 60% of MIRR not exceeding CAPM.
The modal PI values of P1 and P2 have the respective probability of 85.4% and 77.5%, meaning these projects can add value to the forest producer. P3, P4, and P5 projects, after analysis, are not economically feasible, as the modal values of the obtained indexes were less than 1.0 (Table 4).
4. Discussion
The productivity of commercial reforestation with eucalyptus, for the biomass production of the main bole, is premised on the spatial distribution of the trees, which determines the volume of wood harvested and the cost of cultivation. Given this perspective, the smaller distance between trees (P4) provided the largest main bole biomass volume.
The cultivation costs included all costs associated with growing the energy crop [62]. Therefore, the highest cultivation costs were obtained for P5 USD3793.17 and P4 USD3621.65. These higher costs were due to the combination of the higher number of seedlings and the greater soil disruption (subsoiling), which was twice as high compared to projects with a 3-m spacing between rows. Although the density of plants was the same, the spatial arrangement was different. So, in project P4, the line spacing, which was the subsoiling activity, was 3 m, whereas, in project P5, the subsoiling was performed every 1.5 m, increasing the cost of soil preparation, and consequently increasing the cost of reforestation.
The Spearman coefficient is usually used to quantify how well two columns of data monotonically depend on each other, meaning the coefficient determines the degree to which each of the variables is correlated with the factor that is common to all variables in the analysis [63,64], i.e., the correlation study indicates the relationship between two monotonic variables. The resultant values will always be between +1 and −1. In addition, the signal will designate the direction of the correlation as either positive or negative.
For P1, the biomass price contributed to 66.9% of the NPV variance, yet for P2, P3, P4 and P5 the contribution was 65.7%, 63.6%, 58.7% and 51.4%, respectively, contributing positively to the NPV, with correlations between 0.69 and 0.80. The deployment costs had a strong negative effect on P5, contributing to 27.7% of the NPV variance; furthermore, for P1, this contribution was 5.3%, considered a weak correlation (−0.23), corroborating the significance of this cost in the economic-financial viability of the investment project.
The NPV is a coefficient that determines the merit of the project; once NPV is estimated at a discount rate that corresponds to the cost of capital, the value expressed in monetary units will reflect the added economic value of the project. However, due to the uncertainties of the variables necessary for the calculation of VPL, intrinsic risks usually exist. This condition influences the decision-making, which is based on the risk aversion level of investors [65,66]. As NPV determines which project will be accepted from mutually exclusive projects [67], P4 and P5 must be discarded due to their lack of potential for profit.
Because this method reapplies the investment rate to positive cash flows that normally occur with the revenues generated by the sale of the forest biomass, and uses a rate of funding to raise funds at times when the fund is obtained from negative cash flow during forest implementation, this method results in more plausible rates in accordance with the economic reality being analyzed.
Thus, the bole biomass stochastic variable contributed to 63.9% and 60.4% of the MIRR variance for P1 and P2, respectively. The probability of P3 having a MIRR higher than CAPM was 9.9%, so this project has little chance of economic success. The results of the simulation also showed that P4 and P5 have no probability of economic financial feasibility, as the sum of the cash flows were lower than the investments.
The biomass forest stochastic variable positively contributed to the PI, as demonstrated for NPV and MIRR. Thus, this variable was responsible for 65.8% and 64.8% of the total variability of MIRR for P1 and P2, respectively. The main variable that explained the variability of the simulated data for this quantitative method of financial investment analysis was the biomass forest stochastic variable. The profitability index was computed as the quotient of the present value of a project, discounted expected future cash flows (numerator), and its initial outlay (denominator).
Notably, the investment projects in forest stands planted for the biomass production of the main bole of eucalyptus were classified as mutually exclusive. In addition, the projects had differences in the scales of the investments. Therefore, as only P1 and P2 were deemed economically feasible, choosing the project with which to proceed was easy, since the NPV, MIRR, and PI results indicated P1 was the best project, having a more attractive NPV, a better rate of return, and greater profitability.
5. Conclusions
According to our observations, the bole biomass production using the conventional planting arrangement (P1 with 3 m × 2 m spacing) harvested at 36 months is the most economically attractive. As the investments were classified as mutually exclusive, the others should be discarded. Although net present value results in an absolute value, the feasibility of P1 was confirmed by the modal value of the modified internal rate of return, which was 3% higher than risk-adjusted discount rate, and the forest producer could obtain a return of USD0.28 for each U.S. dollar invested. The net present value and Profitability index simulation results showed that the probability of economic-financial success for this project was 83%, allowing us to infer a low expectation of financial loss. For this percentage of success, bole biomass was the second most important stochastic variable of this project, with the significance of 25.2%. However, the financial investment with a dense planting arrangement (1.5 m × 1.0 m) in P5, resulted in a high risk to the forest producer due to the null probability of obtaining financial returns. Although the amount of bole biomass was 13% higher compared to the bole biomass of P1, it did not sufficiently compensate for the costs of cultivation and the investment. Notably, we considered only one production cycle, so the results obtained may be different if these same arrangements were applied to two or three productive cycles in the silvicultural system of coppice (sprouting).
Author Contributions
D.S. built the stochastic models and wrote the paper; A.J.D. performed the experiments and analyzed the data of the biomass of the main bole; M.R.d.S. designed the experiment.
Acknowledgments
This work was conducted during a scholarship financed by CAPES—Brazilian Federal Agency for Support and Evaluation of Graduate Education within the Ministry of Education of Brazil
Conflicts of Interest
The authors declare no conflict of interest.
References
- De Andrade, T.C.G.R.; de Barros, N.F.; Dias, L.E.; Azevedo, M.I.R. Biomass yield and calorific value of six clonal stands of Eucalyptus urophylla S. T. Blake cultivated in Northeastern Brazil. Cerne 2013, 19, 467–472. [Google Scholar] [CrossRef]
- Gonzalez, R.; Treasure, T.; Phillips, R.; Jameel, H.; Saloni, D.; Abt, R.; Wright, J. Converting Eucalyptus biomass into ethanol: Financial and sensitivity analysis in a co-current dilute acid process. Part II. Biomass Bioenergy 2011, 35, 767–772. [Google Scholar] [CrossRef]
- Cozzi, M.; Di Napoli, F.; Viccaro, M.; Romano, S. Use of Forest Residues for Building Forest Biomass Supply Chains: Technical and Economic Analysis of the Production Process. Forests 2013, 4, 1121–1140. [Google Scholar] [CrossRef] [Green Version]
- Wagner, J.E. Forestry Economics: A Managerial Approach; Routledge: Abingdon, UK, 2012; ISBN 978-0-41-577440-6. [Google Scholar]
- Holopainen, M.; Mäkinen, A.; Rasinmäki, J.; Hyytiäinen, K.; Bayazidi, S.; Vastaranta, M.; Pietilä, I. Uncertainty in Forest Net Present Value Estimations. Forests 2010, 1, 177–193. [Google Scholar] [CrossRef] [Green Version]
- Rode, R.; Leite, H.G.; da Silva, M.L.; Ribeiro, C.A.Á.S.; Binoti, D.H.B. The economics and optimal management regimes of eucalyptus plantations: A case study of forestry outgrower schemes in Brazil. For. Policy Econ. 2014, 44, 26–33. [Google Scholar] [CrossRef]
- Rosa, R.; Soares, P.; Tomé, M. Evaluating the Economic Potential of Uneven-aged Maritime Pine Forests. Ecol. Econ. 2018, 143, 210–217. [Google Scholar] [CrossRef]
- Hauk, S.; Knoke, T.; Wittkopf, S. Economic evaluation of short rotation coppice systems for energy from biomass—A review. Renew. Sustain. Energy Rev. 2014, 29, 435–448. [Google Scholar] [CrossRef]
- Skevas, T.; Swinton, S.M.; Tanner, S.; Sanford, G.; Thelen, K.D. Investment risk in bioenergy crops. GCB Bioenergy 2016, 8, 1162–1177. [Google Scholar] [CrossRef] [Green Version]
- Hildebrandt, P.; Knoke, T. Investment decisions under uncertainty—A methodological review on forest science studies. For. Policy Econ. 2011, 13, 1–15. [Google Scholar] [CrossRef]
- Larocque, G.R.; Bhatti, J.S.; Liu, J.; Ascough, J.C., II; Luckai, N.; Gordon, A.M. The importance of uncertainty and sensitivity analyses in process-based models of carbon and nitrogen cycling in terrestrial ecosystems with particular emphasis on forest ecosystems: Selected papers from a workshop organized by the International Society for Ecological Modelling (ISEM) at the third biennial meeting of the International Environmental Modelling and Software Society (IEMSS) in Burlington, Vermont, USA, August 9–13, 2006. Ecol. Model. 2008, 219, 261–263. [Google Scholar] [CrossRef]
- Helton, J.C. Treatment of Uncertainty in Performance Assessments for Complex Systems. Risk Anal. 1994, 14, 483–511. [Google Scholar] [CrossRef]
- Nguyen, A.-T.; Reiter, S.; Rigo, P. A review on simulation-based optimization methods applied to building performance analysis. Appl. Energy 2014, 113, 1043–1058. [Google Scholar] [CrossRef] [Green Version]
- Brosig, F.; Meier, P.; Becker, S.; Koziolek, A.; Koziolek, H.; Kounev, S. Quantitative Evaluation of Model-Driven Performance Analysis and Simulation of Component-Based Architectures. IEEE Trans. Softw. Eng. 2015, 41, 157–175. [Google Scholar] [CrossRef] [Green Version]
- MacCalman, A.D.; Vieira, H.; Lucas, T. Second-order nearly orthogonal Latin hypercubes for exploring stochastic simulations. J. Simul. 2017, 11, 137–150. [Google Scholar] [CrossRef] [Green Version]
- Lane, T.J.; Shukla, D.; Beauchamp, K.A.; Pande, V.S. To milliseconds and beyond: Challenges in the simulation of protein folding. Curr. Opin. Struct. Biol. 2013, 23, 58–65. [Google Scholar] [CrossRef] [PubMed]
- Mun, J. Modeling Risk; John Wiley & Sons, Inc.: Hoboken, NJ, USA, 2012; ISBN 978-1-11-836633-2. [Google Scholar]
- Arnold, U.; Yildiz, Ö. Economic risk analysis of decentralized renewable energy infrastructures—A Monte Carlo Simulation approach. Renew. Energy 2015, 77, 227–239. [Google Scholar] [CrossRef]
- Lee, B.; Heo, J.; Choi, N.H.; Moon, C.; Moon, S.; Lim, H. Economic evaluation with uncertainty analysis using a Monte-Carlo simulation method for hydrogen production from high pressure PEM water electrolysis in Korea. Int. J. Hydrogen Energy 2017, 42, 24612–24619. [Google Scholar] [CrossRef]
- Kallio, A.M.I. Accounting for uncertainty in a forest sector model using Monte Carlo simulation. For. Policy Econ. 2010, 12, 9–16. [Google Scholar] [CrossRef]
- Platon, V.; Constantinescu, A. Monte Carlo Method in Risk Analysis for Investment Projects. Procedia Econ. Financ. 2014, 15, 393–400. [Google Scholar] [CrossRef]
- Batan, L.Y.; Graff, G.D.; Bradley, T.H. Techno-economic and Monte Carlo probabilistic analysis of microalgae biofuel production system. Bioresour. Technol. 2016, 219, 45–52. [Google Scholar] [CrossRef] [PubMed]
- Afanasyeva, S.; Saari, J.; Kalkofen, M.; Partanen, J.; Pyrhönen, O. Technical, economic and uncertainty modelling of a wind farm project. Energy Convers. Manag. 2016, 107, 22–33. [Google Scholar] [CrossRef]
- Clancy, D.; Breen, J.P.; Thorne, F.; Wallace, M. A stochastic analysis of the decision to produce biomass crops in Ireland. Biomass Bioenergy 2012, 46, 353–365. [Google Scholar] [CrossRef]
- Dickmann, D. Silviculture and biology of short-rotation woody crops in temperate regions: Then and now. Biomass Bioenergy 2006, 30, 696–705. [Google Scholar] [CrossRef]
- Hinchee, M.; Rottmann, W.; Mullinax, L.; Zhang, C.; Chang, S.; Cunningham, M.; Pearson, L.; Nehra, N. Short-rotation woody crops for bioenergy and biofuels applications. Vitro Cell. Dev. Biol. Plant 2009, 45, 619–629. [Google Scholar] [CrossRef] [PubMed] [Green Version]
- Santos, H.G.; Almeida, J.A.; Oliveira, J.B.; Lumbreras, J.F.; Anjos, L.H.C.; Coelho, M.R.; Jacomine, P.K.T.; Cunha, T.J.F.; Oliveira, V.A. Sistema Brasileiro de Classificação de Solos, 3rd ed.; EMBRAPA: Brasília, Brazil, 2013; ISBN 978-8-57-035198-2. [Google Scholar]
- Assaf Neto, A. Os métodos quantitativos de análise de investimentos. Caderno Estudos 1992, 1–16. [Google Scholar] [CrossRef]
- De Oliveira, F.L.R.; Cabacinha, C.D.; Santos, L.D.T.; Barroso, D.G.; Júnior, S.; Dos, A.; Brant, M.C.; Sampaio, R.A.; de Oliveira, F.L.R.; Cabacinha, C.D.; et al. Productive behavior of eucalyptus and acacia, in different arrangements of crop-livestock-forest integration. Cerne 2015, 21, 227–233. [Google Scholar] [CrossRef]
- Sereghetti, G.C.; Lanças, K.P.; Sartori, M.S.; Rezende, M.A.; Soler, R.R. Efeito do espaçamento no crescimento e na densidade básica da madeira de Eucalyptus urophylla X Eucalyptus grandis em florestas de ciclo curto. Energ. Agric. 2015, 30, 257–262. [Google Scholar] [CrossRef]
- Barbosa, V.C.; Breitschaft, A.M.S. Um aparato experimental para o estudo do princípio de Arquimedes. Rev. Bras. Ensino Fís. 2006, 26, 115–122. [Google Scholar] [CrossRef]
- Instituto de Economia Agrícola Mercados Florestais. Available online: http://www.iea.sp.gov.br/out/florestas.php (accessed on 30 August 2017).
- Instituto de Economia Agrícola Valor de Terra Nua. Available online: http://ciagri.iea.sp.gov.br/nia1/precor.aspx?cod_tipo=1&cod_sis=8 (accessed on 30 August 2017).
- Banco Central do Brasil Correção de Valores. Available online: https://www3.bcb.gov.br/CALCIDADAO/publico/exibirFormCorrecaoValores.do?method=exibirFormCorrecaoValores&aba=1 (accessed on 10 August 2017).
- Assaf Neto, A.; Lima, F.G.; Araújo, A.M.P. Metodologia de Cálculo do Custo de Capital no Brasil. Rev. Adm. 2008, 43, 72–83. [Google Scholar]
- Villadsen, B.; Vilbert, M.J.; Harris, D.; Lawrence Kolbe, A. The Capital Asset Pricing Model and Variations. In Risk and Return for Regulated Industries; Elsevier: New York, NY, USA, 2017; pp. 51–95. [Google Scholar]
- Žižlavský, O. Net Present Value Approach: Method for Economic Assessment of Innovation Projects. Procedia Soc. Behav. Sci. 2014, 156, 506–512. [Google Scholar] [CrossRef]
- Ben-Horin, M.; Kroll, Y. A simple intuitive NPV-IRR consistent ranking. Q. Rev. Econ. Financ. 2017, 66, 108–114. [Google Scholar] [CrossRef]
- Biondi, Y. The double emergence of the Modified Internal Rate of Return: The neglected financial work of Duvillard (1755–1832) in a comparative perspective. Eur. J. Hist. Econ. Thought 2006, 13, 311–335. [Google Scholar] [CrossRef]
- Banco Central do Brasil Sistema Gerenciador de Séries Temporais. Available online: https://www3.bcb.gov.br/sgspub/localizarseries/localizarSeries.do?method=prepararTelaLocalizarSeries (accessed on 4 September 2017).
- Reul, R.I. Profitability index for investments. Harv. Bus. Rev. 1957, 35, 116–132. [Google Scholar]
- Li, T.; Roskilly, A.P.; Wang, Y. A Regional Life Cycle Sustainability Assessment Approach and its Application on Solar Photovoltaic. Energy Procedia 2017, 105, 3320–3325. [Google Scholar] [CrossRef]
- Resurreccion, E.P.; Colosi, L.M.; White, M.A.; Clarens, A.F. Comparison of algae cultivation methods for bioenergy production using a combined life cycle assessment and life cycle costing approach. Bioresour. Technol. 2012, 126, 298–306. [Google Scholar] [CrossRef] [PubMed]
- Abensur, E.O. A multicriteria optimization model applied to the capital budgeting process. Gest. Produç. 2012, 19, 747–758. [Google Scholar] [CrossRef]
- Ponciano, N.J.; de Souza, P.M.; da Mata, H.T.C.; Vieira, J.R.; Morgado, I.F. Análise de viabilidade econômica e de risco da fruticultura na região norte Fluminense. Rev. Econ. Sociol. Rural 2004, 42, 615–635. [Google Scholar] [CrossRef]
- Peternelli, L.A.; da Silva, G.F.; Leite, H.G. Uma proposta para a geração de amostras aleatórias nos problemas de simulação em modelos de planejamento. Rev. Árvore 2006, 30, 749–758. [Google Scholar] [CrossRef] [Green Version]
- Lyra, G.B.; Ponciano, N.J.; de Souza, P.M.; de Sousa, E.F.; Lyra, G.B. Viabilidade econômica e risco do cultivo de mamão em função da lâmina de irrigação e doses de sulfato de amônio. Acta Sci. Agron. 2010, 32. [Google Scholar] [CrossRef]
- Simões, D.; Andrés Daniluk Mosquera, G.; Cristina Batistela, G.; Raimundo de Souza Passos, J.; Torres Fenner, P. Quantitative Analysis of Uncertainty in Financial Risk Assessment of Road Transportation of Wood in Uruguay. Forests 2016, 7, 130. [Google Scholar] [CrossRef]
- Garlick, A. Estimating Risk: A Management Approach; Gower Publishing Limited: Aldershot, UK, 2007; ISBN 978-0-56-608776-9. [Google Scholar]
- Fritzson, P. Introduction to Modeling and Simulation of Technical and Physical Systems with Modelica; John Wiley & Sons: Hoboken, NJ, USA, 2011; ISBN 978-1-11-801068-6. [Google Scholar]
- Doane, D.P.; Seward, L.E. Applied Statistics in Business & Economics, 4th ed.; McGraw-Hill Education: New York, NY, USA, 2014; ISBN 978-0-07-783730-3. [Google Scholar]
- Box, G.E.P.; Jenkins, G.M. Time Series Analysis: Forecasting and Control, 3rd ed.; Holden-Day: San Francisco, CA, USA, 1970; ISBN 978-0-81-621104-3. [Google Scholar]
- Werner, L.; Ribeiro, J.L.D. Previsão de demanda: Uma aplicação dos modelos Box-Jenkins na área de assistência técnica de computadores pessoais. Gest. Produç. 2003, 10, 47–67. [Google Scholar] [CrossRef]
- Sato, R.C. Gerenciamento de doenças utilizando séries temporais com o modelo ARIMA. Einstein 2013, 11, 128–131. [Google Scholar] [CrossRef] [PubMed] [Green Version]
- Almpanidis, G.; Kotropoulos, C. Phonemic segmentation using the generalised Gamma distribution and small sample Bayesian information criterion. Speech Commun. 2008, 50, 38–55. [Google Scholar] [CrossRef] [Green Version]
- Franzblau, A.N. A Primer of Statistics for Non-Statisticians; Harcourt, Brace: Oxford, UK, 1958; Volume viii, ISBN 978-1-57-473439-3. [Google Scholar]
- Qin, X.; Ma, X.; Bai, H. A Risk-Sensitivity Analysis on NPV Model of Investment Projects. In Computational Risk Management; Wu, D.D., Ed.; Springer: Berlin/Heidelberg, Germany, 2011; pp. 277–281, ISBN 978-3-64-215242-9; 978-3-64-215243-6. [Google Scholar]
- Rezende, M.L.; Richardson, J.W. Risk analysis of using sweet sorghum for ethanol production in southeastern Brazil. Biomass Bioenergy 2017, 97, 100–107. [Google Scholar] [CrossRef]
- Palisade Corporation. Palisade Corporation @Risk for Excel. v. 7.5.1; Palisade Corporation: Ithaca, NY, USA, 2016. [Google Scholar]
- Matsumoto, M.; Nishimura, T. Mersenne Twister: A 623-dimensionally Equidistributed Uniform Pseudo-random Number Generator. ACM Trans. Model. Comput. Simul. 1998, 8, 3–30. [Google Scholar] [CrossRef]
- Damodaran, A. Total Betas by Sector. Available online: http://pages.stern.nyu.edu/~adamodar/New_Home_Page/datafile/totalbeta.html (accessed on 29 January 2018).
- Ericsson, K.; Rosenqvist, H.; Nilsson, L.J. Energy crop production costs in the EU. Biomass Bioenergy 2009, 33, 1577–1586. [Google Scholar] [CrossRef] [Green Version]
- Zhang, W.-Y.; Wei, Z.-W.; Wang, B.-H.; Han, X.-P. Measuring mixing patterns in complex networks by Spearman rank correlation coefficient. Phys. A Stat. Mech. Appl. 2016, 451, 440–450. [Google Scholar] [CrossRef]
- Te Nijenhuis, J.; Bakhiet, S.F.; van den Hoek, M.; Repko, J.; Allik, J.; Žebec, M.S.; Sukhanovskiy, V.; Abduljabbar, A.S. Spearman’s hypothesis tested comparing Sudanese children and adolescents with various other groups of children and adolescents on the items of the Standard Progressive Matrices. Intelligence 2016, 56, 46–57. [Google Scholar] [CrossRef]
- Finger, R. Assessment of uncertain returns from investment in short rotation coppice using risk adjusted discount rates. Biomass Bioenergy 2016, 85, 320–326. [Google Scholar] [CrossRef] [Green Version]
- Giarola, S.; Bezzo, F.; Shah, N. A risk management approach to the economic and environmental strategic design of ethanol supply chains. Biomass Bioenergy 2013, 58, 31–51. [Google Scholar] [CrossRef]
- Petković, D. Adaptive Neuro-Fuzzy Optimization of the Net Present Value and Internal Rate of Return of a Wind Farm Project under Wake Effect. J. Cent. Cathedra 2015, 8, 11–28. [Google Scholar]
Figure 1.
Spearman monotonic correlation coefficients of the five main stochastic variables in relation to net present value (NPV) of the investment projects in eucalypt forest stands for biomass production.
Figure 1.
Spearman monotonic correlation coefficients of the five main stochastic variables in relation to net present value (NPV) of the investment projects in eucalypt forest stands for biomass production.
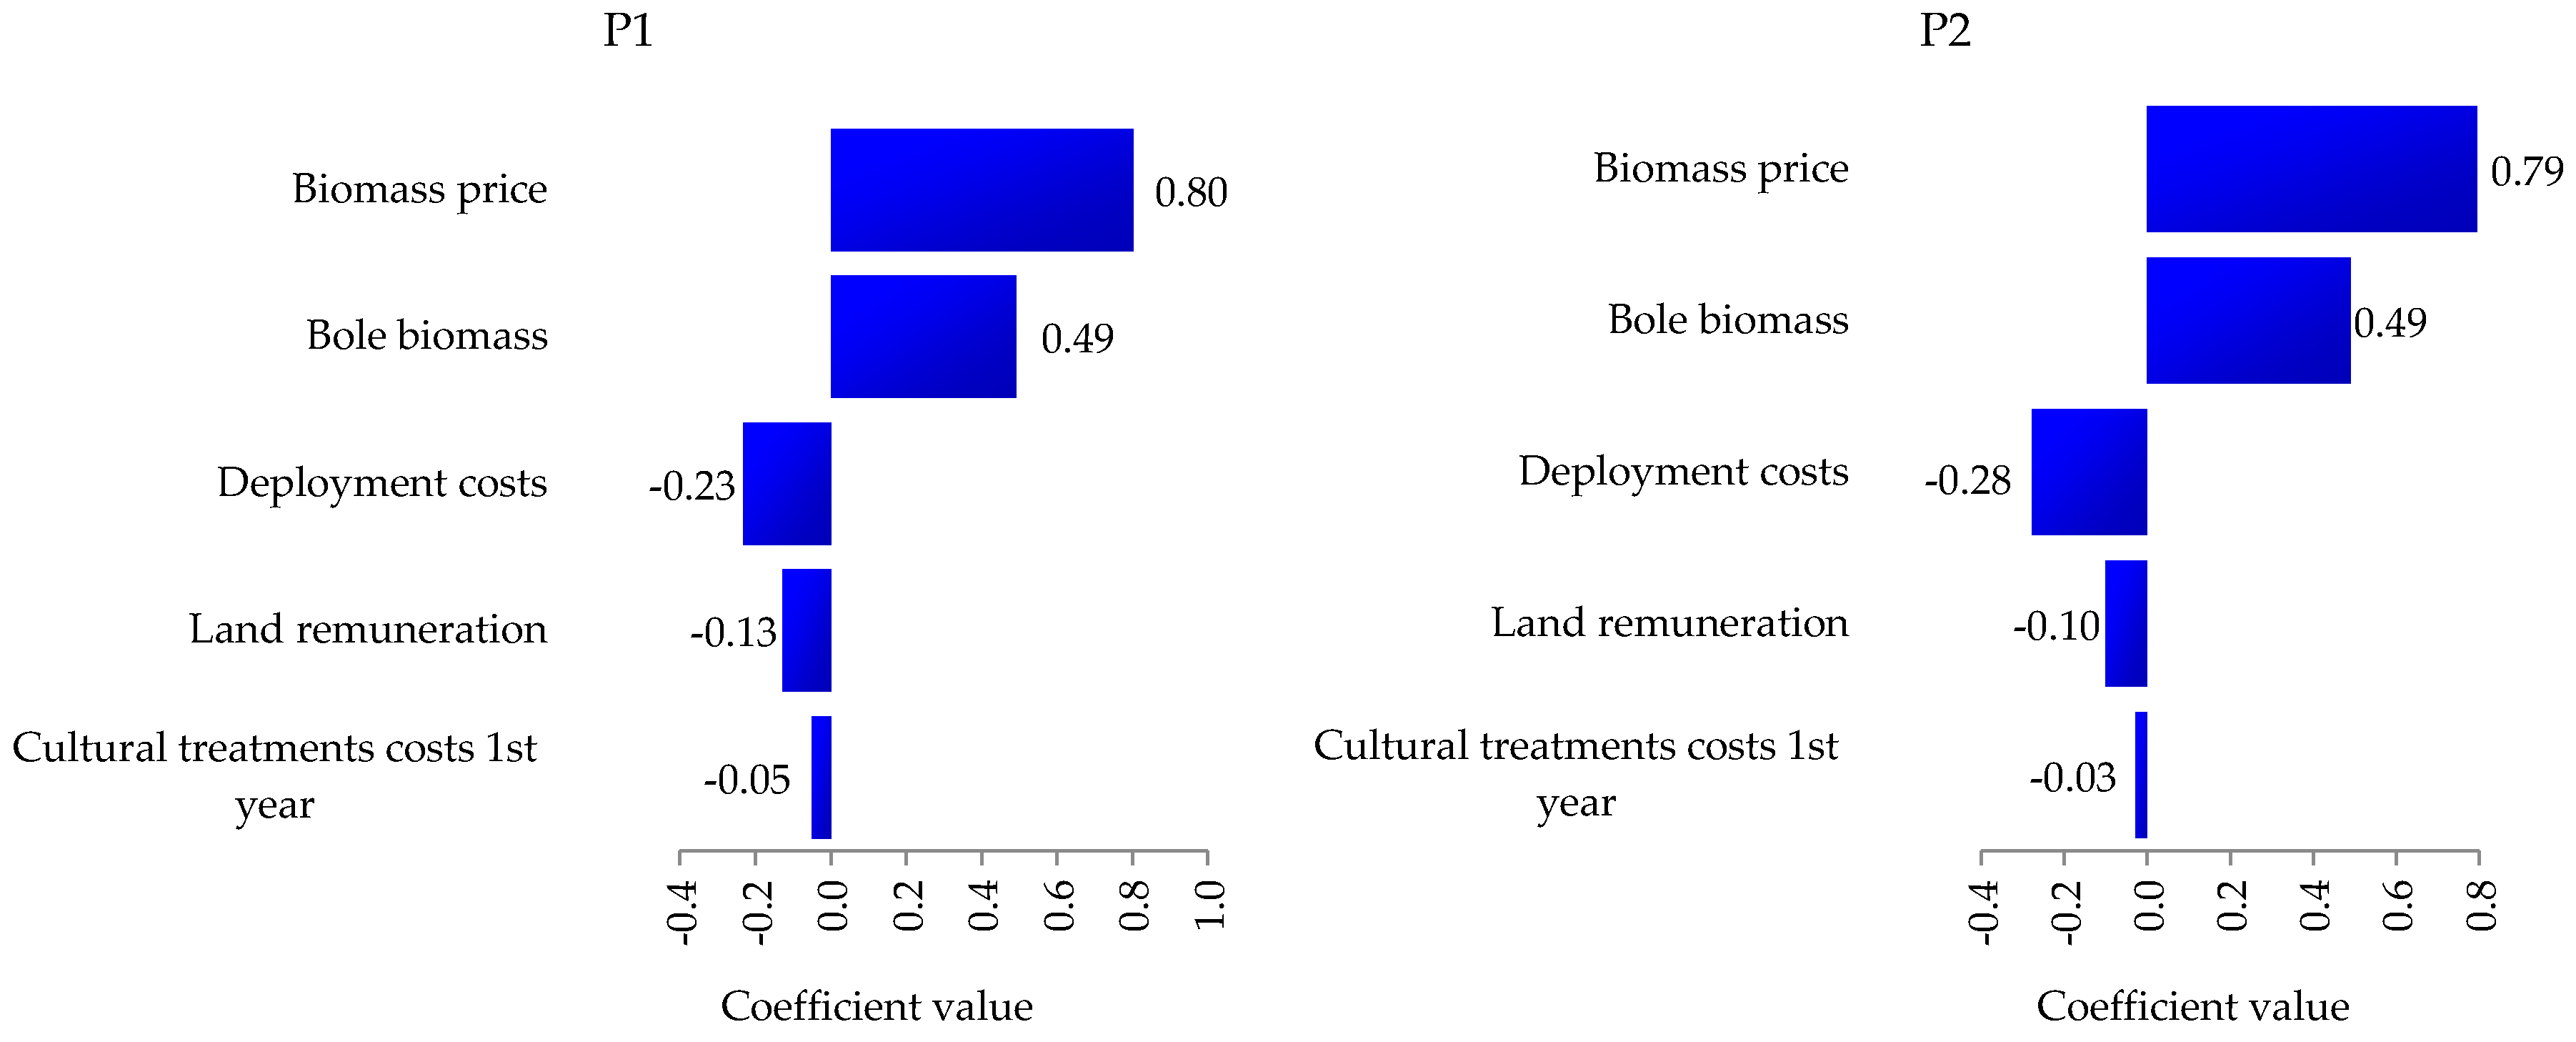
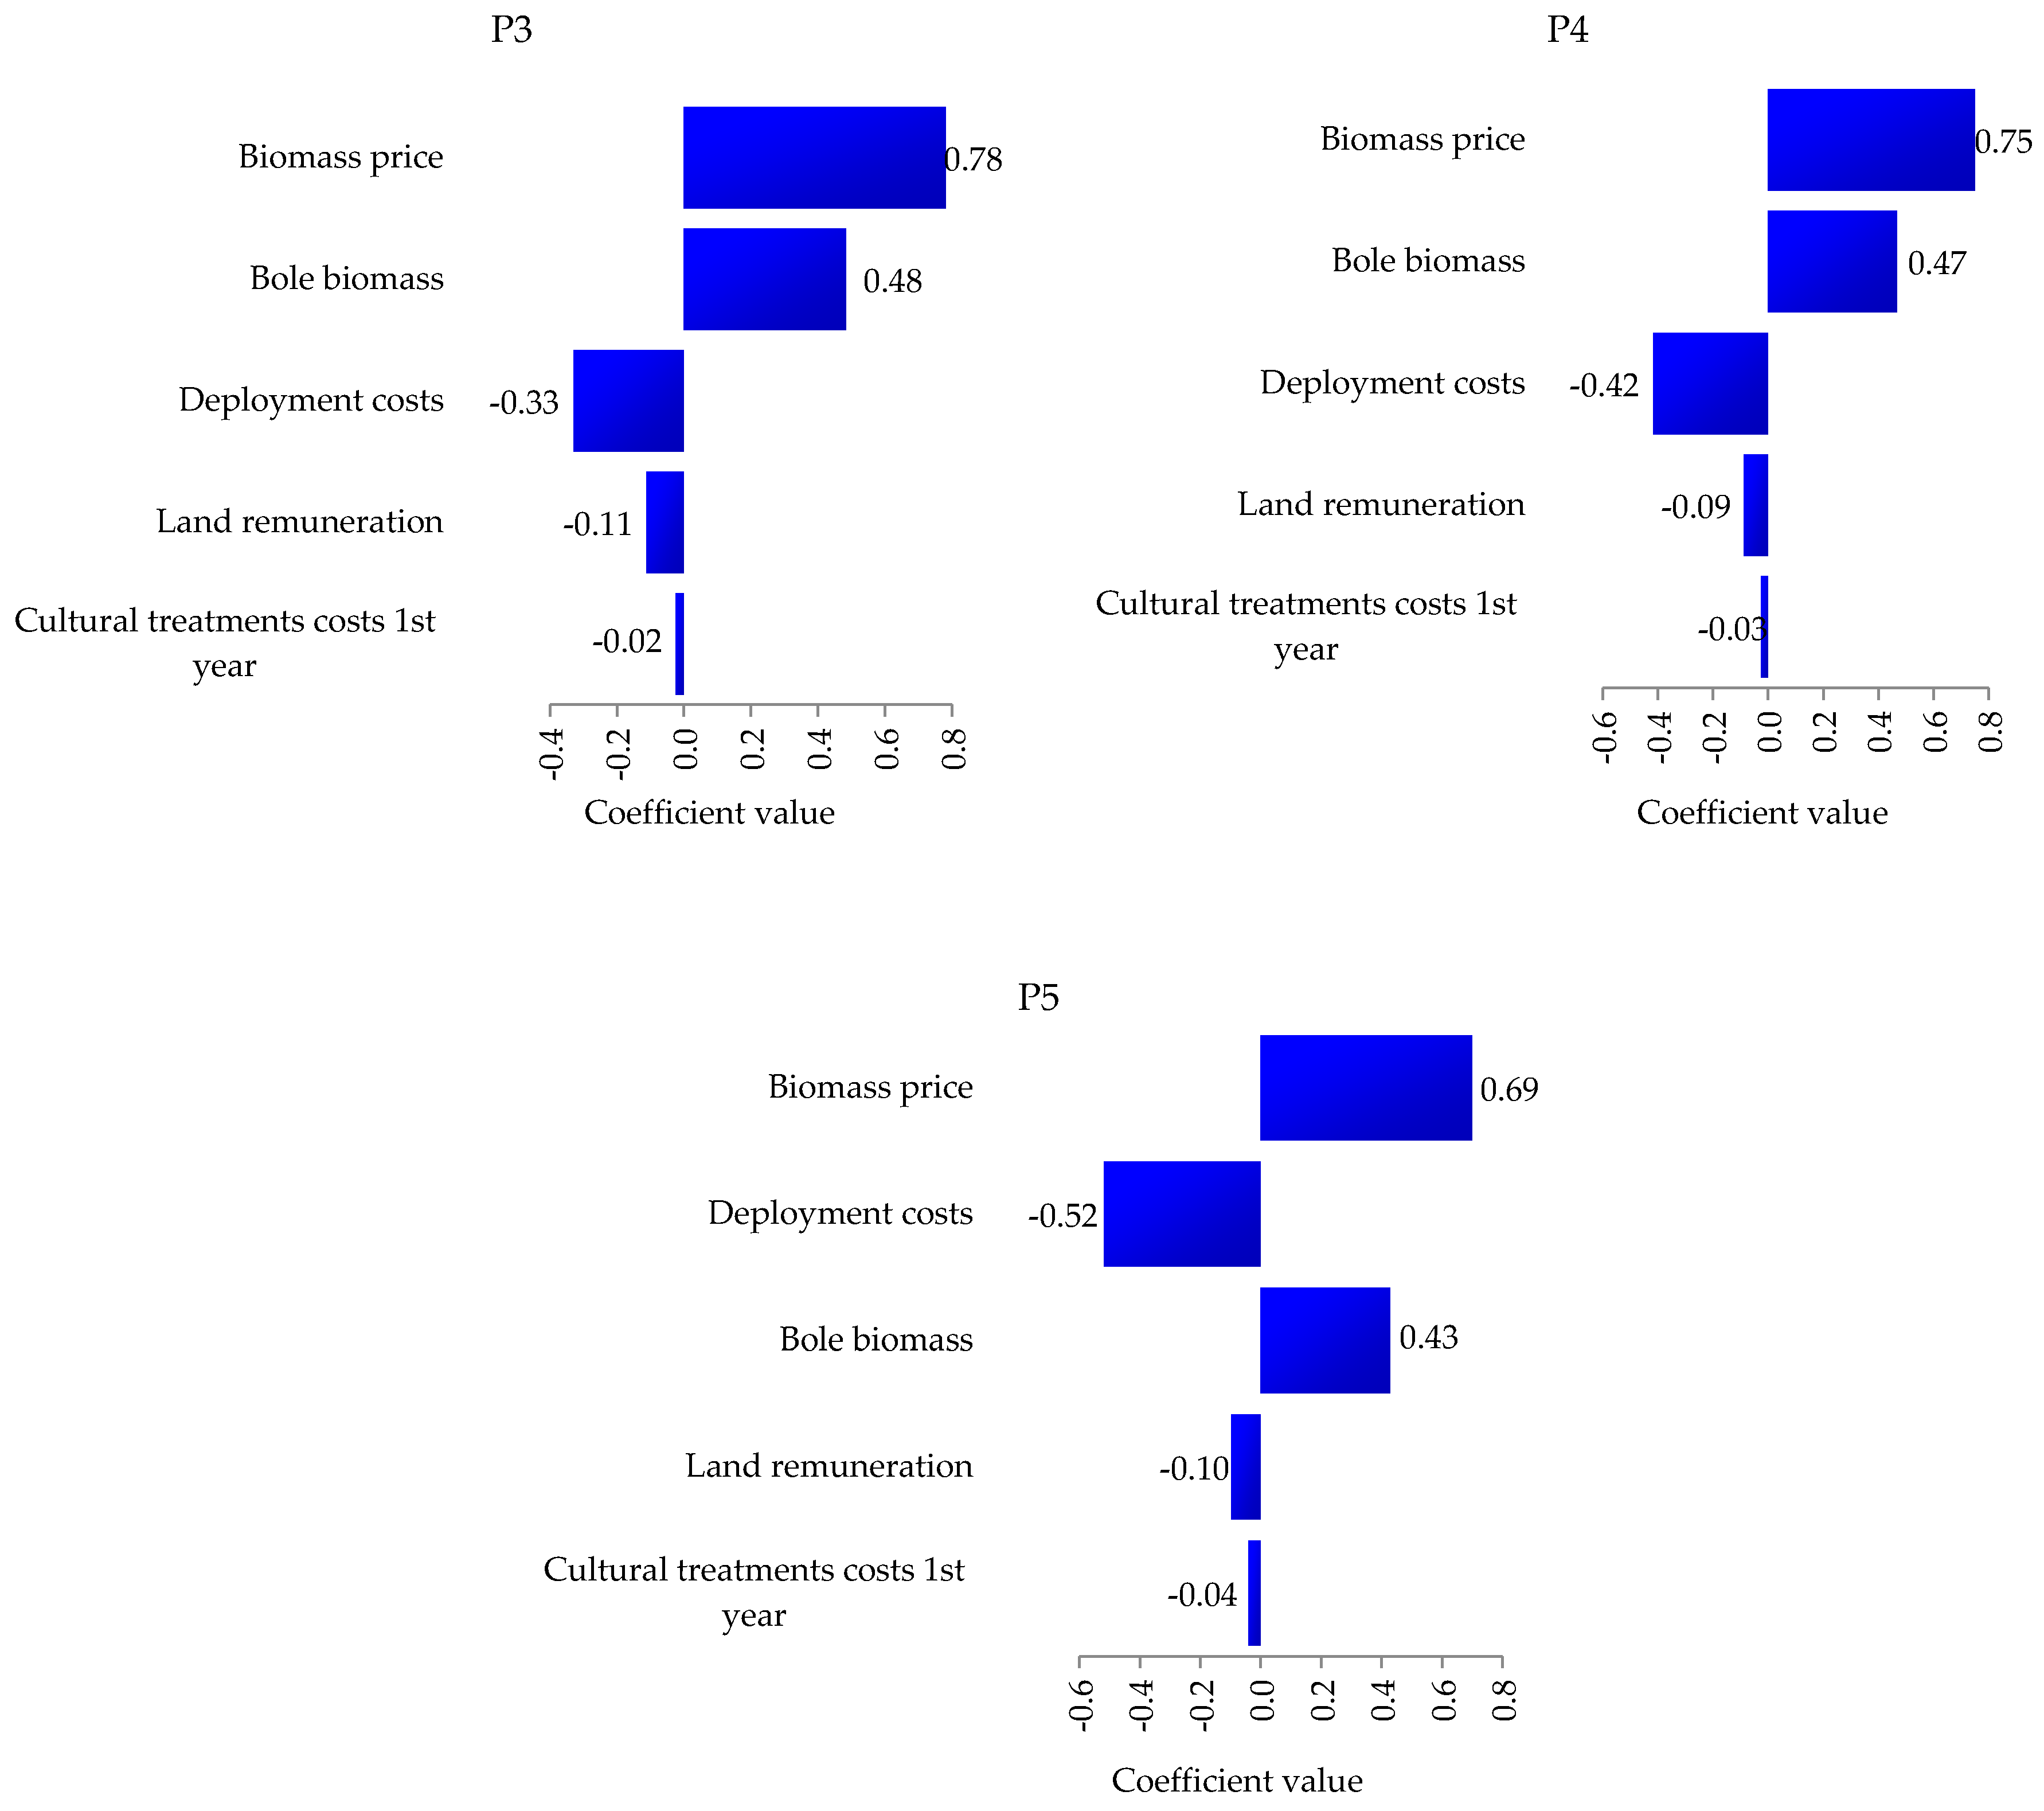
Figure 2.
Cumulative probability distributions for alternatives to investment projects in eucalypt forest stands for biomass production.
Figure 2.
Cumulative probability distributions for alternatives to investment projects in eucalypt forest stands for biomass production.


Table 1.
Descriptive measures of the values of eucalyptus bole (m³/ha) 36 months after the implementation of the financial investment projects.
Table 1.
Descriptive measures of the values of eucalyptus bole (m³/ha) 36 months after the implementation of the financial investment projects.
| Descriptive Measure | Bole Biomass (Dry ton/ha) | ||||
|---|---|---|---|---|---|
| P1 | P2 | P3 | P4 | P5 | |
| Minimum | 84.34 | 105.85 | 100.59 | 120.66 | 96.70 |
| Maximum | 113.95 | 142.99 | 135.96 | 163.09 | 130.71 |
| Mean | 99.10 | 124.41 | 118.29 | 141.87 | 113.75 |
| Mode | 98.57 | 124.49 | 118.92 | 141.56 | 113.66 |
| Standard Deviation | 6.06 | 7.63 | 7.24 | 8.71 | 6.95 |
Plot 1 (P1): 3 m × 2 m; P2: 3 m × 1 m; P3: 1.5 m × 2 m; P4: 3 m × 0.5 m; P5: 1.5 m × 1.0 m.
Table 2.
Modal values of the cost of cultivation (USD/ha) for the implementation of investment projects in forest stands for biomass production of the main bole of eucalyptus.
Table 2.
Modal values of the cost of cultivation (USD/ha) for the implementation of investment projects in forest stands for biomass production of the main bole of eucalyptus.
| Stochastic Variable (USD/ha) | Financial Investment Project | ||||
|---|---|---|---|---|---|
| P1 | P2 | P3 | P4 | P5 | |
| Deployment costs | 1095.50 | 1745.23 | 1909.90 | 3033.38 | 3206.21 |
| Cultural treatment costs 1st year | 209.87 | 210.82 | 210.24 | 210.34 | 209.61 |
| Cultural treatment costs 2nd year | 76.67 | 76.15 | 76.77 | 76.22 | 76.81 |
| Administration costs in years 1 to 3 | 50.20 | 50.03 | 49.97 | 50.04 | 50.19 |
| Land remuneration in years 1 to 3 | 251.87 | 251.14 | 250.91 | 251.67 | 250.35 |
Table 3.
Descriptive measures of the modified internal rate of return (MIRR) of the investment projects in forest stands used for the biomass production of the main bole of eucalyptus.
Table 3.
Descriptive measures of the modified internal rate of return (MIRR) of the investment projects in forest stands used for the biomass production of the main bole of eucalyptus.
| Descriptive Measure | Modified Internal Rate of Return (%) | ||||
|---|---|---|---|---|---|
| P1 | P2 | P3 | P4 | P5 | |
| Minimum | −9.7 | −12.5 | −14.2 | −17.2 | −27.2 |
| Maximum | 35.4 | 31.5 | 26.6 | 22.8 | 9.2 |
| Mean | 14.2 | 12.3 | 7.7 | 2.4 | −6.8 |
| Mode | 13.7 | 12.0 | 7.5 | 3.5 | −7.8 |
| Standard Deviation | 5.3 | 5.2 | 4.9 | 4.7 | 4.3 |
Table 4.
Descriptive measures of the profitability index (PI) of investment projects in forest stands used for the biomass production of the main bole of eucalyptus.
Table 4.
Descriptive measures of the profitability index (PI) of investment projects in forest stands used for the biomass production of the main bole of eucalyptus.
| Descriptive Measure | Profitability Index | ||||
|---|---|---|---|---|---|
| P1 | P2 | P3 | P4 | P5 | |
| Minimum | 0.25 | 0.33 | 0.31 | 0.31 | 0.12 |
| Maximum | 2.66 | 2.18 | 1.86 | 1.59 | 1.05 |
| Mean | 1.29 | 1.17 | 0.99 | 0.82 | 0.55 |
| Mode | 1.28 | 1.12 | 0.93 | 0.76 | 0.54 |
| Standard Deviation | 0.28 | 0.22 | 0.19 | 0.15 | 0.11 |
© 2018 by the authors. Licensee MDPI, Basel, Switzerland. This article is an open access article distributed under the terms and conditions of the Creative Commons Attribution (CC BY) license (http://creativecommons.org/licenses/by/4.0/).
Share and Cite
MDPI and ACS Style
Simões, D.; Dinardi, A.J.; Da Silva, M.R. Investment Uncertainty Analysis in Eucalyptus Bole Biomass Production in Brazil. Forests 2018, 9, 384. https://doi.org/10.3390/f9070384
AMA Style
Simões D, Dinardi AJ, Da Silva MR. Investment Uncertainty Analysis in Eucalyptus Bole Biomass Production in Brazil. Forests. 2018; 9(7):384. https://doi.org/10.3390/f9070384
Chicago/Turabian StyleSimões, Danilo, Ailton Jesus Dinardi, and Magali Ribeiro Da Silva. 2018. "Investment Uncertainty Analysis in Eucalyptus Bole Biomass Production in Brazil" Forests 9, no. 7: 384. https://doi.org/10.3390/f9070384
Note that from the first issue of 2016, this journal uses article numbers instead of page numbers. See further details here.