Article

Native Forests Have a Higher Diversity of Macrofungi Than Comparable Plantation Forests in the Greater Mekong Subregion

1
Key Laboratory of Economic Plants and Biotechnology, Kunming Institute of Botany, Chinese Academy of Sciences, 132 Lanhei Road, Kunming 650201, China
2
Center of Excellence in Fungal Research, Mae Fah Luang University, Chiang Rai 57100, Thailand
3
World Agroforestry Centre, East and Central Asia, 132 Lanhei Road, Kunming 650201, China
4
Mushroom Research Foundation, 128 M.3 Ban Pa Deng T. Pa Pae, A. Mae Taeng, Chiang Mai 50150, Thailand
*
Author to whom correspondence should be addressed.
Forests 2018, 9(7), 402; https://doi.org/10.3390/f9070402
Submission received: 5 June 2018 / Revised: 25 June 2018 / Accepted: 29 June 2018 / Published: 5 July 2018
(This article belongs to the Section Forest Ecology and Management)

Abstract

:
The Greater Mekong River Subregion (GMS) is a global biodiversity hotspot. Macrofungi play an essential role as decomposers, parasites, and symbionts, and are also an important source of medicine, food, and income for many communities in the GMS; however, the diversity and composition of macrofungi in this region remain poorly understood. In order to help address this knowledge gap, we established 20 permanent study plots in the GMS (native forests, tea plantation, pine plantations, mixed rubber and coffee plantation). Macrofungal diversity and community composition were evaluated across four study sites classified to two climate types and two management methods. Heat maps and nonmetric multidimensional scaling (NMDS) were used to show differences in macrofungal community composition, and linear relationships were illustrated in order to analyze how environmental factors influenced macrofungal diversity and community composition. In total, 7028 specimens were collected, belonging to 1360 species, 216 genera, and 79 families. Russula, Lactarius, Amanita, Mycena, Suillus, and Inocybe were found to be the dominant genera in the GMS. We found that ectomycorrhizal fungi were dominant in temperate forests and that saprobic fungi were dominant in tropical forests. We also found that macrofungal community composition in native forests differed from that of plantation forests, indicating that plantations can provide different and complementary habitats for macrofungal growth. Our analysis of environmental factors revealed that macrofungal diversity was weakly correlated with tree species richness, and strongly correlated with elevation and latitude.

1. Introduction

The Greater Mekong Subregion (GMS) is a global biodiversity hotspot containing high levels of biodiversity and a high proportion of endemic and endangered organisms [1,2]. The varied environmental conditions within the GMS support a diverse range of organisms [3,4]. These include fungi, which are important for nutrient cycles, as saprophytes, parasites, and symbionts in ecological systems [5]. For many years, the collection and commercialization of wild edible macrofungi has been an important income source for the human population of the GMS [6]. For example, since the 1980s, the prized mushroom, Tricholoma matsutake (S. Ito & S. Imai) Singer, from Yunnan Province, has been exported to Japan. The total value of the mushroom trade in Yunnan Province is approximately one billion dollars annually [7]. However, the continued harvesting and exploitation of wild edible mushrooms has resulted in habitat damage [8,9]. In order to address and mitigate damage to forest habitats caused by mushroom harvesting, it is imperative to develop feasible management plans, based on sound ecological understanding and knowledge of biodiversity within any given system [10,11,12]. Catovsky et al. [13] proposed that the study of biodiversity at the ecosystem level should be a priority for ecological research, especially applicable for the study of the diversity and distribution of macrofungi in sensitive areas.
Previous research has shown that factors relating to geography, climate, and vegetation affect macrofungal diversity and community composition [14,15,16,17]. For example, the diversity of ectomycorrhizal fungi declined when transitioning from temperate to tropical ecosystems [18,19]. Gabel and Gabel [20] reported a strong correlation between the number of epigeous macrofungal species and plant species diversity. Macrofungi species richness has a positive relationship with tree species richness [21,22,23]. Bahram et al. [24] compared the ectomycorrhizal fungal diversity and community structure at regional and local scale and found that elevation is the main driver shaping ectomycorrhizal fungi community composition at both scales. Luo et al. [25] also found elevation gradient had a significant impact on total macrofungal and ectomycorrhizal species richness and diversity. Therefore, understanding the drivers of species composition and richness in forest ecosystems is crucial for ecologists, biogeographers, conservationists, and forest managers. However, despite the high degree of diversity in macrofungi, and extent to which macrofungi are utilised, few studies have investigated the effect of environmental factors on macrofungal diversity and community composition in the GMS.
This study aims to tackle fundamental issues affecting macrofungal diversity and community composition in order to aid the conservation and sustainable use of macrofungi in the GMS. The following questions were addressed:
(1)
How does macrofungal diversity differ between native and plantation forests?
(2)
How does macrofungal community composition differ between forests in temperate and tropical climate zones?
(3)
How does macrofungal diversity and community composition change with environmental factors (elevation, latitude, tree species richness)?

2. Materials and Methods

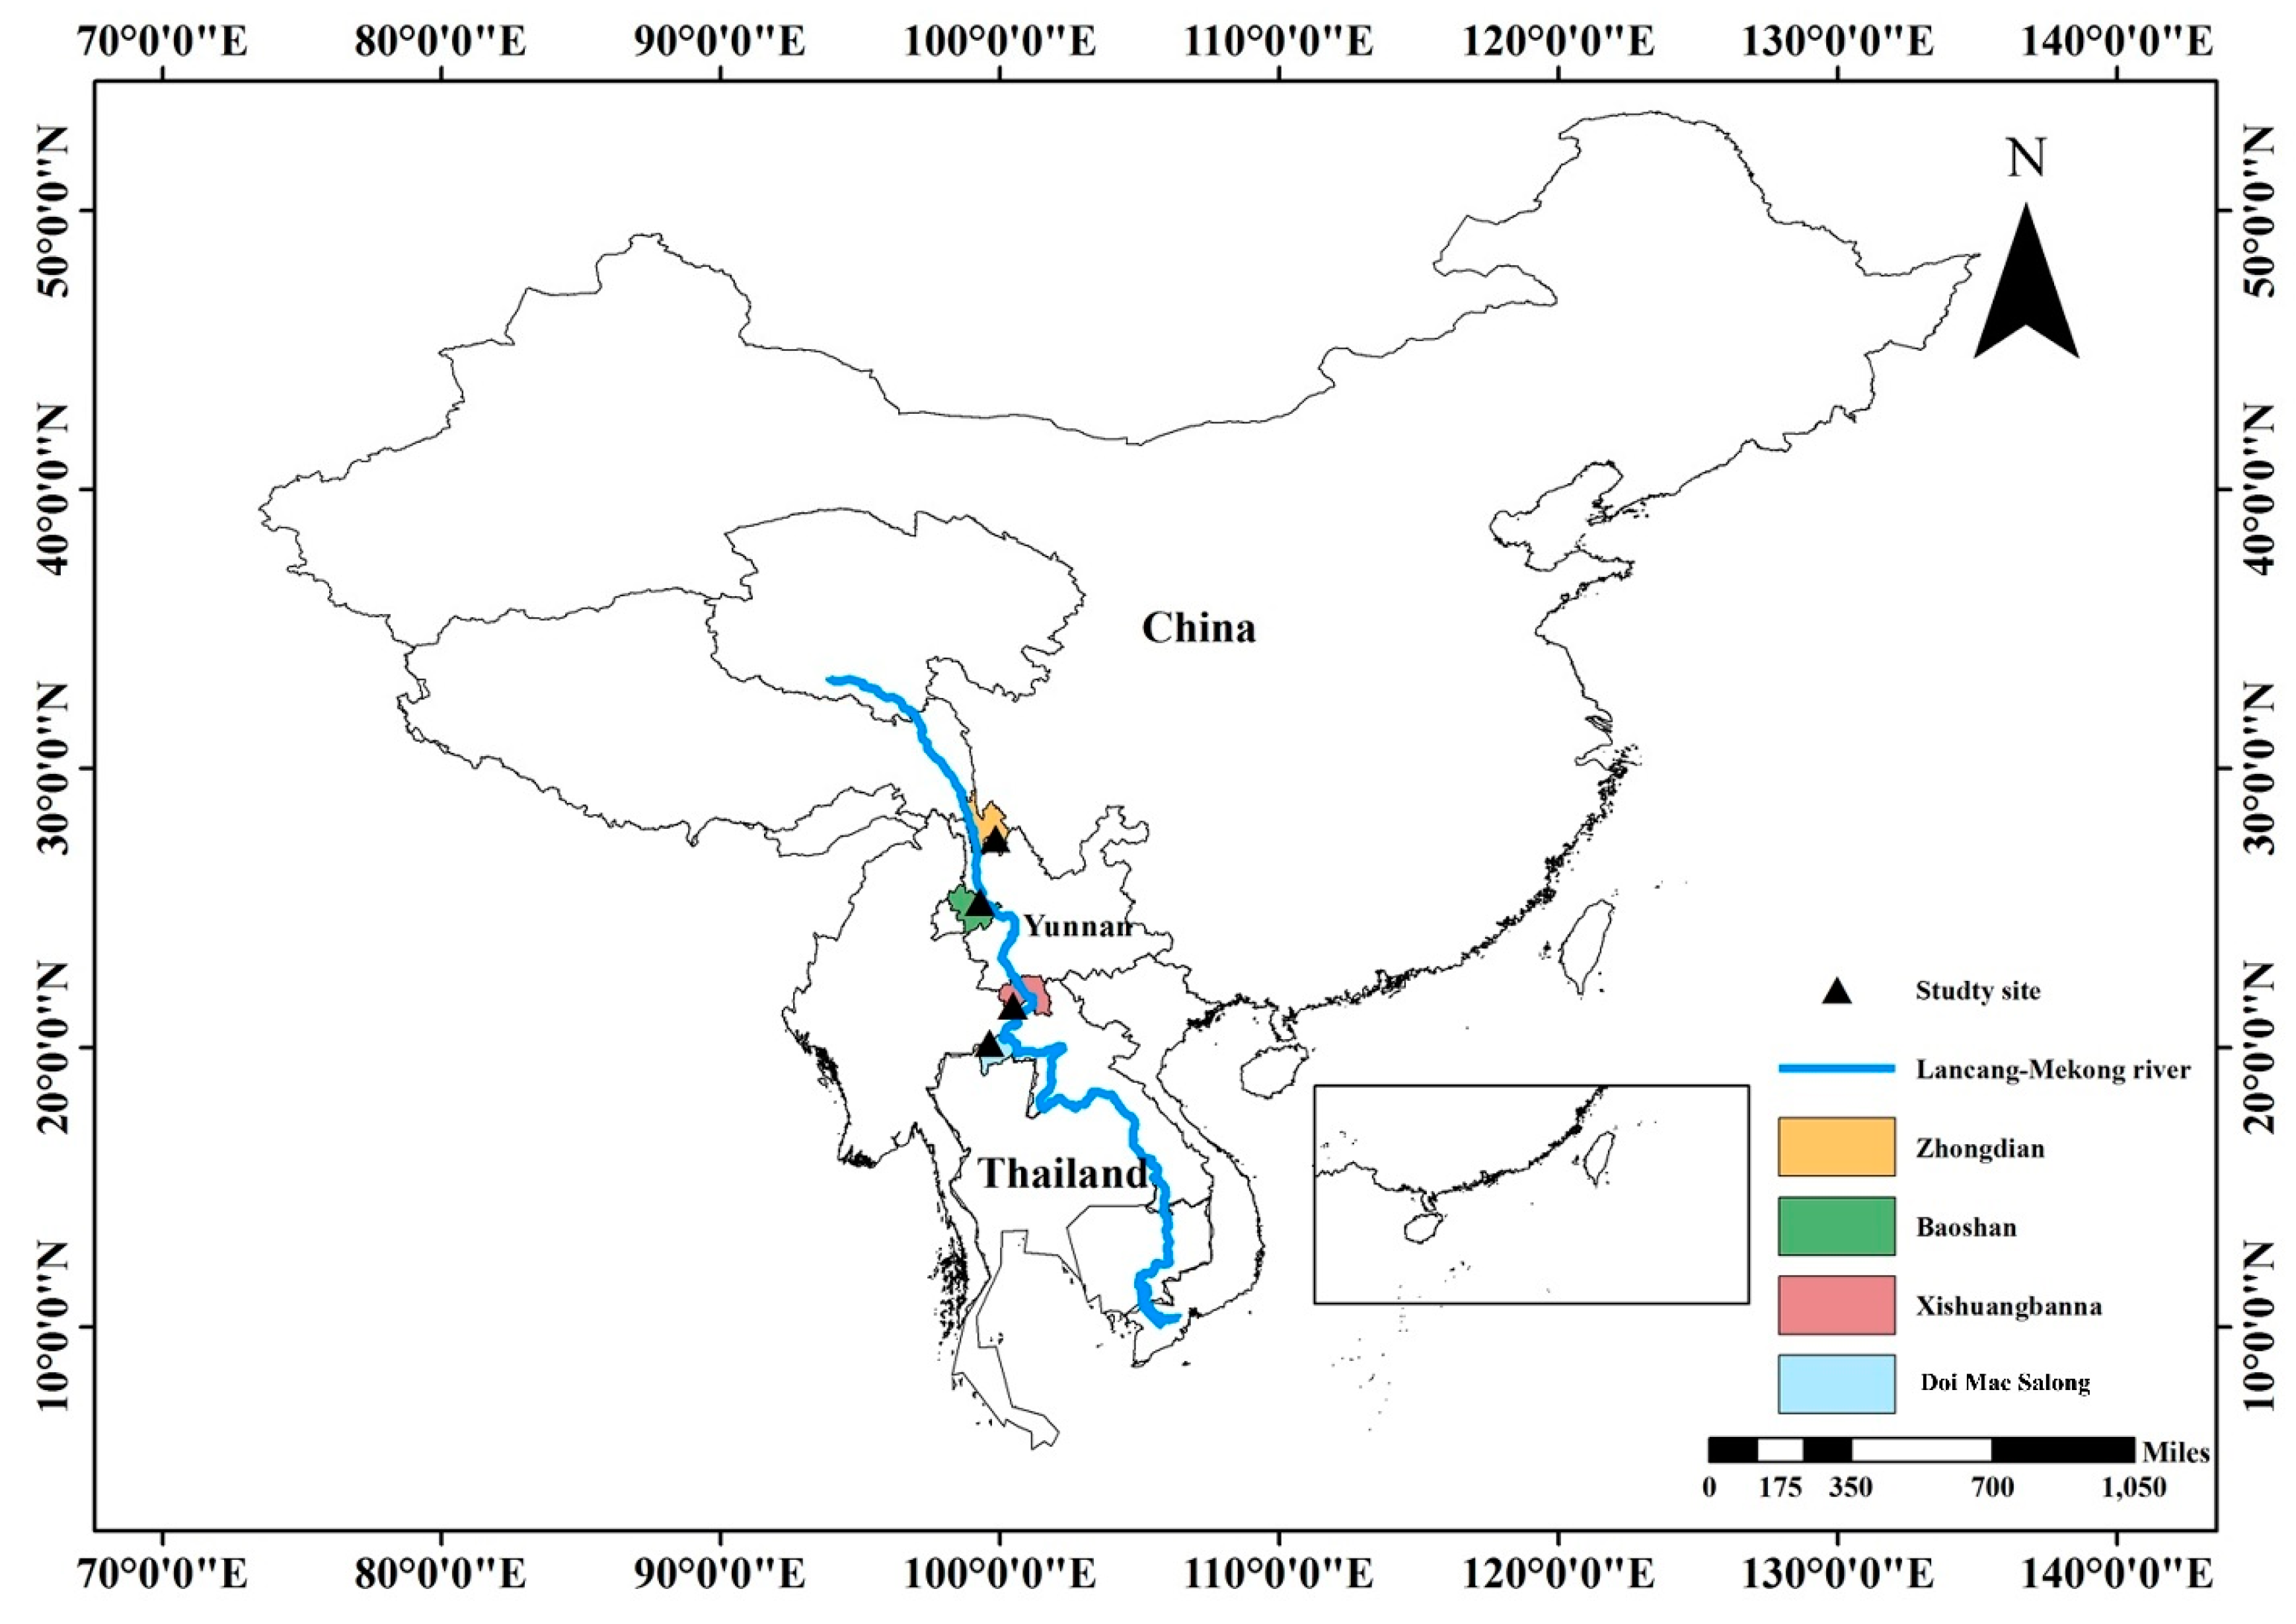
2.1. Study Area and Study Plots

Our study included four study sites, three of which were located in Yunnan Province, China and one in Chiang Rai Province, Thailand (Figure 1). Detailed site information regarding location, elevation, and climate are provided in Table 1, including the mean monthly temperature and precipitation during the rainy season (May to October) from 2012 to 2014. All forest types were categorized into two main groups (native forest and plantation forest) on the basis of the forest management methods employed. Native forests are defined as forests growing without human management, while plantation forests are defined as forests that have been artificially established and receive ongoing management; these forests include pine plantations, tea plantation, and mixed rubber and coffee plantations in this study.
The four study sites included two temperate and two tropical sites: Zhongdian and Baoshan both have temperate climates and are located in Northern and Western Yunnan Province, respectively. Xishuangbanna and Doi Mae Salong both have tropical climates and are found in Southern Yunnan Province and Chiang Rai Province, respectively. For this study, a total of 20 plots were selected; ten within temperate climate zones and ten in tropical climate zones. Within the temperate areas, five 100 m × 100 m plots (five native forests) were established in Zhongdian, and five 100 m × 100 m plots (two native forests and three pine plantations) in Baoshan. Within the tropical areas, four 100 m × 100 m plots (three native forests and one tea plantation) were established in Xishuangbanna and six 100 m × 100 m plots (four native forests, one mixed rubber and coffee plantation, and one pine plantation) in Doi Mae Salong. Meteorological data (precipitation and temperature) were obtained from two sources: the China Meteorological Data Service Center (http://cdc.nmic.cn/home.do), and the Upper Northern Region Irrigation Hydrology Center (http://hydro-1.net/home.php) for Thailand (Figure S1).

2.2. Fungal Sampling and Identification

Macrofungal sampling in Zhongdian and Baoshan was carried out once a week during the rainy season (rich in macrofungi) from July to September in 2013 and 2014. Sampling in Xishuangbanna and Doi Mae Salong was carried out during the rainy season (rich in macrofungi) from May to September in 2013 and 2014. All above-ground macrofungal basidiocarps (≥2 cm high) were sampled and details were recorded following Bonet, Fischer, and Colinas [17]. Solitary, scattered, or grouped basidiocarps were all recorded as single observations without counting the number of basidiocarps [26]. Fresh specimens were photographed in the field, including the substrate on which they were found, and brought to the laboratory for macro-morphological study. Collections were dried using an electric fruit dryer at 40 °C for 15–20 h and stored in sealed plastic bags with dehydrated silica gel at room temperature. The samples were deposited in the Herbarium of the Kunming Institute of Botany (HKAS), Chinese Academy of Sciences, China. Macrofungi were identified as morphospecies on the basis of macro- and micro-morphological characteristics, using guide books and monographs [27,28,29,30,31,32]. Macrofungi nomenclature followed Index Fungorum [33]. Seventy-five percent of macrofungi were identified to species level with the remainder identified to genus level.

2.3. Data Analysis

Ecological diversity under different forest management methods (native forest and plantation forest) and climate types (temperate and tropical) was evaluated using the Shannon–Wiener index (Equation (1)):
H = i S P i l n P i
where S: number of taxa; Pi: ratio of the individuals of i-species account for total individuals.
Relative abundance of macrofungi was calculated using the formula (Equation (2)):
Relative   abundance = Number of individuals of macrofungi in all plots from same land use type in same site Number of individuals of macrofungi in all plots from all land use types in different sites
Shapiro normality test in the Stats package showed that the data were not normally distributed [34]. Therefore, nonparametric tests were used to compare the macrofungi from four forest type from native forests, two climate types, and two management methods. The Mann–Whitney U test was used to assess the difference in diversity and species richness of the same macrofungal group between the two managements methods and two climate types. The Kruskal–Wallis rank sum test was used to evaluate the differences in species richness of the same macrofungal group or three macrofungal groups among four forest types from native forests. The Kruskal–Wallis rank sum test also was used to assess the differences of three fungal groups between the two management methods. Heat maps with hierarchical cluster diagrams were plotted to visualize the distribution of macrofungi composition across climate types and forest management methods, based on the genera dataset of macrofungal relative abundance. All genera relative abundance values exceeding 0.01 were plotted. The Jaccard index was used to calculate the dissimilarity index in different study sites. The relationship between macrofungal community composition and environmental factors was first analyzed using the Spearman correlation test to calculate the correlation value, then the linear relationship between environmental factors and macrofungal diversity was plotted. Nonmetric multidimensional scaling (NMDS) ordination was used to visually evaluate the relationship between macrofungi and environmental factors. The NMDS ordination of macrofungi by environmental factors, using the Bray–Curtis dissimilarity index, had a final stress of 9.9% with two dimensions. Stress is a measure of the goodness-of-fit and reflects the adjustment of points required to constrain them to the specified number of axes. A stress value from 5% to 10% is usually considered satisfactory [35]. All statistical analyses were conducted in RStudio-0.99.902 (https://www.rstudio.com/).

3. Results

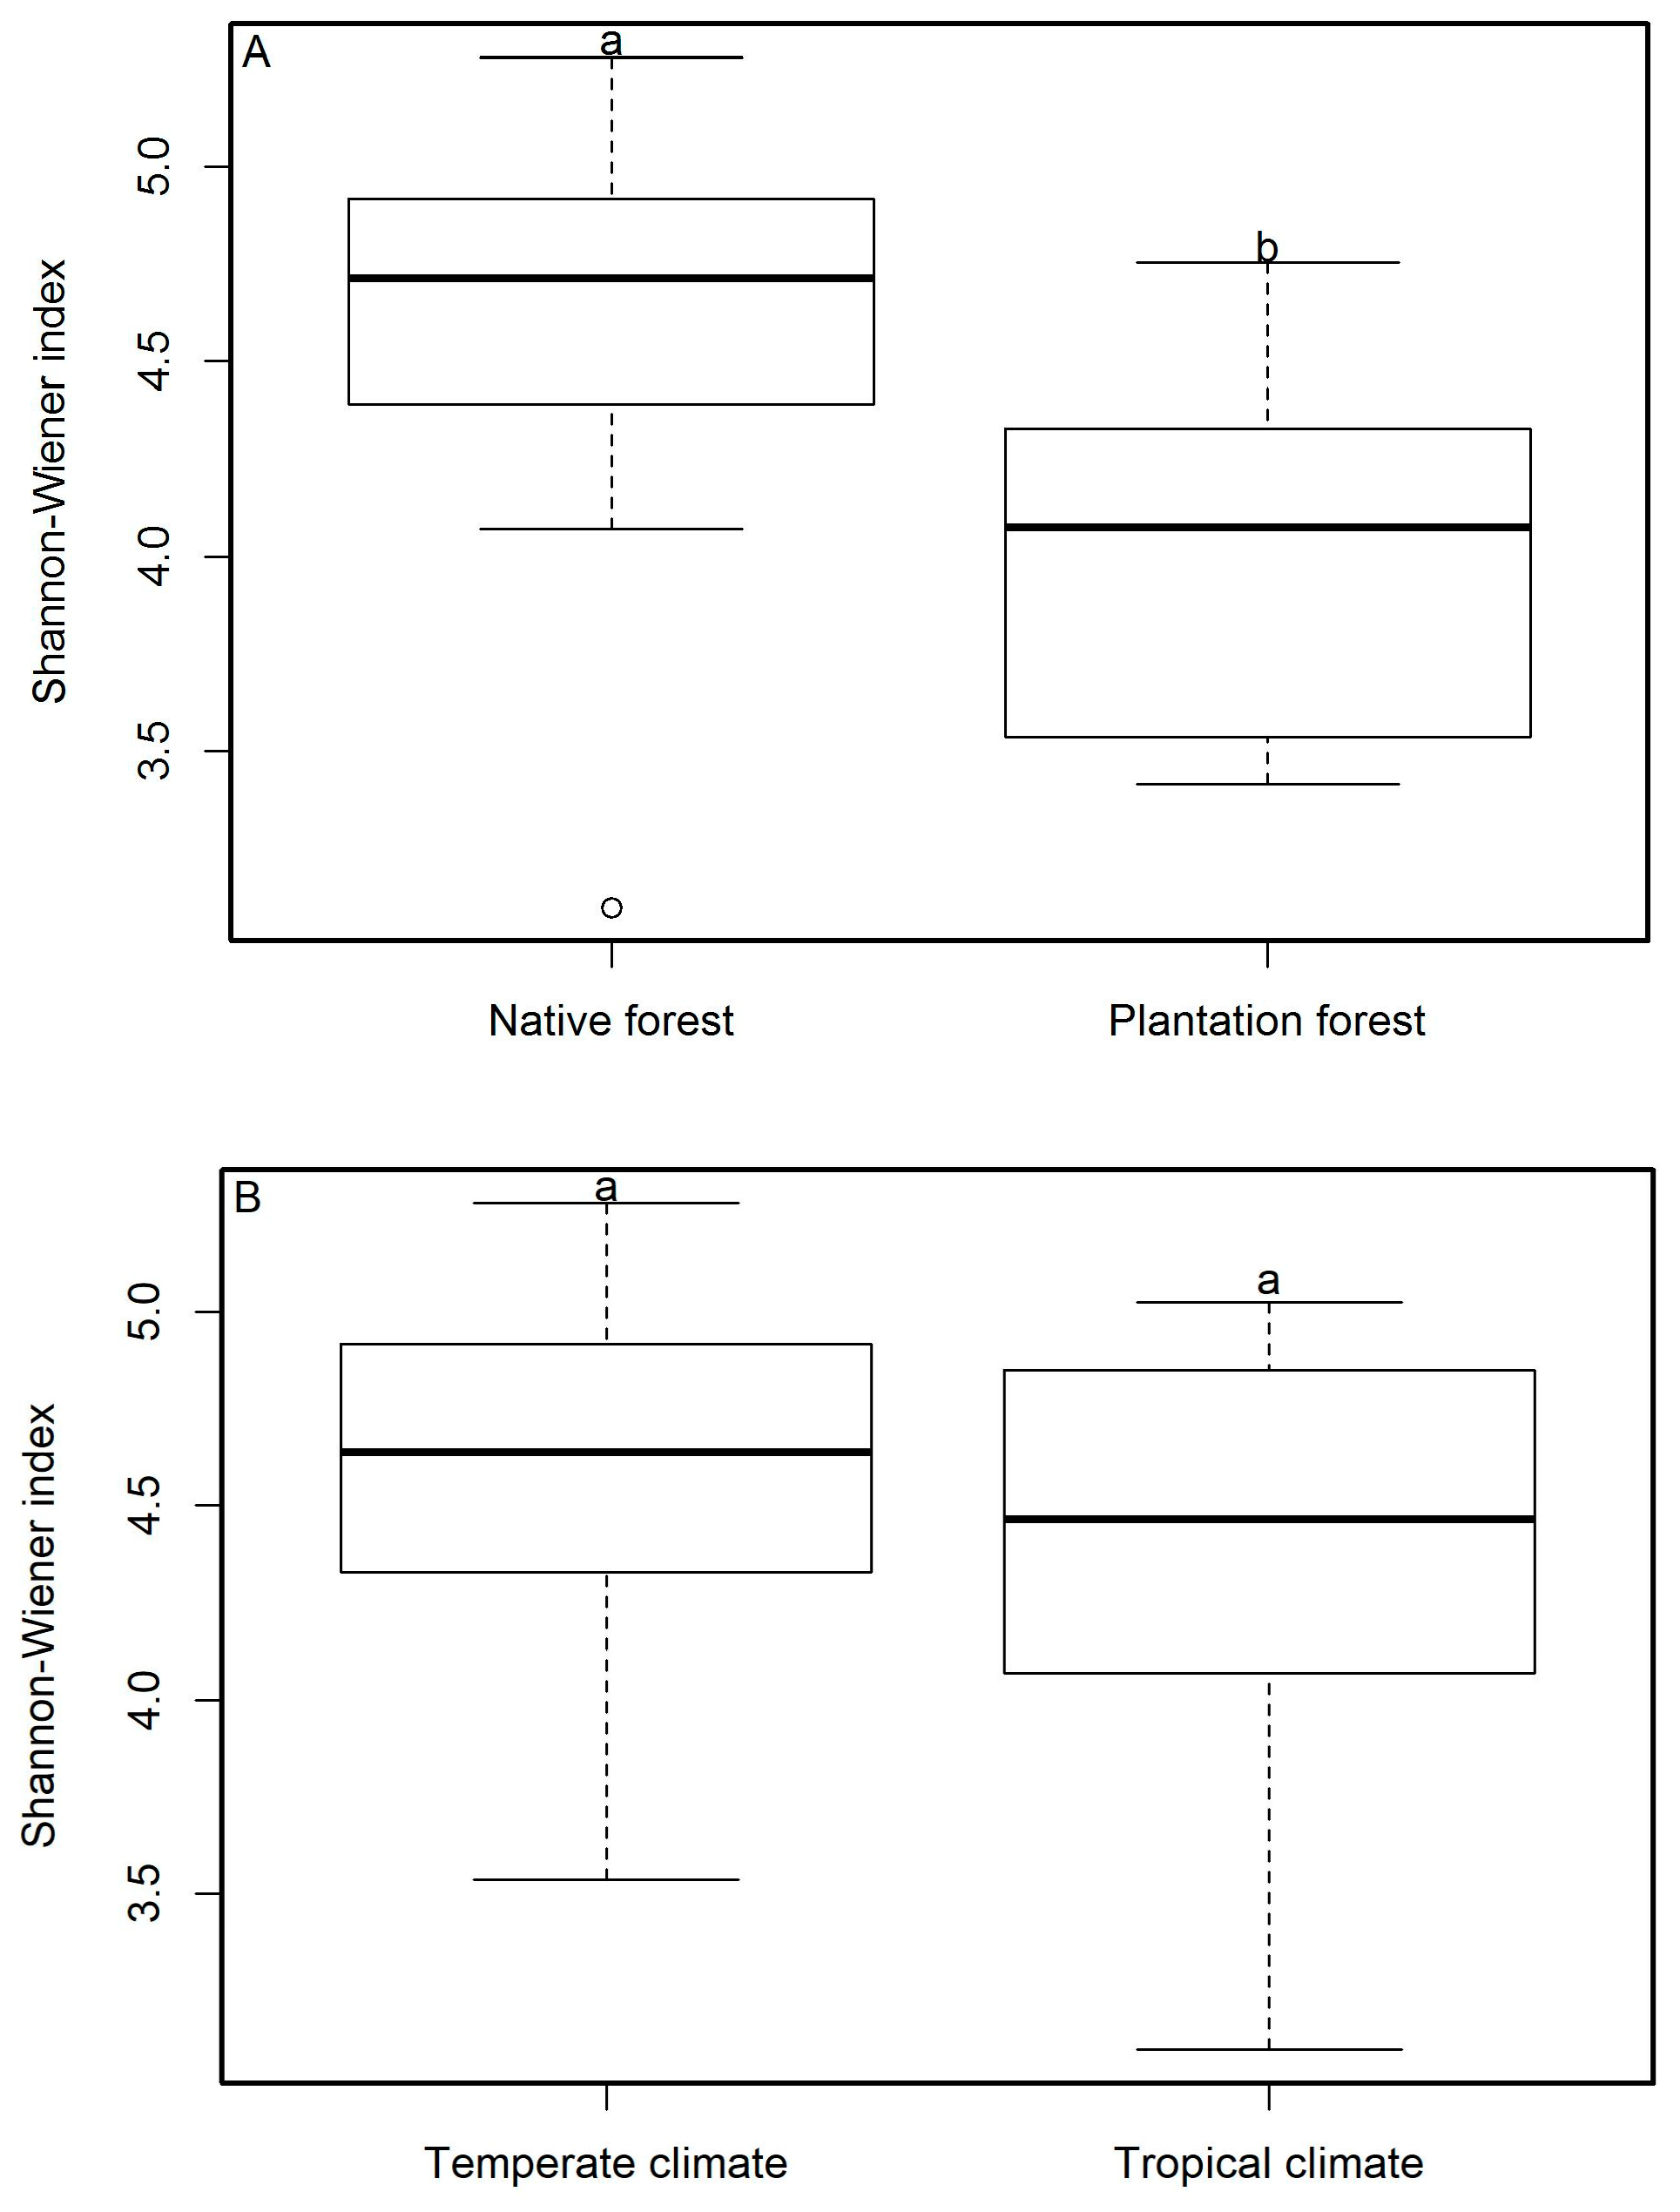
3.1. Macrofungal Diversity

We identified 7028 specimens of macrofungi belonging to 1360 species, 216 genera, and 79 families. Each of the four study sites were grouped by climate type and forest management methods. There was no significant difference (p > 0.05) in total fungal diversity index (Figure 2B) and total fungal species richness (Table 2) between the temperate and tropical forests. However, the species richness of ectomycorrhizal fungi in temperate areas was significantly higher than that in tropical areas (p ≤ 0.05) (Table 2). Across both the temperate and tropical areas, macrofungal diversity was significantly higher in native forests than in plantation forests (p ≤ 0.05, Figure 2A). In temperate areas, the species richness of ectomycorrhizal fungi was significantly higher than that of non-ectomycorrhizal fungi (p ≤ 0.05, Table 2), and it did not differ significantly from total macrofungal species richness (ectomycorrhizal fungi and non-ectomycorrhizal fungi) (p > 0.05, Table 2). The species richness of ectomycorrhizal fungi in temperate areas was significantly higher than in tropical areas (p ≤ 0.05, Table 2). When species richness was contrasted between forest types, the cold temperate coniferous forests (CTCF) of Zhongdian had a significantly higher species richness than that found in the montane evergreen broad-leaved forests (TEBF) of Doi Mae Salong. The ectomycorrhizal species richness of the CTCF, in Zhongdian, was significantly higher than within the other forest types assessed in our study. The species richness of non-ectomycorrhizal fungi from monsoon evergreen broad-leaved forest (MEBF) in Xishuangbanna was significantly higher than that in other forest types (Table 2).

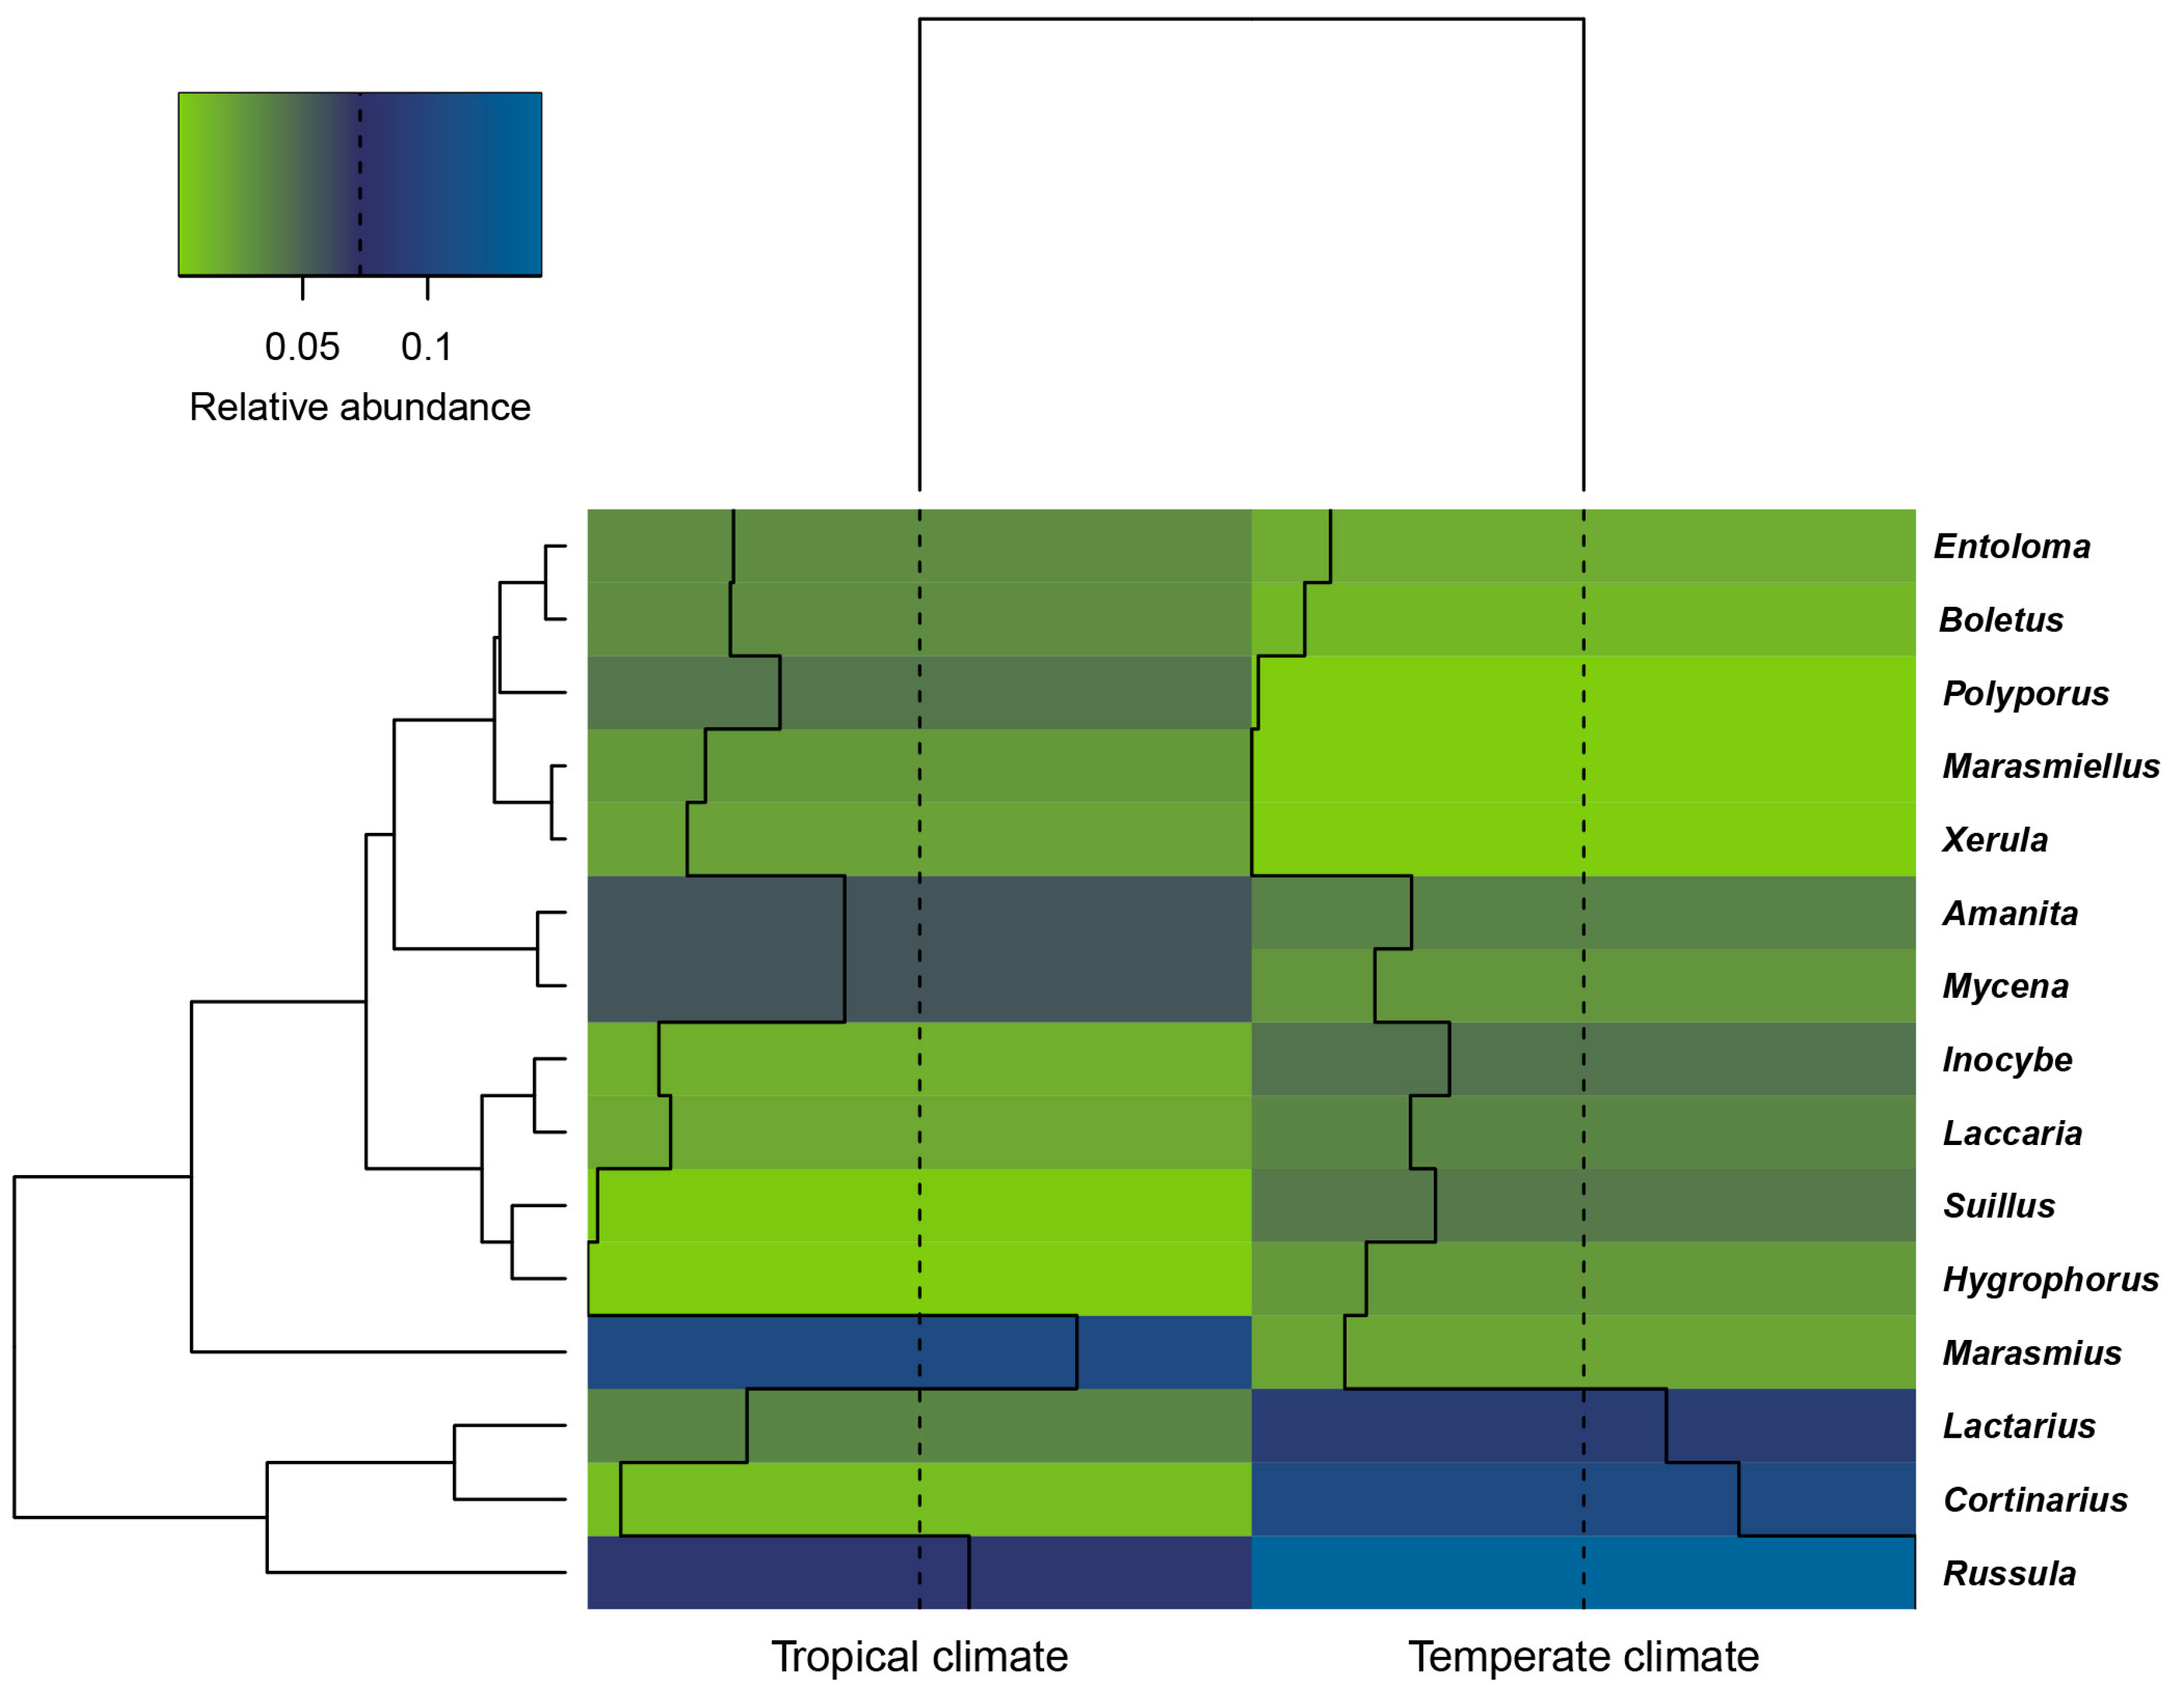
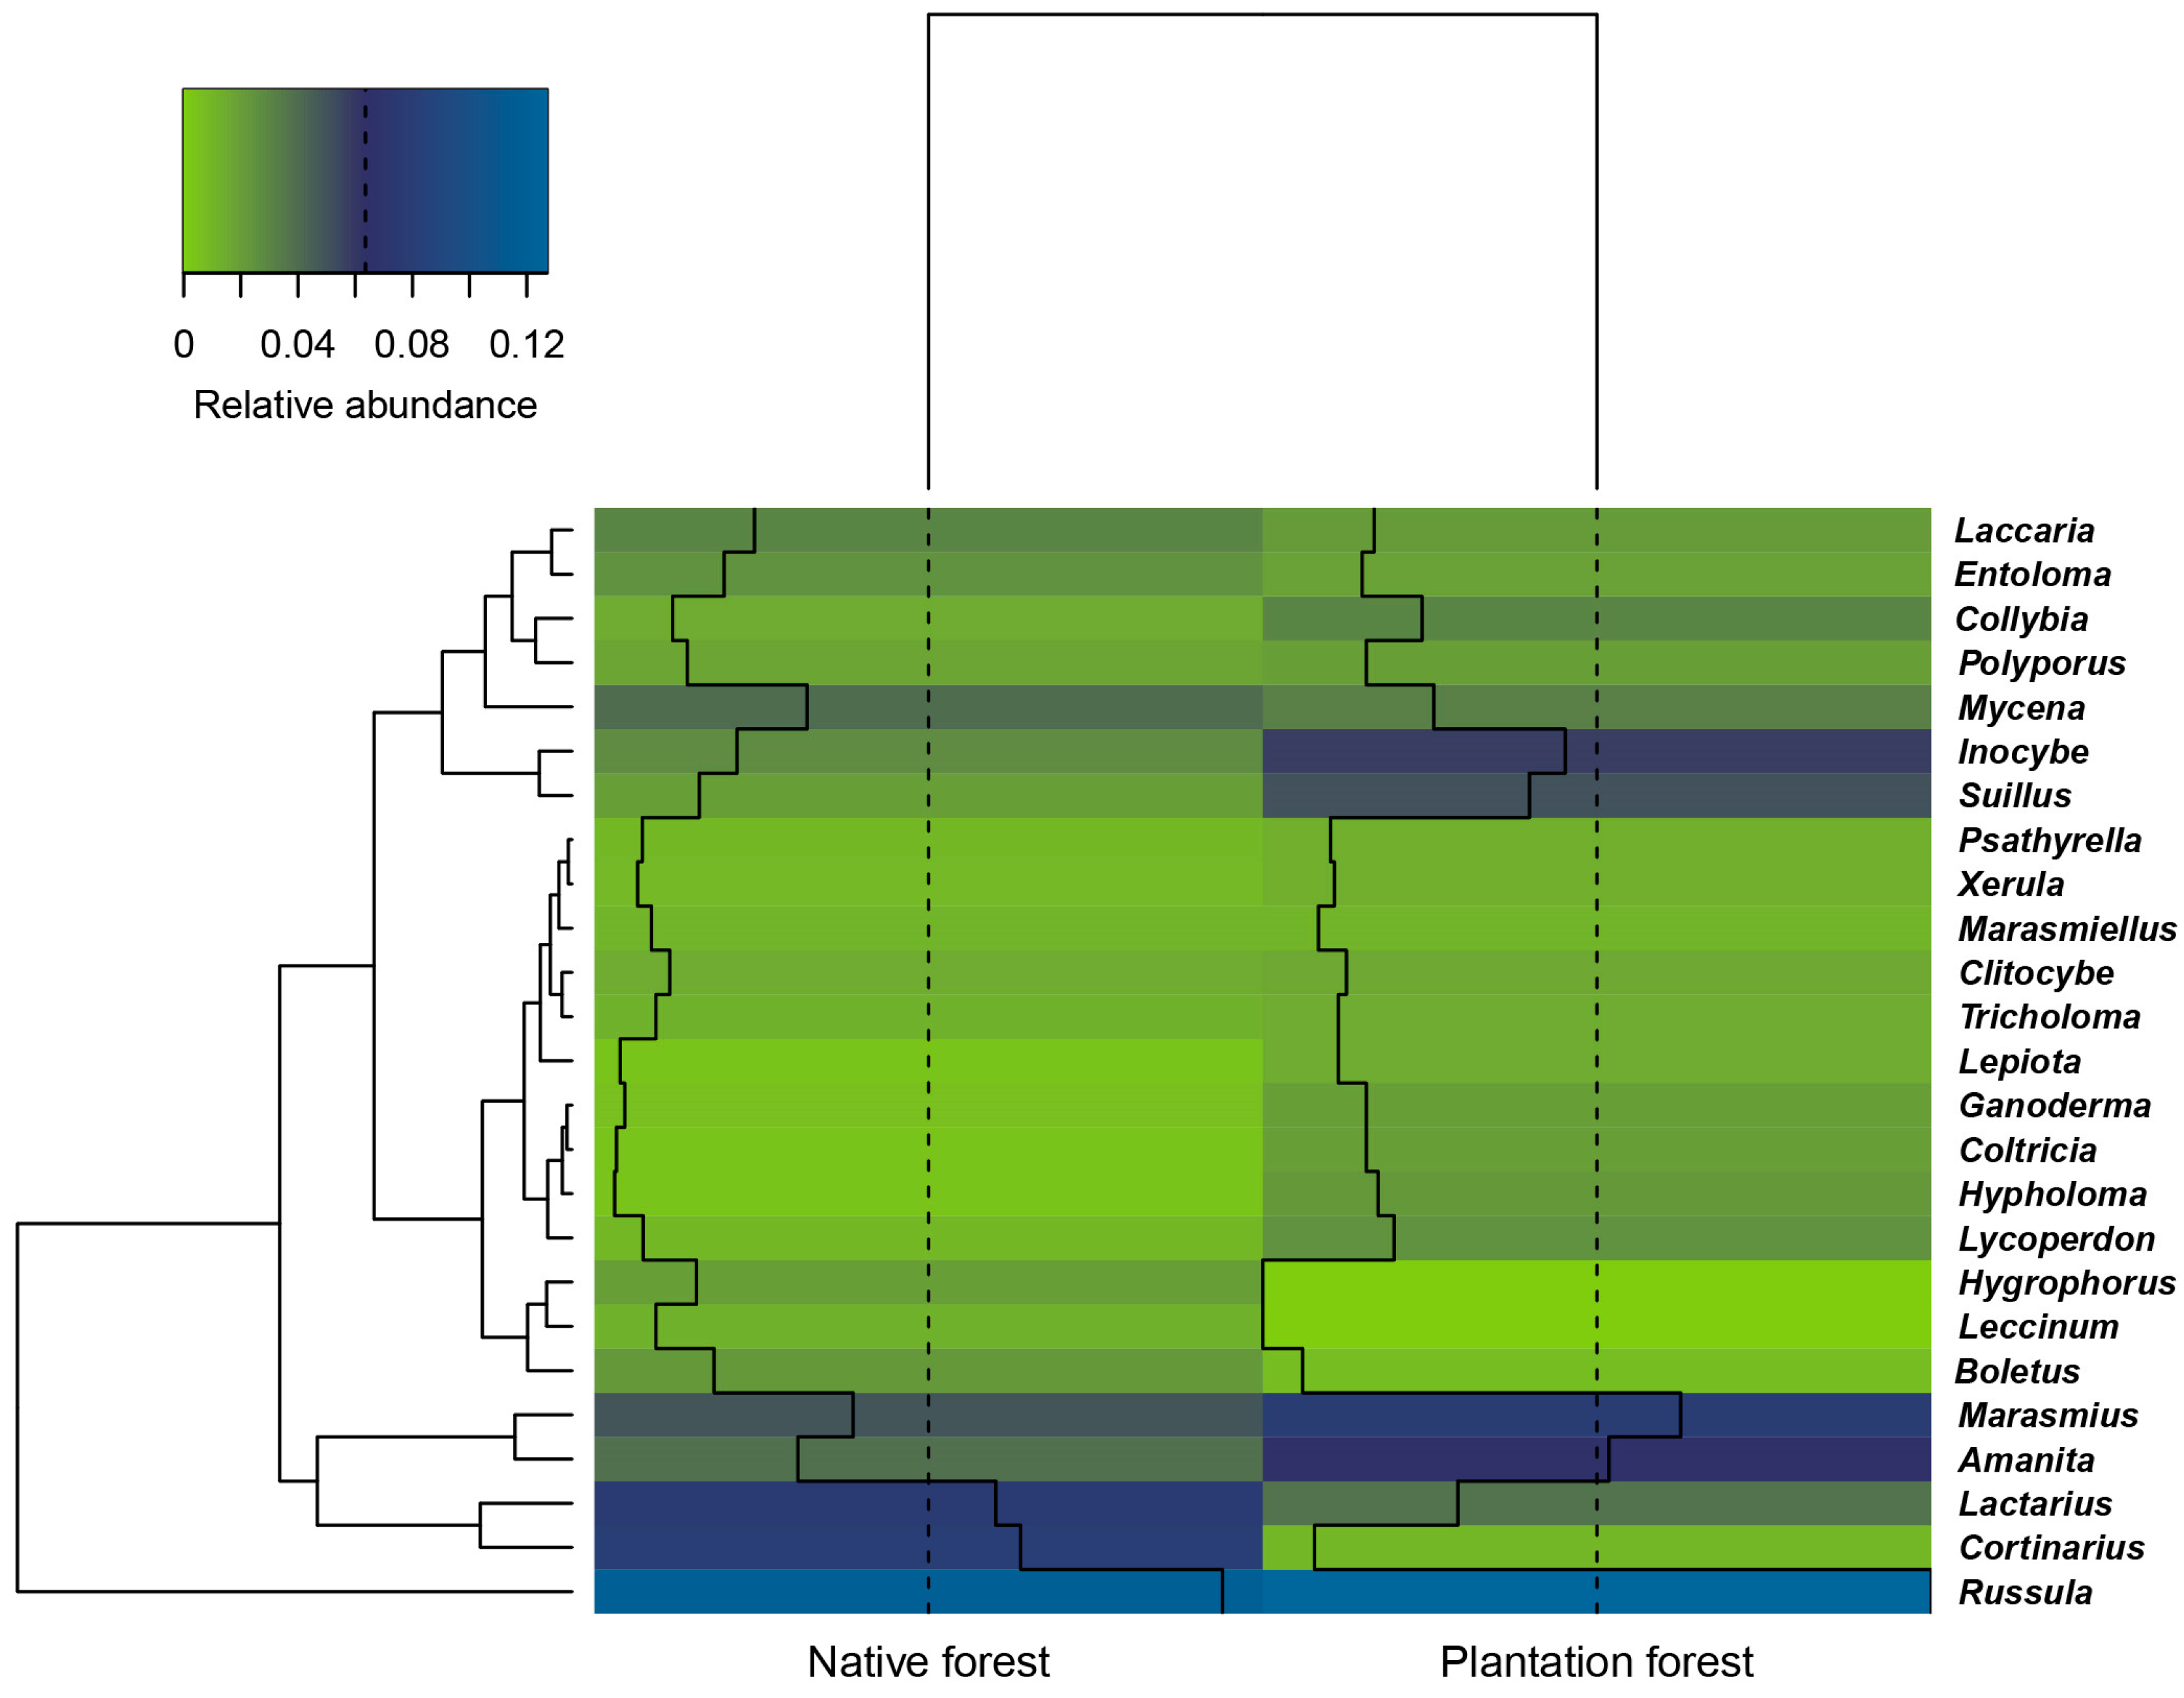
3.2. Macrofungal Composition

The distribution of the dominant genera of macrofungi across the temperate and tropical climate zones is shown in Figure 3. Russula was found to be the most abundant genus across the two climate types. Russula, Cortinarius, and Lactarius were the dominant genera in temperate areas, whereas Marasmius, Russula, Amanita, and Mycena were the dominant genera in tropical areas. Russula, Cortinarius, Lactarius, and Marasmius were the dominant genera in native forests, while Russula, Marasmius, Amanita, Inocybe, and Suillus were the dominant genera in plantation forests (Figure 4).
Jaccard dissimilarity index results showed that the macrofungal community composition was different across the four study sites. Of these, the fungal community composition in Baoshan and Zhongdian were the most similar, while that in Zhongdian and Doi Mae Salong were the least similar (Table 3).

3.3. Correlation between Ecological Diversity and Environmental Factors

The relationships between macrofungal diversity and environmental factors are presented in Figure 5A–C. Tree species richness was not significantly correlated with macrofungal diversity (ρ = 0.43, p = 0.06), whereas elevation (ρ = 0.49, p < 0.05) and latitude (ρ = 0.66, p < 0.05) were both significantly correlated with macrofungal diversity. Linear correlation showed that macrofungal diversity increased with elevation and latitude. Of these three variables, latitude had the strongest influence on macrofungal species diversity (ρ = 0.66). The fitted contour lines (standardized factors) indicate which environmental factors had strong effects on the macrofungal community at each site (Figure 5a–c).

4. Discussion

Our results showed that native forests contained a higher diversity of macrofungi compared with plantation forests. However, they also indicated that these two management systems supported distinct groups of macrofungi. This suggests that these two management methods could jointly provide a complementary range of macrofungal habitats. O’Hanlon et al. [36] noted that Sitka spruce plantations in Ireland and Britain could provide a complementary ecosystem for native macrofungi, acting as a suitable forest type for many macrofungi if native forests were absent. Brockerhoff et al. [37] also showed evidence that although native forests usually provide more suitable habitats than plantation forests, plantation forests can still provide valuable habitats for some threatened and endangered species of macrofungi. Humphrey et al. [38] found rare and endangered species of macrofungi within plantation forests in North Britain (including Cortinarius violaceus (L.) Gray, Hydnellum peckii Peck, and Lactarius musteus Fr.), indicating that such plantations could contribute towards biodiversity conservation. Although we did not record any red listed species in our study, our results clearly indicated that specific genera of macrofungi were associated with specific forest types, for example, except for the common genus Russula, the relative abundance of Amanita, Marasmius, Suillus, and Inocybe in plantation forests was higher than that in native forests; providing further evidence that plantation forests help conserve fungal biodiversity.
We found that ectomycorrhizal fungi were more diverse in our temperate than our tropical study sites. Shi et al. [39] reported that temperate forests in Western China were dominated by ectomycorrhizal fungi and supported the highest fungal diversity. They proposed that this biodiversity was linked to the vegetation type in these forests. Numerous studies have also suggested that low tree diversity could drive an increase in fungal speciation, and thus diversity [22,40,41]. Gilbert [42,43] considered that a high density of host tree species, in a low-diversity forest, could increase the likelihood of host-specialized fungi. In contrast, a low density of host tree species, in high diversity forests, may create an environment favorable to non-specialized fungi. In our study, the temperate forests did have lower tree diversity and higher tree density than the tropical forests (Table 1). In further confirmation of the results reported in previous studies [39,44,45], we found that saprobic fungi were the dominant fungal group in tropical forests. In a study on litter-decomposing macrofungi in subtropical, temperate, and subalpine forests, Osono [44] found that litter-decomposing macrofungi were more diverse in warmer climates than in cool climates. Differences in the distribution of functional groups of macrofungi across different climatic areas and forest types appear to be tightly linked to the tree species found within a given forest type and geographic location.
Although tree species richness was only weakly associated with macrofungal diversity, it affected macrofungal community composition (Figure 5). We found that Russula, Lactarius, Amanita, Mycena, Suillus, and Inocybe were the dominant genera in the GMS, which is consistent with the results of Tang and Yang [4], who reported that Agaricales, Russulales, and Boletales were the three dominant groups in the GMS. However, with the exception of Russula, the dominant genera across two climate types and two management methods differed, indicating that climate type and forest management methods affected the macrofungal community composition. The differences observed between the plantation forests and native forests is likely due to the differences in tree community composition between these management methods; plantation forests generally consisted of monoculture planting, whereas native forests were a mixture of tree species (Table 1).
In addition to the impact of management and climate, our results indicated that elevation and latitude had strong effects on macrofungal diversity and community composition (Figure 5). We found that the macrofungal communities in Baoshan and Zhongdian were most similar and the macrofungal community composition between Zhongdian and Doi Mae Salong least similar (Table 3). This indicates that macrofungal community composition is related to geographical distance; communities near to each other being more closely associated to each other than to communities further apart. However, in the GMS, it is difficult to disentangle the effects of latitude and elevation, because as you move along a south to north latitudinal gradient, you also go up in elevation. Previous studies have reported effects of both elevation and latitude on fungal diversity and community composition. Shi et al. (2013) found that latitude was strongly correlated with fungal diversity, and Geml et al. [46] confirmed this, showing a link between fungal community composition and elevation.

5. Conclusions

There were two main findings of our study; firstly, within a given climatic zone, plantations and native forests supported different groups of macrofungi, and thus each forest type provided unique habitats for a range of fungal species. Secondly, tree species richness strongly affected macrofungal community composition, highlighting the important effect of forest management on macrofungal conservation. Clear patterns of fungal species distribution were noted in our study, and we had some confidence in attributing a range of environmental factors as responsible for these patterns. However, we were unable to state clearly which factors were most influential. In the future, we aim to pursue more detailed studies examining the role of specific environmental factors on fungal species distribution patterns.

Supplementary Materials

The following are available online at https://www.mdpi.com/1999-4907/9/7/402/s1, Figure S1. Temperature and precipitation patterns based on meteorological data from 2012 to 2014. Solid lines represent the mean monthly precipitation from January to December at each study site, and broken lines represent in the mean monthly temperature from January to December at each study site. DMS: Doi Mae Salong, BN: Xishuangbanna, BS: Baoshan, ZD: Zhongdian.

Author Contributions

Data curation, H.L.; Formal analysis, H.L.; Funding acquisition, J.X., K.D.H. and P.E.M.; Investigation, H.L., J.G., S.C.K. and L.Y.; Methodology, H.L., J.G. and P.E.M.; Project administration, J.X., K.D.H. and P.E.M.; Supervision, J.X., K.D.H. and P.E.M.; Writing—original draft, H.L.; Writing—review & editing, J.X., K.D.H. and P.E.M.

Funding

This research was funded by National Science Foundation of China (NSFC) under the grant number 41761144055 and 41771063 and CGIAR Research Program 6: Forest, Trees and Agroforestry, the Kunming Institute of Botany, Chinese Academy of Science (CAS) and Chinese Ministry of Science and Technology (NKTSP) under the 12th 5-year National Key Technology Support program with grant number 2013BAB07B06, integration and comprehensive demonstration of key technologies on Green Phosphate mountain Construction for providing the financial support for this study.

Acknowledgments

Peter E. Mortimer would like to thank the National Science Foundation of China (NSFC) for funding this work under the project codes 41761144055 and 41771063. Samantha C. Karunarathna thanks Yunnan Provincial Department of Human Resources and Social Security funded postdoctoral project (number 179122), CAS President’s International Fellowship Initiative (PIFI) for funding his postdoctoral research (number 2018PC0006), and the National Science Foundation of China (NSFC) for funding this work under the project code 31750110478. Thailand Research Fund grant-Taxonomy, Phylogeny and biochemistry of Thai Basidiomycetes (BRG 5580009); the National Research Council of Thailand (NRCT), projects-Taxonomy, Phylogeny and cultivation of Lentinus species in northern Thailand (NRCT/55201020007), Mae Fah Luang University project-Taxonomy, Phylogeny and cultivation of Lentinus species in northern Thailand (MFU/54 1 01 02 00 48), and Thailand Research Fund grant- Taxonomy, Phylogeny and biochemistry of Thai Basidiomycetes (BRG 5580009) are also thanked for supporting this study. Kevin D. Hyde thanks the Chinese Academy of Sciences, project number 2013T2S0030, for the award of Visiting Professorship for Senior International Scientists at Kunming Institute of Botany. The authors also would like to thank Fiona Worthy and Andrew Stevenson for their contributions to the English editing.

Conflicts of Interest

The authors declare no conflict of interest.

References

  1. Reid, W.V. Biodiversity hotspots. Trends Ecol. Evol. 1998, 13, 275–280. [Google Scholar] [CrossRef]
  2. Myers, N.; Mittermeier, R.A.; Mittermeier, C.G.; Da Fonseca, G.A.; Kent, J. Biodiversity hotspots for conservation priorities. Nature 2000, 403, 853–858. [Google Scholar] [CrossRef] [PubMed]
  3. Liu, S.; Lu, P.; Liu, D.; Jin, P. Pinpointing source of mekong and measuring its length through analysis of satellite imagery and field investigations. Geo-Spat. Inf. Sci. 2007, 10, 51–56. [Google Scholar] [CrossRef]
  4. Tang, L.; Yang, Z. Recent studies on fungal species diversity in the Lancang-Mekong River Watershed. Resour. Sci. 2014, 36, 282–295. [Google Scholar]
  5. Moore, D.; Nauta, M.M.; Evans, S.E.; Rotheroe, M. Fungal Conservation: Issues and Solutions; Cambridge University Press: Cambridge, UK, 2009; pp. 1–256. [Google Scholar] [CrossRef]
  6. McLellan, T.; Brown, M. Mushrooms and cash crops can coexist in mountain livelihoods: Wild mushrooms as economic and recreational resources in the Greater Mekong. Mt. Res. Dev. 2017, 37, 108–120. [Google Scholar] [CrossRef]
  7. Gong, M.; Wang, F.; Chen, Y.; Chen, Y.; Cao, J.; Su, L. Protecting the eco-environment of Tricholoma matsutake and improving its sustainable development. For. Res. 2000, 13, 562–567. [Google Scholar]
  8. Mortimer, P.E.; Karunarathna, S.C.; Li, Q.; Gui, H.; Yang, X.; Yang, X.; He, J.; Ye, L.; Guo, J.; Li, H. Prized edible Asian mushrooms: Ecology, conservation and sustainability. Fungal Divers. 2012, 56, 31–47. [Google Scholar] [CrossRef]
  9. Yu, F.; Wang, X.; Liu, P. Prospects of exploitation and utilization on edible fungi resource in Yunnan. Chin. Wild Plant Resour. 2002, 21, 21–25. [Google Scholar]
  10. Hodge, S.; Peterken, G. Deadwood in british forests: Priorities and a strategy. For. Int. J. For. Res. 1998, 71, 99–112. [Google Scholar] [CrossRef]
  11. Kangas, J.; Kuusipalo, J. Integrating biodiversity into forest management planning and decision-making. For. Ecol. Manag. 1993, 61, 1–15. [Google Scholar] [CrossRef]
  12. Spellerberg, I.F.; Sawyer, J.W. Standards for biodiversity: A proposal based on biodiversity standards for forest plantations. Biodivers. Conserv. 1996, 5, 447–459. [Google Scholar] [CrossRef]
  13. Catovsky, S.; Bradford, M.A.; Hector, A. Biodiversity and ecosystem productivity: Implications for carbon storage. Oikos 2002, 97, 443–448. [Google Scholar] [CrossRef]
  14. Smith, J.; Molina, R.; Huso, M.M.; Luoma, D.; McKay, D.; Castellano, M.; Lebel, T.; Valachovic, Y. Species richness, abundance, and composition of hypogeous and epigeous ectomycorrhizal fungal sporocarps in young, rotation-age, and old-growth stands of Douglas-fir (Pseudotsuga menziesii) in the cascade range of oregon, USA. Can. J. Bot. 2002, 80, 186–204. [Google Scholar] [CrossRef]
  15. O’Dell, T.E.; Ammirati, J.F.; Schreiner, E.G. Species richness and abundance of ectomycorrhizal basidiomycete sporocarps on a moisture gradient in the Tsuga heterophylla zone. Can. J. Bot. 2000, 77, 1699–1711. [Google Scholar] [CrossRef]
  16. Luoma, D.L.; Frenkel, R.E.; Trappe, J.M. Fruiting of hypogeous fungi in oregon Douglas-fir forests: Seasonal and habitat variation. Mycologia 1991, 335–353. [Google Scholar] [CrossRef]
  17. Bonet, J.; Fischer, C.; Colinas, C. The relationship between forest age and aspect on the production of sporocarps of ectomycorrhizal fungi in Pinus sylvestris forests of the central Pyrenees. For. Ecol. Manag. 2004, 203, 157–175. [Google Scholar] [CrossRef]
  18. Tedersoo, L.; Nara, K. General latitudinal gradient of biodiversity is reversed in ectomycorrhizal fungi. New Phytol. 2010, 185, 351–354. [Google Scholar] [CrossRef] [PubMed]
  19. Tedersoo, L.; Sadam, A.; Zambrano, M.; Valencia, R.; Bahram, M. Low diversity and high host preference of ectomycorrhizal fungi in western Amazonia, a neotropical biodiversity hotspot. ISME J. 2010, 4, 465–471. [Google Scholar] [CrossRef] [PubMed]
  20. Gabel, A.; Gabel, M. Comparison of diversity of macrofungi and vascular plants at seven sites in the black hills of south Dakota. Am. Midl. Nat. 2007, 157, 258–296. [Google Scholar] [CrossRef]
  21. Bills, G.; Holtzman, G.; Miller, O., Jr. Comparison of ectomycorrhizal–basidiomycete communities in red spruce versus northern hardwood forests of West Virginia. Can. J. Bot. 1986, 64, 760–768. [Google Scholar] [CrossRef]
  22. Ferrer, A.; Gilbert, G.S. Effect of tree host species on fungal community composition in a tropical rain forest in Panama. Divers. Distrib. 2003, 9, 455–468. [Google Scholar] [CrossRef] [Green Version]
  23. Villeneuve, N.; Grandtner, M.M.; Fortin, J.A. Frequency and diversity of ectomycorrhizal and saprobic macrofungi in the Laurentide mountains of Quebec. Can. J. Bot. 1989, 67, 2616–2629. [Google Scholar] [CrossRef]
  24. Bahram, M.; Polme, S.; Koljalg, U.; Zarre, S.; Tedersoo, L. Regional and local patterns of ectomycorrhizal fungal diversity and community structure along an altitudinal gradient in the hyrcanian forests of Northern Iran. New Phytol. 2012, 193, 465–473. [Google Scholar] [CrossRef] [PubMed]
  25. Luo, X.; Karunarathna, S.; Luo, Y.; Xu, K.; Xu, J.; Chamyuang, S.; Mortimer, P. Drivers of macrofungal composition and distribution in Yulong Snow mountain, Southwest China. Mycosphere 2016, 7, 727–740. [Google Scholar] [CrossRef]
  26. Brown, N.; Bhagwat, S.; Watkinson, S. Macrofungal diversity in fragmented and disturbed forests of the Western Ghats of India. J. Appl. Ecol. 2006, 43, 11–17. [Google Scholar] [CrossRef]
  27. Liang, Z. Flora Fungorum Sinicorum. Vol. 32. Cordyceps; Science Press: Beijing, China, 2007. [Google Scholar]
  28. Peng, Y.; Liu, B.; Fan, L. Flora Fungorum Sinicorum. Vol. 2. Tremellales Et Dacrymycetales; Science Press: Beijing, China, 1992. [Google Scholar]
  29. Wu, X.; Yang, Z.; Li, T. Fungi of Tropical China; Science Press: Beijing, China, 2010. [Google Scholar]
  30. Yang, Z. Flora Fungorum Sinicorum. Vol. 27. Amanitaceae; Science Press: Beijing, China, 2005. [Google Scholar]
  31. Zhao, J.; Zhang, X. Flora Fungorum Sinicorum. Vol. 18. Ganodermataceae; Science Press: Beijing, China, 2000. [Google Scholar]
  32. Zhou, T.; Chen, Y.; Zhao, L.; Fu, H.; Yang, B. Flora Fungorum Sinicorum. Vol. 36. Geastraceae and Nidulariaceae; Science Press: Beijing, China, 2006. [Google Scholar]
  33. Index Fungorum. Available online: http://www.indexfungorum.org/names (accessed on 1 April 2018).
  34. R Core Team. R: A Language and Environment for Statistical Computing; R Foundation for Statistical Computing: Vienna, Austria, 2013. [Google Scholar]
  35. Kruskal, J.B. Nonmetric multidimensional scaling: A numerical method. Psychometrika 1964, 29, 115–129. [Google Scholar] [CrossRef]
  36. O’Hanlon, R.; Harrington, T.J.; Berch, S.M.; Outerbridge, R.A. Comparisons of macrofungi in plantations of sitka spruce (Picea sitchensis) in its native range (British Columbia, Canada) versus non-native range (Ireland and Britain) show similar richness but different species composition. Can. J. For. Res. 2013, 43, 450–458. [Google Scholar] [CrossRef]
  37. Brockerhoff, E.G.; Jactel, H.; Parrotta, J.A.; Quine, C.P.; Sayer, J. Plantation forests and biodiversity: Oxymoron or opportunity? Biodivers. Conserv. 2008, 17, 925–951. [Google Scholar] [CrossRef]
  38. Humphrey, J.; Newton, A.; Peace, A.; Holden, E. The importance of conifer plantations in Northern Britain as a habitat for native fungi. Biol. Conserv. 2000, 96, 241–252. [Google Scholar] [CrossRef]
  39. Shi, L.L.; Mortimer, P.E.; Slik, J.F.; Zou, X.M.; Xu, J.; Feng, W.T.; Qiao, L. Variation in forest soil fungal diversity along a latitudinal gradient. Fungal Divers. 2014, 64, 305–315. [Google Scholar] [CrossRef]
  40. Durall, D.M.; Gamiet, S.; Simard, S.W.; Kudrna, L.; Sakakibara, S.M. Effects of clearcut logging and tree species composition on the diversity and community composition of epigeous fruit bodies formed by ectomycorrhizal fungi. Botany 2006, 84, 966–980. [Google Scholar] [CrossRef]
  41. Gomez-Hernandez, M.; Williams-Linera, G. Diversity of macromycetes determined by tree species, vegetation structure, and microenvironment in tropical cloud forests in Veracruz, Mexico. Botany 2011, 89, 203–216. [Google Scholar] [CrossRef]
  42. Gilbert, G.S. The Dimensions of Plant Disease in Tropical Forests; Cambridge University Press: Cambridge, UK, 2005. [Google Scholar]
  43. Gilbert, G.S.; Ferrer, A.; Carranza, J. Polypore fungal diversity and host density in a moist tropical forest. Biodivers. Conserv. 2002, 11, 947–957. [Google Scholar] [CrossRef]
  44. Osono, T. Diversity, resource utilization, and phenology of fruiting bodies of litter-decomposing macrofungi in subtropical, temperate, and subalpine forests. J. For. Res. 2015, 20, 60–68. [Google Scholar] [CrossRef] [Green Version]
  45. Lodge, D.J. Factors related to diversity of decomposer fungi in tropical forests. Biodivers. Conserv. 1997, 6, 681–688. [Google Scholar] [CrossRef]
  46. Geml, J.; Pastor, N.; Fernandez, L.; Pacheco, S.; Semenova, T.A.; Becerra, A.G.; Wicaksono, C.Y.; Nouhra, E.R. Large-scale fungal diversity assessment in the andean Yungas forests reveals strong community turnover among forest types along an altitudinal gradient. Mol. Ecol. 2014, 23, 2455–2472. [Google Scholar] [CrossRef] [PubMed]
Figure 1. Map of the study sites across China and Thailand.
Forests 09 00402 g001
Figure 2. The difference in ecological diversity of macrofungi between native forests and plantation forests (A) and between temperate and tropical climates (B). Lowercase letters that indicate a significant difference between either forest or climate type (p ≤ 0.05, Mann–Whitney U test), whereas the same letters indicate no significant difference. The study sites in temperate areas were Zhongdian (n = 5) and Baoshan (n = 5), and those in tropical areas were Xishuangbanna (n = 4) and Doi Mae Salong (n = 6). Plantation forests (n = 5) included three pine plantations, one mixed rubber and coffee plantation, and one tea plantation. Native forests (n = 15) are defined as forests growing without human management.
Forests 09 00402 g002
Figure 3. Hierarchical cluster diagram and heatmap of macrofungal community composition based on macrofungal abundance at the genera level, to show qualitative clustering within two climate types using average linkage of macrofungal genera. Heatmap values reflect relative abundance of genera across two climate types. Colours are scaled from highest abundance (blue) to lowest (green) values within columns; all ratios of genus relative abundance greater than or equal to 0.02 are shown. Solid lines in each climate type indicate the relative abundance of each genus at the study sites. Temperate areas: Zhongdian and Baoshan; tropical areas: Xishuangbanna and Doi Mae Salong.
Forests 09 00402 g003
Figure 4. Hierarchical cluster diagram and heatmap of macrofungal community composition based on macrofungal abundance at the genera level, showing qualitative clustering under two forest management methods using average linkage of macrofungal genera. Heatmap values reflect the relative abundance of genera under the two management methods. Colours are scaled from highest (blue) to lowest (green) values within columns. All ratios showing the relative abundance of macrofungal genera greater than or equal to 0.01 are shown. Solid lines indicate a relative abundance of each genus found at the study sites. Plantation forest: pine plantations, mixed rubber and coffee plantation, and tea plantations. Native forest: forests growing without human management.
Forests 09 00402 g004
Figure 5. Correlation between macrofungal diversity (Shannon–Wiener index), four selected environmental factors (tree species richness, elevation, and latitude), and the influence these four factors have on the macrofungal community. Left column: data points represent twenty study plots. Trend lines show the relationships between macrofungal diversity and each of the environmental factors. (A) Macrofungal diversity and tree species richness; (B) macrofungal diversity and elevation; (C) macrofungal diversity and latitude, P represents the level of significance for each correlation (p < 0.05); ρ represents the Spearman correlation coefficient; r2 represents goodness of fit of the linear model. Right column: nonmetric multidimensional scaling (NMDS) ordination biplots of macrofungal community structure. Red circles represent macrofungal communities in native forests, purple circles represent macrofungal communities in plantation forests. Contour plots represent the relationship of community structure with different environmental factors. (a) Distribution of macrofungal species across isoclines of tree species richness. (b) Distribution of macrofungal species across isoclines of elevation. (c) Distribution of macrofungal species across isoclines of latitude.
Forests 09 00402 g005
Table 1. Basic plot information at each study site, including location, number of plots, plot size, mean elevation, climate types, mean monthly precipitation, mean monthly relative humidity, management type, and dominant tree species. Calculation of mean monthly precipitation, mean monthly temperature, and mean monthly relative humidity were based on the meteorological data from May to October during 2012 to 2014.
Study siteZhongdianBaoshanXishuangbannaDoi Mae Salong
LocationYunnan Province, ChinaYunnan Province, ChinaYunnan Province, ChinaChiang Rai Province, Thailand
Number of plots5546
Plot size100 m × 100 m100 m × 100 m100 m × 100 m100 m × 100 m
Mean elevation (m)3265249016611126
Climate typeTemperateTemperateTropicalTropical
Mean monthly temperature (°C)13.320.323.525.7
Mean monthly precipitation (mm)82.4127.2164.4212
Mean monthly relative humidity (%)70.372.274.580.3
Management typeFive native forestsThree pine plantations,
Two native forests
One tea plantation,
Three native forests
One mixed rubber and coffee plantation,
One pine plantation, four native forests
Dominant treesPinus densata Mast., Picea likiangensis (Franchet) E. Pritzel, Rhododendron rubiginosum Franchet, Lyonia ovalifolia var. hebecarpa (Franchet ex Forbes & Hemsley) Chun, Rhododendron tapetiforme Balf. f. & Kingdon-Ward, Betula platyphylla SukaczevPine plantations: Pinus armandii Franchet, Pinus yunnanensis Franchet
Native forests: Pinus yunnanensis, Castanopsis orthacantha Franchet, Quercus rehderiana Handel-Mazzetti
Tea plantation: Camellia sinensis var. assamica (J. W. Masters) Kitamura; Native forests: Syzygium brachythyrsum Merrill & L. M. Perry, Xanthophyllum flavescens Roxburgh, Macaranga henryi (Pax & K. Hoffmann) Rehder, Cryptocarya hainanensis Merrill, Myrsine seguinii H. Leveille, Anneslea fragrans Wallich, Schima wallichii (Candolle) Korthals, Castanopsis mekongensis A. Camus, Litsea cubeba (Loureiro) Persoon, Castanopsis calathiformis (Skan) Rehder & E. H. WilsonMixed rubber and coffee plantation: Hevea brasiliensis (Willdenow ex A. Jussieu) Müller Argoviensis, Coffea arabica Linnaeus;
Pine planation: Pinus kesiya Royle ex Gordon;
Native forests: Schima wallichii, Pittosporopsis kerrii Craib, Parashorea chinensis H. Wang, Baccaurea ramiflora Loureiro, Knema furfuracea (Hook.f. & Thomson) Warb.,
Castanopsis tribuloides (Smith) A., Castanopsis diversifolia King ex Hook. f., Castanopsis calathiformis, Lithocarpus polystachyus (Wall. ex A. DC.) Rehder, Erythrina stricta Roxb., Heliciopsis terminalis (Kurz) Sleumer
Table 2. Species richness of macrofungi (total macrofungi, ectomycorrhizal fungi, and non-ectomycorrhizal fungi) in two forest management methods and two climate types. Within one row, lowercase letters indicate difference in species richness between three macrofungal groups (total fungi, ectomycorrhizal fungi, and non-ectomycorrhizal fungi) within the same management method, the same climate type, and the same native mixed forest type, using a Kruskal–Wallis rank sum test (p ≤ 0.05). Within one column, uppercase letters indicate the difference in species richness of total fungi between two management methods and two climate types using a Mann–Whitney U test (p ≤ 0.05), and between four native mixed forest types using a Kruskal–Wallis rank sum test (p ≤ 0.05); the difference in species richness of ectomycorrhizal fungi between two management methods and two climate types using a Mann–Whitney U test (p ≤ 0.05), and between four native mixed forest types using a Kruskal–Wallis rank sum test (p ≤ 0.05); the difference in species richness of non-ectomycorrhizal fungi between two management methods and two climate types using a Mann–Whitney U test (p ≤ 0.05), and between four native mixed forest types using a Kruskal–Wallis rank sum test (p ≤ 0.05). Plantation forests (n = 5) included three pine plantations, one mixed rubber and coffee plantation, and one tea plantation. Native forests (n = 15) are defined as forests growing without human management. The study sites in temperate areas were Zhongdian (n = 5) and Baoshan (n = 5), and those in tropical areas were Xishuangbanna (n = 4) and Doi Mae Salong (n = 6). There were four native mixed forest types from native forests; namely, CTCF: cold temperate coniferous forest in Zhongdian (n = 5), WTCF: warm temperate coniferous forest in Baoshan (n = 2), MEBF: monsoon evergreen broad-leaved forest in Xishuangbanna (n = 3), and TEBF: montane evergreen broad-leaved forest in Doi Mae Salong (n = 4).
Management TypeTotal FungiEctomycorrhizal FungiNon-Ectomycorrhizal Fungi
Native forests163.4 ± 19.8 A/a87.7 ± 15.6 A/b75.7 ± 13.7 A/b
Plantation forests90.3 ± 21.5 B/a35.5 ± 6.9 A/a55 ± 16.6 A/a
Climate type
Temperate158.8 ± 25.5 A/a103.7 ± 19.8 A/a55.1 ± 7.2 A/b
Tropical124.2 ± 21.8 A/a40.4 ± 5.6 B/b83.9 ± 19.9 A/ab
Native mixed forest type
CTCF214.4 ± 32.1 A/a151.8 ± 19.2 A/a62.6 ± 13.5 B/b
WTCF139.5 ± 9.5 A/a89 ± 6 B/ab50.5 ± 3.5 B/b
MEBF200 ± 6.3 A/a39 ± 3.6 B/b161.3 ± 5.5 A/b
TEBF84 ± 24 B/a43.5 ± 13.5 B/a40.5 ± 10.7 B/a
Table 3. The results from the Jaccard index analysis indicating the degree of similarity or dissimilarity in macrofungal genera abundance across the four study sites. A larger value represents a greater degree of dissimilarity between two sites.
Jaccard IndexBaoshanXishuangbannaDoi Mae SalongZhongdian
Baoshan---
Xishuangbanna0.7661322---
Doi Mae Salong0.72873820.7479675---
Zhongdian0.69647780.83197830.8407662---

