Article

High Throughput Screening of Elite Loblolly Pine Families for Chemical and Bioenergy Traits with Near Infrared Spectroscopy

1
Forest Products Development Center, School of Forestry and Wildlife Sciences, Auburn University, Auburn, AL 36849, USA
2
School of Forestry and Wildlife Sciences, Auburn University, Auburn, AL 36849, USA
3
Department of Mathematics and Statistics, Auburn University, Auburn, AL 36849, USA
4
Department of Biosystems Engineering, Center for Bioenergy and Bioproducts, Auburn University, Auburn, AL 36849, USA
5
Forest Health Dynamics Laboratory, School of Forestry and Wildlife Sciences, Auburn University, Auburn, AL 36849, USA
*
Author to whom correspondence should be addressed.
Forests 2018, 9(7), 418; https://doi.org/10.3390/f9070418
Submission received: 30 May 2018 / Revised: 7 July 2018 / Accepted: 9 July 2018 / Published: 12 July 2018
(This article belongs to the Special Issue Forest Bioenergy and Bioproducts)

Abstract

:
Pinus taeda L. (loblolly pine) dominates 13.4 million ha of US southeastern forests and contributes over $30 billion to the economy of the region. The species will also form an important component of the renewable energy portfolio as the United States seeks national and energy security as well as environmental sustainability. This study employed NIR-based chemometric models as a high throughput screening tool to estimate the chemical traits and bioenergy potential of 351 standing loblolly pine trees representing 14 elite genetic families planted on two forest sites. The genotype of loblolly pine families affected the chemical, proximate and energy traits studied. With a range of 36.7% to 42.0%, the largest genetic variation (p-value < 0.0001) was detected in the cellulose content. Furthermore, although family by site interactions were significant for all traits, cellulose was the most stable across the two sites. Considering that cellulose content has strong correlations with other properties, selecting and breeding for cellulose could generate some gains.

1. Introduction

Timber harvested in the southern United States accounts for 60% of the wood consumed nationally and 18% of global wood consumption [1]. The majority of this production is sourced from plantation-grown loblolly pine. This widely grown tree species dominates approximately 13.4 million ha of the southeastern forests and accounts for more than 50% of the standing pine volume in the region [2]. As the most economically important tree species in the United States, loblolly pine provides some 110,000 direct and indirect jobs and contributes approximately $30 billion to the economy of the southeastern United States [3].
For efficient utilization of loblolly pine, knowledge of its chemical properties will be valuable. Chemically, wood is principally composed of carbon (C), oxygen (O), and hydrogen (H). These elements combine into the three structural components of cellulose, hemicelluloses and lignin. In addition, a minor fraction of wood is made up non structural extractives and other mineral elements. The chemical composition of wood impacts other wood properties, as well as the quality of final products. For example, the lignin and extractives content that may be desirable to a degree because they impart durability against biological agents in lumber products are problematic in pulp and paper applications due to their adverse effects on the pulping process. Similarly, the chemical composition affects traits such as density and strength; two important properties that dictate the quality of wood for structural applications.
In addition to the conventional forest products industry, loblolly pine will form an integral component of the renewable energy portfolio as the United States seeks national and energy security as well as environmental sustainability. In recent years, interest has been growing in the use of loblolly pine as a renewable energy feedstock due to existing knowledge of intensive southern pine plantation management, favorable production economics and high yields [4,5].
Several loblolly pine energy plantations concepts have been proposed. One approach is through dual-cropping whereby a pine stand is established and managed to intentionally produce conventional saw timber and pulpwood as well as bioenergy. The timber crop is planted in widely spaced rows; in between these, trees are planted in tightly spaced rows for bioenergy [6]. An alternative to this approach is to have more efficient fast-growing dedicated pine plantations at higher densities and shorter rotations [4]. However, fast-growing, densely planted short-rotation pine plantations will be susceptible to endemic organisms such as fusiform rust, pine beetles, pine tip moths and seedling debarking weevils [7,8]. As such disease tolerance should be of prime consideration in the establishment of pine energy plantations.
Just as for the conventional applications, the chemical composition will affect the yield and quality of bioenergy/fuel products. For instance, in the production of ethanol, wood with a high concentration of cellulose is desirable for high yields. On the flip side, high amounts of extractives and lignin will inhibit the bioconversion process. In addition to the chemical properties, knowledge about the bioenergy potential (i.e., proximate composition and energy content) of loblolly pine is necessary in bioenergy/fuel applications. The proximate composition of volatile matter, fixed carbon, and ash give an indication of the thermal reactivity of a fuel [9]. A fuel with high volatile matter content is easier to ignite and yield higher quantities of liquid products; whereas a higher fixed carbon content gives more solid products. For example, poplar, which has a 75% volatile matter content has an ignition temperature of 235 °C, whereas the volatile matter content and ignition temperature of eucalyptus has been reported to be 64% and 285 °C respectively [10]. The mineral elements usually form particulates known as ash during combustion or gasification.
As such, knowing the chemical composition, proximate composition and energy content of loblolly pine could aid in the decision-making process with regards to the suitability of this feedstock to support the conventional forest products industry as well as the emerging bioeconomy.
However, current methodologies employed for determining wood properties are laborious, costly and usually destructive. Alternative analytical tools that can be used to rapidly and cost-effectively estimate these important properties will thus be invaluable to stakeholders.
Near infrared spectroscopy (NIR) has emerged over the years as a rapid and reliable tool for the estimation of the properties of wood and other forest products. A good number of research studies have reported on the application of NIR to predict the chemical composition, proximate composition, and energy content of wood and other lignocellulosic materials.
NIR was used to predict the properties of loblolly pine wafers obtained from two sites [11]. The researchers determined that although models developed from samples of one site could be used to predict the cellulose content of wood from the other site, the R2 value was lower than those for the individual site predictions and may thus be only applicable for ranking and selection purposes. NIR also was used to predict the extractives, holocellulose and lignin content of Liriodendron tulipifera solid wood blocks employing the full (800 nm–2500 nm) and reduced (1300 nm–1800 nm) spectral ranges [12]. The best performing models were those calibrated with the full NIR range; reporting R2 values of 0.84 for extractives, 0.68 for holocellulose and 0.64 for lignin. In both studies, the models developed for lignin content had low predictive power. This result was attributed to the generally low variation of lignin content in wood and usually large errors associated with lignin determination in the laboratory [11].
Several studies also have reported the proximate composition and energy content of wood as determined with NIR. For instance, NIR was used to predict the higher heating value of Pinus palustris considering the effect of lignin content and extractives [13]. They reported that the models predicted the HHV of unextracted wood samples better than they did acetone-extracted samples. In addition, graphs of the regression coefficients showed similar plots for the HHV and extractives content; an implication that the two properties have similar molecular features.
With respect to the ash content of wood, NIR-based models generally give low coefficients of determination. For example, a model developed to determine the ash contents of two dedicated energy crops had an R2 value of 0.58 [14]. These poor results have been attributed to the fact that NIR does not interact directly with the compounds that form ash, e.g., calcium, potassium, and silica.
In this study, NIR was utilized as a high throughput tool to non-destructively estimate the chemical traits and bioenergy potential of standing elite loblolly pine families in genetic trials. The stem quality, volume, and resistance to fusiform rust of these elite families have been improved through tree breeding programs. Apart from the southern pine industry’s interest in knowing the chemical and bioenergy properties of this essentially new feedstock, the stakeholders also would like to incorporate this knowledge into programs that aim to further improve quality of this resource for different end users.

2. Materials and Methods

2.1. Materials

Loblolly pine increment cores and whole trees were acquired from two genetic research plantations established in 1998. Study Site 1 was located near Nahunta, Brantley County, Georgia, USA (31°12′16′′ N, 81°58′56′′ W) and Site 2 was located near Yulee, Nassau County, FL, USA (30°63′ N, 81°57′ W). The Georgia site had poorly drained fine sandy loam that was generally poor in nutrients; whereas the Florida site had poorly drained loamy clay soil that formed from marine sediments. The average annual precipitation for the two sites were respectively 1315 mm and 1350 mm according to NOAA. The same planting design, silvicultural treatments and seedlots of genetically improved loblolly pine families were administered on both sites to enable the comparison of growth and stability of the families involved. Each site was divided into fifteen blocks. Eighty trees representing eighty half-sib families were planted on each block. Fifteen of these elite families were selected to be used; thus a total of 450 trees (i.e., fifteen families with one replication on each block per site) were earmarked for the study. In order to maintain anonymity, a unique code was assigned to each of the families for data analysis and reporting.
In brief, 5 mm increment cores were sampled at breast height from thirteen-year old trees during the spring and summer of 2011. Three hundred and fifty-one tree cores were obtained because some trees were dead at time of sampling. The second set of material comprised whole trees that were harvested from the selected families in 2014 and 2015. One tree per family was destructively sampled from each of the sites, thus a total of thirty trees. In addition, nominal 2 × 4-in No. 2 southern yellow pine lumber was obtained from West Fraser Inc.; a commercial sawmill located in Opelika, AL, USA. Detailed information about the material and sampling is provided elsewhere [15].
Southern pine wood samples that were loaded until failure in structural testing were used [15]. Materials had been sawn into smaller blocks after destructive testing and stored in airtight zip lock bags in a conditioning chamber until they were needed for further analysis. Prior to subsequent analysis, wood blocks were first chipped using a chisel and hammer. For each sample, a Wiley mill (Thomas Scientific, model 3383-L10, Swedesboro, NJ, USA) was used to grind a portion to pass a 40-mesh screen, and the remaining was ground to pass an 80-mesh screen. The 40-mesh sample were used to determine the chemical and proximate composition as well as the energy content of pine wood. NIR spectra were collected from material ground to pass the 80-mesh screen.

2.2. Methods

2.2.1. Chemical Analysis

Laboratory experiments following conventional standards were used to determine the chemical composition of loblolly pine wood. Extractives content was determined following NREL/TP-510-42619 [16]. Using a Soxhlet Apparatus, 150 mL of industrial grade acetone was used to extract 5 g of test sample for 6 h. An additional 2 g of the sample was taken at this time for moisture content (MC) determination. Acetone was evaporated from the extract using a rotary evaporator. Extract was then dried at 40 °C for 24 h in a vacuum oven and the final mass measured for extractives content determination.
The amount of total lignin and carbohydrates in samples were determined as described in NREL/TP-510-42618 [17]. The total lignin was computed as the sum of acid-soluble lignin (ASL) and acid insoluble lignin (AIL). ASL was determined with a Genesys UV-Visible spectrophotometer (Thermo Fisher Scientific, Waltham, MA, USA) immediately after hydrolysis. Absorbance of a test sample was measured at the recommended wavelength of 240 nm, ensuring that the absorbance ranged between 0.7–1.0. Monomeric sugars (i.e., glucose, xylose, galactose, arabinose and mannose) in test samples were determined via High Performance Liquid Chromatography (HPLC) (Shimadzu Cooperation, Kyoto, Japan) using a Biorad Aminex HPX-87P column (Bio-Rad Laboratories, Hercules, CA, USA) equipped with the appropriate guard column at a column temperature of 85 °C and run time of 35 mins. Holocellulose was computed as the sum of all monomeric sugars; cellulose was computed as glucose ( 1 3 mannose ) and hemicelluloses computed as the difference between holocellulose and cellulose [18].

2.2.2. Proximate Analysis and Energy Content Determination

Proximate analysis was conducted to determine the thermal reactivity of pine wood samples. The volatile matter of samples was determined as specified in CEN/TS 15148 [19] using a furnace (VMF Carbolite, model 10/6/3216P, Hope, England). Ash content was determined following NREL/TP-510-42622 [20]. The fixed carbon content of wood was determined as the sum of the percentages of moisture, volatile matter and ash deducted from 100.
The energy of test samples was determined according to ASTM D5865 [21] using an IKA C-200 bomb calorimeter (IKA Works Inc., model C200, Wilmington, NC, USA). Approximately 0.5 g of test sample was pelletized and completely combusted in an oxidative environment.

2.2.3. Near Infrared Spectroscopy (NIR)

NIR spectra of test samples were collected using a PerkinElmer Spectrum Model 400 NIR spectrometer (PerkinElmer, Waltham, MA, USA). The wavenumber range of the instrument was from 10,000 cm−1 to 4000 cm−1. Each sample was scanned thirty-two times at a resolution of 4 cm−1 and averaged into one spectrum for analysis. Spectrum of a Spectralon standard was taken as the background reference sample every 20 min to correct for potential drifts with time.

2.2.4. Multivariate Data Analysis

PerkinElmer Spectrum Quant+ software (PerkinElmer, Waltham, MA, USA) was used to develop Partial Least Squares regression (PLS) models. The first derivatives of raw spectra were used for PLS1 model construction.
A total of two hundred and fifty samples were used in model calibration and validation. Samples were randomly assigned to either the calibration or test set. One hundred and ninety samples were used for model calibration and full cross-validation. The remaining 60 samples were used as an independent test set for external validation. The performances of validated models were evaluated using the following five statistics: standard error of calibration (SEC), standard error of cross-validation (SECV), standard error of prediction (SEP), coefficient of determination (R2) and the residual predictive deviation/ratio of performance to deviation (RPD). Models that had the lowest error values were selected and used to predict the aforementioned chemical and thermochemical properties.
The PROC GLM procedure in SAS (SAS Institute, Inc. Cary, NC, USA) was used to conduct analysis of variance (ANOVA). Tukey-HSD tests with alpha set to 0.05 were conducted when needed to further investigate pair-wise comparison between the treatments. Principal Components Analysis (PCA) was conducted using the Stats package and Prcomp function in RStudio (RStudio, Inc, Boston, MA, USA). Diagrams and tables were produced with MS Excel (Microsoft Corp. Redmond, WA, USA) or RStudio (RStudio, Inc, Boston, MA, USA).

3. Results and Discussion

3.1. Chemical Composition, Proximate Composition and Energy Content

Descriptive statistics of the chemical composition determined via conventional laboratory methods are presented in Table 1. The mean extractives content of southern pines used in this study was 3.1% (SD = 1.59%), with minimum and maximum values of 0.4% and 9.4% respectively. Percent extractives determined for the commercially acquired southern pine samples were slightly higher than that measured for the elite loblolly pine families (i.e., 3.8% versus 2.8%). The range of extractives content determined for pine samples in this study were low compared to some of those stated in the literature. Ranges of 2.8% to 26.9% were reported for loblolly pine [22] and 0.0% to 20.6% for Pinus palustris [13].
In the case of total lignin content, values ranged from a low of 26.7% to a high of 35.0%. The mean lignin and extractives contents of the loblolly pine families were more similar to that of the southern pines—31.7% (SD = 1.52%) and 3.1% (SD = 1.64%) respectively. For the carbohydrates, wider ranges were recorded for the loblolly pine families than for the southern pines. For instance, cellulose ranged from 29.4% to 47.2% for the former but 30.4% to 42.8% for the latter. The mean cellulose, glucose and hemicelluloses of all samples were 37.2% (SD = 2.92%), 40.3% (SD = 3.07%) and 22.9% (SD = 1.57%) respectively.
In the literature, lignin and cellulose contents of 11-year old loblolly pine were reported to range from 24.1% to 32.6%, and 35.6% to 55.2% respectively [11]. The mean chemical composition of loblolly pine aged between 21 to 25 years have been determined as follows: glucan—39.2%, cellulose—35.9%, hemicelluloses—23.3% and lignin—28.3% [23].
Results obtained from proximate analysis and bomb calorimetry are shown in Table 2. Percent volatile matter determined for all the southern pine wood samples ranged from a high of 87.1% to a low of 80.9%, with a mean of 83.6% and SD of 1.16%. Also, the mean fixed carbon content of all test samples was 16.2% (SD = 1.17%); whereas % ash was between 0.1–0.6%. The mean percent volatile matter, fixed carbon and ash determined for southern pine wood in this study were similar to the respective 85.6%, 14.1% and 0.3% reported in the literature [24] for loblolly pine stemwood.
Although the range of calorific value determined for southern pine in this study was relatively wider (i.e., 17.0–22.7 MJ/kg) than what have been usually reported for clean wood, the mean value of 17.9 MJ/kg (SD = 0.6) was lower. A narrower HHV range of 20.2–23.3 MJ/kg for unextracted Pinus palustris reduced further after extracting samples with acetone [13]. Notwithstanding, wide calorific values ranges have been reported for lignocellulosic biomass comprising of needles, twigs and bark of conifers, broad-leaved trees, shrubs, and grasses [25].
Generally, wide ranges with good overlaps were noted among the training/cross-validation and independent datasets. These help to improve the robustness of models when applied in predicting properties of future unknowns [15].

3.2. NIR-Model Calibration and Evaluation for Chemical Composition

Partial least squares (PLS) regression models were developed using the first derivatives of NIR spectra as independent variables (i.e., X-variables) and data obtained via conventional laboratory methods as dependent variables (i.e., Y-variables). One hundred and ninety samples were used in model calibration and full cross-validation. An additional test set made up of 60 samples were used for external validation. Calibrations obtained for the chemical components are summarized in Table 3. Using four or five latent variables, good calibration coefficients were obtained for all the properties with R2cv values greater than 0.7 [26]. Also, relatively small differences were observed between the errors of calibration (SEC) and cross-validation (SECV). This is an indication that the selected model did a good job of predicting the properties of the single-element test set at each iteration [27]. The strong correlation (R = 0.99) between glucose and cellulose was reflected in their similar fit statistics. The relatively lower errors associated with NIR-based PLS models relative to the standard deviation of the laboratory determined reference data generated models with good RPDs. RPD values of cross-validated models ranged from a low of 1.58 for % hemicelluloses to a high of 2.48 for % glucose. According to the literature, this qualified all developed models to be used as a preliminary screening tool [28,29].
The model statistics for the chemical components were comparable to what was determined for lignin (SEC = 0.48%; SECV = 0.92%; R2 = 0.85), cellulose (SEC = 1.03%; SECV = 1.86%; R2 = 0.8), glucan (SEC = 1.09%; SECV = 1.96%; R2 = 0.82) and hemicelluloses (SEC = 0.92%; SECV = 1.24%; R2 = 0.59) for loblolly pine wood [23].
In a more similar study, some chemical properties of fourteen full-sib loblolly pine families obtained from two different sites were predicted with NIR [11]. The study developed several models using the latewood, earlywood, growth rings three and eight, as well as separate models using materials from the two sites. For α-cellulose models, the researchers reported an R2 value range of between 0.56 to 0.63 for the different wood types and rings, which increased to 0.75 (i.e., SEC = 2.4%; SECV = 2.0%) when the whole core was used in modeling. Their lignin models, however, had bad performances, with for instance, the site B model having an R2 value of 0.16 and the model developed with the complete dataset having an R2 of 0.37.
When models developed in this study were applied in predicting the chemical properties of an independent test set, the errors (i.e., SEP) increased as expected and consequently affected the R2iv values adversely; especially for % hemicelluloses. This poor performance can be attributed to two reasons. Firstly, a model usually performs much worse on an independent test data not originally included in model training. Secondly, the test dataset was made up of fifteen different loblolly pine families. In a previous study [15] with similarly low R2iv, when predicted test samples were separated out into the individual elite families and a One-way ANOVA conducted to test for equality of means between NIR-predicted and lab-measured property, no significant differences were noted.

3.3. NIR-Model Calibration and Evaluation for Proximate Composition and Energy Content

Calibrations that were obtained for the bioenergy/fuel related properties are presented in Table 3. Between three to five latent variables were used in the construction of PLS models. The best cross-validated models were for % volatile matter (SECV = 0.4%; R2cv = 0.88; RPD = 2.23) and HHV (SECV = 022%; R2cv = 0.83; RPD = 2.04). Three latent variables were used in building the model for ash which gave an R2cv value of 0.58 and RPD value of 1.54. Contrasting results have been reported in the literature about the capability of infrared spectroscopy to model the ash content of lignocellulosic biomass. For instance, whereas some models performed well in predicting the ash content of Norway spruce wood [30], others had varying degrees of prediction success based on the wavenumber range and spectral pretreatment technique used [14].
Among the four properties modeled, the prediction errors (i.e., SEP) for volatile matter was the highest—more than twice the SECV. In contrast, the SEP of the model for % fixed carbon was slightly lower than its SECV. Although errors associated with a model is generally expected to increase when used for predicting future unknown, this is not always the case [31]; as is apparent for the fixed carbon model in this study and other studies [22,23]. Except for the model for HHV, the others did not perform well when used to predict properties of the independent test set.

3.4. Prediction and Screening of the Elite Loblolly Pine Families for Chemistry

Validated models that had the lowest error values were used to predict the chemical traits of 351 standing trees representing 14 elite loblolly pine families growing on two forest sites.
Results of Two-way ANOVA testing the effect of family, site and family × site interaction are summarized in Table 4. Except for hemicelluloses, the loblolly pines families differed in chemical composition.
In addition, the significant interaction term for all properties studied indicates that the chemical composition of a family can vary depending on the environment. As stated by [32], the properties of wood are a consequent of the interaction between a tree’s genetic potential and growing environment. In Figure 1, the effect of site was also clearly seen in a scores plot of PC-1 and PC-2.
Extractives content of the elite loblolly pine families ranged between 3.8% to 7.4%, Table 5 and Table 6. This is comparable to the 2.5% to 7.0% for loblolly pine wood obtained from five stands with different silvicultural treatments [33]. The researchers noted the innerwood contained a relatively higher amount (i.e., 5.2% to 7.0%) of alcohol-benzene extractives compared to the outerwood (i.e., 2.5% to 4.5%). Similar results where the extractives content of Pinus palustris decreased as one moved from the pith towards the bark, and also from the butt higher up the stem have been reported [34].
As can be seen in Table 4, the differences in the extractives content between the families on a site is a function of genotypic variation; whereas differences within a single family on the two sites is a response to environmental conditions such as the presence of biological degraders or silvicultural treatments that aim to increase tree growth [35,36]. Despite the effect of environment on the concentration of extractives, some families including A2, A21 and F17 had similar values on the two sites.
Extractives in wood impart decay resistance. They also are however responsible for several issues related with the utilization of wood. For instance, extractives can contribute to the corrosion of metals in contact with wood, inhibit the setting of adhesives and finishes, as well as affect the swelling, shrinking, chemical treatability/permeability, light stability, and flammability of wood [37]. Furthermore, extractives cause various problems during papermaking [38].
Means for the lignin content of the loblolly pine families ranged from a low of 28.7% for F23 to 32.6% for A26, both on the Georgia site. Generally, trees growing on the Georgia site had a lower lignin content (Mean = 29.5%; SD = 0.56%) than those from the Florida site (Mean = 31.9%; SD = 0.53%). The range of lignin content predicted by NIR for the elite families is consistent with what has been reported in the literature as the natural variation of lignin in juvenile loblolly pine [39]. Cellulose content estimated for the elite families ranged from 36.7% to 42.0%. Even though cellulose content of the families falls within what has been reported in the literature, the range determined is narrower [23,39]. It also was noted that the NIR-estimated cellulose content of the juvenile loblolly pine families were higher (Mean = 39.3%; SD = 3.1%) than that measured for the commercially acquired southern pine samples (Mean = 37.0%; SD = 2.3%).
Although the family by site effect was significant, some families ranked similarly high or low on the two sites. Examples of such include A1, A15, A26 and A9 on the higher end; and A5, A33 and A34 on the lower end. The cellulose content of wood is highly correlated to pulp yield. Material with a higher percentage of cellulose would increase the efficiency of pulp and paper mills and reduce associated pulping costs [40]. Furthermore, the amount of cellulose has close relationships with the density and strength of wood [41]. In agreement with literature, elite loblolly pine families that had higher percentages of cellulose were also determined to have higher density, modulus of rupture (ultimate strength) and modulus of elasticity (stiffness) values in another study [15].
For the hemicelluloses, the highest value of 21.2% was determined for A15 on the Florida site, and the lowest value of 19.8% was determined for A26 on the Georgia site. No statistical differences were determined among the hemicelluloses content of the elite loblolly pine families on the Florida site. Meanwhile, on the Georgia site, only A10 differed significantly from A26.
Percent glucose estimated was 42.2% to 47.8% for the families on the Florida site and 40.8% to 46.9% for families on the Georgia site. As expected, there was a strong correlation (r = 0.99) between the glucose and cellulose content of the loblolly pine families. For some families, high glucose content corresponded with high cellulose content. This was however not the case in other families, suggesting that more of the glucose was locked in the hemicelluloses, as was determined for A13. On the other hand, certain families although having a low glucose content nevertheless had relatively high cellulose content, indicating that more of the glucose was incorporated towards cellulose rather than hemicelluloses; as was noted in A1 and A2 on the Florida site.
Unlike for cellulose (p-value < 0.0001) and glucose (p-value = 0.001) contents, less variations were noted among the families with respect to the contents of lignin (p-value = 0.0186) and hemicelluloses content (p-value = 0.0773), Table 4. Similar results for 11-year old full-sib loblolly pine families have been reported [39]. The effect of site was generally more pronounced for the chemical traits of the loblolly pine families than genetics in this study. Furthermore, even though significant family × site interactions were determined for all the chemical traits, cellulose was relatively more stable (p-value = 0.0252) on the two sites, Table 4. This implies that families improved for cellulose could be deployed over wider locations in the region.

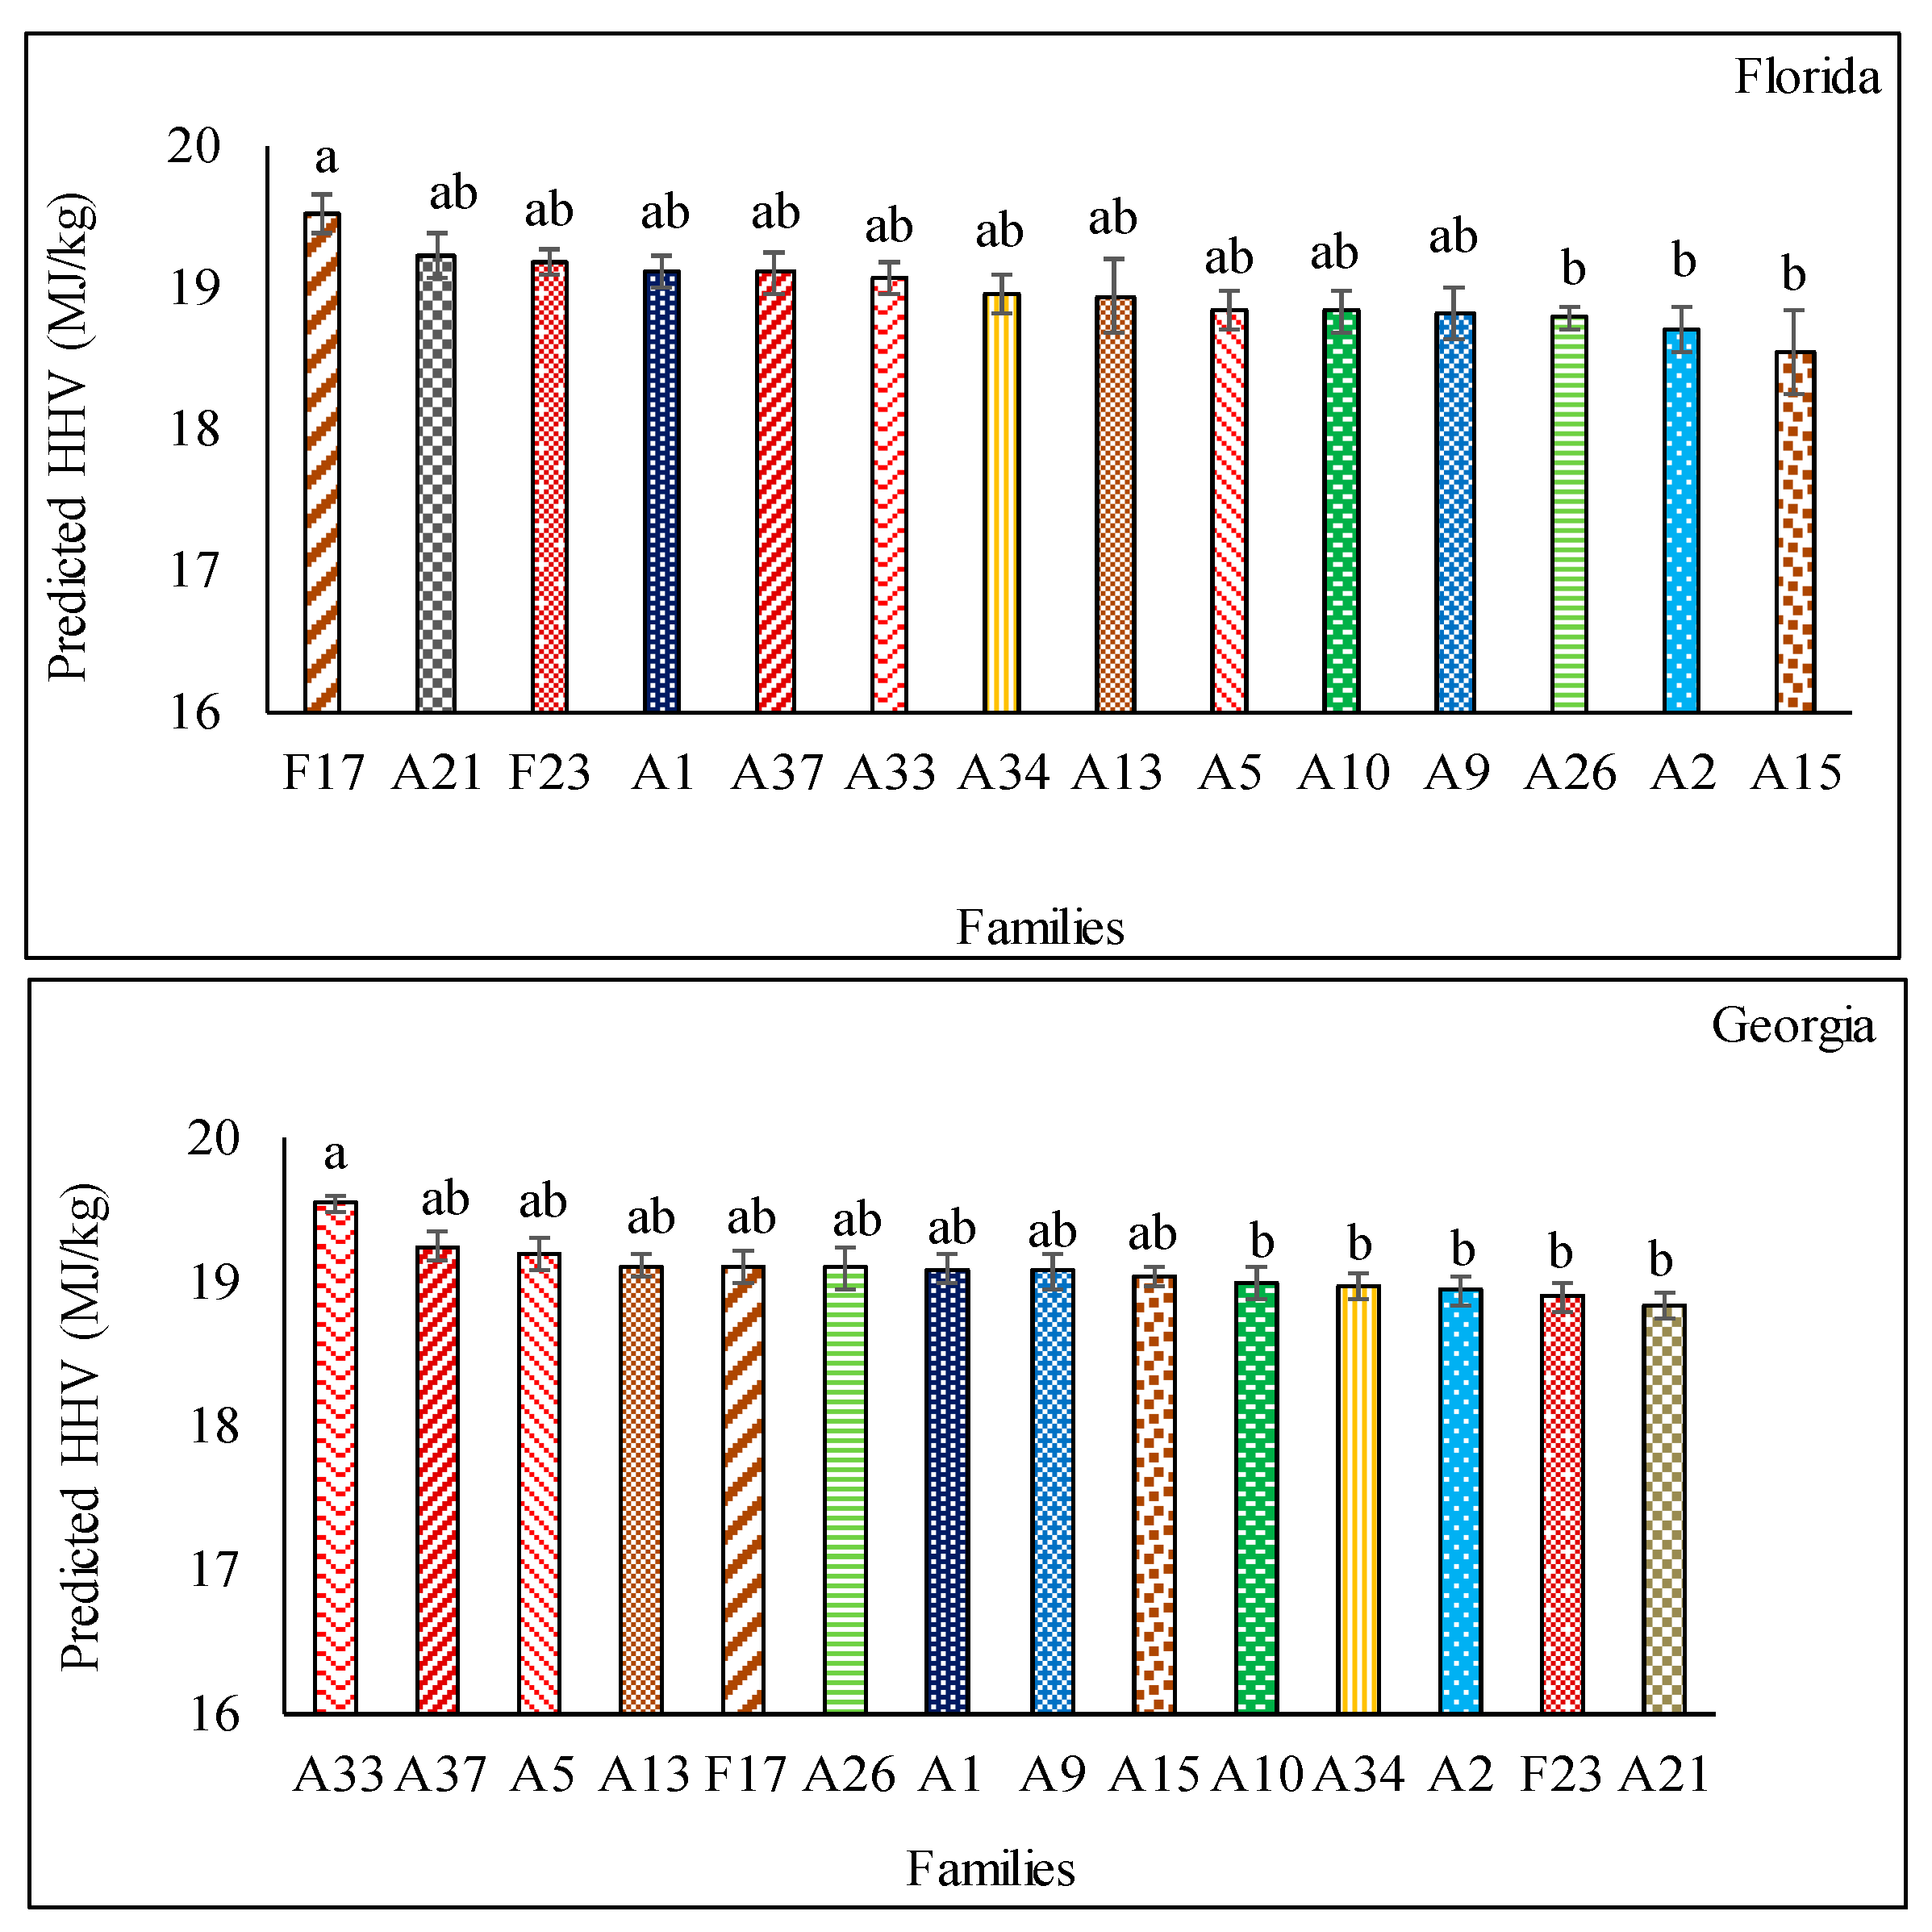
3.5. Prediction and Screening of the Elite Loblolly Pine Families for Bioenergy Potential

Two-way ANOVA results testing the effect of family, site and family × site interaction on proximate composition and energy content are summarized in Table 4. With the interaction term for all the understudied properties being significant, the loblolly pine families were separated based on the two sites for further analysis.
The mean volatile matter content for the families as estimated by NIR was highest for A34 (Mean = 85.7%; SD = 0.3) on the Florida site and lowest for A33 (Mean = 82.6%; SD = 1.5%), Figure 2. Meanwhile, the highest fixed carbon content was determined for A33 to be 17.1% (SD = 1.1%) on the Georgia site, whereas A37 on the Florida site had the lowest of 13.6 (SD = 0.3%), Figure 3.
Relatively smaller within-family variations in the volatile matter and fixed carbon contents of trees on the Florida site resulted in more significant differences between the families. The amount of volatile matter was consistently high on both sites for F17, F23 and A37; while that of A15 remained low on the two sites. During pyrolysis and gasification, the families with higher concentrations of volatile matter will produce relatively more bio-oil and syngas and lesser amounts of char [24,42]. The trade-off between % volatile matter and % fixed carbon was evident in this study. For instance, on the Florida site, A34, F17 F23 and A37 all of which had high volatile matter contents also had consequently low fixed carbon contents. Similarly, when the volatile matter content was low, a high fixed carbon content resulted, as noted in A5, A2, A15, A10 and A21. A similar trend occurred among these proximate components for the loblolly pine families on the Georgia site.
The mean ash content estimated for the families on the Florida site was highest for A13 (Mean = 0.27%; SD = 0.06%) and lowest for A26 (Mean = 0.20%; SD = 0.04%). For the Georgia site, A33 and A10 contained the most and least amounts of ash respectively, Figure 4. The average ash content determined for families on the Florida site was significantly higher than what was determined for the families on the Georgia site (p-value < 0.0001); this could be attributed to potential soil contamination. The average dbh of trees on the Florida site was 19.2 cm (versus 15.6 cm on the Georgia site), as such bigger bolts were sometimes dragged during transportation from site to trucks. Even though the mean ash contents of the families were different on the Georgia site, none was statistically significant due to the relatively narrower range, coupled with large within-family variations. In spite of the significant effect of the family by site interaction, similar ash contents were determined for some families on the two forest sites.
Inherently, wood has very little ash compared to other plant parts of tree species, energy grasses and agricultural residues [18,24,43]. From Table 4, the effect of family on ash was not significant (p-value = 0.1107) whereas that of site was significant (p-value < 0.0001). Environmental factors that have been known to increase the ash content of lignocellulosic biomass include soil and fertilizer treatments [43], operational practices [24,44] and storage [45].
With respect to the calorific value, the range estimated for the elite families was from 18.5 MJ/kg to 19.5 MJ/kg, with a mean of 19.0 MJ/kg (SD = 0.21 MJ/kg). In spite of the positive interaction of family and site (p-value = 0.0007), the energy content determined for F17, A1, A37, and A33 were high on both sites, whereas that of A2 and A10 remained low on the two sites, Figure 5. The determined mean energy content of the loblolly pine families is consistent with what has been reported in the literature for loblolly pine [18,24] and hybrid poplar [46]; but the range is narrower than the 20.2 MJ/kg to 23.6 MJ/kg reported for Pinus palustris [13]. Such relatively small variation is to be expected as the energy content of wood from different tree species has been reported to vary by less than 15% [47].
NIR coupled with principal components analysis (PCA) enabled the modelling of relationships that have been reported in the literature to exist among chemical and thermochemical traits of wood and biomass; such as how extractives and lignin boost [13,48], but ash adversely affects the heating value [44], as can be seen in the PCA loadings plot, Figure 6. According to the plot, hemicelluloses, in addition to lignin have a positive correlation with ash. Similarly, there is an indication of a positive correlation between the cellulose/glucose content and volatile/liquid yields.
Although this did not hold in all cases, some families showed consistency with the literature. For example, on the Georgia site, Families A33, A37 and A5 which had relatively high percentages of extractives and lignin also had higher HHVs. Meanwhile, on the Florida site, A9 which had lower extractives and lignin together with high ash content had the lowest energy content among the families. It was also noted that families that had higher extractives content also generally had a higher energy content, compared to families that had higher lignin content. Similar results about the stronger correlation between extractives and energy content, but not very much so for lignin and energy content have been reported [13].
Reviewing the loadings plot, PC-1, which explained 53% of the variation in the model was dominated by glucose and cellulose, with extractives and lignin making the most contribution to PC-2. This corroborates earlier results where the genetic families showed larger variations in their cellulose and glucose contents (Table 4).

4. Conclusions

This study demonstrated that NIR spectroscopy can be employed as a high throughput technique to screen the genetic and environmental variation in wood traits of standing live trees. NIR-based PLS models were developed to rapidly predict the chemical composition, proximate composition and energy content of genetically superior loblolly pine families.
The genotype of the loblolly pine families affected the chemical, proximate, and energy traits studied. The genetic variation detected for cellulose was the largest (p-value < 0.0001). In addition, the family by site interaction was significant for all properties investigated, indicating the general instability of the elite families across different sites. Nevertheless, cellulose was the most stable across the two sites, suggesting that families improved for cellulose could be deployed over a wider of locations. Considering that cellulose content has strong correlations with other properties, selecting and breeding for cellulose could generate some gains. However, further studies with more sites will help elucidate the extent of the family by site interactions.
This knowledge is valuable to tree breeders in decisions to plant families with desired traits in certain environments. The methodology developed in this study can be directly applied to the other hundreds of loblolly pine families in tree improvement programs, and also leveraged towards other wood species. This will boost efforts that seek to make the right feedstock available to the conventional forest products industry as well as the emerging bioeconomy.

Author Contributions

Conceptualization, G.E.A., B.K.V. and L.G.E.; Formal analysis, G.E.A.; Funding acquisition, B.K.V., T.G. and L.G.E.; Investigation, G.E.A.; Methodology, G.E.A.; Resources, B.K.V., T.G., N.B., O.O.F. and L.G.E.; Supervision, B.K.V.; Writing—original draft, G.E.A.; Writing—review & editing, G.E.A., B.K.V., N.B., O.O.F. and L.G.E.

Acknowledgments

The authors are grateful for the financial support of the National Science Foundation-IGERT: Integrated Biorefining for Sustainable Production of Fuels and Chemicals (Grant number #: 1069004), the Forest Health Cooperative, Auburn University, the IGP- Good to Great Grant, Auburn University and Regions Bank. We also thank Rayonier, Plum Creek and West Fraser Inc. for providing the material used in this study.

Conflicts of Interest

The authors declare no conflict of interest.

References

  1. Wear, D.N.; Greis, J.G. Southern Forest Resource Assessment; Technical Report for US Department of Agriculture, Forest Service, Southern Research Station: Asheville, NC, USA, September 2002.
  2. Schultz, R.P. Loblolly Pine, the Ecology and Culture of Loblolly Pine (Pinus taeda L.); US Department of Agriculture, Forest Service, Southern Research Station: Asheville, NC, USA, 1997.
  3. Schultz, R.P. Loblolly—The pine for the 21st century. New For. 1999, 17, 71–88. [Google Scholar] [CrossRef]
  4. U.S. Department of Energy. Billion-Ton Report: Advancing Domestic Resources for a Thriving Bioeconomy, Volume 1: Economic Availability of Feedstocks; US Department of Energy, Oak Ridge National Laboratory: Oak Ridge, TN, USA, 2016.
  5. Jernigan, J.; Gallagher, T.; Mitchell, D.; Smidt, M.; Teeter, L. High Tonnage Harvesting and Skidding for Loblolly Pine Energy Plantations. For. Prod. J. 2016, 66, 185–191. [Google Scholar] [CrossRef]
  6. Scott, A.D.; Tiarks, A. Dual-cropping loblolly pine for biomass energy and conventional wood products. South J. Appl. For. 2008, 32, 33–37. [Google Scholar]
  7. Zalesny, R.S., Jr.; Cunningham, M.W.; Hall, R.B.; Mirck, J.; Rockwood, D.L.; Stanturf, J.A.; Volk, T.A. Woody Biomass from Short Rotation Energy Crops. In Sustainable Production of Fuels, Chemicals, and Fibers from Forest Biomass; Zhu, J.Y., Zhang, X., Pan, X., Eds.; ACS Symposium Series; American Chemical Society: Washington, DC, USA, 2011. [Google Scholar]
  8. Baker, J.B.; Langdon, O.G. Pinus taeda L.; Loblolly Pine. In Silvics of North America; Burns, R.M., Honkala, B.H., Eds.; United States Department of Agriculture: Washington, DC, USA, 1990. [Google Scholar]
  9. Mckendry, P. Energy production from biomass (part 1): Overview of biomass. Bioresour. Technol. 2002, 83, 37–46. [Google Scholar] [CrossRef]
  10. Basu, P. Biomass Gasification and Pyrolysis. Practical Design and Theory; Elsevier: New York, NY, USA, 2010. [Google Scholar]
  11. Sykes, R.; Li, B.; Hodge, G.; Goldfarb, B.; Kadla, J.; Chang, H.-M. Prediction of loblolly pine wood properties using transmittance near-infrared spectroscopy. Can. J. For. Res. 2005, 35, 2423–2431. [Google Scholar] [CrossRef] [Green Version]
  12. Nkansah, K.; Dawson-Andoh, B.; Slahor, J. Rapid characterization of biomass using near infrared spectroscopy coupled with multivariate data analysis: Part 1 yellow-poplar (Liriodendron tulipifera L.). Bioresour. Technol. 2010, 101, 4570–4576. [Google Scholar] [CrossRef] [PubMed]
  13. So, C.L.; Eberhardt, T.L. Chemical and calorific characterization of longleaf pine using near infrared spectroscopy. J. Near Infrared Spectrosc. 2010, 18, 417–423. [Google Scholar] [CrossRef]
  14. Fagan, C.C.; Everard, C.D.; McDonnell, K. Prediction of moisture, calorific value, ash and carbon content of two dedicated bioenergy crops using near-infrared spectroscopy. Bioresour. Technol. 2011, 102, 5200–5206. [Google Scholar] [CrossRef] [PubMed]
  15. Acquah, G.E.; Essien, C.; Via, B.K.; Billor, N.; Eckhardt, L.G. Estimating the basic density and mechanical properties of elite loblolly pine families with near infrared spectroscopy. For. Sci. 2018, 64, 149–158. [Google Scholar] [CrossRef]
  16. Sluiter, A.; Ruiz, R.; Scarlata, C.; Sluiter, J.; Templeton, D. Determination of Extractives in Biomass; Technical Report; Laboratory Analytical Procedure (LAP): Washington, DC, USA, January 2008.
  17. Sluiter, A.; Ruiz, R.; Scarlata, C.; Sluiter, J.; Templeton, D.; Crocker, D. Determination of Structural Carbohydrates and Lignin in Biomass; Technical Report; Laboratory Analytical Procedure (LAP): Washington, DC, USA, August 2012.
  18. Acquah, G.E.; Via, B.K.; Fasina, O.O.; Eckhardt, L.G. Nondestructive prediction of the properties of forest biomass for bioenergy, fuel and chemical applications using near infrared spectroscopy. J. Near Infrared Spectrosc. 2015, 23, 93–102. [Google Scholar] [CrossRef]
  19. European Committee for Standardization (CEN). Solid Biofuels—Method for the Determination of the Content of Volatile Matter; CEN/TS: 15148:2005: E; European Committee for Standardization (CEN): Brussels, Belgium, 10 March 2006. [Google Scholar]
  20. Sluiter, A.; Ruiz, R.; Scarlata, C.; Sluiter, J.; Templeton, D. Determination of Ash in Biomass; Technical Report; Laboratory Analytical Procedure (LAP): Washington, DC, USA, January 2008.
  21. ASTM International. Standard Test Method for Gross Calorific Value of Coal and Coke; ASTM D5865-13; ASTM International: West Conshohocken, PA, USA, 2013. [Google Scholar]
  22. Kelley, S.S.; Rials, T.G.; Snell, R.; Groom, L.H.; Sluiter, A. Use of near infrared spectroscopy to measure the chemical and mechanical properties of solid wood. Wood Sci. Technol. 2004, 38, 257–276. [Google Scholar] [CrossRef]
  23. Jones, P.D.; Schimleck, L.R.; Peter, G.F.; Daniels, R.F.; Clark, A., III. Non-destructive estimation of Pinus taeda L. tracheid morphological characteristics for samples from a wide range of sites in Georgia. Wood Sci. Technol. 2005, 39, 529–545. [Google Scholar] [CrossRef]
  24. Owen, K.; Fasina, O.; Taylor, S.; Adhikari, S. Thermal Decomposition Behavior of Loblolly Pine Stemwood, Bark, and Limbs/Foliage Using TGA and DSC Techniques. Tran. ASABE 2015, 58, 509–518. [Google Scholar]
  25. Gillon, D.; Hernando, C.; Valette, J.-C.; Joffre, R. Fast estimation of the calorific values of forest fuels by near-infrared reflectance spectroscopy. Can. J. For. Res. 1997, 27, 760–765. [Google Scholar] [CrossRef]
  26. Williams, P. Near Infrared Technology—Getting the Best Out of Light. A Short Course in the Practical Implementation of near Infrared Spectroscopy for the User; PDK Grain: Nanaimo, BC, Canada, 2004. [Google Scholar]
  27. Sanderson, M.A.; Agblevor, F.; Collins, M.; Johnson, D.K. Compositional analysis of biomass feedstocks by near infrared reflectance spectroscopy. Biomass Bioenergy 1996, 11, 365–370. [Google Scholar] [CrossRef]
  28. Via, B. Characterization and evaluation of wood strand composite load capacity with near infrared spectroscopy. Mater. Struct. 2013, 46, 1801–1810. [Google Scholar] [CrossRef]
  29. Hein, P.R.G.; Campos, A.C.M.; Trugilho, P.F.; Lima, J.T.; Chaix, G. Infrared spectroscopy for estimating wood basic density in Eucalyptus urophylla and Eucalyptus garndis. Cerne Lavras. 2009, 15, 133–144. [Google Scholar]
  30. Lestander, T.A.; Rhen, C. Multivariate NIR spectroscopy models for moisture, ash and calorific content in biofuels using bi-orthogonal partial least squares regression. Analyst 2005, 130, 1182–1189. [Google Scholar] [CrossRef] [PubMed]
  31. Workman, J.J., Jr. NIR spectroscopy calibration basics. Data analysis: Calibration of NIR instruments by PLS regression. In Handbook of Near-Infrared Analysis, 3rd ed.; Burns, D.A., Ciurczak, E.W., Eds.; CRC Press: Boca Raton, FL, USA, 2011. [Google Scholar]
  32. Zobel, B.J.; van Buijtenen, J.P. Wood Variation: Its Causes and Control; Springer: New York, NY, USA, 1989. [Google Scholar]
  33. Shupe, T.F.; Hse, C.H.; Choong, E.T.; Groom, L.H. Differences in some chemical properties of innerwood and outerwood from five silviculturally different loblolly. Wood Fiber Sci. 1997, 29, 91–97. [Google Scholar]
  34. Via, B.K.; So, C.L.; Groom, L.H.; Shupe, T.F.; Stine, M.; Wikaira, J. Within tree variation of lignin, extractives, and microfibril angle coupled with the theoretical and near infrared modeling of microfibril angle. IAWA J. 2007, 28, 189–209. [Google Scholar] [CrossRef]
  35. Eckhardt, L.G.; Menard, R.D.; Gray, E.D. Effects of oleoresins and monoterpenes on in vitro growth of fungi associated with pine decline in the Southern United States. For. Pathol. 2009, 39, 157–167. [Google Scholar] [CrossRef] [Green Version]
  36. Pettersen, R.C. The chemical composition of wood. In The Chemistry of Solid Wood; Rowell, R.M., Ed.; ACS Advances in Chemistry: Washington, DC, USA, 1984. [Google Scholar]
  37. Larson, P.R.; Kretschmann, D.E.; Clark, A., III; Isebrands, J.G. Formation and Properties of Juvenile Wood in Southern Pines: A Synopsis; Technical Report; US Department of Agriculture, Forest Service, Forest Products Laboratory: Madison, WI, USA, September 2001.
  38. Sithole, B.B.; Allen, L. The effects of wood extractives on system closure. Tappsa J. 2002, 105, 22–30. [Google Scholar]
  39. Sykes, R.; Isik, F.; Li, B.; Kadla, J.; Chang, H.-M. Genetic variation of juvenile wood properties in a loblolly pine progeny test. Tappi J. 2003, 2, 3–8. [Google Scholar]
  40. Kube, P.; Raymond, C. Prediction of whole-tree basic density and pulp yield using wood core samples in Euclalyptus nitens. Appita 2002, 55, 43–48. [Google Scholar]
  41. Haygreen, J.G.; Bowyer, J.L. Forest Products and Wood Science, 2nd ed.; Iowa State University Press: Ames, IA, USA, 1989. [Google Scholar]
  42. Acquah, G.E.; Via, B.K.; Fasina, O.O.; Adhikari, S.; Billor, N.; Eckhardt, L.G. Chemometric modeling of thermogravimetric data for the compositional analysis of biomass. PLoS ONE 2017, 12, e0172999. [Google Scholar] [CrossRef] [PubMed]
  43. Allison, G.G.; Morris, C.; Hodgson, E.; Jones, J.; Kubacki, M.; Barraclough, T.; Yates, N.; Shield, I.; Bridgwater, A.V.; Donnison, I.S. Measurement of key compositional parameters in two species of energy grass by Fourier transform infrared spectroscopy. Bioresour. Technol. 2009, 100, 6428–6433. [Google Scholar] [CrossRef] [PubMed]
  44. Acquah, G.E.; Krigstin, S.; Wetzel, S.; Cooper, P.; Cormier, D. Heterogeneity of forest harvest residue from eastern Ontario biomass harvests. For. Prod. J. 2016, 66, 164–175. [Google Scholar] [CrossRef]
  45. White, M.S.; Argent, R.M.; Sarles, R.L. Effects of outside storage on the energy potential of hardwood particulate fuels: Part III. Specific gravity, ash content, and pH of water solubles. For. Prod. J. 1986, 36, 69–73. [Google Scholar]
  46. Maranan, M.C.; Laborie, M.P.G. Analysis of energy traits of Populous spp. Clones by near-infrared spectroscopy. J. Biobased Mater. Bioenergy 2007, 1, 155–162. [Google Scholar]
  47. Senelwa, K.; Sims, R.E. Fuel characteristics of short rotation forest biomass. Biomass Bioenergy 1999, 17, 127–140. [Google Scholar] [CrossRef]
  48. Acquah, G.E.; Via, B.K.; Fasina, O.O.; Eckhardt, L.G. Rapid quantitative analysis of forest biomass using Fourier transform infrared spectroscopy (FTIR) and partial least squares (PLS) regression. J. Anal. Methods Chem. 2016, 2016. [Google Scholar] [CrossRef] [PubMed]
Figure 1. Scores plot of first two principal components.
Forests 09 00418 g001
Figure 2. Rank of loblolly pine families for volatile matter content. * Bars with different letters are significantly different at 95% confidence level (Tukey’s HSD Test).
Forests 09 00418 g002
Figure 3. Rank of loblolly pine families for fixed carbon content. * Bars with different letters are significantly different at 95% confidence level (Tukey’s HSD Test).
Forests 09 00418 g003
Figure 4. Rank of loblolly pine families for ash content. * Bars with different letters are significantly different at 95% confidence level (Tukey’s HSD Test).
Forests 09 00418 g004
Figure 5. Rank of loblolly pine families for energy content. * Bars with different letters are significantly different at 95% confidence level (Tukey’s HSD Test).
Forests 09 00418 g005
Figure 6. Loadings plot of the first two principal components.
Forests 09 00418 g006
Table 1. Descriptive statistics of the chemical composition of southern pine wood.
% Extractives% Lignin% Cellulose% Glucose% Hemicelluloses
Calibration set
(n = 190)
Mean3.0131.2937.3540.4322.71
SD1.571.532.973.101.60
Min0.3726.7230.4233.3319.01
Max9.4434.7047.1650.1625.85
Test set
(n = 60)
Mean3.2032.4736.7339.8623.39
SD1.641.392.732.971.36
Min0.7429.7929.3631.4820.13
Max7.6134.9641.9045.7825.79
Total set
(n = 250)
Mean3.0631.5637.2040.2922.88
SD1.591.572.923.071.57
Min0.3726.7229.3631.4819.01
Max9.4434.9647.1650.1625.85
Loblolly pine families
(n = 180)
Mean2.7731.7437.2640.3923.13
SD1.271.523.133.261.50
Min0.3727.1129.3631.4819.43
Max7.6134.9647.1650.1625.85
Commercial lumber
(n = 70)
Mean3.8031.1137.0440.0322.21
SD2.031.642.322.511.56
Min0.3826.7230.4233.3319.01
Max9.4434.3342.7646.3024.73
Table 2. Descriptive statistics of the proximate composition and energy content of southern pine wood.
% Volatile Matter% Fixed Carbon% AshHHV (MJ/kg)
Calibration set
(n = 190)
Mean83.6316.120.2517.84
SD1.141.150.090.46
Min80.8612.620.1417.02
Max87.0518.840.5919.26
Test set
(n = 60)
Mean83.2716.480.2518.10
SD1.211.200.100.90
Min81.3112.720.1517.01
Max86.9318.320.5422.65
Total set
(n = 250)
Mean83.5516.210.2517.90
SD1.171.170.090.60
Min80.8612.620.1417.01
Max87.0518.840.5922.65
Loblolly pine families
(n = 180)
Mean83.4316.320.2617.88
SD1.171.180.100.66
Min80.8612.720.1417.01
Max86.9318.840.5922.65
Commercial lumber
(n = 70)
Mean83.8515.920.2217.96
SD1.101.100.070.42
Min81.4812.620.1417.22
Max87.0518.320.4319.26
Table 3. Calibration and prediction statistics of NIR-based Partial Least Squares regression (PLS) models for chemistry and bioenergy.
PropertyLVsSECSECVR2cvRPDSEPR2iv
% Extractives40.660.760.772.071.290.43
% Lignin40.780.890.781.731.410.23
% Glucose51.151.250.842.482.460.47
% Cellulose51.11.20.842.472.280.46
% Hemicelluloses40.871.010.731.581.720.04
% Volatile matter50.370.40.882.230.950.09
% Fixed carbon30.550.680.651.680.650.1
% Ash30.040.060.581.540.080.2
HHV (MJ/kg)40.20.220.832.040.320.44
Note: Subscript cv means cross-validation; iv means independent validation.
Table 4. ANOVA p-values per treatment for the chemical, proximate and energy contents.
PropertyFamilySiteFamily × Site
% Extractives0.0077<0.00010.0435
% Lignin0.0186<0.0001<0.0001
% Cellulose<0.00010.00010.0252
% Glucose0.0010.0327<0.0001
% Hemicelluloses0.0773<0.00010.0356
% Volatile matter<00010.4749<0001
% Fixed carbon 0.00290.7237<0001
% Ash0.1107<0.00010.0009
HHV (MJ/kg)0.00020.01660.0007
Table 5. Chemical traits of elite loblolly pine families on the Florida site.
FamilyN% Extractives% Lignin% Glucose% Cellulose% Hemicelluloses
A1144.34 (1.45)32.07 (0.92)42.66 (2.05)40.34 (2.16)20.50 (0.66)
A2105.02 (1.84)32.36 (1.23)42.61 (1.37)39.57 (2.26)20.71 (1.17)
A5114.60 (1.27)32.00 (0.90)42.22 (1.60)37.05 (1.51)20.66 (0.81)
A9104.30 (1.12)31.61 (1.18)42.38 (1.89)39.70 (1.75)20.99 (0.43)
A10123.81 (1.20)32.01 (1.23)45.90 (2.79)39.67 (2.31)21.14 (0.60)
A1374.94 (1.98)32.22 (1.51)47.83 (5.24)38.61 (4.00)21.12 (0.76)
A1584.18 (1.05)31.40 (0.61)45.86 (2.99)39.97 (2.81)21.20 (1.20)
A21124.69 (1.33)31.63 (0.87)44.60 (2.69)38.89 (2.40)21.01 (0.90)
A26124.03 (1.03)32.61 (0.95)43.23 (1.59)39.90 (1.92)21.18 (0.67)
A33134.33 (1.16)32.04 (0.89)43.77 (2.28)38.27 (1.97)20.62 (0.78)
A34104.71 (1.22)31.68 (0.70)44.63 (2.48)38.89 (2.11)20.56 (0.71)
A37125.25 (0.73)30.51 (0.93)45.84 (1.71)39.88 (1.40)20.40 (0.47)
F17136.69 (0.87)32.48 (0.65)45.17 (2.38)39.29 (2.10)20.74 (0.80)
F23124.70 (1.42)31.75 (75)43.43 (2.58)37.32 (2.42)21.10 (0.91)
Table 6. Chemical traits of elite loblolly pine families on the Georgia site.
FamilyN% Extractives% Lignin% Glucose% Cellulose% Hemicelluloses
A1156.33 (1.76)28.98 (1.27)46.92 (3.58)41.97 (3.13)19.93 (0.25)
A2144.41 (1.94)29.21 (0.77)46.79 (1.30)41.86 (1.44)20.09 (0.38)
A5136.67 (2.12)29.90 (1.45)43.73 (3.86)38.94 (3.09)20.22 (0.26)
A9146.65 (2.04)29.14 (1.16)45.64 (3.53)40.65 (3.00)20.24 (0.48)
A10146.38 (2.63)29.38 (1.35)44.09 (3.42)39.23 (2.79)20.33 (0.43)
A13146.86 (1.62)29.55 (1.23)45.42 (3.29)40.49 (2.68)20.13 (0.19)
A15125.98 (2.35)29.10 (1.07)46.01 (3.91)41.02 (3.52)20.13 (0.41)
A21154.34 (2.50)29.60 (1.51)45.03 (3.70)40.29 (3.16)20.15 (0.33)
A26156.57 (2.24)28.97 (1.13)46.13 (4.13)41.48 (3.97)19.79 (0.54)
A33136.94 (1.57)30.82 (0.82)40.80 (2.71)36.69 (2.20)20.10 (0.12)
A34145.97 (2.24)29.74 (1.48)44.58 (4.42)39.98 (3.99)20.12 (0.48)
A37157.36 (2.20)30.16 (1.25)43.57 (3.49)38.96 (2.92)20.17 (0.24)
F17136.83 (1.76)29.21 (1.64)44.62 (4.07)39.83 (3.39)20.14 (0.40)
F23146.24 (1.74)28.69 (0.88)46.82 (2.38)41.82 (2.28)19.93 (0.36)

