Sustainability of Forest Cover under Climate Change on the Temperate-Continental Xeric Limits

 ,
,
Abstract
:1. Introduction: Contrasting Opinions on Climate Impacts in Forests
2. Aims and Outlines of the Study
- Identifying the extent of recent and expected changes of main abiotic site factors (climate, hydrology, soil) on fine scale, i.e., on stand level
- Analyzing recent and projected growth and health responses of forest tree species related to site condition changes (based on available forest databases and observations), in order to achieve better projections of site potential on stand level and to support adaptive forest management
- Envisaging their effect on future forest management and sustainability
3. Recent and Projected Changes of Forest Site Potential in Hungary
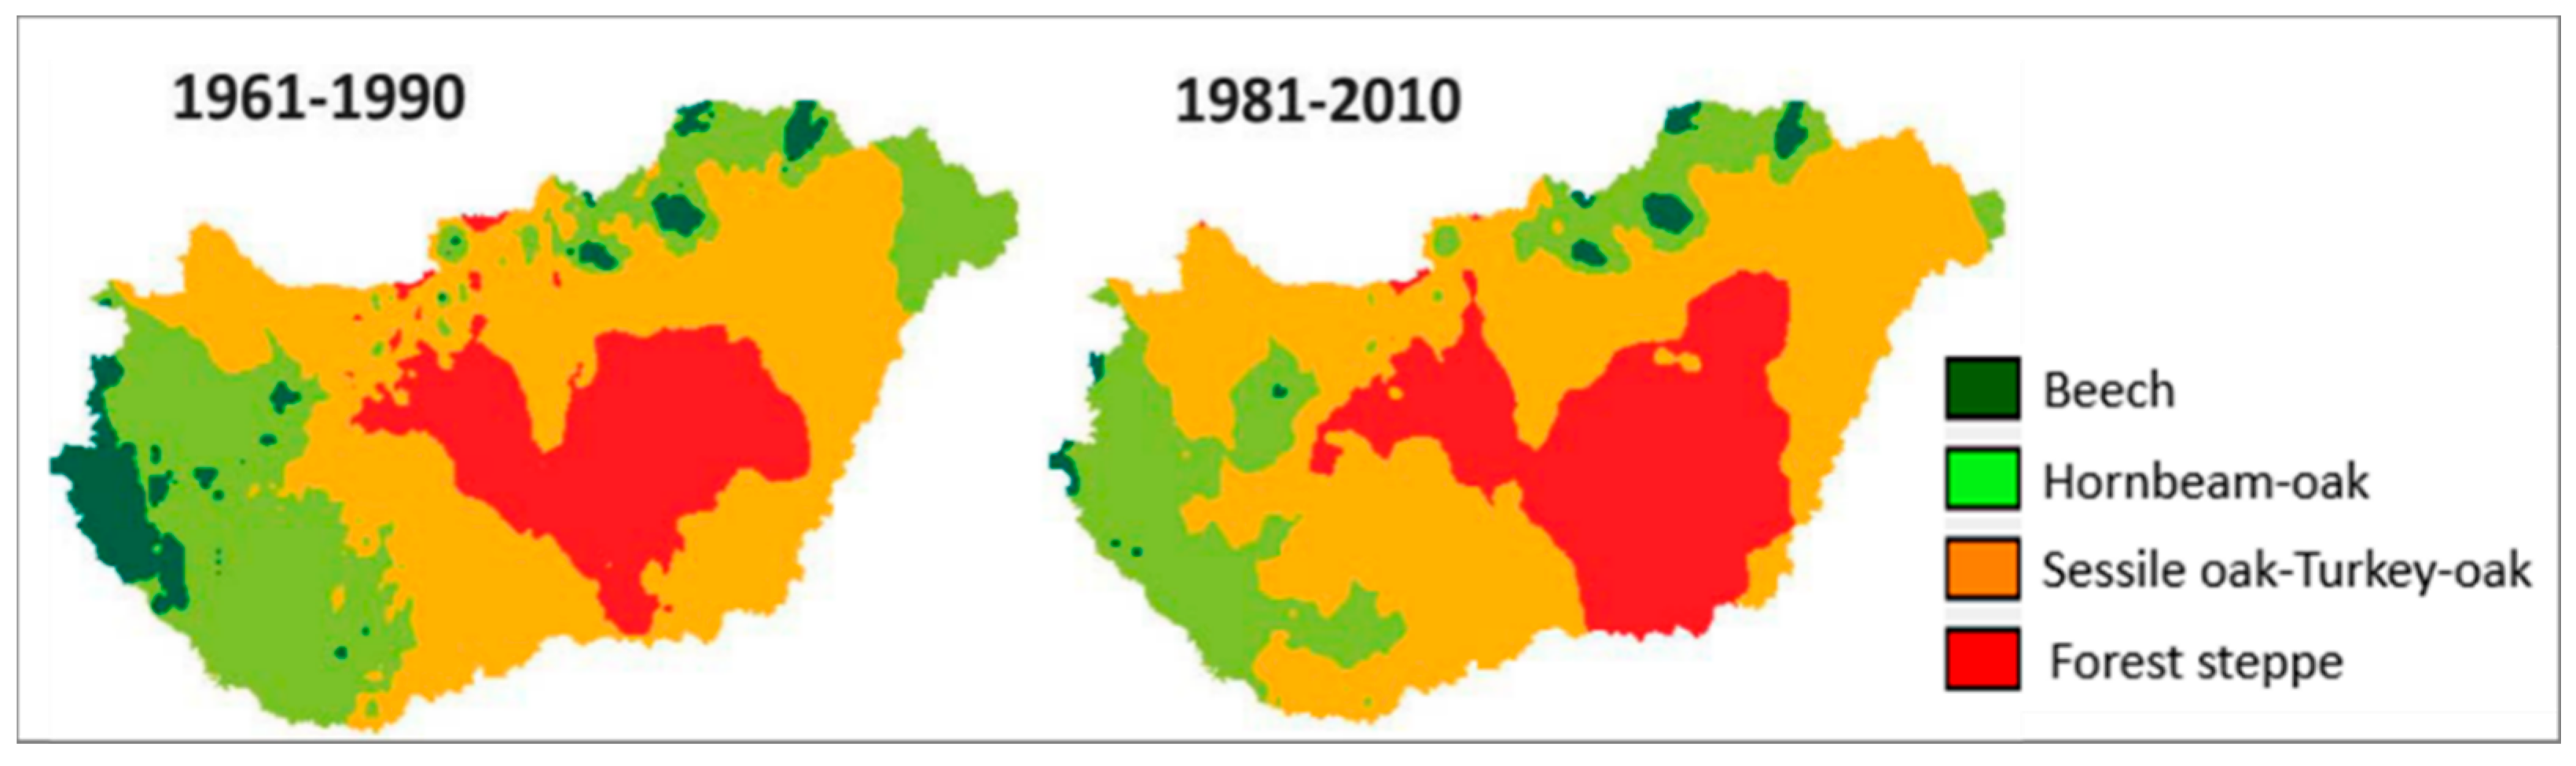
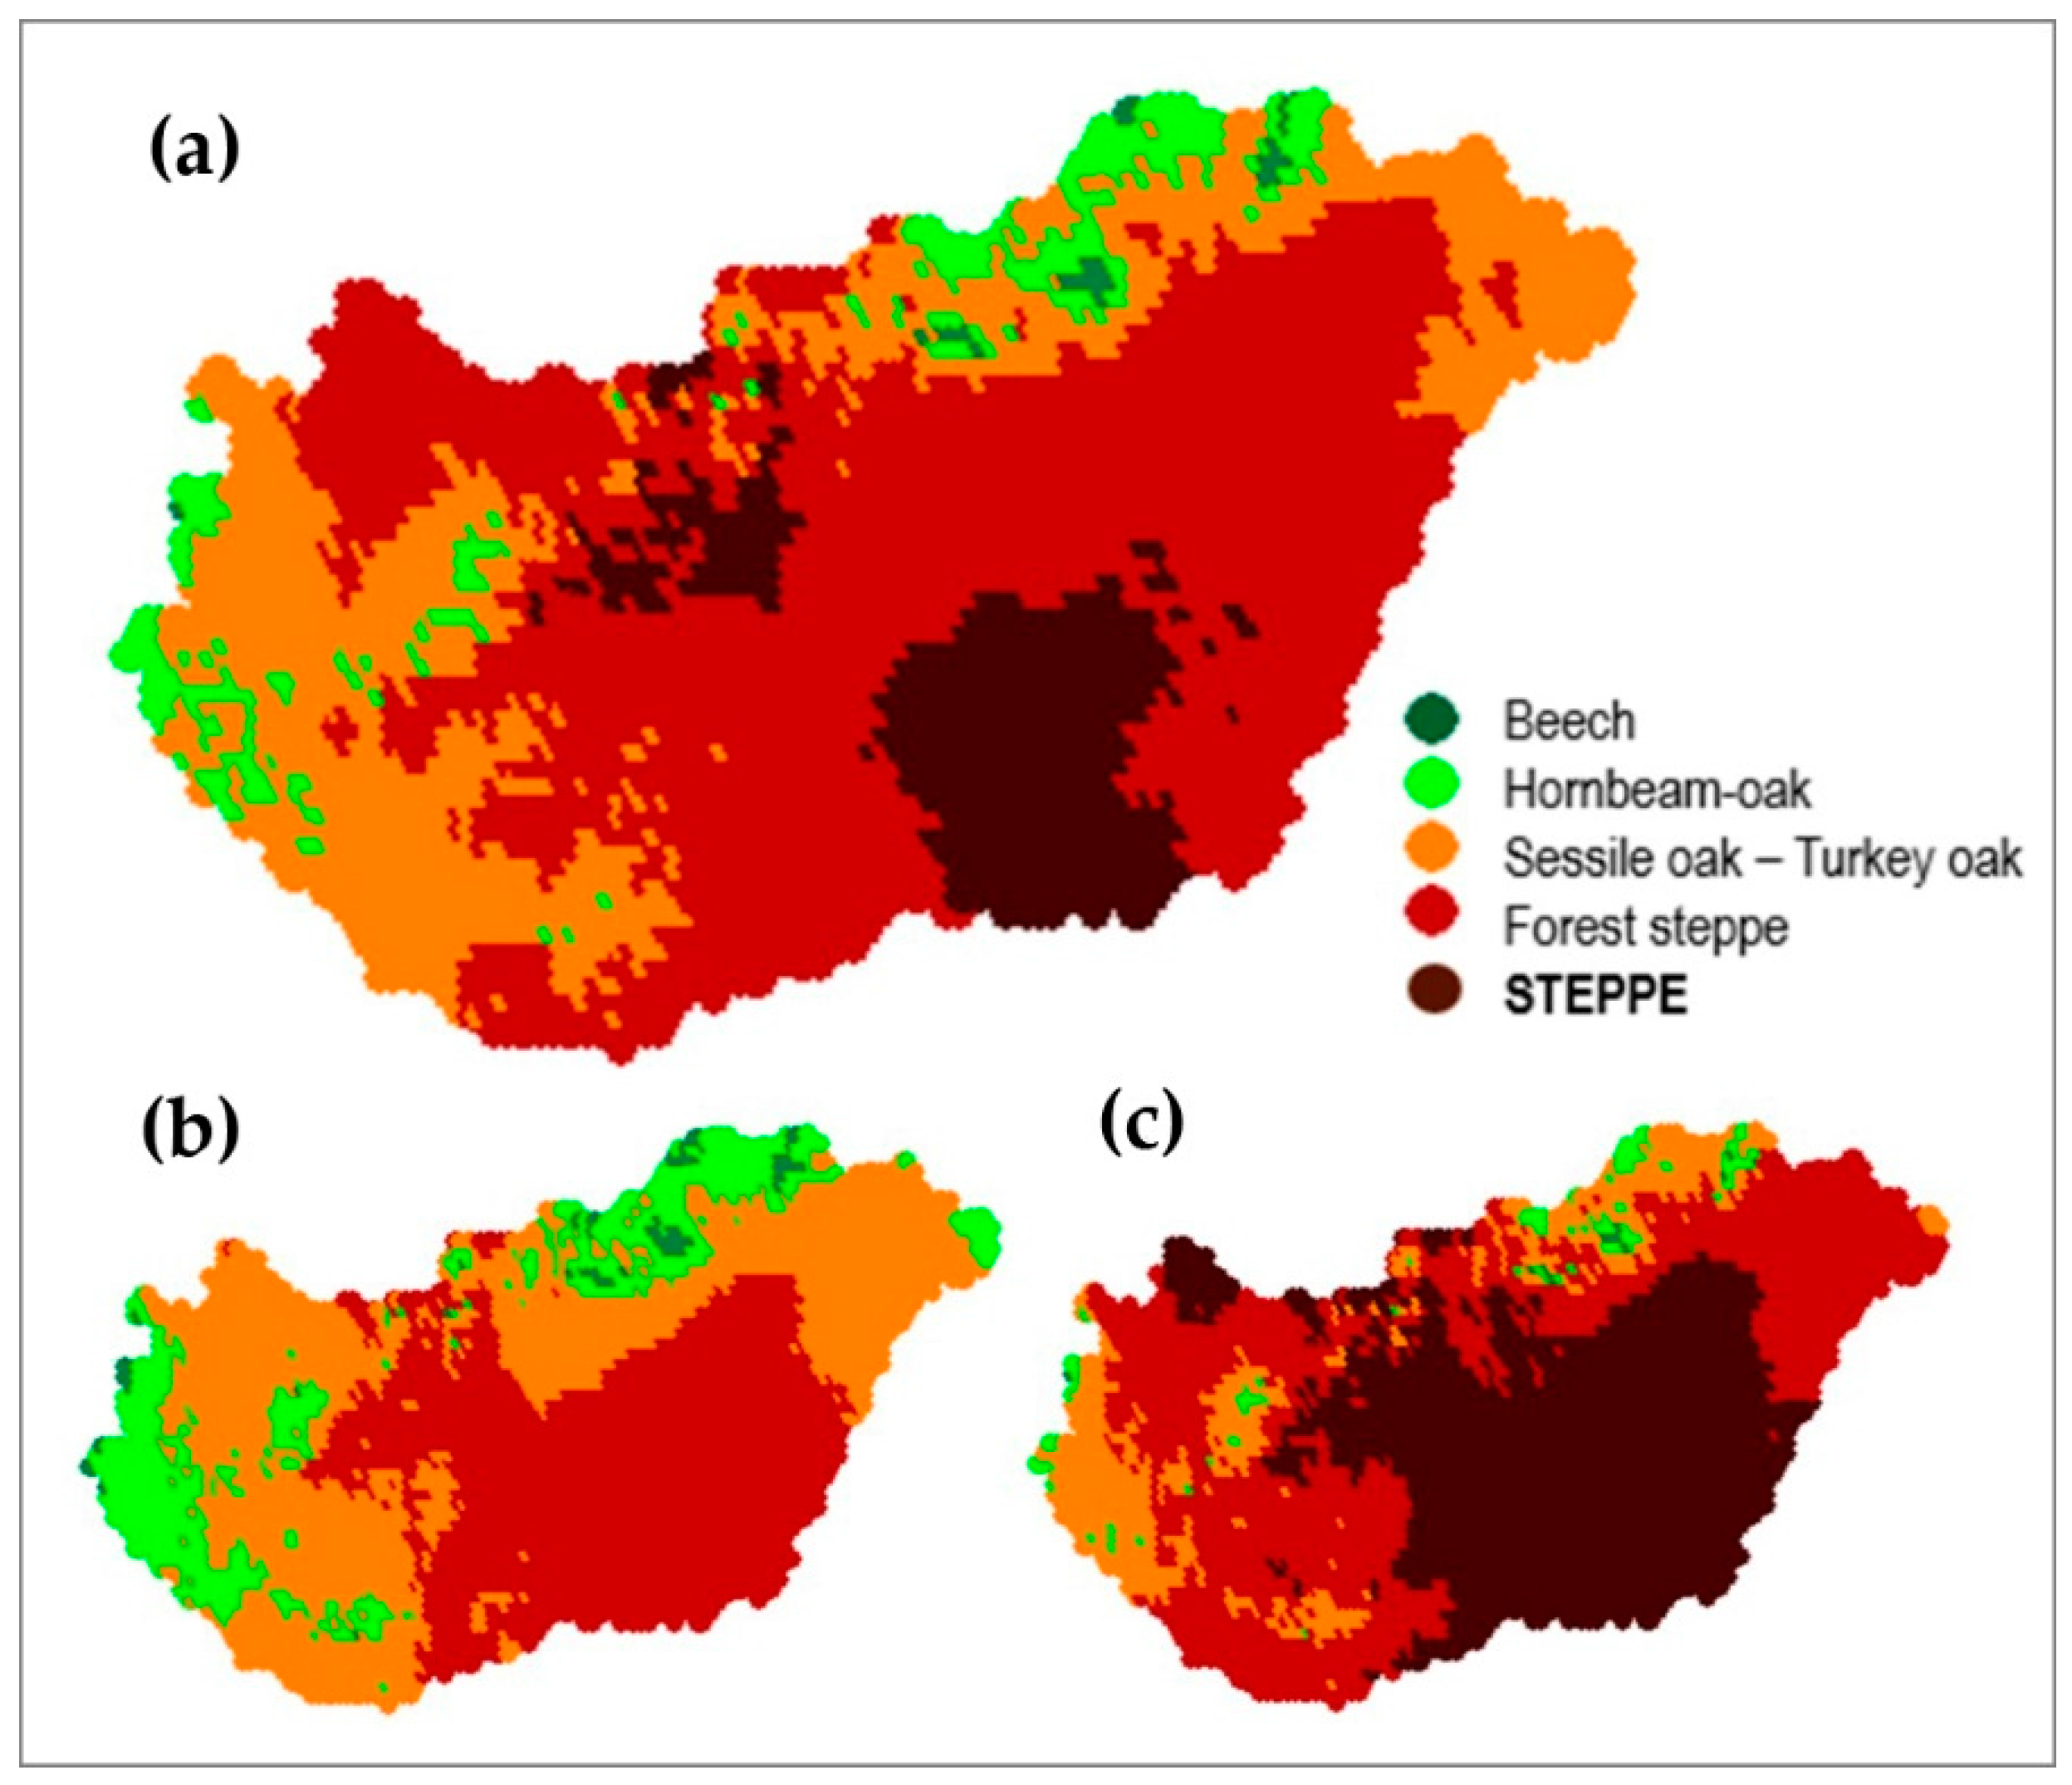
3.1. Changes of Climate in the Recent Past and Projections for the Future (E. Führer–B. Gálos)
3.2. Role of Hydrologic Conditions and Their Changes under Shifting Climate Factors (Z. Gribovszki)
3.3. Changes in Soil Conditions (A. Bidló)
4. Observations of Yield Potential, Vitality and Health Condition Change of Forests
4.1. Negative Health Trends in the Hungarian Forests Triggered by Climate Change (G. Csóka–A. Hirka)
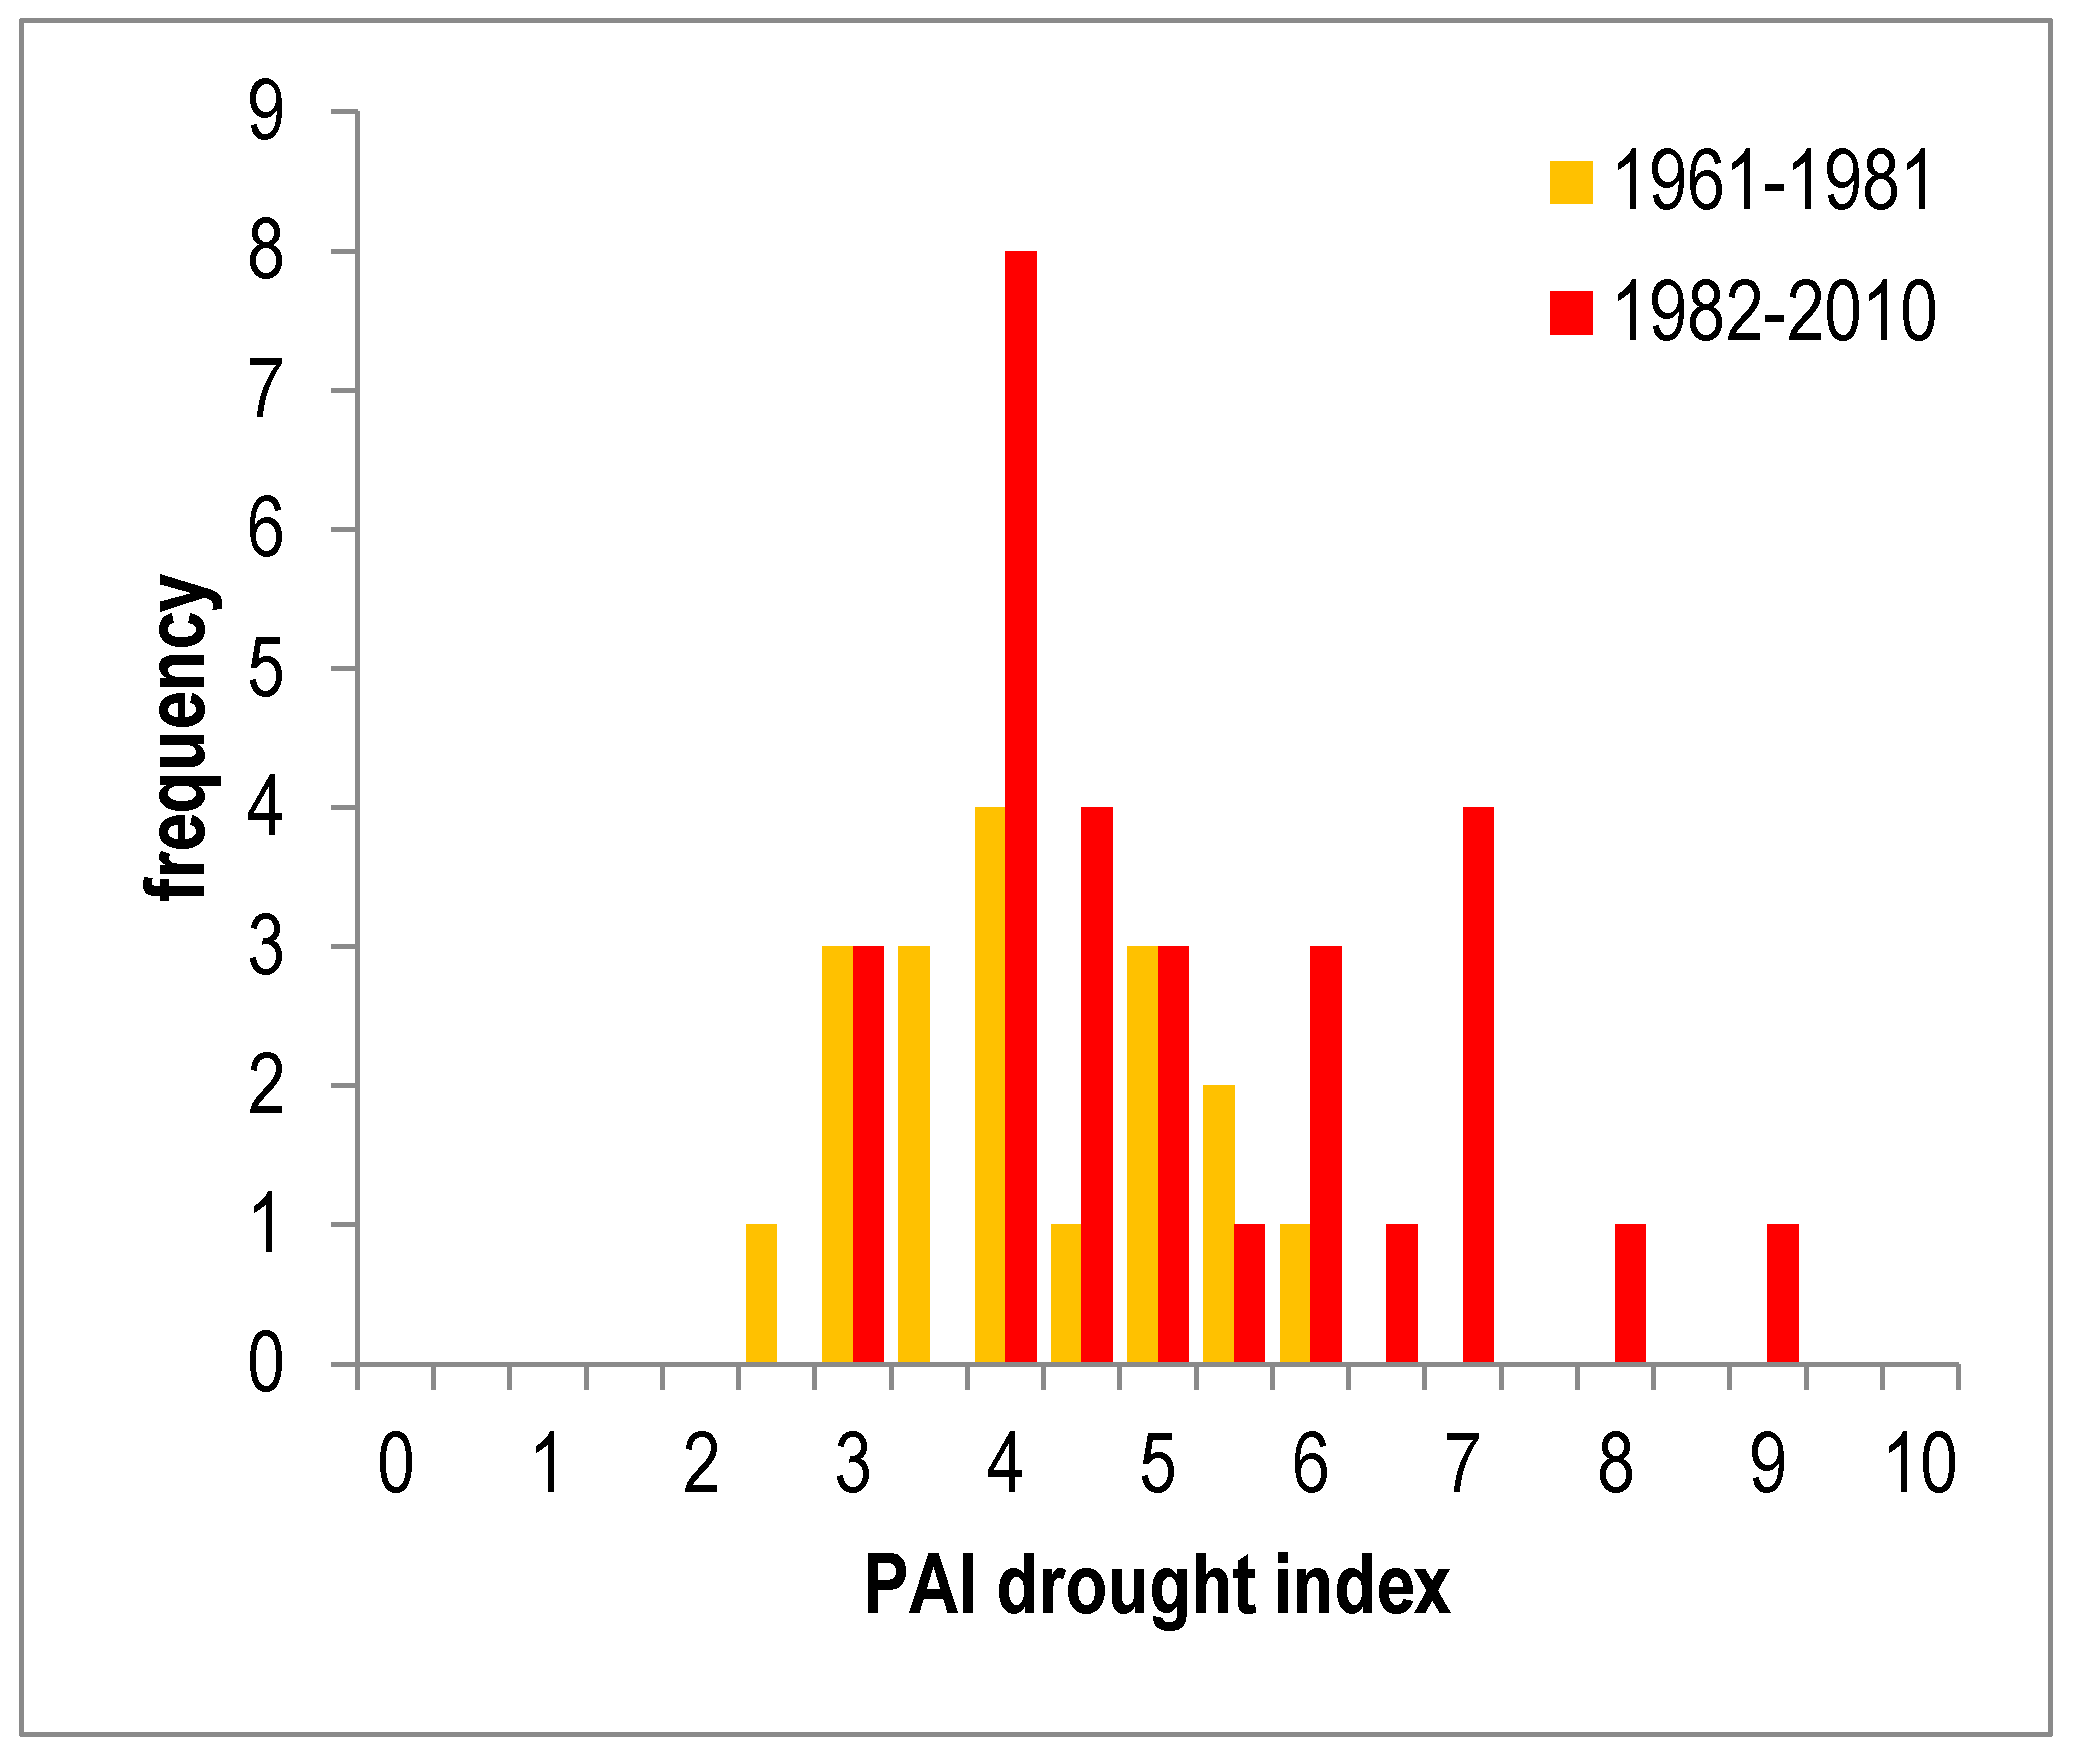
4.1.1. Abiotic Damages (Droughts)
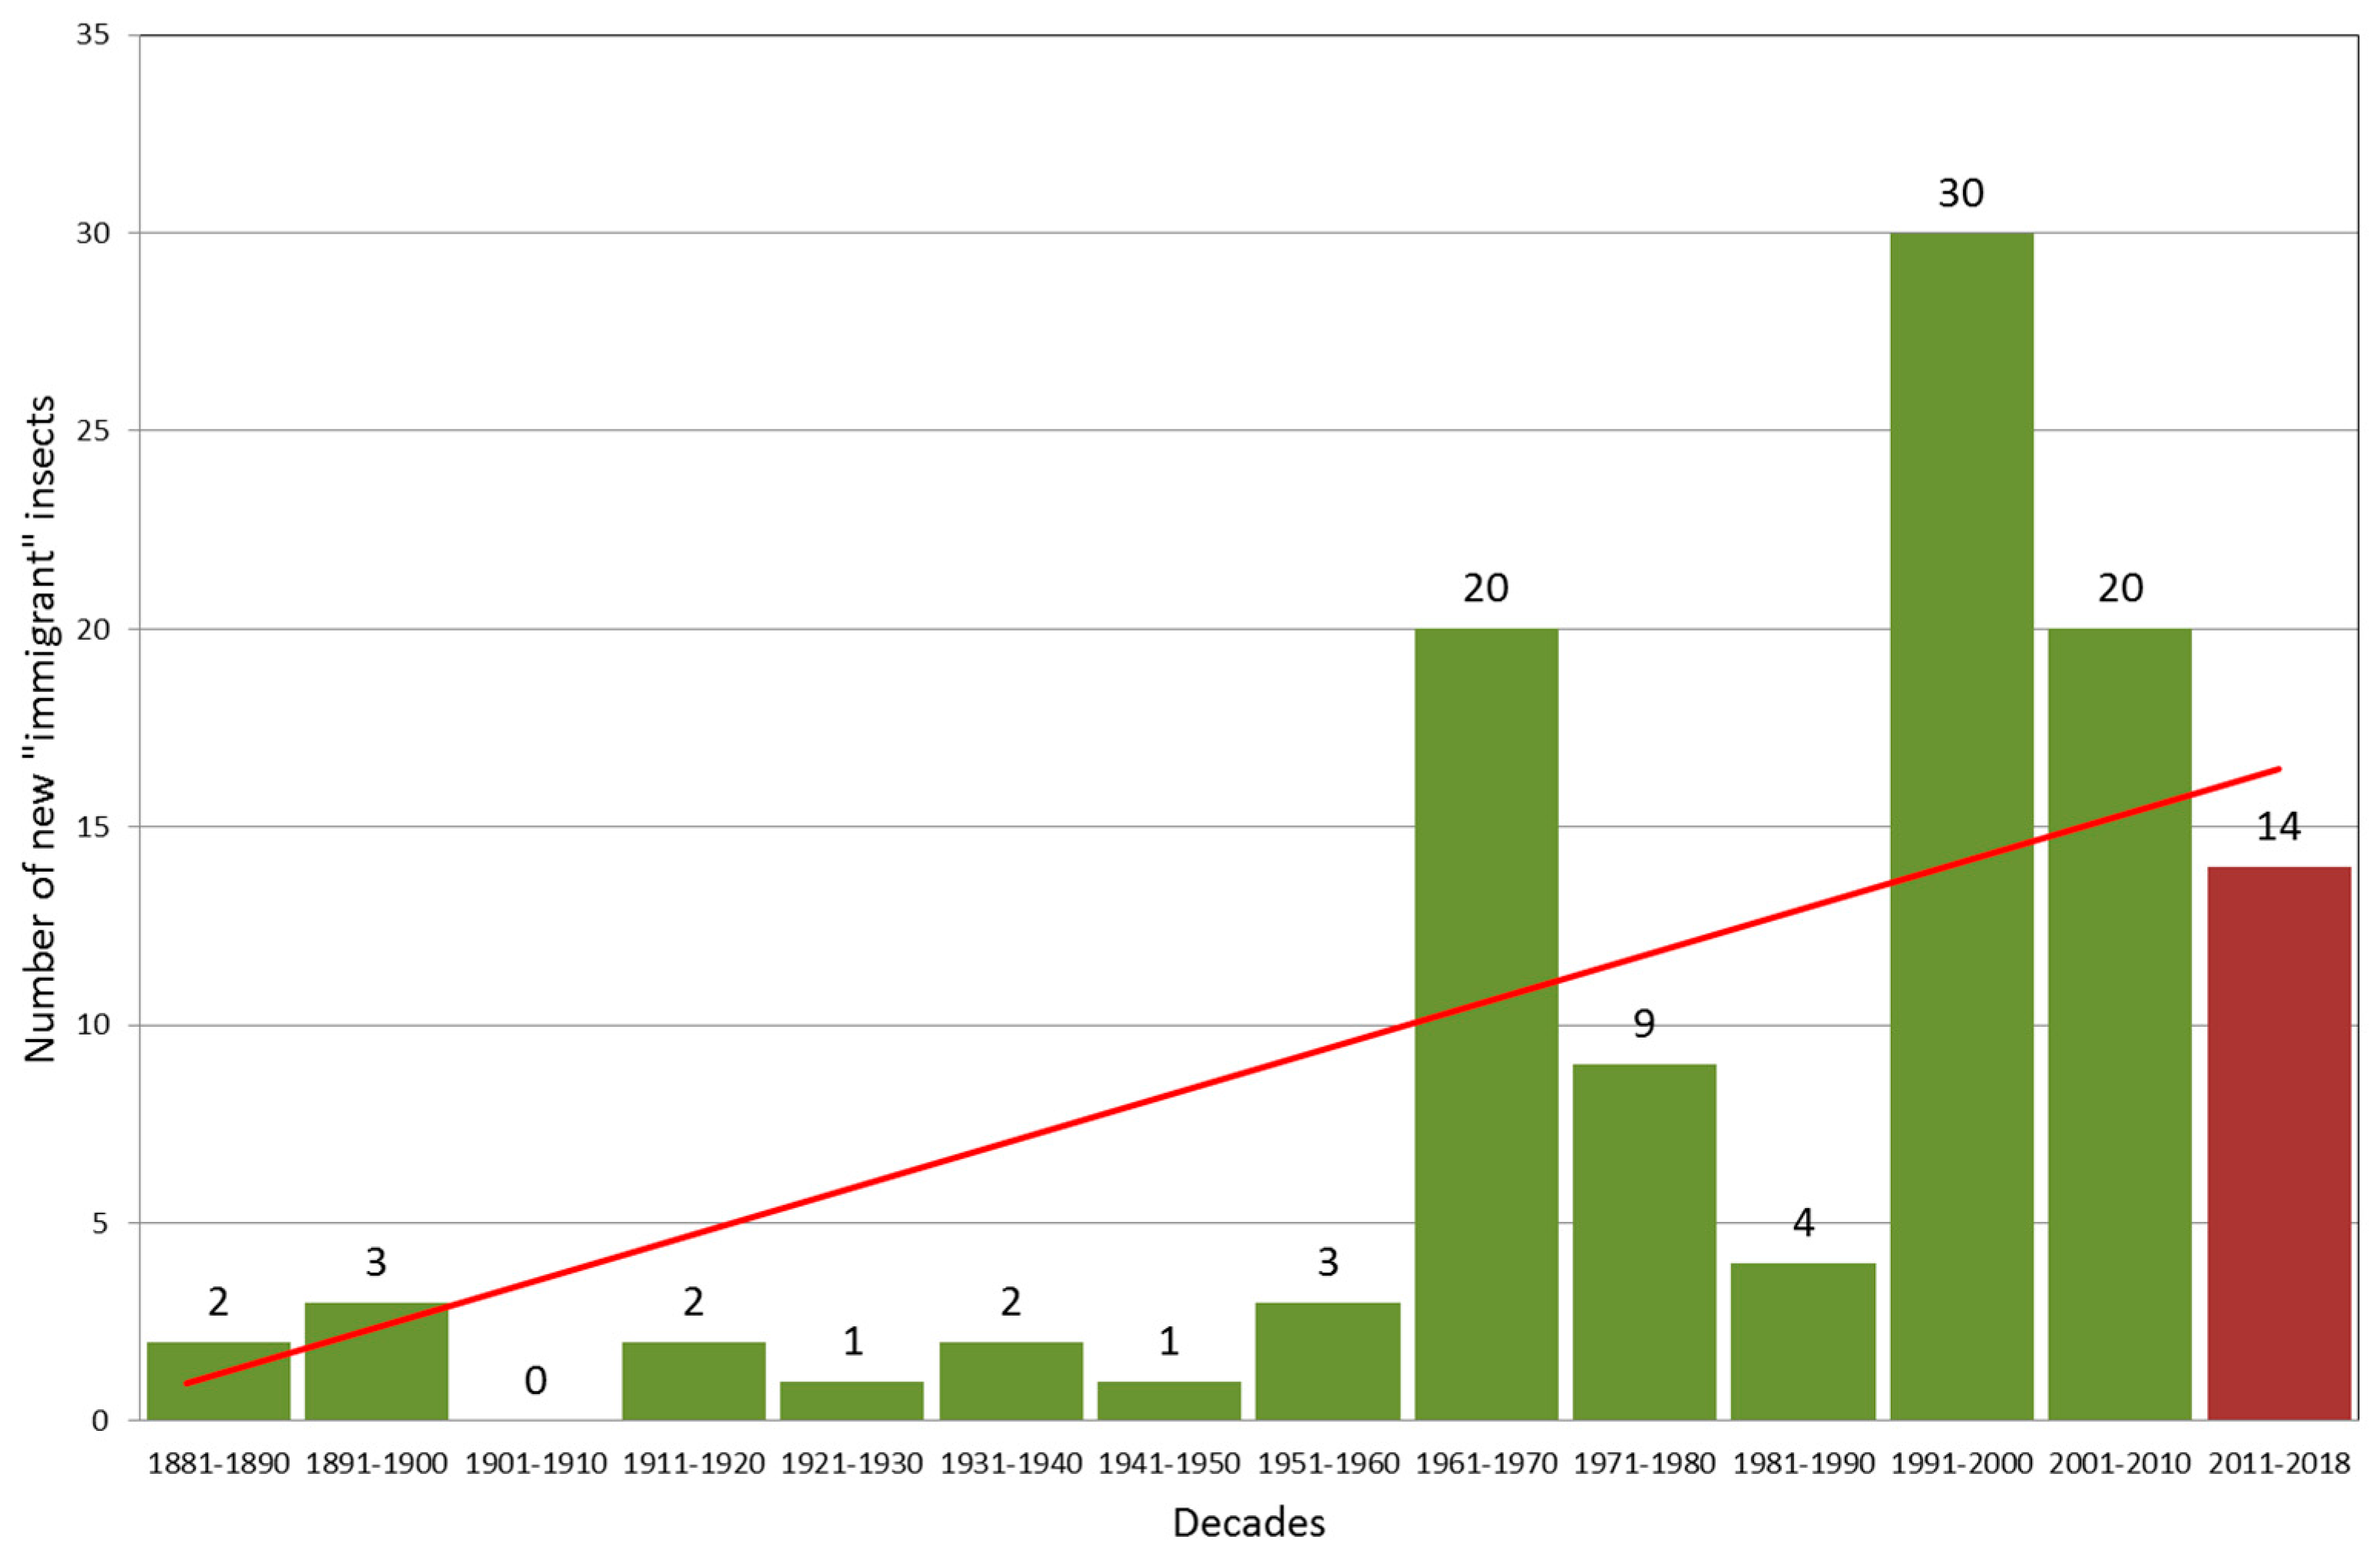
4.1.2. Biotic Damages
4.1.3. Future Outlooks
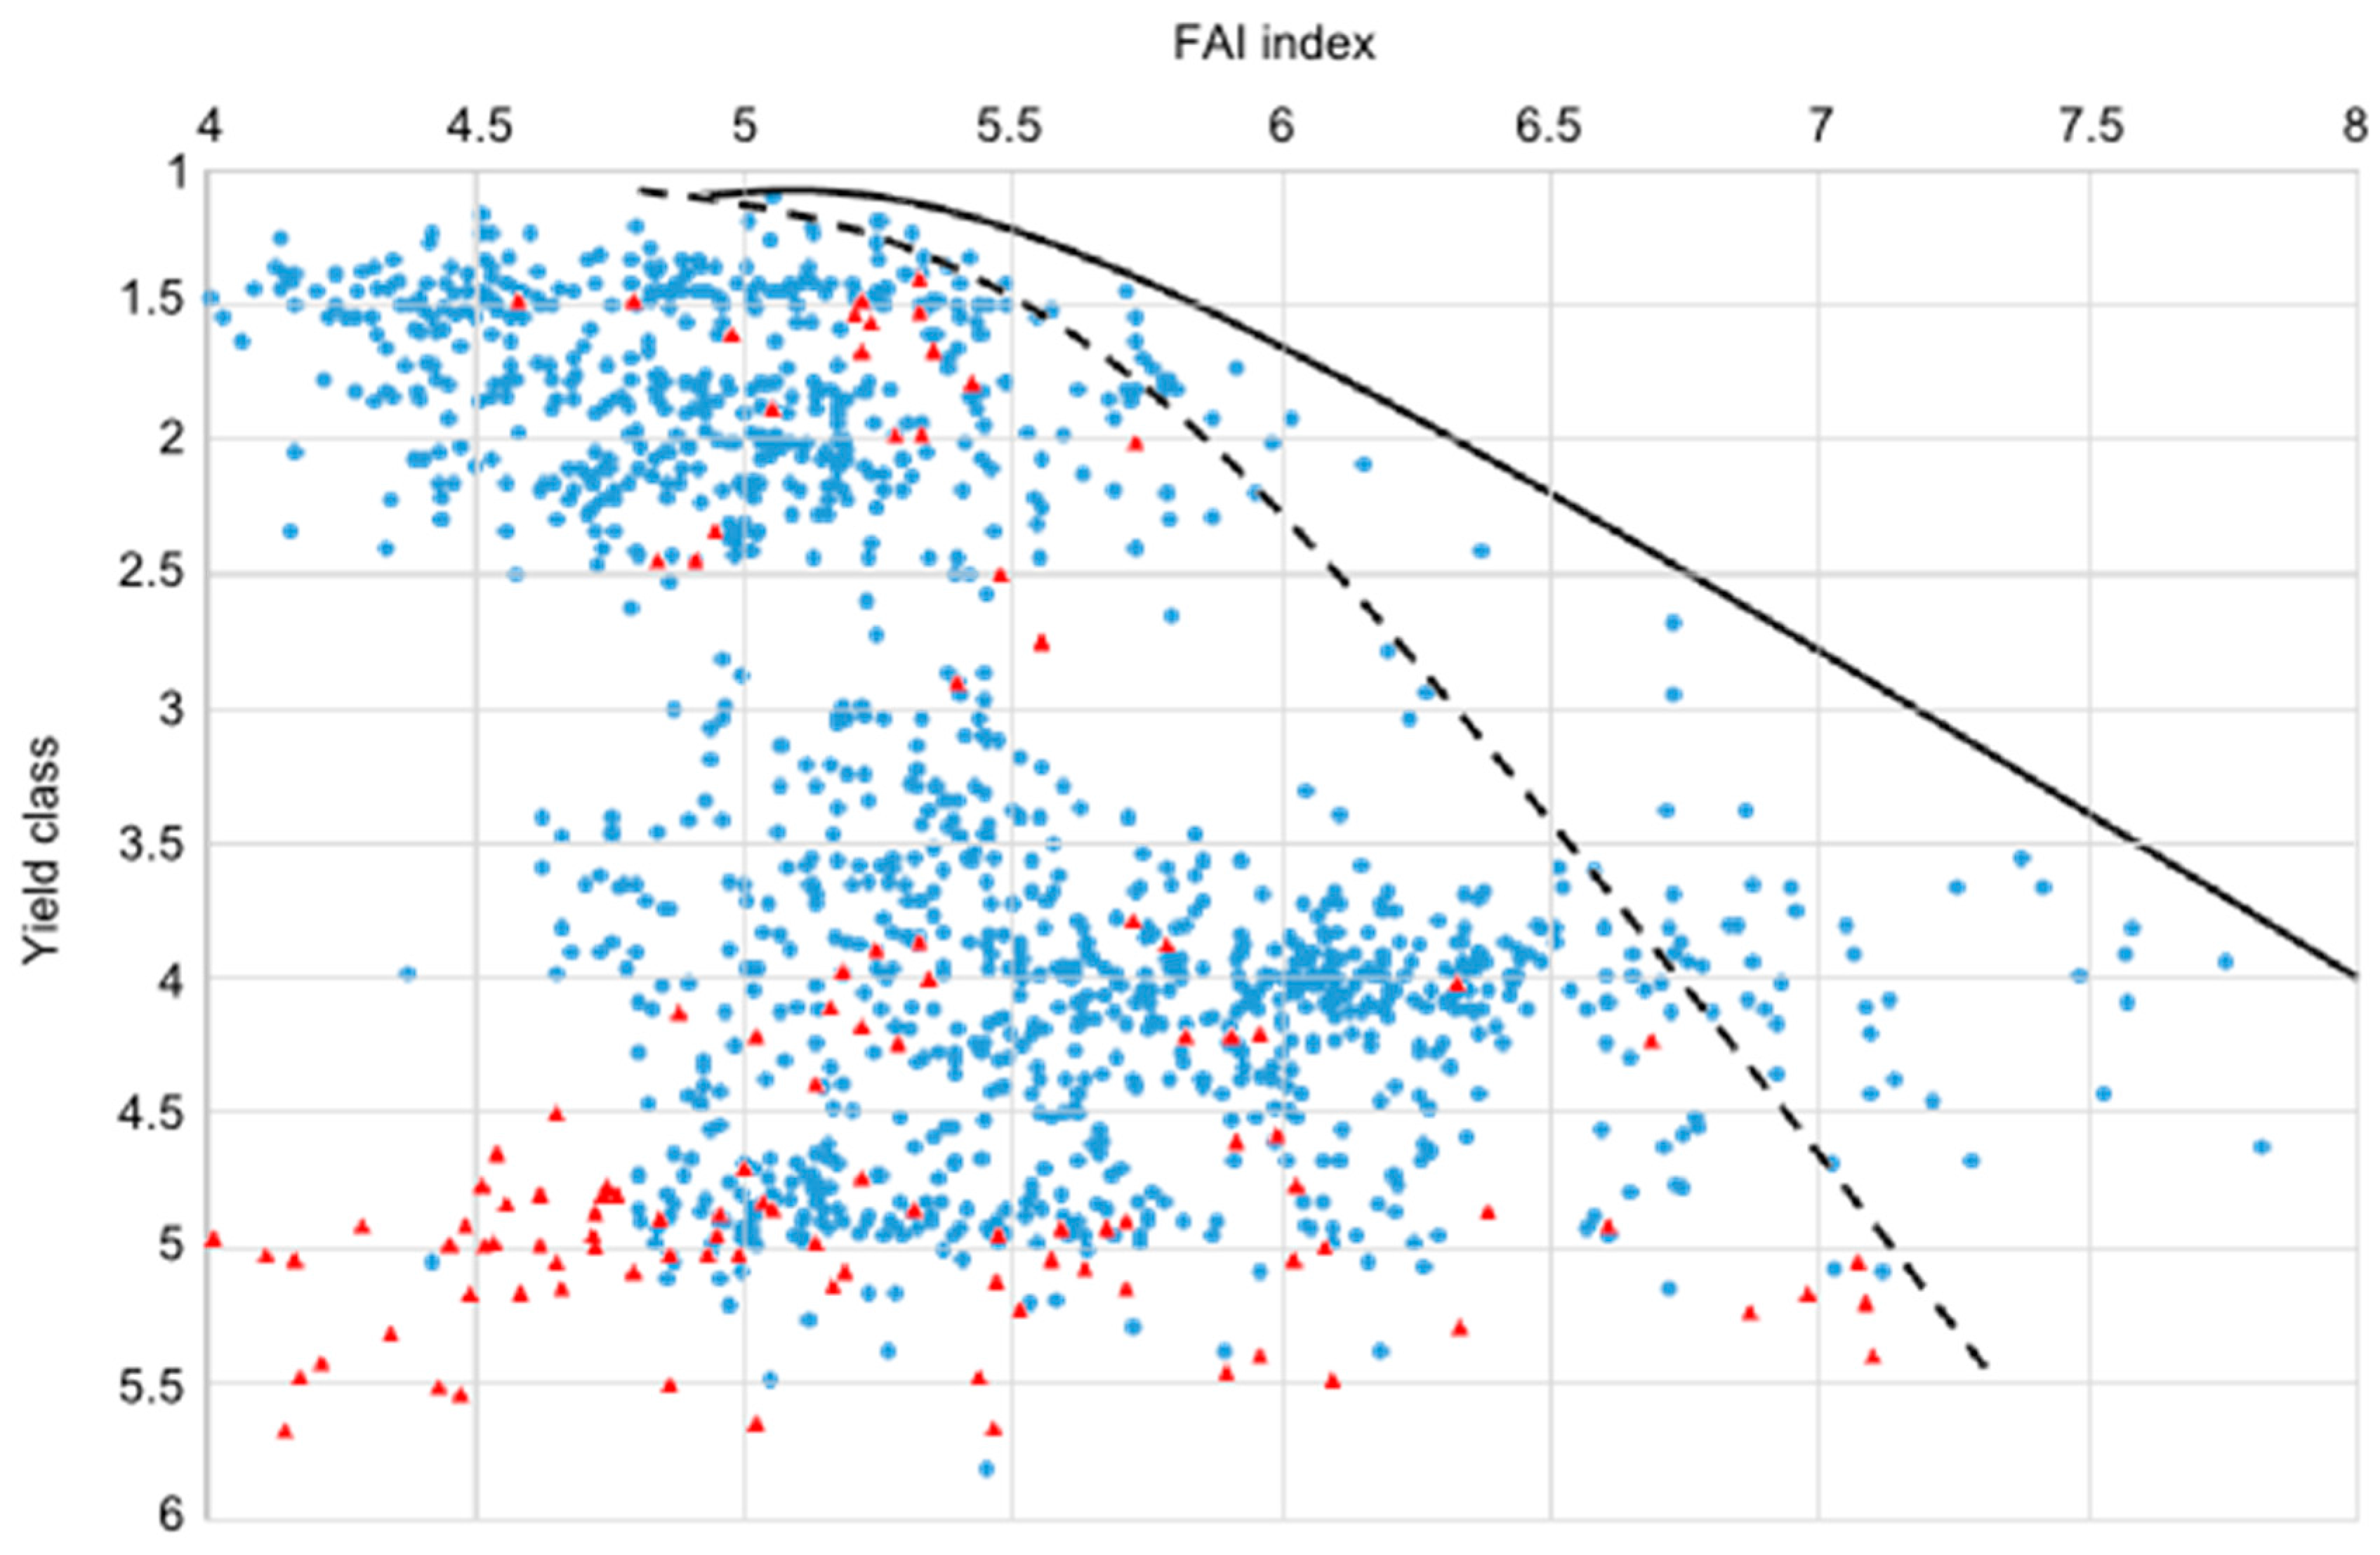
4.2. Approaches to Estimate Yield Potential and Vitality Changes, Using Sessile Oak as Model Species
- (1)
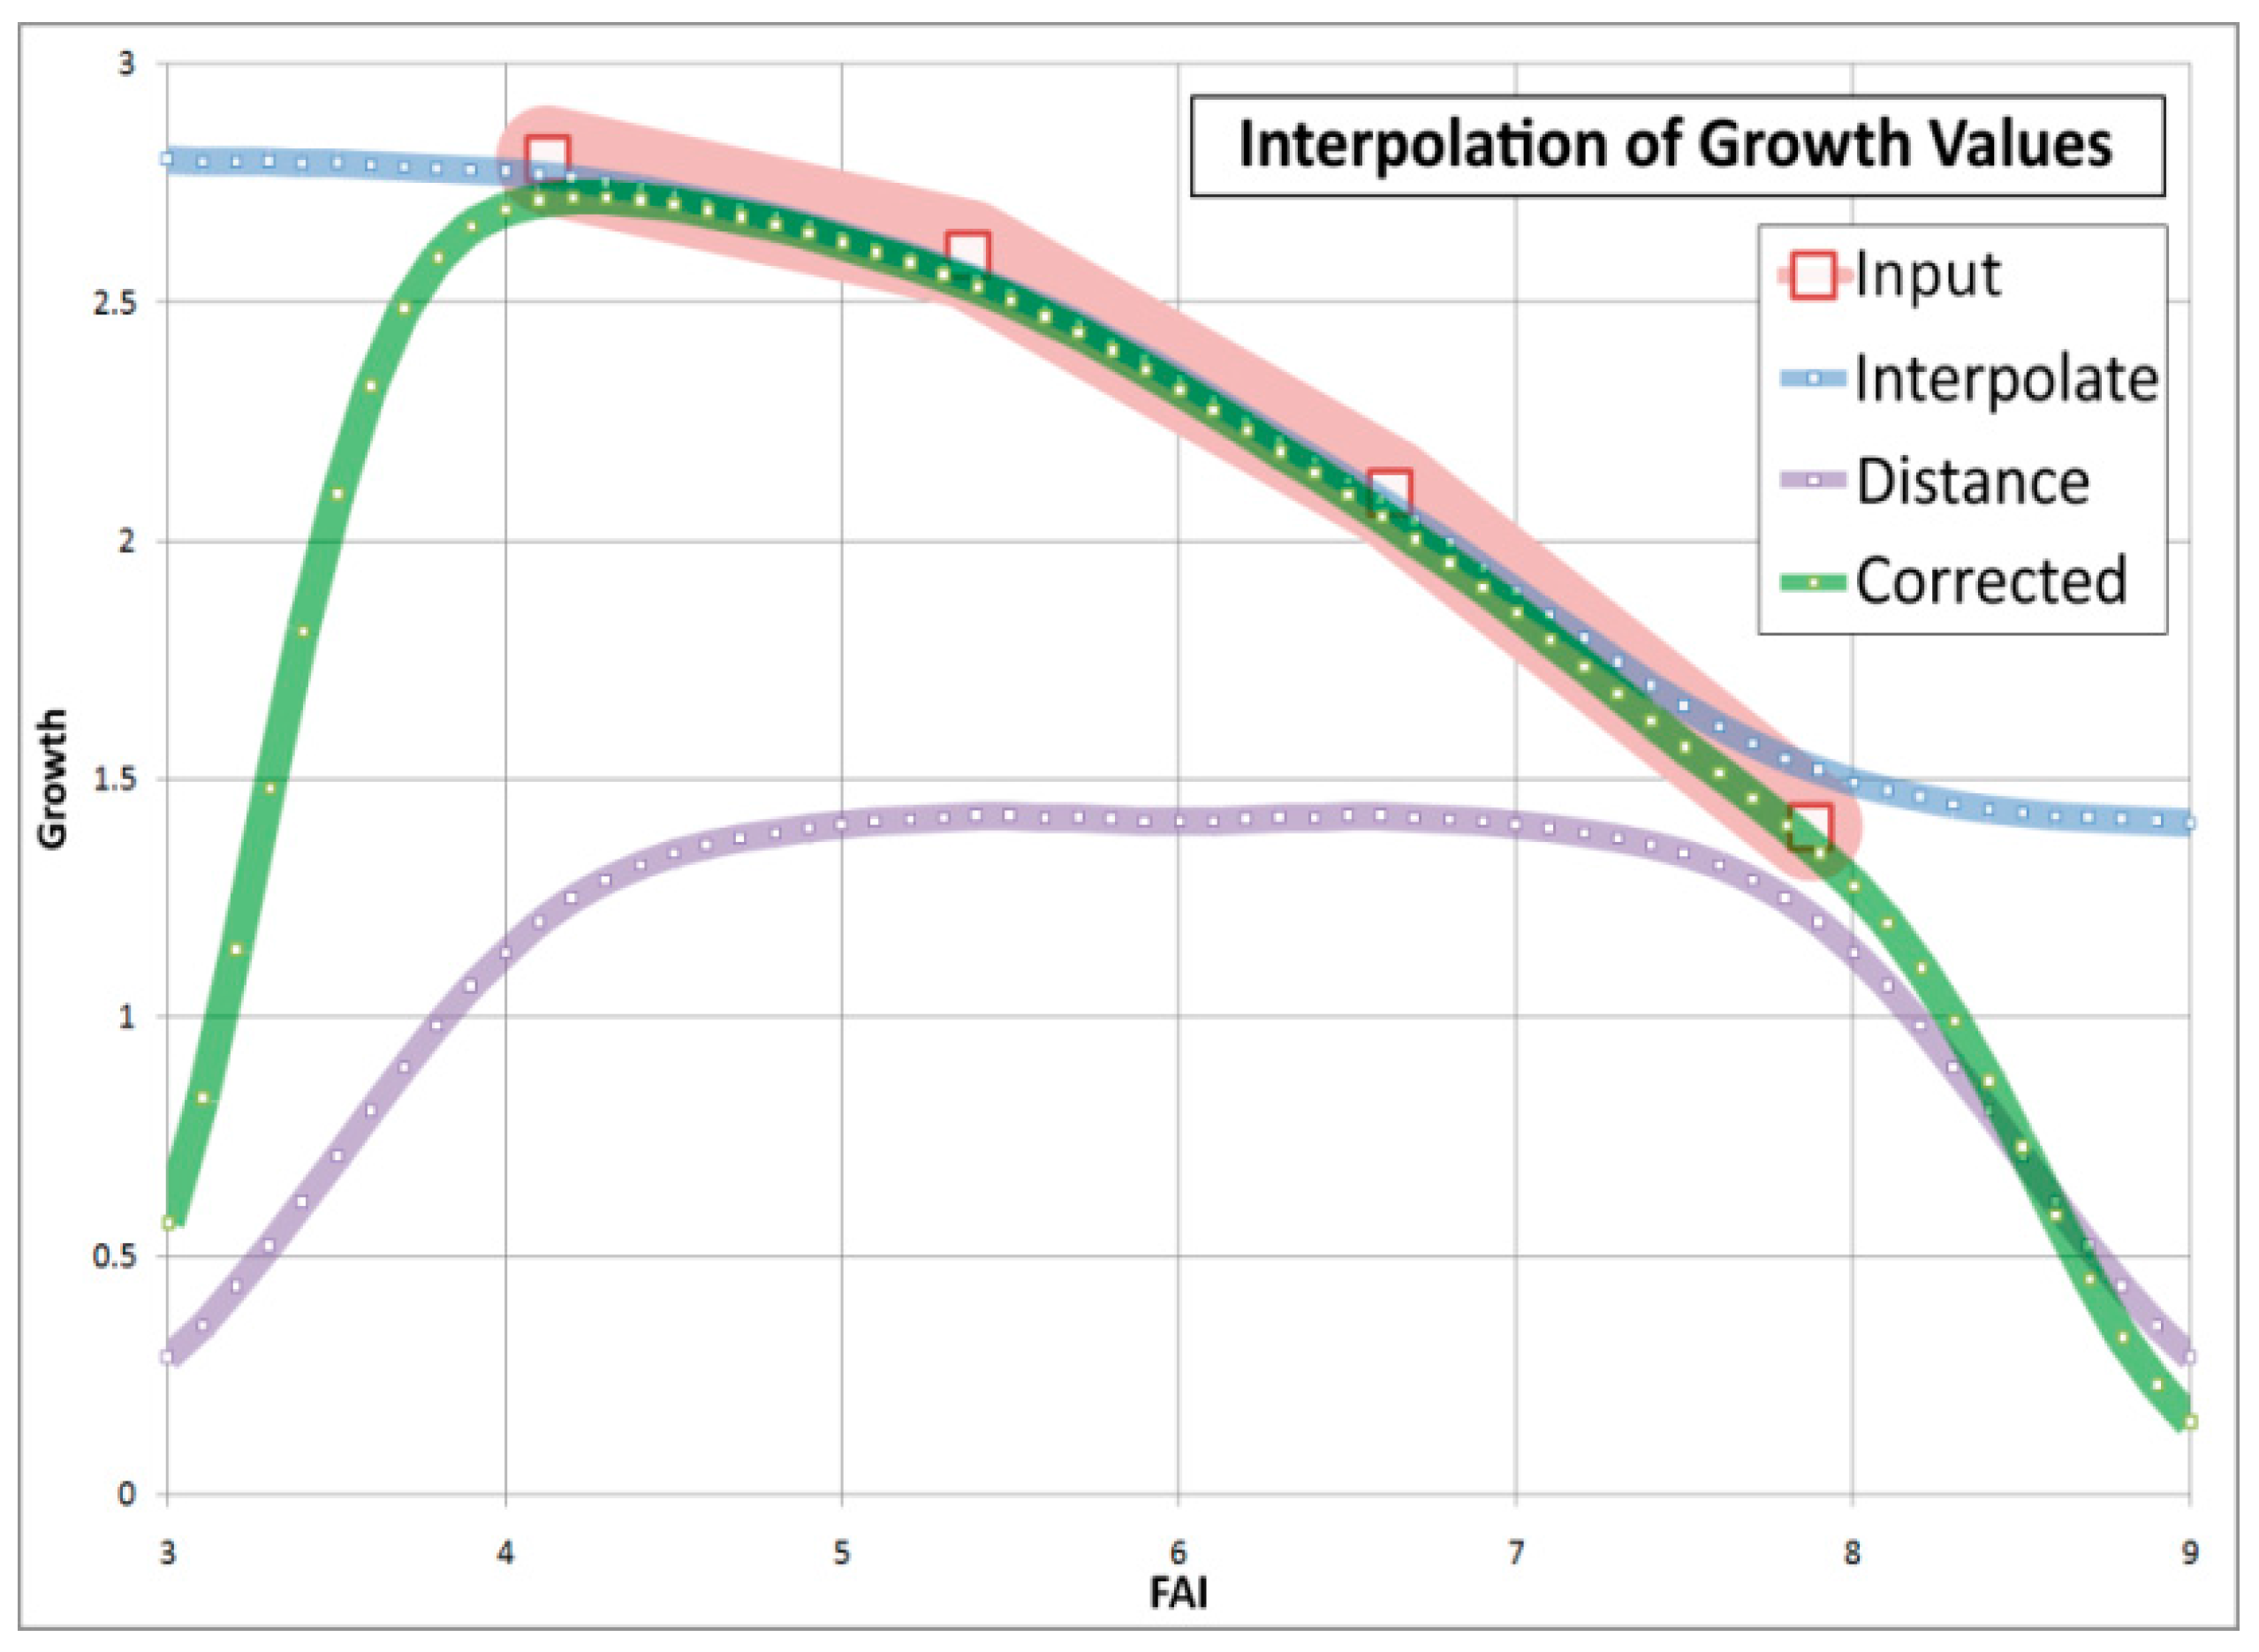
- Machine learning-aided growth trend approximation using expert estimations of site potential and yield data of sessile oak (K. Czimber)
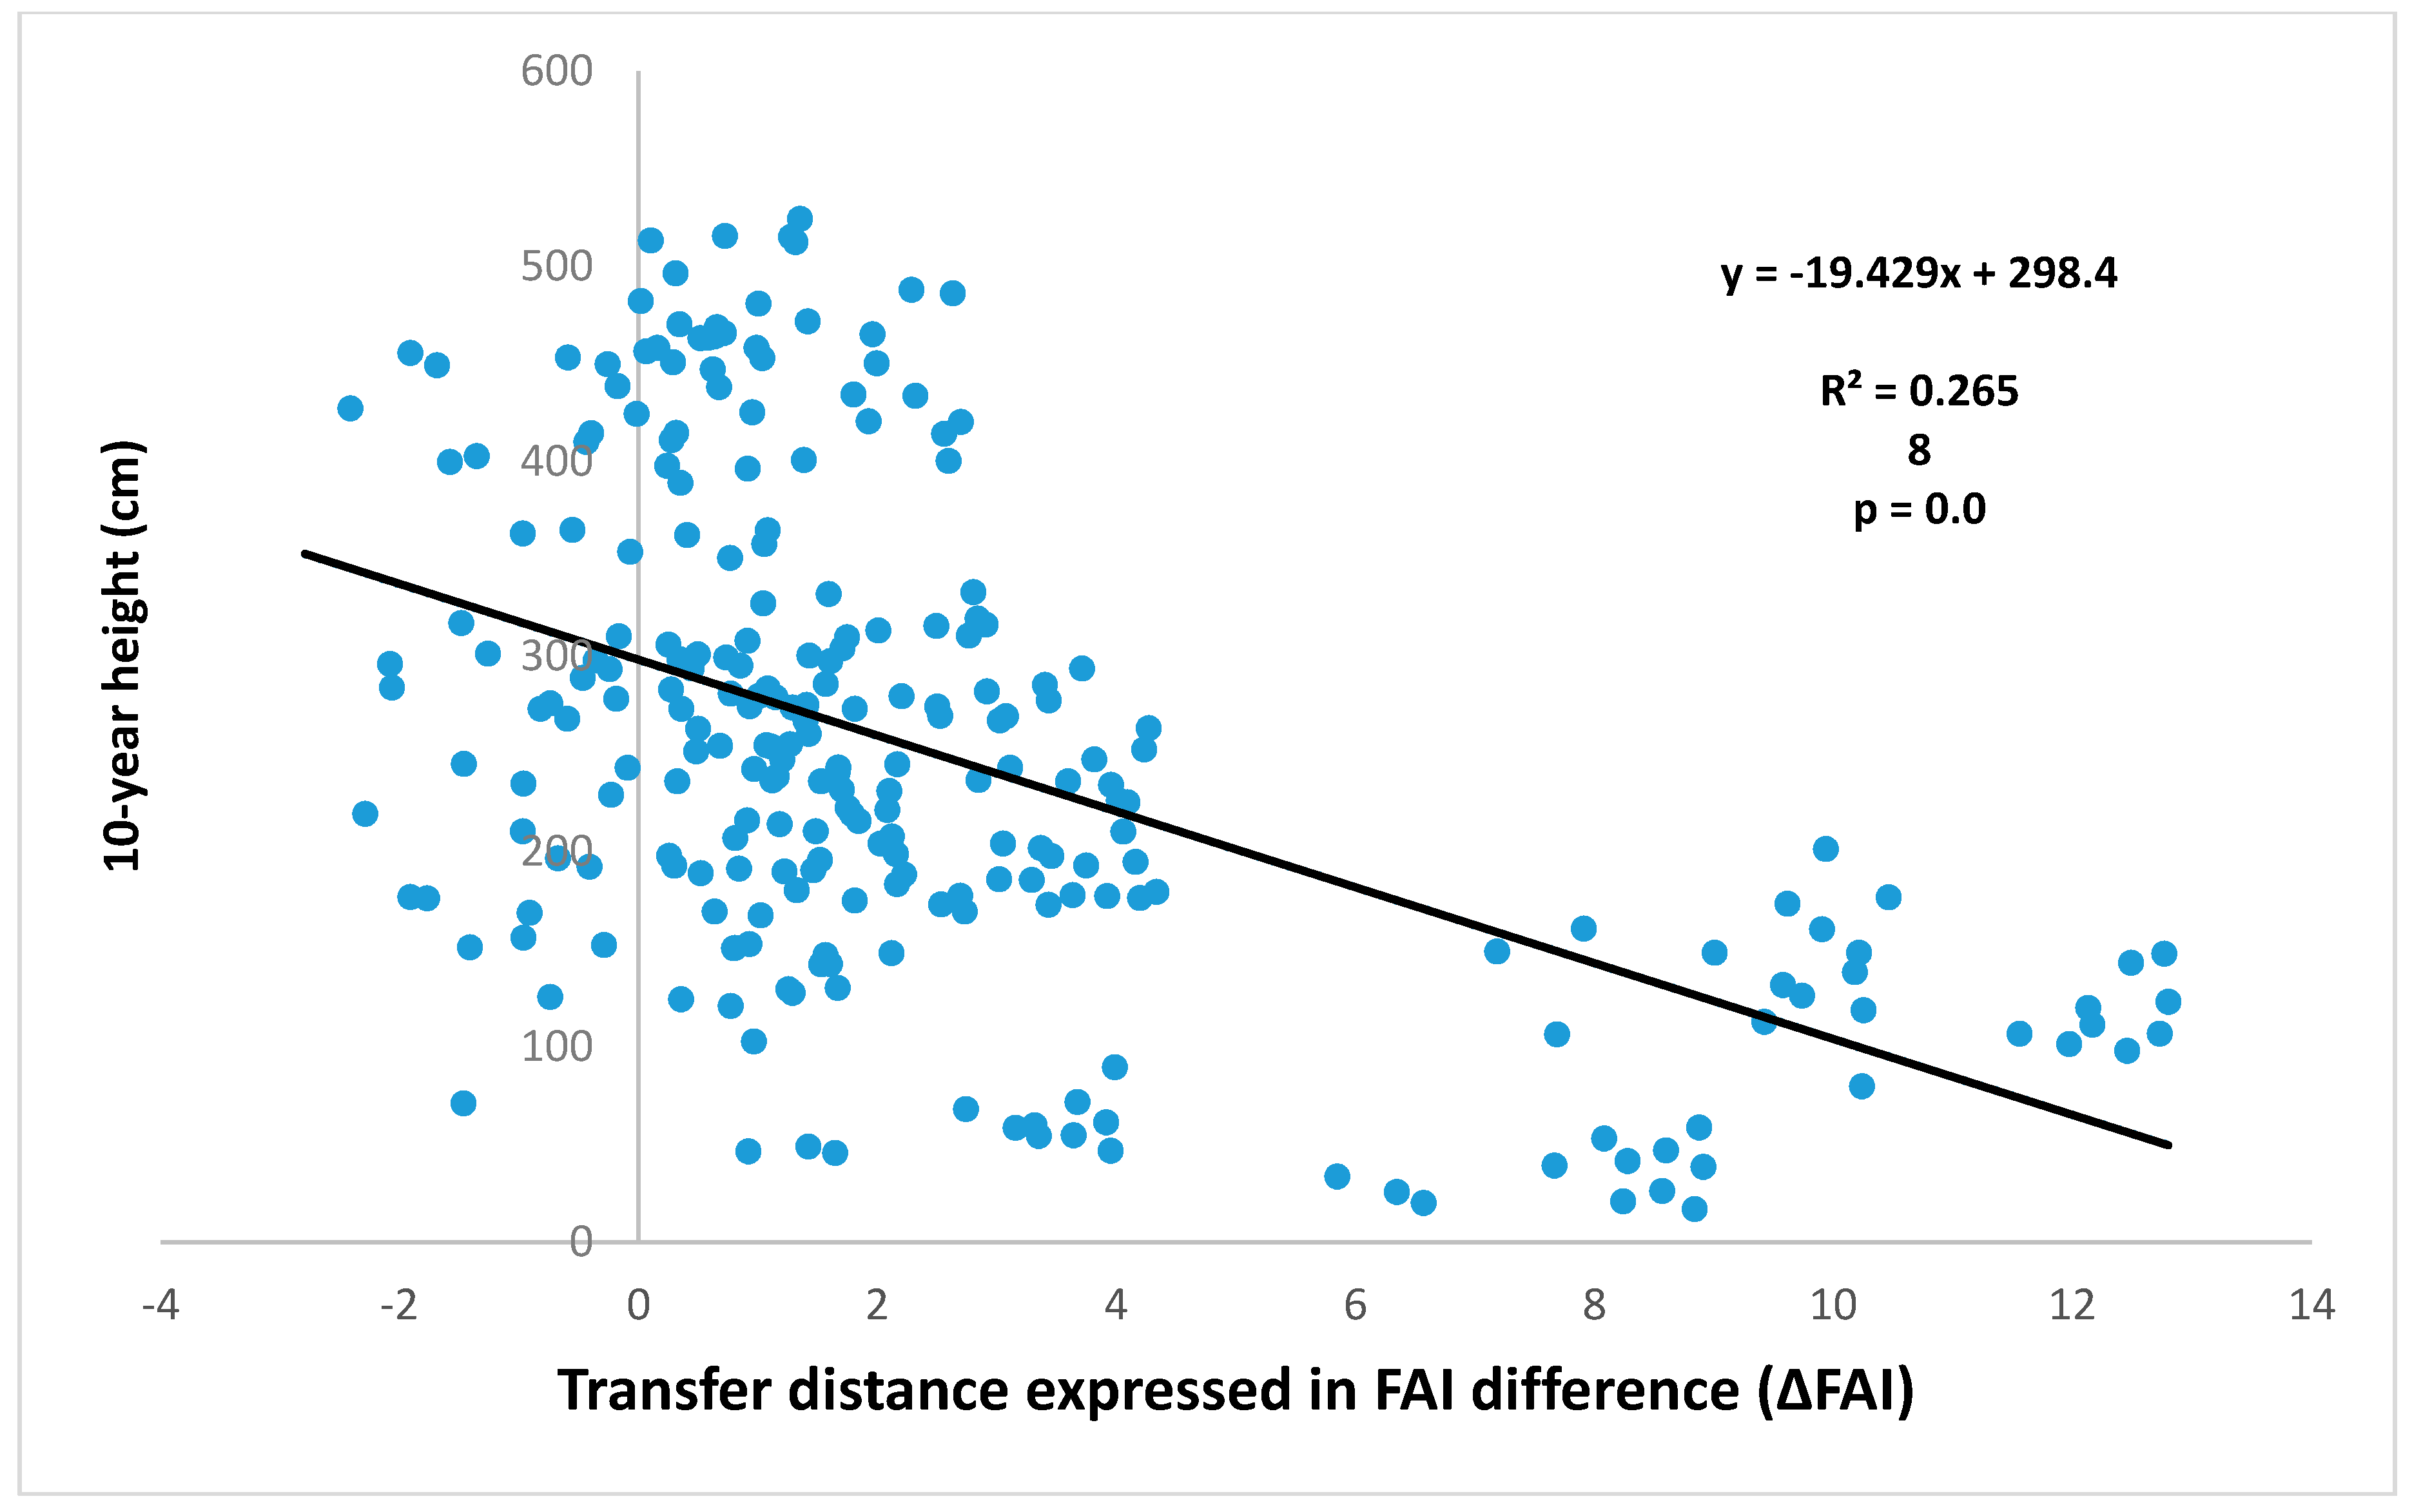
4.3. Comparison of Four Assessments of Modelled Growth Decline trends for Sessile Oak (C. Mátyás)
4.4. Generalizing Measured Trends of Growth and Vitality (C. Mátyás)
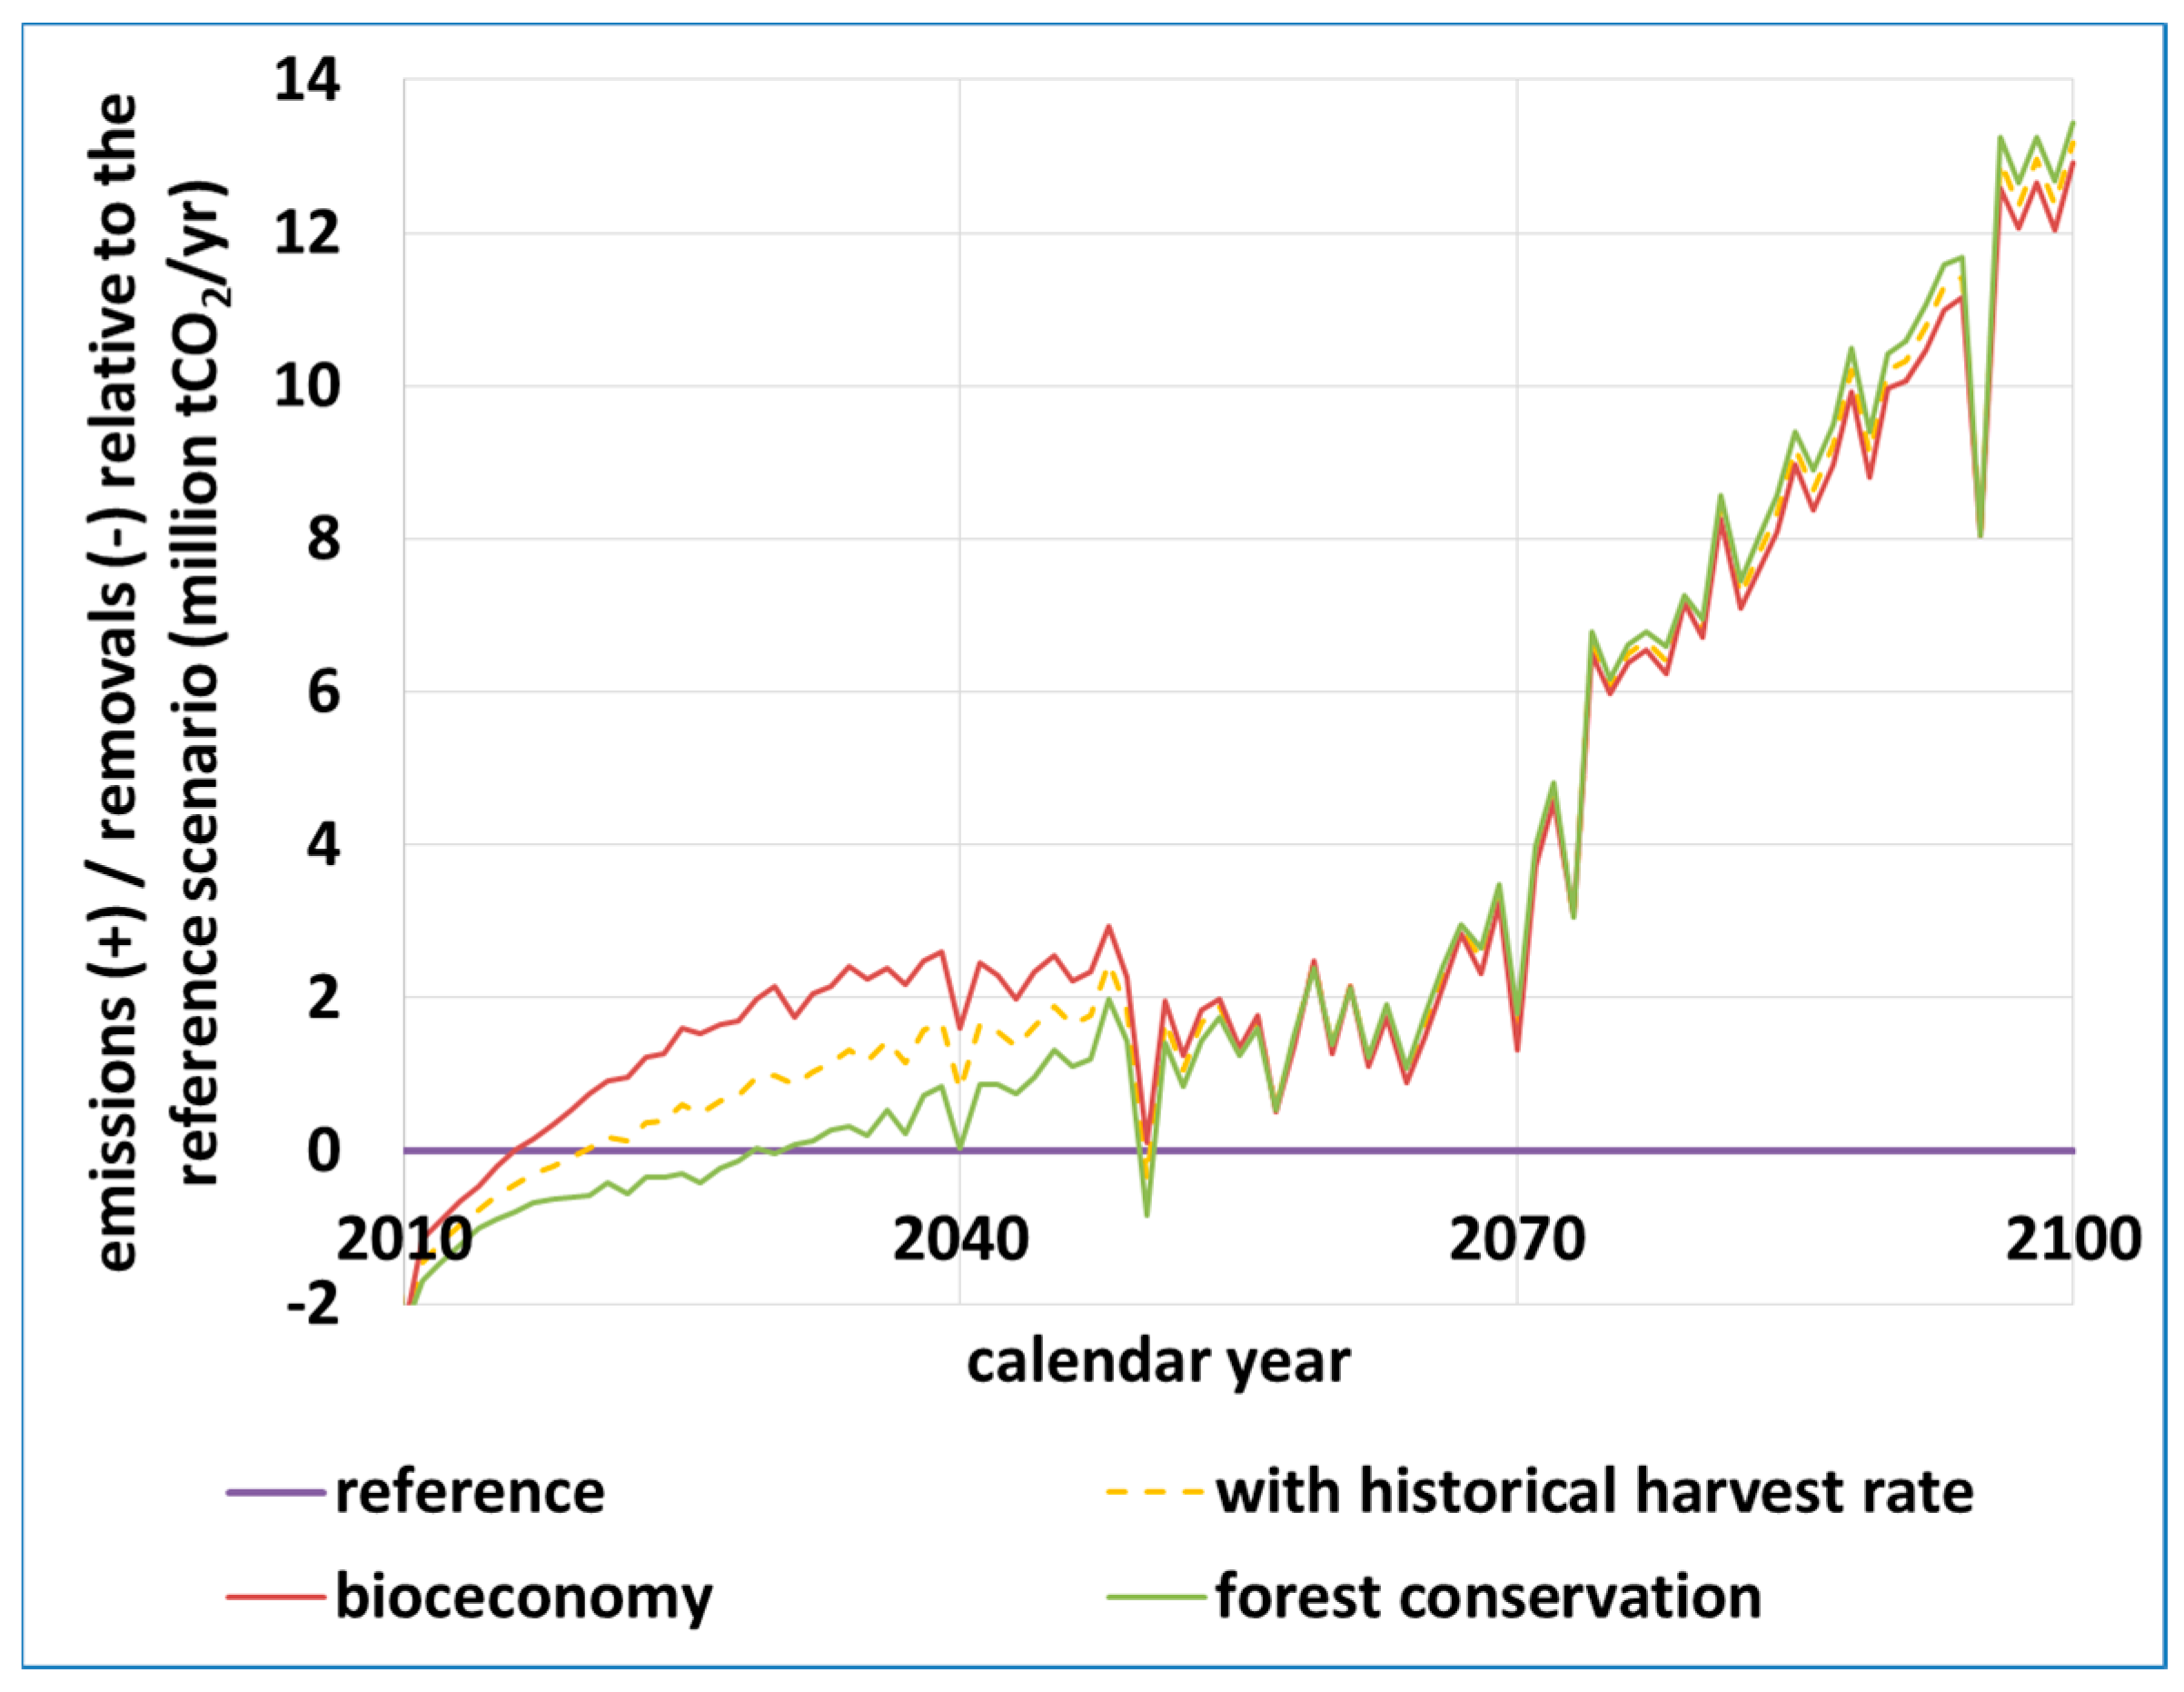
4.5. Long-Term Mortality and Carbon Balance: Grim Predictions (Z. Somogyi)
5. Discussion: Role of Forest Management in Mitigating the Effects of Site and Yield Potential Shifts
6. Conclusions
Author Contributions
Funding
Acknowledgments
Conflicts of Interest
Appendix A
Appendix A.1. Sources of Climate Information and Methods of Assessments (E. Führer–B. Gálos)
Appendix A.2. Climate Classes and the Forestry Aridity Index (FAI): An Integral Part of Site Qualification in Hungary (E. Führer)

Appendix A.3. Typifying of Forest Sites and Their Yield Potential (A. Bidló)
Appendix A.4. Developing the Model for Machine Learning-Based Regression Analysis (K. Czimber)
Appendix A.5. The Experimental Material of the Oak Provenance Test (C. Mátyás)
Appendix A.6. Projecting Beech Mortality and Carbon Balance Calculations (Z. Somogyi)

Appendix A.7. Integrating New Concepts for Sustainability and Conservation into the Social and Legal Environment (C. Mátyás)
Appendix A.8. Extreme Drought Events May Overturn Forest Planning and Long-Term Sustainability (A. Jagicza)

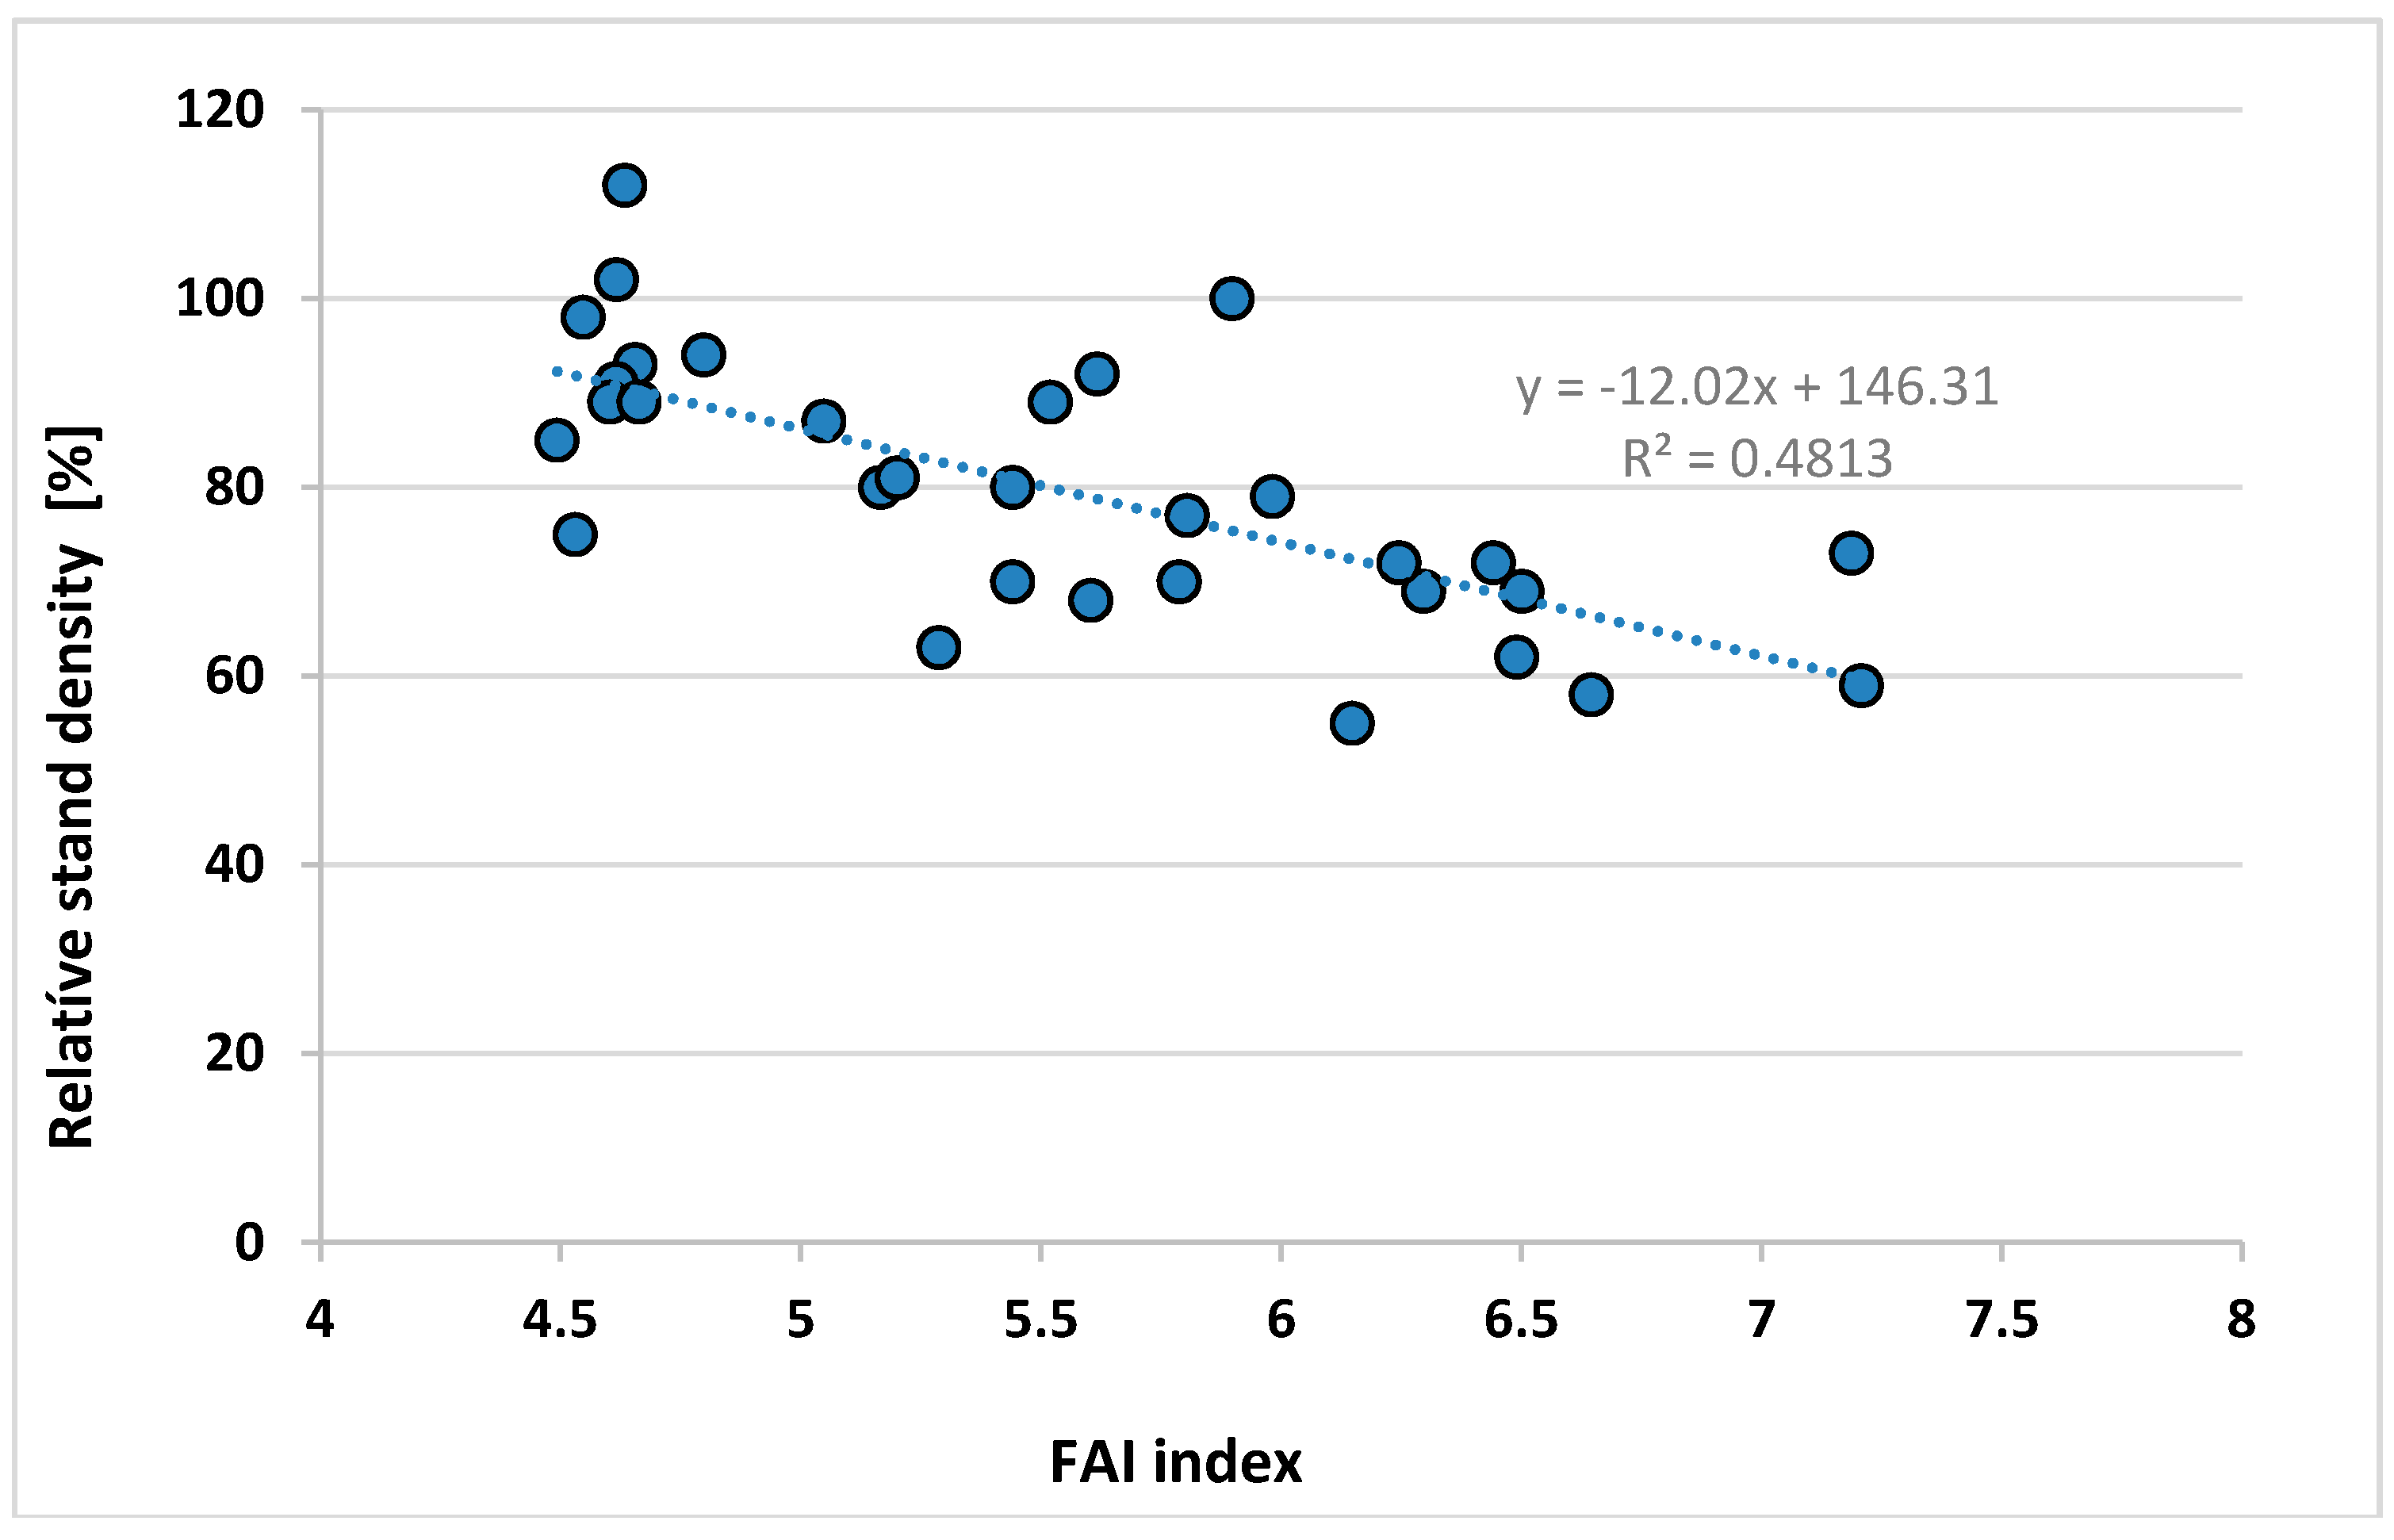
Appendix A.9. Data of the Regression Stand Density vs. FAI of Locations in Figure 10 (I. Berki)

| Community, Compartment Nr. | Relative Stand Density % | PMay | PJune | PJuly | PAug | TJuly | TAug | FAI 1961–2010 |
|---|---|---|---|---|---|---|---|---|
| Bak 4C | 112 | 72.40 | 85.00 | 86.07 | 82.88 | 19.23 | 18.99 | 4.63 |
| Bak 9A | 102 | 72.23 | 85.24 | 86.41 | 83.22 | 19.23 | 18.95 | 4.62 |
| Écs 1C | 100 | 62.37 | 71.26 | 64.82 | 69.46 | 19.77 | 19.48 | 5.90 |
| Felsőszterzsébet 21B | 98 | 73.96 | 88.16 | 91.17 | 87.19 | 19.88 | 19.37 | 4.55 |
| Daraboshegy 5D | 94 | 71.09 | 85.49 | 85.93 | 82.10 | 19.92 | 19.48 | 4.80 |
| Pusztamagyaród 9C | 93 | 74.94 | 86.41 | 88.21 | 83.47 | 19.76 | 19.46 | 4.66 |
| Almamellék 9A | 92 | 66.08 | 83.86 | 68.75 | 71.00 | 20.35 | 19.92 | 5.62 |
| Bodony 3C | 91 | 75.47 | 86.43 | 75.30 | 70.99 | 17.76 | 17.64 | 4.62 |
| Ispánk 1C | 89 | 73.74 | 89.68 | 89.93 | 85.55 | 19.96 | 19.51 | 4.60 |
| Hegyhátszentmárton 2F | 89 | 73.43 | 88.96 | 88.97 | 84.07 | 20.00 | 19.59 | 4.66 |
| Gősfa 2D | 87 | 68.32 | 79.86 | 79.74 | 79.38 | 19.71 | 19.37 | 5.05 |
| Aszaló 1B | 79 | 65.45 | 76.32 | 68.31 | 60.09 | 20.44 | 20.06 | 5.98 |
| Aggtelek 58B | 75 | 76.93 | 90.55 | 84.08 | 71.98 | 18.61 | 18.33 | 4.53 |
| Szemere 19A | 70 | 68.32 | 83.52 | 84.51 | 66.24 | 21.26 | 20.87 | 5.44 |
| Fulókércs 14B | 80 | 68.24 | 83.20 | 80.53 | 64.85 | 20.74 | 20.32 | 5.44 |
| Eger 83B | 80 | 67.52 | 81.05 | 77.92 | 68.18 | 19.38 | 19.12 | 5.17 |
| Sopron 80A | 77 | 65.72 | 79.79 | 70.69 | 70.76 | 20.92 | 20.60 | 5.80 |
| Balatonendréd 14B | 69 | 57.68 | 73.51 | 62.43 | 71.24 | 20.84 | 20.37 | 6.30 |
| Püspökszilágy 25A | 69 | 60.02 | 73.03 | 61.69 | 56.38 | 20.53 | 20.14 | 6.50 |
| Püspökszilágy 25B | 62 | 59.99 | 72.93 | 61.65 | 56.39 | 20.50 | 20.09 | 6.49 |
| Monok 17G | 72 | 63.97 | 72.39 | 67.03 | 58.80 | 21.41 | 21.01 | 6.44 |
| Kerecsend 1A | 55 | 59.10 | 69.40 | 68.07 | 60.35 | 20.15 | 19.81 | 6.15 |
| Gagyvendégi 4B | 63 | 69.80 | 84.33 | 75.95 | 67.45 | 19.92 | 19.58 | 5.29 |
| Herencsény 55A | 68 | 66.30 | 82.10 | 67.14 | 61.31 | 19.41 | 19.14 | 5.60 |
| Galgamácsa 68B | 58 | 59.25 | 72.08 | 60.13 | 55.61 | 20.64 | 20.20 | 6.65 |
| Füle 6B | 59 | 54.90 | 67.39 | 53.48 | 60.25 | 21.11 | 20.62 | 7.21 |
| Demjén 11F | 72 | 59.24 | 70.13 | 67.02 | 61.41 | 20.46 | 20.11 | 6.25 |
| Egervár 7E | 81 | 67.98 | 78.88 | 78.02 | 78.39 | 20.06 | 19.60 | 5.20 |
| Baktakék 17D | 89 | 67.47 | 81.71 | 75.47 | 64.12 | 20.30 | 19.91 | 5.52 |
| Biatorbágy 152E | 73 | 56.59 | 65.32 | 53.76 | 54.74 | 20.65 | 20.20 | 7.19 |
| Bajánsenye 5A | 85 | 74.25 | 90.23 | 91.90 | 87.03 | 19.80 | 19.32 | 4.49 |
| Buják 29A | 70 | 65.41 | 82.12 | 64.37 | 58.75 | 19.54 | 19.24 | 5.79 |
References
- Settele, J.; Scholes, R.; Betts, R.; Bunn, S.; Leadley, P.; Nepstad, D.; Overpeck, J.T.; Taboada, M.A. Terrestrial and inland water systems. In Climate Change, 2014: Impacts, Adaptation, and Vulnerability: Part A: Global and Sectoral Aspects; Contribution of Working Group II to the Fifth Assessment Report of the Intergovernmental Panel on Climate Change; Field, C.B., Barros, V.R., Dokken, D.J., Mach, K.J., Mastrandrea, M.D., Bilir, T.E., Chatterjee, M., Ebi, K.L., Estrada, Y.O., Genova, R.C., et al., Eds.; Cambridge University Press: Cambridge, UK, 2014; pp. 271–359. ISBN 978-1-107-05807-1. [Google Scholar]
- Keenan, R.J. Climate change impacts and adaptation in forest management: A review. Ann. For. Sci. 2015, 72, 145–167. [Google Scholar] [CrossRef]
- Frank, D.; Reichstein, M.; Bahn, M.; Thonicke, K.; Frank, D.; Mahecha, M.D.; Smith, P.; van der Velde, M.; Vicca, S.; Babst, F.; et al. Effects of climate extremes on the terrestrial carbon cycle: Concepts, processes and potential future impacts. Glob. Chang. Biol. 2015, 21, 2861–2880. [Google Scholar] [CrossRef] [PubMed] [Green Version]
- Pecl, G.T.; Araújo, M.B.; Bell, J.D.; Blanchard, J.; Bonebrake, T.C.; Chen, I.-C.; Clark, T.D.; Colwell, R.K.; Danielsen, F.; Evengård, B.; et al. Biodiversity redistribution under climate change: Impacts on ecosystems and human well-being. Science 2017, 355, 1–9. [Google Scholar] [CrossRef] [PubMed]
- Allen, C.D.; Breshears, D.D. Drought-induced shift of a forest-woodland ecotone: Rapid landscape response to climate variation. Proc. Natl. Acad. Sci. USA 1998, 95, 14839–14842. [Google Scholar] [CrossRef] [PubMed] [Green Version]
- Walther, G.-R.; Post, E.; Convey, P.; Menzel, A.; Parmesan, C.; Beebee, T.J.C.; Fromentin, J.-M.; Hoegh-Guldberg, O.; Bairlein, F. Ecological responses to recent climate change. Nature 2002, 416, 389–395. [Google Scholar] [CrossRef] [PubMed]
- Tchebakova, N.M.; Parfenova, E.; Soja, A.J. The effects of climate, permafrost and fire on vegetation change in Siberia in a changing climate. Environ. Res. Lett. 2009, 4, 045013. [Google Scholar] [CrossRef] [Green Version]
- Parmesan, C. Ecological and evolutionary responses to recent climate change. Ann. Rev. Ecol. Evol. Syst. 2006, 37, 637–669. [Google Scholar] [CrossRef]
- Zhu, Z.; Piao, S.; Myneni, R.B.; Huang, M.; Zemg, Z.; Canadell, J.G.; Ciais, P.; Sitch, S.; Friedlingstein, P.; Arneth, A.; et al. Greening of the Earth and its drivers. Nat. Clim. Chang. 2016, 6, 791–795. [Google Scholar] [CrossRef] [Green Version]
- Hlásny, T.; Mátyás, C.; Seidl, R.; Kulla, L.; Merganicova, K.; Trombik, J.; Dobor, L.; Barcza, Z.; Konopka, B. Climate change increases the drought risk in Central European forests: What are the options for adaptation? Lesn. Cas. For. J. 2014, 60, 5–18. [Google Scholar] [CrossRef] [Green Version]
- Doughty, C.E.; Metcalfe, D.B.; Girardin, C.A.J.; Amézquita, F.F.; Cabrera, D.G.; Huasco, W.H.; Silva-Espejo, J.E.; Araujo-Murakami, A.; da Costa, M.C.; Rocha, W.; et al. Drought impact on forest carbon dynamics and fluxes in Amazonia. Nature 2015, 519, 78–82. [Google Scholar] [CrossRef] [PubMed] [Green Version]
- Ruiz-Benito, P.; Ratcliffe, S.; Zavala, M.A.; Martínez-Vilalta, J.; Vilà-Cabrera, A.; Lloret, F.; Madrigal-González, J.; Wirth, C.; Greenwood, S.; Kändler, G.; et al. Climate- and successional-related changes in functional composition of European forests are strongly driven by tree mortality. Glob. Chang. Biol. 2017, 23, 4162–4176. [Google Scholar] [CrossRef] [PubMed]
- Groisman, P.; Bulygina, O.; Henebry, G.; Speranskaya, N.; Shiklomanov, A.; Chen, Y.; Tchebakova, N.; Parfenova, E.; Tilinina, N.; Mátyás, C.; et al. Dry land belt of Northern Eurasia: Contemporary environmental changes and their consequences. Environ. Res. Lett. 2018, in press. [Google Scholar]
- Pretzsch, H. Forest Dynamics, Growth and Yield; Springer: Berlin/Heidelberg, Germany, 2009; p. 664. ISBN 978-3-540-88306-7. [Google Scholar]
- Boisvenue, C.; Running, S.W. Impacts of climate change on natural forest productivity—evidence since the middle of the 20th century. Glob. Chang. Biol. 2006, 12, 862–882. [Google Scholar] [CrossRef]
- Allen, C.D.; Breshears, D.D.; McDowell, N.G. On underestimation of global vulnerability to tree mortality and forest die-off from hotter drought in the Anthropocene. Ecosphere 2015, 6, 1–55. [Google Scholar] [CrossRef]
- Adams, H.D.; Zeppel, M.J.B.; Anderegg, W.R.L.; Hartmann, H.; Landhäusser, S.M.; Tissue, D.T.; Huxman, T.E.; Hudson, P.J.; Franz, T.E.; Allen, C.D.; et al. A multi-species synthesis of physiological mechanisms in drought-induced tree mortality. Nat. Ecol. Evol. 2017, 1, 1285–1291. [Google Scholar] [CrossRef] [PubMed] [Green Version]
- McDowell, N.G.; Fisher, R.A.; Xu, C.; Domec, J.C.; Hölttä, T.; Mackay, D.S.; Sperry, J.S.; Boutz, A.; Dickman, L.; Gehres, N.; et al. Evaluating theories of drought-induced vegetation mortality using a multimodel–experiment framework. New Phytol. 2013, 200, 304–321. [Google Scholar] [CrossRef] [PubMed]
- Rehfeldt, G.E.; Tchebakova, N.M.; Milyutin, L.I.; Parfenova, E.I.; Wykoff, W.R.; Kouzmina, N.A. Assessing population responses to climate in Pinus sylvestris and Larix spp. of Eurasia with climate transfer models. Eurasian J. For. Res. 2003, 6, 83–98. [Google Scholar]
- Czúcz, B.; Gálhidy, L.; Mátyás, C. Present and forecasted xeric climatic limits of beech and sessile oak distribution at low altitudes in Central Europe. Ann. For. Sci. 2011, 68, 9–108. [Google Scholar] [CrossRef]
- McDowell, N.G.; Allen, C.D. Darcy’s law predicts widespread forest mortality under climate warming. Nat. Clim. Chang. 2015, 5, 669–672. [Google Scholar] [CrossRef]
- Mátyás, C.; Sun, G. Forests in a water limited world under climate change. Environ. Res. Lett. 2014, 9, 085001. [Google Scholar] [CrossRef] [Green Version]
- Colangelo, M.; Camarero, J.J.; Battipaglia, G.; Borghetti, M.; De Micco, V.; Gentilesca, T.; Ripullone, F. A multi-proxy assessment of dieback causes in a Mediterranean oak species. Tree Physiol. 2017, 37, 1–15. [Google Scholar] [CrossRef] [PubMed]
- Fady, B.; Aravanopoulos, F.A.; Alizoti, P.; Mátyás, C.; von Wühlisch, G.; Westergren, M.; Belletti, P.; Cvjetkovic, B.; Ducci, F.; Huber, G.; et al. Evolution-based approach needed for the conservation and silviculture of peripheral forest tree populations. For. Ecol. Manag. 2016, 375, 66–75. [Google Scholar] [CrossRef]
- Jump, A.; Mátyás, C.; Penuelas, J. The altitude-for-latitude disparity in the range retractions of woody species. Trends Ecol. Evol. 2009, 24, 694–701. [Google Scholar] [CrossRef] [PubMed] [Green Version]
- Mátyás, C. (Ed.) Forests and climate change in Eastern Europe and Central Asia; Forests and Climate Change Working Paper 8; FAO: Rome, Italy, 2010; 189p. [Google Scholar]
- Spinoni, J.; Antofie, T.; Barbosa, P.; Bihari, Z.; Lakatos, M.; Szalai, S.; Szentimrey, T.; Vogt, J. An overview of drought events in the Carpathian Region in 1961–2010. Adv. Sci. Res. 2013, 10, 21–32. [Google Scholar] [CrossRef] [Green Version]
- Bartholy, J.; Pongrácz, R.; Pieczka, I. How the climate will change in this century? Hung. Geogr. Bull. 2014, 63, 55–67. [Google Scholar] [CrossRef] [Green Version]
- Führer, E.; Jagodics, A.; Juhász, I.; Marosi, G.; Horváth, L. Ecological and economical impacts of climate change on Hungarian forestry practice. Időjárás 2013, 117, 159–174. [Google Scholar]
- Csóka, G.; Hirka, A. Alien and invasive forest insects in Hungary: A review. In Biotic Risks and Climate Change in Forests, Proceedings of the 10th IUFRO Workshop of WP. 7.03.10 “Methodology of Forest Insect and DISEASE survey in Central Europe”, Freiburg, Germany, 20–23 September 2010; Forstliche Versuchs: Breisgau, Germany, 2010; Volume 89, pp. 54–60. [Google Scholar]
- Csóka, G.; Pödör, Z.; Nagy, G.; Hirka, A. Canopy recovery of pedunculate oak, turkey oak and beech trees after severe defoliation by gypsy moth (Lymantria dispar): Case study from Western Hungary. Lesn. Cas. For. J. 2015, 61, 143–148. [Google Scholar] [CrossRef]
- Hirka, A.; Pödör, Z.; Garamszegi, B.; Csóka, G. A magyarországi erdei aszálykárok félévszázados trendjei (1961–2011). Erdészettud. Közl. 2018, in press. (In Hungarian with English summary and captions). [Google Scholar]
- Rasztovits, E.; Berki, I.; Mátyás, C.; Czimber, K.; Pötzelsberger, E.; Móricz, N. The incorporation of extreme drought events improves models for beech persistence at its distribution limit. Ann. For. Sci. 2014, 71, 201–210. [Google Scholar] [CrossRef]
- Berki, I.; Rasztovits, E.; Móricz, N.; Kolozs, L. The Role of Tree Mortality in Vitality Assessment of Sessile Oak Forests. South-East Eur. For. 2016, 7, 91–97. [Google Scholar] [CrossRef]
- Christensen, J.H.; Carter, T.R.; Rummukainen, M.; Amanatidis, G. Evaluating the performance and utility of regional climate models: The PRUDENCE project. Clim. Chang. 2007, 81, 1–6. [Google Scholar] [CrossRef]
- Jacob, D.; Petersen, J.; Eggert, B.; Alias, A.; Christensen, O.B.; Bouwer, L.M.; Braun, A.; Colette, A.; Déqué, M.; Georgievski, G.; et al. EURO–CORDEX: New high–resolution climate change projections for European impact research. Reg. Environ. Chang. 2013, 14, 563–578. [Google Scholar] [CrossRef]
- Pongrácz, R.; Bartholy, J.; Miklós, E. Analysis of projected climate change for Hungary using ENSEMBLES simulations. Appl. Ecol. Environ. Res. 2011, 9, 387–398. [Google Scholar] [CrossRef]
- Gálos, B.; Führer, E.; Czimber, K.; Gulyás, K.; Bidló, A.; Hänsler, A.; Jacob, D.; Mátyás, C. Climatic threats determining future adaptive forest management—A case study of Zala County. Időjárás 2015, 119, 425–441. [Google Scholar]
- Gálos, B.; Lorenz, P.; Jacob, D. Will dry events occur more often in Hungary in the future? Environ. Res. Lett. 2007, 2, 034006. [Google Scholar] [CrossRef] [Green Version]
- Führer, E.; Horváth, L.; Jagodics, A.; Machon, A.; Szabados, I. Application of a new aridity index in Hungarian forestry practice. Időjárás 2011, 115, 205–216. [Google Scholar]
- Járó, Z. Az erdészeti termőhelyértékelés rendszere. In Erdőművelés; Danszky, I., Ed.; Mezőgazdasági Kiadó: Budapest, Hungary, 1972; pp. 47–256. (In Hungarian) [Google Scholar]
- Führer, E. A fák növekedése és a klíma. “Klíma-21” Füzetek 2010, 61, 98–107, (In Hungarian with English summary). [Google Scholar]
- Fan, Y.; Miguez-Macho, G.; Jobbágy, E.G.; Jackson, R.B.; Otero-Casal, C. Hydrologic regulation of plant rooting depth. Proc. Natl. Acad. Sci. USA 2017, 114, 10572–10577. [Google Scholar] [CrossRef] [PubMed] [Green Version]
- Szilágyi, J.; Kovács, Á.; Józsa, J. Remote-sensing based groundwater recharge estimates in the Danube-Tisza Sand Plateau region of Hungary. J. Hydrol. Hydromech. 2012, 60, 64–72. [Google Scholar] [CrossRef]
- Gribovszki, Z.; Kalicz, P.; Balog, K.; Szabó, A.; Tóth, T.; Metwaly, M.; Szalai, S. Groundwater uptake of different surface cover and its consequences in great Hungarian plain. Ecol. Process. 2017, 6, 39–47. [Google Scholar] [CrossRef]
- Csáfordi, P.; Szabó, A.; Balog, K.; Gribovszki, Z.; Bidló, A.; Tóth, T. Factors controlling the daily change in groundwater level during the growing season on the Great Hungarian Plain: A statistical approach. Environ. Earth. Sci. 2017, 76, 675–690. [Google Scholar] [CrossRef]
- Móricz, N.; Mátyás, C.; Berki, I.; Rasztovits, E.; Vekerdy, Z.; Gribovszki, Z. Comparative water balance study of forest and fallow plots. iForest 2012, 5, 188–196. [Google Scholar] [CrossRef] [Green Version]
- Tóth, T.; Balog, K.; Szabó, A.; Pásztor, L.; Jobbágy, E.G.; Nosetto, M.D.; Gribovszki, Z. Influence of lowland forests on subsurface salt accumulation in shallow groundwater areas. AoB Plants 2014, 6, plu054. [Google Scholar] [CrossRef] [PubMed] [Green Version]
- Csáki, P.; Szinetár, M.; Herceg, A.; Kalicz, P.; Gribovszki, Z. Climate change impacts on the water balance—case studies in Hungarian watersheds. Időjárás 2018, 122, 81–99. [Google Scholar] [CrossRef]
- Farsang, A.; Bartus, M.; Barta, K.; Szatmári, J. Szerkezetes talajok deflációérzékenységének és talajtani tulajdonságainak összefüggései: Terepi szélcsatorna kísérletek eredményei Dél-alföldi csernozjom talajokon. Földr. Közl. 2017, 141, 1–13, (In Hungarian with English summary). [Google Scholar]
- Bidló, A.; Novák, T.J.; Búró, B.; Horváth, A. Peat transformation as a response on environmental changes under alder forest swamp. Geophys. Res. Abstr. 2018, 20, EGU2018-17143-2. [Google Scholar]
- Tóth, T.; Szendrei, G. A hazai szikes talajok és a szikesedés, valamint a sófelhalmozódási folyamatok rövid jellemzése (Types and distribution of salt affected soils in Hungary, and the characterization of the processes of salt accumulation). Topogr. Mineral. Hungariae 2006, IX, 7–20, (In Hungarian with English summary). [Google Scholar]
- Janik, G.; Hirka, A.; Koltay, A.; Juhász, J.; Csóka, G. 50 év biotikus kárai a Magyar bükkösökben. Erdészettud. Közl. 2016, 6, 45–60, (In Hungarian with English summary and captions). [Google Scholar] [CrossRef]
- Csóka, G. Increased insect damage in Hungarian forests under drought impact. Biologia 1997, 52, 159–162. [Google Scholar]
- Klapwijk, M.J.; Csóka, G.; Hirka, A.; Björkman, C. Forest insects and climate change: Long-term trends in herbivore damage. Ecol. Evol. 2013, 3, 4183–4196. [Google Scholar] [CrossRef] [PubMed]
- Csóka, G.; Csepelényi, M.; Hirka, A.; Szőcs, L.; Molnár, M.; Tuba, K.; Hillebrand, R.; Lakatos, F. A klímaváltozás és az erdei rovarok. Erdészettud. Közl. 2018, 8, in press, (In Hungarian with English summary and captions). [Google Scholar]
- Csóka, G.; Hirka, A.; Szőcs, L.; Móricz, N.; Rasztovits, E.; Pödör, Z. Weather-dependent fluctuations in the abundance of the Oak Processionary Moth, Thaumetopoea processionea (Lepidoptera: Notodontidae). Eur. J. Entomol. 2018, 115, 249–255. [Google Scholar] [CrossRef]
- Lakatos, F.; Molnár, M. Mass mortality of beech (Fagus sylvatica L.) in South-West Hungary. Acta Silv. Lign. Hung. 2009, 5, 75–82. [Google Scholar]
- Vanhanen, H.; Veteli, T.O.; Paivinen, S.; Kellomaki, S.; Niemela, P. Climate change and range shifts in two insect defoliators: Gypsy moth and nun moth—A model study. Silva Fenn. 2007, 41, 621–638. [Google Scholar] [CrossRef]
- McManus, M.; Csóka, G. History and Impact of Gypsy Moth in North America and Comparison to the Recent Outbreaks in Europe. Acta Silv. Lign. Hung. 2007, 3, 47–64. [Google Scholar]
- Csóka, G.; Hirka, A. A gyapjaslepke (Lymantria dispar L.) legutóbbi tömegszaporodása Magyarországon (Recent outbreak of Gypsy moth (Lymantria dispar L.) in Hungary). Növényvédelem 2009, 45, 196–201, (In Hungarian with English summary). [Google Scholar]
- Csóka, G.; Hirka, A.; Szőcs, L. Rovarglobalizáció a Magyar erdőkben. Erdészettud. Közl. 2012, 2, 187–198, (In Hungarian with English summary and captions). [Google Scholar]
- Tuba, K.; Horváth, B.; Lakatos, F. Inváziós Rovarok Fás Növényeken; Nyugat-magyar/országi Egyetem Kiadó: Sopron, Hungary, 2012; p. 122. ISBN 978-963-334-049-3. (In Hungarian) [Google Scholar]
- Csóka, G.; Hirka, A.; Somlyai, M. A tölgycsipkéspoloska (Corythucha arcuata Say, 1832–Hemiptera, Tingidae) első észlelése Magyarországon. (First record of oak lace bug (Corythucha arcuata Say, 1832) in Hungary). Növényvédelem 2013, 49, 293–296, (In Hungarian with English summary). [Google Scholar]
- Csepelényi, M.; Hirka, A.; Mikó, Á.; Szalai, Á.; Csóka, G. A tölgy-csipkéspoloska (Corythucha arcuata) 2016/2017-es áttelelése Délkelet-Magyarországon. (Overwintering success of the oak lace bug (Corythucha arcuata) in 2016/2017 at South-eastern Hungary). Növényvédelem 2017, 53, 285–288, (In Hungarian with English summary). [Google Scholar]
- Mátyás, C. Climatic adaptation of trees: Rediscovering provenance tests. Euphytica 1996, 92, 45–54. [Google Scholar] [CrossRef]
- Balogh, L.; Kovács, G.; Tímár, G. Az Egyes Termőhelytípus-Változatokon Alkalmazható Célállományok (Manual of Target Stands for Site Type Variants); ÁESZ (State Forest Service): Budapest, Hungary, 2005; p. 371. ISBN 963 218 531 5. (In Hungarian) [Google Scholar]
- Czimber, K.; Gálos, B. A new decision support system to analyse the impacts of climate change on the Hungarian forestry and agricultural sectors. Scand. J. For. Res. 2016, 31, 664–673. [Google Scholar] [CrossRef]
- Wang, T.; Hamann, A.; Spittlehouse, D.; Carroll, C. Locally downscaled and spatially customizable Climate data for historical and future periods for North America. PLoS ONE 2016, 11, e0156720. [Google Scholar] [CrossRef] [PubMed]
- Hamann, A.; Wang, T.; Spittlehouse, D.L.; Murdock, T.Q. A comprehensive, high-resolution database of historical and projected climate surfaces for western North America. Bull. Am. Meteorol. Soc. 2013, 94, 1307–1309. [Google Scholar] [CrossRef]
- Pásztor, L.; Laborczi, A.; Bakacsi, Z.; Szabó, J.; Illés, G. Compilation of a national soil-type map for Hungary by sequential classification methods. Geoderma 2018, 311, 93–108. [Google Scholar] [CrossRef]
- Fournier, R.A.; Guindon, L.; Bernier, P.Y.; Ung, C.H.; Raulier, F. Spatial implementation of models in forestry. For. Chron. 2000, 76, 929–940. [Google Scholar] [CrossRef] [Green Version]
- Béky, A. Mag eredetű kocsánytalan tölgyesek fatermése (Yield of seed-grown sessile oak stands). Erd. Kut. 1981, 74, 309–320, (In Hungarian with English summary). [Google Scholar]
- Mátyás, C.; Borovics, A.; Nagy, L.; Ujvári-Jármay, É. Genetically set response of trees to climatic change, with special regard to the xeric (retreating) limits. Forstarchiv 2010, 81, 130–141. [Google Scholar]
- Sáenz-Romero, C.; Lamy, J.B.; Ducousso, A.; Musch, B.; Ehrenmann, F.; Delzon, S.; Cavers, S.; Chałupka, W.; Dağdaş, S.; Hansen, J.K.; et al. Adaptive and plastic responses of Quercus petraea populations to climate across Europe. Glob. Chang. Biol. 2017, 23, 2831–2847. [Google Scholar] [CrossRef] [PubMed]
- Sáenz-Romero, C.; Kóczán-Horváth, A.; Nagy, L.; Ujvári-Jármay, É.; Ducousso, A.; Kremer, A.; Mátyás, C. Common garden comparisons confirm inherited sensitivity differences between conifer and broadleaved forest tree species to changing climate. Peer J. 2018, in press. [Google Scholar]
- Mátyás, C.; Kóczán-Horváth, A.; Kremer, A.; Saenz-Romero, C. Kocsánytalan tölgy populációk szimulált klímaváltozásra adott reakciónormája, származási kísérletek adatai alapján. (Reaction norm of selected sessile oak populations to simulated climatic change based on provenance test data). Erdészettud. Közl. 2018, 8, in press, (In Hungarian with English summary and captions). [Google Scholar]
- Berki, I.; University of Sopron, Sopron, Hungary. Personal communication, 2017.
- Gugerli, F.; Frank, A.; Rellstab, C.; Pluess, A.R.; Moser, B.; Ahrend, M.; Sperisen, C.; Wohlgemuth, T.; Heiri, C. Genetische Variation und lokale Anpassung bei Waldbaumarten im Zeichen des Klimawandels. In Wald im Klimawandel. Grundlagen für Adaptationsstrategien; Pluess, A.R., Augustin, S., Brang, P., Eds.; Haupt: Bern, Switzerland, 2016; pp. 93–113. ISBN 978-3-258-07995-0. [Google Scholar]
- Jump, A.S.; Hunt, J.M.; Peñuelas, J. Rapid climate change-related growth decline at the southern range edge of Fagus sylvatica. Glob. Chang. Biol. 2006, 12, 2163–2174. [Google Scholar] [CrossRef]
- Lindner, M.; Fitzgerald, J.; Zimmermann, N.; Reyer, C.; Delzon, S.; van der Maaten, E.; Schelhaas, M.J.; Lasch, P.; Eggers, J.; van der Maaten-Theunissen, M.; et al. Climate change and European forests: What do we know, what are the uncertainties, and what are the implications for forest management? J. Environ. Manag. 2014, 146, 69–83. [Google Scholar] [CrossRef] [PubMed]
- Gálos, B.; Somogyi, Z. Új klímaszcenáriók–fellélegezhetnek bükköseink? (New climate scenarios–smaller drought risk for Beech?). Erdészettud. Közlem. 2017, 7, 85–98, (In Hungarian with English summary). [Google Scholar] [CrossRef]
- Somogyi, Z.; Hidy, D.; Gelybó, G.; Barcza, Z.; Churkina, G.; Haszpra, L.; Horváth, L.; Machon, A.; Grosz, B. Modeling of biosphere–atmosphere exchange of greenhouse gases: Models and their adaptation. In Atmospheric Greenhouse Gases: The Hungarian Perspective; Haszpra, L., Ed.; Springer: Heidelberg, Germany, 2011; pp. 201–228. ISBN 978-90-481-9949-5. [Google Scholar]
- Somogyi, Z. Projected effects of climate change on the carbon stocks of European beech (Fagus sylvatica L.) forests in Zala County, Hungary. For. J. 2016, 62, 3–14. [Google Scholar] [CrossRef]
- Allen, C.D.; Macalady, A.K.; Chenchouni, H.; Bachelet, D.; McDowell, N.; Vennetier, M.; Kitzberger, T.; Rigling, A.; Breshears, D.D.; (Ted)Hogg, E.H.; et al. A global overview of drought and heat-induced tree mortality reveals emerging climate change risks for forests. For. Ecol. Manag. 2010, 259, 660–684. [Google Scholar] [CrossRef]
- Crookston, N.L.; Rehfeldt, G.E.; Dixon, G.E.; Weiskittel, A.R. Addressing climate change in the forest vegetation simulator to assess impacts on landscape forest dynamics. For. Ecol. Manag. 2010, 260, 1198–1211. [Google Scholar] [CrossRef]
- Carlowitz, H.C. Sylvicultura Oeconomica, ODER Hausswirthliche Nachricht Und Naturmässige Anweisung Zur Wilden Baum-Zucht; Hamberger, J., Ed.; Oekom Verl.: München, Germany, 2013; 638p, ISBN 978-3-86581-411-1. (In German) [Google Scholar]
- Jagicza, A.; Bakonyerdő State Forests Co., Veszprém, Hungary. Personal communication, 2016.
- Mátyás, C.; Kramer, K. Climate Change Affects Forest GENETIC Resources: Consequences for Adaptive Management; FORGER Policy Brief; Bioversity International: Rome, Italy, 2016; 4p. [Google Scholar]
- Valladares, F.; Matesanz, S.; Guilhaumon, F.; Araújo, M.B.; Balaguer, L.; Benito-Garóon, M.; Cornwell, W.; Gianoli, E.; van Kleunen, M.; Naya, D.E.; et al. The effects of phenotypic plasticity and local adaptation on forecasts of species range shifts under climate change. Ecol. Lett. 2014, 17, 1351–1364. [Google Scholar] [CrossRef] [PubMed] [Green Version]
- Food and Agriculture Organization of the United Nations (FAO). Forests and Climate Change Working Paper 15. From Reference Levels to Results Reporting: REDD+ Under the UNFCCC. 2017. Available online: http://www.fao.org/3/a-i7163e.pdf (accessed on 5 July 2018).
- Intergovernmental Panel on Climate Change (IPCC). 2013 Revised Supplementary Methods and Good Practice Guidance Arising from the Kyoto Protocol; Hiraishi, T., Krug, T., Tanabe, K., Srivastava, N., Baasansuren, J., Fukuda, M., Troxler, T.G., Eds.; IPCC: Geneva, Switzerland, 2014; ISBN 978-92-9169-140-1. [Google Scholar]
- Lakatos, M.; Szentimrey, T.; Bihari, Z.; Szalai, S. Creation of a homogenized climate database for the Carpathian region by applying the MASH procedure and the preliminary analysis of the data. Időjárás 2013, 117, 143–158. [Google Scholar]
- Climate of the Carpathian Region (CARPATCLIM). Available online: http://www.carpatclim-eu.org (accessed on 19 June 2018).
- Ensembles-EU. Available online: http://www.ensembles-eu.org (accessed on 19 June 2018).
- Nakićenović, N.; Alcamo, J.; Davis, G.; de Vries, B.; Fenhann, J.; Gaffin, S.; Gregory, K.; Griibler, A.; Jung, T.Y.; Kram, T.; et al. Special Report on Emissions Scenarios: A Special Report of Working Group III of the Intergovernmental Panel on Climate Change; Nakićenović, N., Swart, R., Eds.; Cambridge University Press: Cambridge, UK, 2000; p. 570. ISBN 0521800811. [Google Scholar]
- Moss, R.H.; Edmonds, J.A.; Hibbard, K.A.; Manning, M.R.; Rose, S.K.; van Vuuren, D.P.; Carter, T.R.; Emori, S.; Kainuma, M.; Kram, T.; et al. The next generation of scenarios for climate change research and assessment. Nature 2010, 463, 747–756. [Google Scholar] [CrossRef] [PubMed]
- Mastrandrea, M.D.; Field, C.B.; Stocker, T.F.; Edenhofer, O.; Ebi, K.L.; Frame, D.J.; Held, H.; Kriegler, E.; Mach, K.J.; Matschoss, P.R.; et al. Guidance Note for Lead Authors of the IPCC Fifth ASSESSMENT Report on Consistent Treatment of Uncertainties; Intergovernmental Panel on Climate Change (IPCC): Palo Alto, CA, USA, 2010; Available online: http://www.ipcc.ch/ (accessed on 19 June 2018).
- Rosenblatt, M. Remarks on Some Nonparametric Estimates of a Density Function. Ann. Math. Stat. 1956, 27, 832–837. [Google Scholar] [CrossRef]
- Silverman, B.W. Density Estimation for Statistics and Data Analysis; Chapman and Hall: London, UK, 1986; 175p, ISBN 0-412-24620-1. [Google Scholar]
- Ujvári-Jármay, É.; Nagy, L.; Mátyás, C. The IUFRO 1964/68 inventory provenance trial of Norway spruce in Nyírjes, Hungary—results and conclusions of five decades. Acta Silv. Lign. Hun. 2016, 12, 178. [Google Scholar] [CrossRef] [Green Version]
- Hanewinkel, M.; Cullmann, D.A.; Schelhaas, M.J.; Nabuurs, G.J.; Zimmermann, N.E. Climate change may cause severe loss in the economic value of European forest land. Nat. Clim. Chang. 2013, 3, 203–207. [Google Scholar] [CrossRef]
- Aitken, S.N.; Whitlock, M.C. Assisted Gene Flow to Facilitate Local Adaptation to Climate Change. Ann. Rev. Ecol. Evol. Syst. 2013, 44, 367–388. [Google Scholar] [CrossRef]
- Sittaro, F.; Paquette, A.; Messier, C.; Nock, C.A. Tree range expansion in Eastern North America fails to keep pace with climate warming at northern range limits. Glob. Change Biol. 2017, 23, 3292–3301. [Google Scholar] [CrossRef] [PubMed]
- BNatSchG. Gesetz zur Neuregelung des Rechts des Naturschutzes und der Landschaftspflege, Bundesnaturschutzgesetz. Novel Regulation of the Nature Conservation and Landscape Management Act. Paragraph 40, Fed Rep Germany. 2009. (In German). Available online: https://www.bfn.de/fileadmin/MDB/documents/themen/monitoring/BNatSchG.PDF (accessed on 5 July 2018).
- Reser, J.P.; Bradey, G.H.; Ellul, M.E. Public risk perceptions, understandings and responses to climate change. In Applied Studies in Climate Adaptation; Palutikoff, J.P., Boulter, S.I., Barnett, J., Rissik, D., Eds.; Wiley & Sons Ltd.: Hoboken, NJ, USA, 2014; pp. 43–50. [Google Scholar]
- Móricz, N.; Garamszegi, B.; Rasztovits, E.; Bidló, A.; Horváth, A.; Jagicza, A.; Illés, G.; Vekerdy, Z.; Somogyi, Z.; Gálos, B. Recent drought-induced vitality and growth decline of Black pine (Pinus nigra Arn.) in South-West Hungary—Is this drought-resistant species under threat by climate change? Forests 2018, 9, 414. [Google Scholar] [CrossRef]


| Climate Class | Low Limit | High Limit | PMay–August (mm) | TJuly–August (°C) |
|---|---|---|---|---|
| beech | - | <4.75 | 332 | 18.2 |
| hornbeam-oak | 4.75 | <6.00 | 288 | 19.4 |
| sessile/Turkey oak | 6.00 | <7.25 | 245 | 20.2 |
| forest steppe | 7.25 | <8.50 | 228 | 20.6 |
| grass steppe * | 8.50 | - | undefined | Undefined |
| Hydrology | Genetic Soil Type | Soil Depth | Soil Texture | Recommended Tree Species *, Expected Yield (Decimal) and Number of Entries | |||||
|---|---|---|---|---|---|---|---|---|---|
| Climate Classes | |||||||||
| Beech | Hornbeam-Oak | Sessile-Turkey OAK | Forest Steppe (Woodland) | Steppe (Extrapolated Model Data) | Steppe (Validated by Field Expertise) | ||||
| rain-fed site | sandy brown forest soil | medium | Coarse sand | TU 1.6 2 PE 1.4 3 SC 2.5 2 BE 1.9 2 | TU 2.3 11 RO 2.3 11 PE 1.9 7 SC 2.6 7 WH 2.0 7 | TU 2.1 16 RO 2.2 15 PE 1.9 7 SC 2.2 11 WH 1.7 13 | TU 1.9 14 RO 2.1 12 SC 1.9 10 WH 1.4 1 PE 1.7 4 | TU 1.8 6 RO 2.0 5 SC 1.8 6 WH 1.3 7 | AU 1.2 WH 1.2 |
| rain-fed site | sandy brown forest soil | medium | sand | PE 2.0 5 TU 2.4 4 SC 2.9 4 BE 2.4 4 | TU 2.3 12 PE 1.9 9 RO 2.3 11 SC 2.7 8 RE 2.9 6 | TU 2.2 20 RO 2.3 18 PE 1.9 11 SC 2.3 13 WH 1.8 14 | TU 2.0 17 RO 2.2 15 SC 2.0 12 WH 1.6 12 PE 1.8 6 | TU 1.9 8 RO 2.1 7 SC 1.9 7 WH 1.4 8 | AU 1.4 SC 1.4 WH 1.4 |
| Approach (Data Used, Author) | Maximum Performance (FAI) | 50% of Performance (FAI) | Ecodistance (Change) (ΔFAI) |
|---|---|---|---|
| Site descriptors vs. growth (Czimber) | 4.0 | 6.7 | 2.7 |
| Inventory data vs. low site potential (Illés) | 4.0 | 6.5 | 2.5 |
| Inventory data vs. high site potential (Illés) | 4.0 | 7.5 | 3.5 |
| Stand density vs. climate (Berki) | 4.5 | 8.0 * | 3.5 * |
| Provenance tests vs. climate (Mátyás) | - - | - - | 7.7 |
| Past climate shift 1961–1990 vs. 1981–2010 ** | 0.56 | ||
| Projected change, 1981–2010 vs. 2021–2050 ** | 1.01 | ||
| Projected change, 1981–2010 vs. 2041–2070 ** | 1.62 |
© 2018 by the authors. Licensee MDPI, Basel, Switzerland. This article is an open access article distributed under the terms and conditions of the Creative Commons Attribution (CC BY) license (http://creativecommons.org/licenses/by/4.0/).
Share and Cite
Mátyás, C.; Berki, I.; Bidló, A.; Csóka, G.; Czimber, K.; Führer, E.; Gálos, B.; Gribovszki, Z.; Illés, G.; Hirka, A.; et al. Sustainability of Forest Cover under Climate Change on the Temperate-Continental Xeric Limits. Forests 2018, 9, 489. https://doi.org/10.3390/f9080489
Mátyás C, Berki I, Bidló A, Csóka G, Czimber K, Führer E, Gálos B, Gribovszki Z, Illés G, Hirka A, et al. Sustainability of Forest Cover under Climate Change on the Temperate-Continental Xeric Limits. Forests. 2018; 9(8):489. https://doi.org/10.3390/f9080489
Chicago/Turabian StyleMátyás, Csaba, Imre Berki, András Bidló, György Csóka, Kornél Czimber, Ernő Führer, Borbála Gálos, Zoltán Gribovszki, Gábor Illés, Anikó Hirka, and et al. 2018. "Sustainability of Forest Cover under Climate Change on the Temperate-Continental Xeric Limits" Forests 9, no. 8: 489. https://doi.org/10.3390/f9080489