Coarse Woody Debris Variability Due to Human Accessibility to Forest
by
 , , and
Farshad Keivan Behjou
1, 
Angela Lo Monaco
2,*,
Farzam Tavankar
3,
Rachele Venanzi
2,
Mehrdad Nikooy
4,
Piotr S. Mederski
5 and
and
Rodolfo Picchio
2
1
Department of Natural Resources, University of Mohaghegh Ardabili, Ardabil 5619911367, Iran
2
Department of Agricultural and Forestry Sciences, Tuscia University, 01100 Viterbo, Italy
3
Department of Forestry, Khalkhal Branch, Islamic Azad University, Khalkhal 5613156491, Iran
4
Department of Forestry, Faculty of Natural Resources, University of Guilan, Somehsara 4199613776, Iran
5
Faculty of Forestry, Department of Forest Utilisation, Poznań University of Life Sciences, ul. Wojska Polskiego 71A, 60-625 Poznań, Poland
*
Author to whom correspondence should be addressed.
Forests 2018, 9(9), 509; https://doi.org/10.3390/f9090509
Submission received: 25 July 2018
/
Revised: 11 August 2018
/
Accepted: 21 August 2018
/
Published: 23 August 2018
(This article belongs to the Special Issue Effects of Forest Management Practices on Forest Biodiversity)
Abstract
:Coarse woody debris (CWD) plays an important role in supporting biodiversity and assisting ecological processes. Sometimes local people intervene modifying the expected distribution of CWD components, harvested as fuel wood. The effect of the human accessibility (HA) on the volume and characteristics of CWD (snag, downed log and stump) was investigated in the natural uneven-age mixed hardwood stands of the Hyrcanian forests of Iran to quantify the impact on CWD. The HA was classified into three classes (easy, medium and difficult) on the basis of slope class, slope direction to the nearest road and road type. As expected, a negative relationship between the degree of accessibility was found with respect to the main qualitative and quantitative indices referring to CWD. The results showed that the volume of CWD decreased with an increase in human accessibility class (HAC), thus the mean volume of CWD in the difficult, medium and easy accessibility classes were 14.87 m3 ha−1, 8.84 m3 ha−1 and 4.03 m3 ha−1, respectively. The decrease in CWD volume was more associated with the decreasing volume of small diameter of low decayed downed logs. The ratio of snag volume to standing volume, the ratio of downed log volume to the volume of trees and the ratio of CWD volume to standing volume increased with a decrease in HAC, while the ratio of downed log volume to snag volume decreased with a decrease in HAC. No selective behaviour on the botanical species of CWD was recorded. For ecological forest management, the effect of HAC on CWD should be considered. A constant supply of snags and downed logs must be preserved to assure a high level of biodiversity. To balance social needs and biodiversity requirements, an increased level of CWD retention might be needed in areas with easy accessibility. The obtained results may be useful when ecological and socio-economical needs have to be taken into consideration in future policy-making decisions.
1. Introduction
Coarse woody debris (CWD) plays an important role in supporting biodiversity [1] and assisting ecological processes [2]. CWD is produced by natural processes such as tree mortality and decomposition, depending on site productivity and in managed forests, even throughout silvicultural activities. Sometimes the involvement of local people intervenes modifying the expected distribution of CWD components.
CWD was reported as an important environmental element and essential for maintaining biodiversity in forests [3,4,5]. On the other hand, CWD is used by local people as fuel wood, one of the primary energy source and the demand for fuel wood over the next few years in these forests is certain to increase [6]. In the Hyrcanian forests of Iran, there are approximately 3400 villages for about 74,000 households, whose annual consumption of wood is between 1.44 and 2.22 million m3, for heating, cooking and other uses [6].
Forest roads have a direct and indirect effect on the density and characteristics of CWD. Prasad [7] studied the role of roads on the tree community in a tropical dry forest and reported that tree death near roads was more than double that in distant areas, suggesting that roads may increase tree death. The construction of forest roads increases the tree mortality rate due to mechanical damage and increased snag (one element of CWD) density, especially along road edges [8,9,10]. Trees on embankment slopes are damaged by rock-fall during road construction, especially in the areas with steep slopes [9,11,12,13]. In addition, in forests managed by selection cutting, such as Hyrcanian forests, snag density on road edges is greater than on interior stands due to skidder-logging damage [14]. In contrast, forest roads decrease CWD density by facilitating accessibility to the cutting, collection and extraction of CWD for fuel wood by rural people [15,16].
In addition to the forest roads, stand density, slope degree and distance or proximity to villages are also factors affecting the amount of CWD consumed as fuelwood by local people. It is difficult to extract CWD in dense stands, residual trees may be damaged and injuries can lead to decay or mortality [17,18,19]. The collection and extraction of CWD is complex with increasing slope degree, especially when extraction is uphill. Wisdom and Bate [6] demonstrated that the number of snags in stands near villages is lower than in stands further away.
The succession stage of the forest was also reported as having an effect on the amount of CWD in the Hyrcanian mixed beech forests [2], with the amount of CWD higher at the end stages than at the early stage. Wisdom and Bate [16] reported a significant direct relationship between logging intensity and number of snags. Tavankar et al. [20] found out that management methods have a significant effect on the density and characteristics of snags.
Deadwood has a wide range of ecological values in forest ecosystems, offering habitats for many living organisms [21,22,23,24,25], according to some authors providing carbon sequestration [26,27] and forest productivity preservation, as well as contributing to soil development and to nutrient cycles [28,29,30]. A higher volume of deadwood in managed forests is often encouraged in best practice recommendations for sustainable management [31]. In many countries, silvicultural regulations have been introduced to create deadwood over time, conserving unhealthy and senescent trees as potential sources of CWD. Sometimes special laws are implemented to protect some trees from harvesting until natural death and decomposition. The amount and type of deadwood and its continuity were recognized as indicators of naturalness and estimators of human activity [32]. CWD is also included as biomass (only with ecological implications) to be measured in many National Forest Inventories [33,34,35,36]. The PEFC (Programme for the Endorsement of Forest Certification) and FSC (Forest Stewardship Council) certification schemes for forest management require CWD management. In recent years, CWD was also added as a proper indicator within criterion 4 (Maintenance, Conservation and Appropriate Enhancement of Biological Diversity in Forest Ecosystems) of Forest Europe [37]. Pan-European criteria recognize the value of deadwood as a sustainable management indicator and the standards for forest management certification point to its assessment but they also require an evaluation of the social impact attributed to active forest management.
Since wood is recognized as a resource for the rural community, the right to collect downed dry logs or branches for fuel wood from the forest floor, usually based on customary or consuetudinary law, is not only observed in Iran but also elsewhere. A decrease in decomposing inside forests could become a critical issue for sustainable forest management. However, social instances must be taken into account along with economic and environmental aspects.
Forest management, timber harvest and human access can have substantial effects on CWD density [16,38,39]. Coarse woody debris (CWD) has high ecological and conservation value, such as maintaining biodiversity in forest ecosystems. Forest practices such as shorter rotations, firewood removal, timber stand improvement, insect and disease control efforts have limited the number of snags and downed logs available for wildlife habitat. Maintaining deadwood in suitable abundance and stages of decay is critical to the preservation of biodiversity and the sustained functioning of forest ecosystems [40].
In presented research accessibility was taken into consideration as a parameter that favours the removal of deadwood. The main goal of this study was to assess the effects of the level of human accessibility on the volume and structure of CWD in the Hyrcanian forests of Iran. Aims included acquiring further knowledge in regards of the management of CWD in relation to social aspects, in this case measured as forest accessibility. With these in mind, it was investigated whether accessibility had an effect on quantity, type (downed logs, snags or stumps) and characteristics (size, decay status, species) of CWD.
This research provides information for forest managers working to balance the community’s need for firewood with the needs of the environment and sustainable forest resource use.
2. Materials and Methods
2.1. Study Area
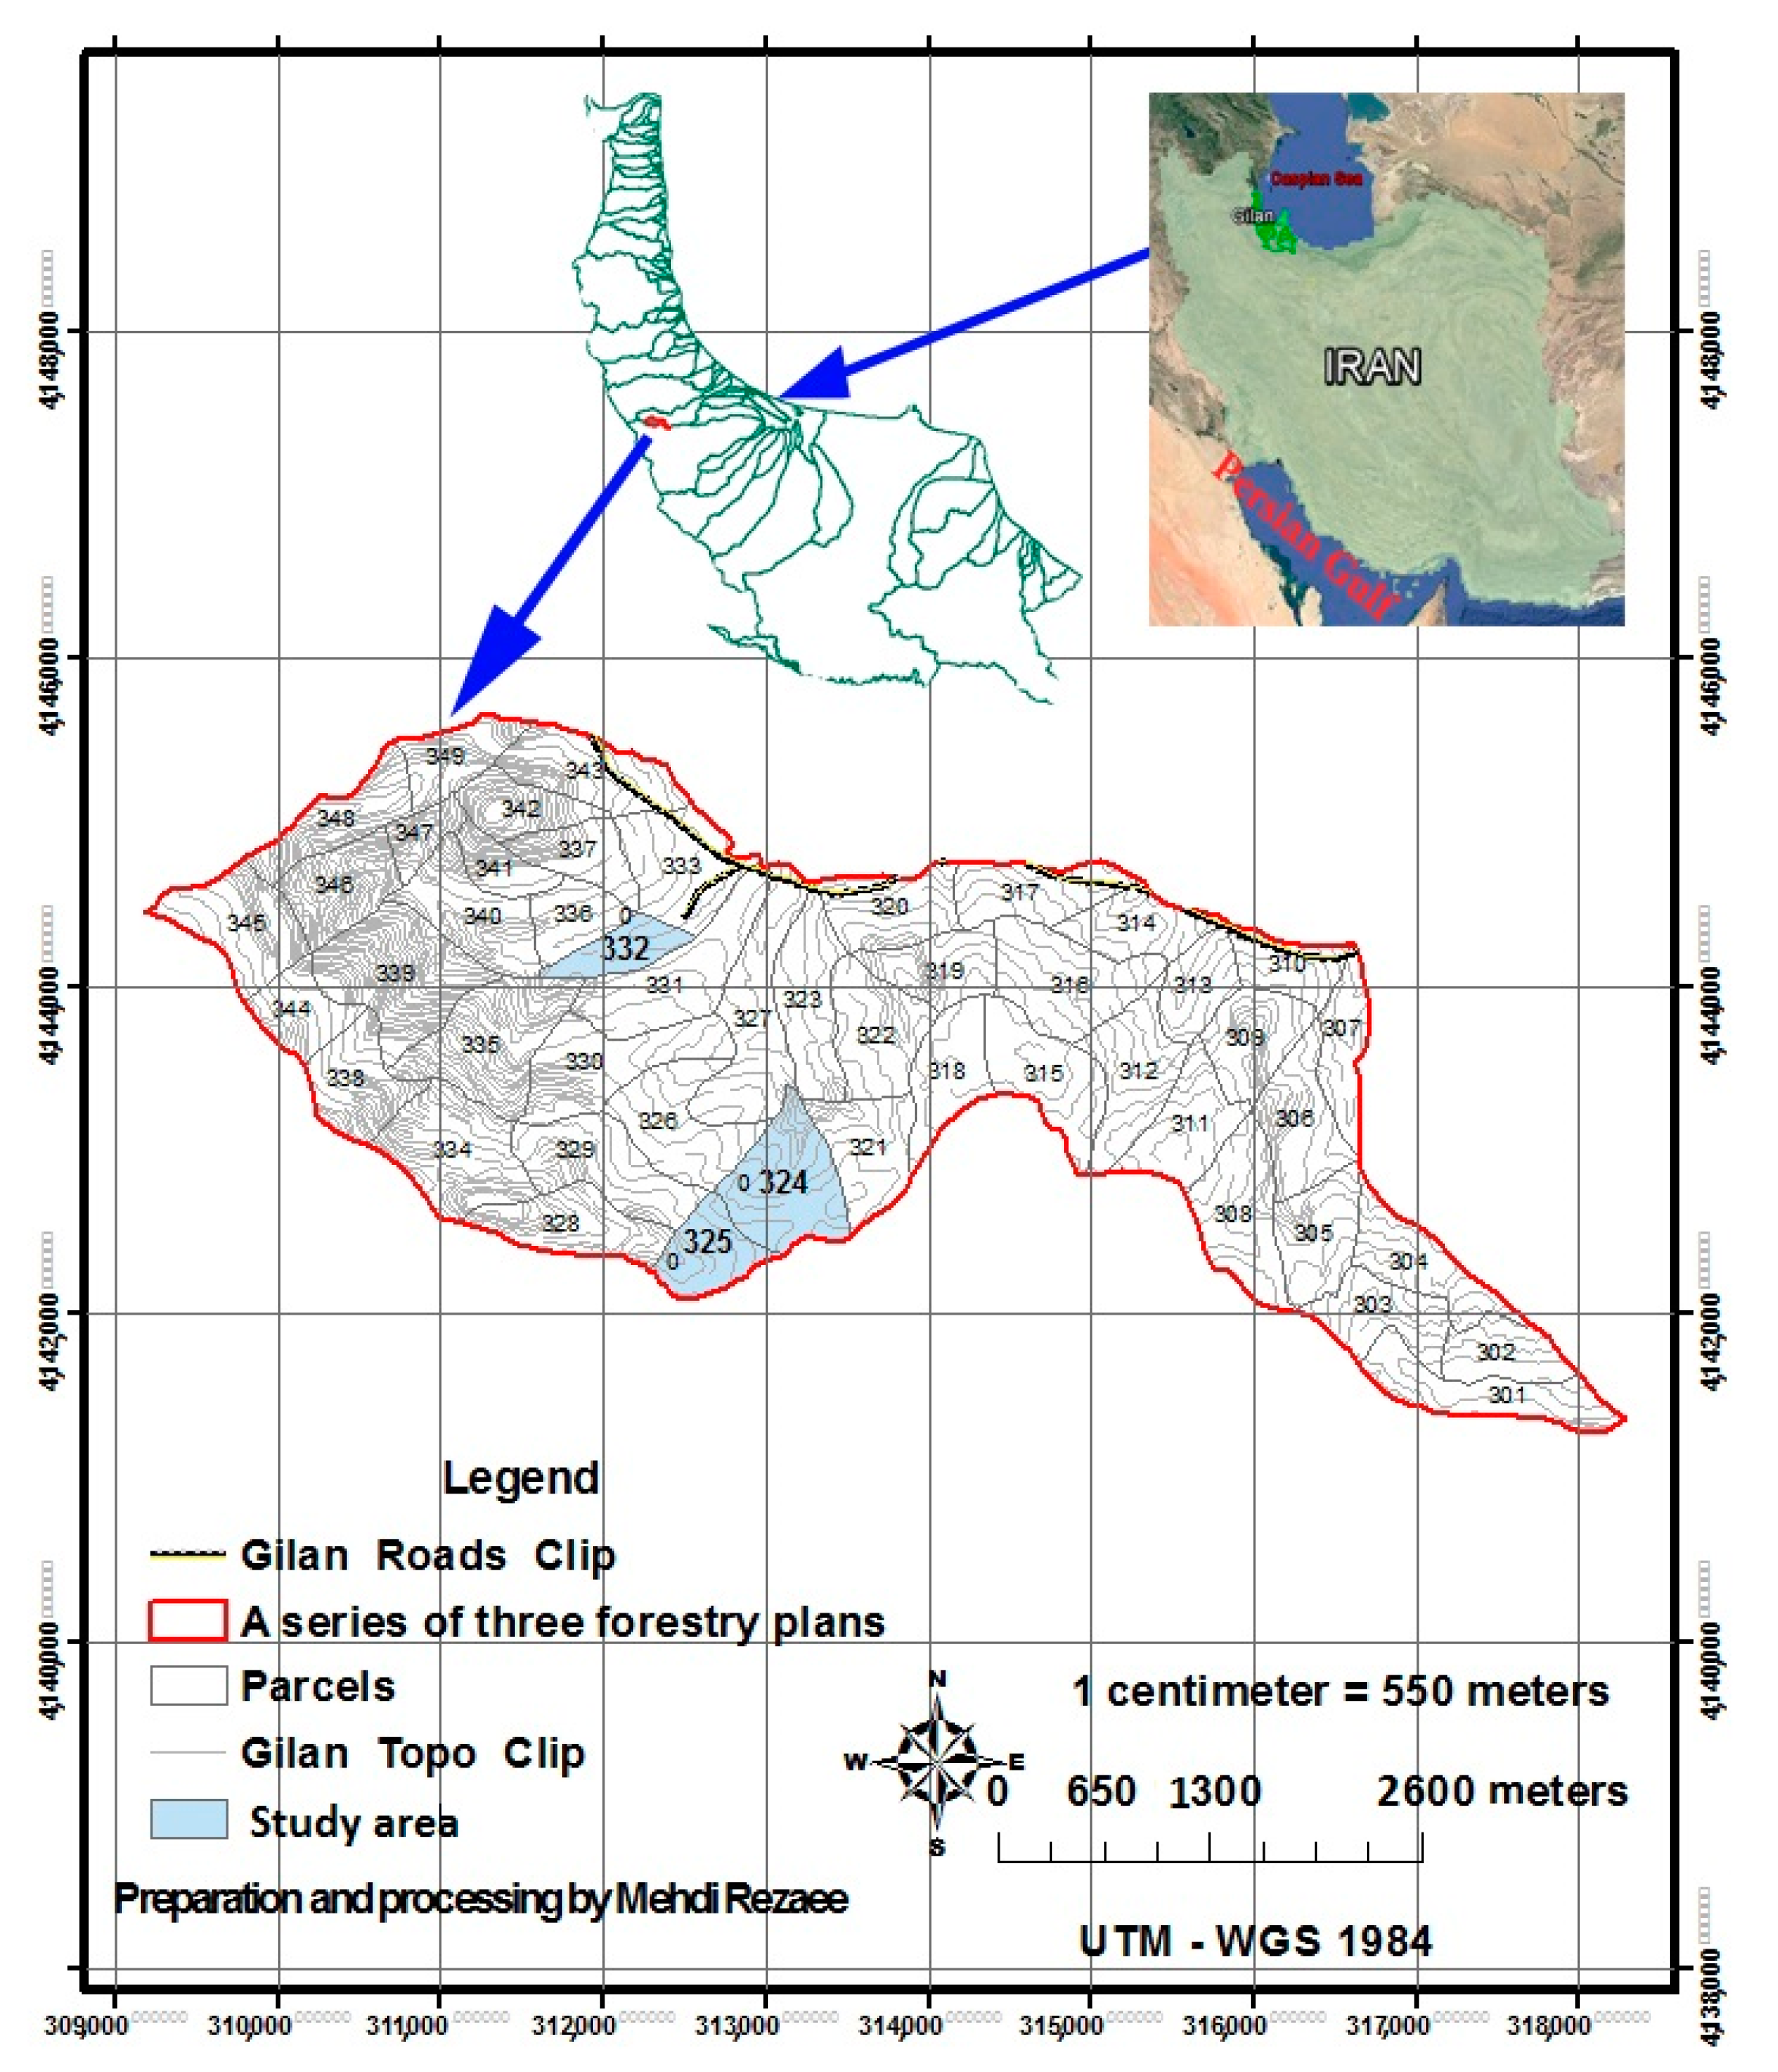
This study was carried out in the Hyrcanian forests of northern Iran (Figure 1).
They are suitable habitats for a variety of hardwood species (approximately 80 forest species) and include various forest types. These stands were managed until 2000 by shelter wood cutting and then by selection cutting silviculture (close to a natural method) until 2015. Afterwards, timber harvesting from these forests was limited to the harvesting of damaged trees, including broken, fallen, uprooted, infested and infected trees. Logging operations in these forests were generally performed using a ground-based skidding system. Chainsaws and cable skidders were two of the main logging equipment for wood harvesting and extracting. The study area was located in District No. 3 of the Shanderman forests in the Guilan province. Three parcels, numbers 324 (47.3 ha), 325 (54.0 ha) and 332 (51.0 ha) were selected (Figure 1). The vegetation of this area was made up of uneven-age mixed forest dominated by beech (Fagus orientalis Lipsky) (46%) and hornbeam (Carpinus betulus L.) (23%), with the companion species Alder (Alnus subcordata C.A. May) (13%), Norway maple (Acer platanoides L.) (7%), Cappadocian maple (Acer cappadocicum Gled.) (6%), Wych elm (Ulmus glabra Huds.) (3%) and lime-tree (Tilia rubra DC.) (2%). The canopy cover was ca. 90% and the parcels were at the mid successional stage.
The elevation in the study area ranges from 1150 to 1350 m a.s.l. in North and North-West areas. The mean annual precipitation is approximately 1100 mm and the average annual temperature is 8.9 °C. The vegetation period lasts for 7 months on average. The soil of the study site is classified as a brown soil (Alfisols), which is well-drained and the soil texture varies between sandy clay loam to clay loam.
2.2. Data Collection
Data collection was carried out through a design-based approach, a statistical approach that establishes the choosing methods and uses of the sites, allowing possible pseudo-replication problems to be overcome [41]. The study sites (parcels) were stratified according to accessibility level on the basis of three importance factors: slope degree, slope direction (taking into account wood collection uphill or downhill) and road type [15,16], attributing each plot to a class of accessibility: easy (EAC), medium (MAC) and difficult (DAC) (Table 1 and Table 2).
Data were collected from circular sample plots with an area of 0.1 ha. The sample plots were located in the parcels using a systematic grid (100 m × 100 m) with a random starting point in each parcel.
Each parcel was characterized by measuring slope percentage using a clinometer along each 10 m segment in the direction of the sample plot centre to the nearest road. The average of these slope measurements was considered as slope percentage for each sample plot and then classified into three slope classes: <20, 20–40 and >40%. This classification was done on the basis of the average effective capacity for a man to extract 30 kg of wood on these slopes.
Slope direction for collecting wood was characterized during field sampling as (I) flat, (II) uphill or (III) downhill to the nearest road in each sample plot. In other words, the plots, which were situated below the nearest road and in which the direction of CWD extraction was towards the top of the slope, were considered as “uphill” (difficult extraction). The plots, which were situated above the nearest road, with a downward CWD collecting direction, were considered “downhill” (easy extraction).
On the basis of the authors’ knowledge and in order to implement this study, road types were classified as (I) adjacent open, (I) adjacent closed and (III) non-adjacent. Adjacent was defined as any road within 5 m of the stand boundary. Non-adjacent referred to stands without any adjacent roads. The open roads were those open to public use throughout the year. Closed roads were those not open to public use throughout the year.
Initially, 150 plots were classified by the factors influencing accessibility: slope, slope direction for wood collection and road type (Table 1). The plots showed different frequencies, so the three more frequent cases were chosen as the three Human accessibility classes (Table 1). 30 sample plots were randomly selected in each accessibility class. The final number of sample plots selected for study was 90.
The diameter at breast height (dbh) of all the tree species was measured in each sample plot and their stem volumes were calculated by local volume tables [42]. Snags (dbh ≥ 10 cm), downed logs (minimum diameter ≥ 10 cm and length ≥1 m) and stumps (defined as cut tree remains) were examined in each plot as Coarse Woody Debris (CWD). Species, dbh, height, volume, percentage of bark cover and decay class were recorded for each sampled snag, downed log and stump. The botanical species of the CWD was assessed from the bark and anatomical wood characteristics. The dbh was recorded to the nearest cm using a dbh tape. The height of the snags and the length of the downed logs were measured with a meter stick. For snags taller than 4 m, a clinometer was used to estimate the height. Volume was calculated using Huber’s formula: V = Amh, where V was volume (m3), Am was mid-point cross-sectional area (m2) and h was height (m). Bark coverage was visually estimated. The decay class of the snags, logs and stumps was divided into 5 classes. [43] (Table 3) later named: DC1, DC2, DC3, DC4 and DC5.
2.3. Data Analysis
The ratio of snag volume to stand volume (RSS) was calculated according to a snag-creation index (snag-dynamic indicator) (Equation (1)). For the downed-log creation index, the ratio of downed-log volume to volume of standing live trees (RDT) was also used (Equation (2)). For comparing snag longevity, the ratio of downed-log volume to snag volume (RDS) was calculated for each snag species and for each accessibility class (Equation (3)). In addition, the ratio of stump volume to volume of standing live trees (RST) was calculated as harvest intensity (Equation (4)) and the ratio of CWD volume to stand volume (RDW) was calculated for each accessibility class (Equation (5)).
where RSS is snag-creation index, RDT is downed-log creativity, RDS is snag longevity index, RST is harvest intensity index, RDW is CWD volume index, SGV is snag volume, SDV is stand volume, DLV is downed-log volume, LTV is volume of standing live trees, SPV is stump volume and CWDV is volume of CWD.
RSS = SGV/SDV
RDT = DLV/LTV
RDS = DLV/SGV
RST = SPV/LTV
RDW = CWDV/SDV
After checking for normality (using the Kolmogorov-Smirnov test) and homogeneity of variance (the Levene test), the means of the CWD (snag, downed log and stumps) density, volume, dbh, decay, species and CWD ratios (RSS, RDT, RDS, RST and RDW) were compared using one-way ANOVA in the areas of accessibility class. Multiple comparisons post hoc analysis were made using the Tukey HSD test (significance at α < 0.05). SPSS 19.0 software (SPSS Inc., Chicago, IL, USA) was used for statistical analysis. Non-metric multidimensional scaling (NMDS) was applied to compare the three accessibility classes, for the main quality-quantitative indices referring to the CWD situation. The results of the analyses were also presented using descriptive statistics.
3. Results
3.1. Accessibility CWD Classes and CWD Amount
The plots were associated with one of the three human accessibility classes (HAC) and the slightly lower stand volume was observed in the MAC (Table 4).
ANOVA tests showed no statistically significant difference in tree density between the HAC’s, while a statistically significant difference was found in stand volume between the HAC’s. The highest density was in the DAC (171.5 stem ha−1) and the lowest was in the EAC (166.1 stem ha−1). In addition, the highest stand volume was in the EAC (309.2 m3 ha−1) and the lowest amount was in the MAC (262.8 m3 ha−1).
3.2. Components of CWD
Total volume of CWD was the highest in DAC and the lowest in EAC (Table 5).
The ANOVA results showed that stand accessibility class had a significant effect on the total volume of CWD, snag volume and downed-log volume (p < 0.01), while it had no significant effect on stump volume (p = 0.174). The results of the Tukey test showed that the mean volume of CWD in the difficult accessibility class (DAC) (14.9 m3 ha−1) was significantly higher than the mean volume of CWD in the medium accessibility class (MAC) (8.8 m3 ha−1) and the mean volume of CWD in the easy accessibility class (EAC) (4.0 m3 ha−1). The mean volume of CWD in the MAC was significantly higher than the mean volume of CWD in the EAC (Table 5).
The mean volume of snags in the DAC (8.2 m3 ha−1) was significantly higher than the mean volume of snags in the MAC (4.1 m3 ha−1) and EAC (0.9 m3 ha−1). In addition, the mean volume of snags in the MAC was significantly higher than the mean volume of snags in the EAC.
The mean volume of downed logs in the DAC (5.2 m3 ha−1) was significantly higher than the mean volume of downed logs in the MAC (3.0 m3 ha−1) and DAC (1.7 m3 ha−1). Furthermore, the mean volume of downed logs in the MAC was significantly higher than the mean volume of downed logs in the EAC.
The mean stump volume in the MAC (1.7 m3 ha−1) was higher than in the DAC (1.4 m3 ha−1) and EAC (1.2 m3 ha−1) but these differences between the mean values of stump volumes were not statistically significant. The snag volume was the highest in the MAC (46.5%) and DAC (55.4%), while the downed-log volume was the highest in the EAC (48.6%). The stump component exhibited the lowest volume in each accessibility class.
3.3. Decay Class of CWD
The ANOVA results indicated that the accessibility class had a significant effect (p < 0.01) on CWD volume in all decay classes (Table 6).
The mean volume of CWD in the DAC was greater than the mean volume of CWD in the MAC, and in the MAC it was greater than in the EAC in each decay class. The volume of CWD increased from DC1 to DC5 in the EAC and MAC, while this trend was not found in the DAC, where the highest CWD volume was in DC3 and the lowest was in DC2.
3.4. Species of CWD
The ANOVA results indicated that the accessibility class had a significant effect (p < 0.01) on the CWD volume of all tree species (Table 7).
The results of the Tukey tests also showed that the mean CWD volume of each species in the DAC was significantly higher than in the MAC and in the MAC, it was significantly higher than in the EAC.
3.5. Diameter of CWD
The results of the ANOVA tests indicated that accessibility class had a significant effect (p < 0.01) on snag volume and downed-log volume in all diameter classes (Table 8).
Accessibility class had a significant effect (p < 0.01) on stump volume only in dbh classes higher than 26 cm. The results of the Tukey test showed that the snag volume and downed-log volume in the DAC was significantly higher than in the MAC and in the MAC, it was significantly higher than in the EAC. Snag and downed log volumes increased with an increase in their diameters in the three accessibility classes.
3.6. RSS, RDT, RST, RDW and RDS
The ANOVA and Tukey tests showed that the human accessibility class (HAC) had a significant effect (p < 0.01) on the RSS (Snag/Standing volume) (Figure 2a). The RSS value in the DAC was significantly higher than in the MAC and in the EAC. The ANOVA and Tukey tests also showed that the human accessibility class (HAC) had a significant effect (p < 0.01) on the RDT (Downed logs/Trees) (Figure 2b). The RDT value in the DAC was significantly higher than in the MAC and in the EAC. Furthermore, the ANOVA and Tukey tests showed that the human accessibility class (HAC) had a significant effect (p < 0.01) on the RST (Stump/Trees), (Figure 2c). The RST value in the MAC was significantly higher than in the DAC (0.47%) and in the EAC. In addition, the ANOVA and Tukey HSD tests showed that the human accessibility class (HAC) had a significant effect (p < 0.01) on the RDW (CWD/standing volume) (Figure 2d). The RDW value in the DAC was significantly higher than in the MAC (3.37%) and in the EAC.
Finally, the ANOVA and Tukey tests showed that the human accessibility class (HAC) had a significant effect (p < 0.01) on the RDS (Downed logs/Snag) (Figure 3). The RDS value in the EAC (217.6%) was significantly higher than in the MAC (73.2%) and in the EAC (63.5%).
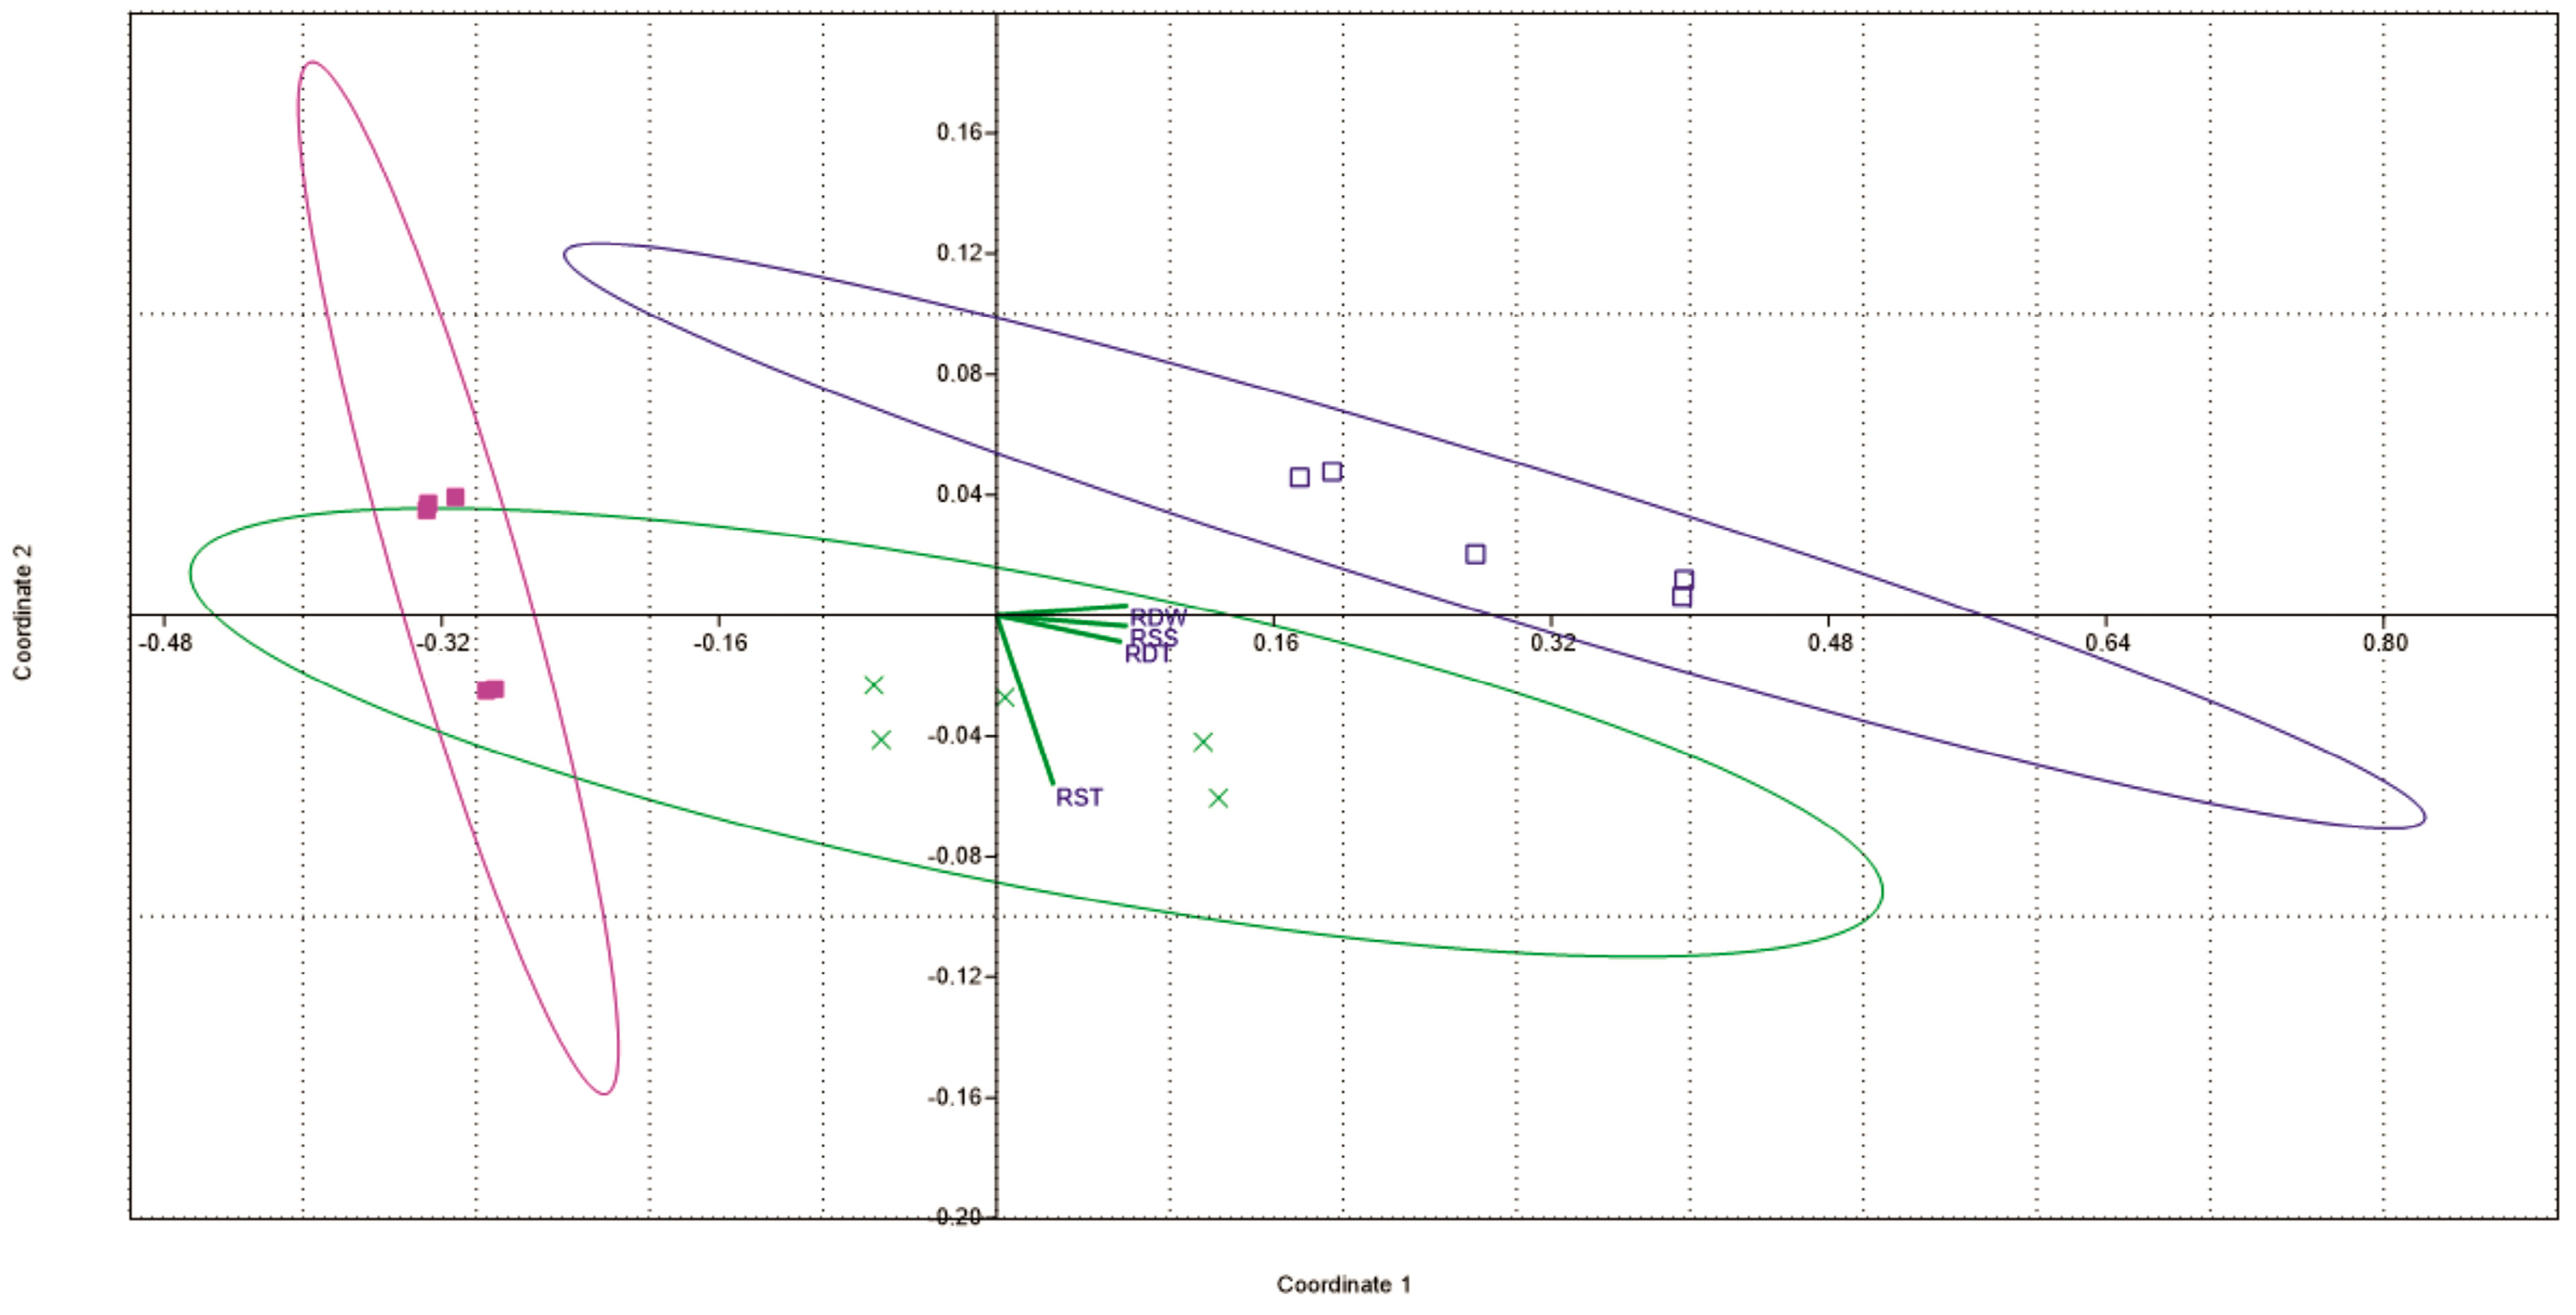
Principal non-metric multidimensional scaling (NMDS) tests produced a 2-dimensional ordination that provided significantly more reduction in stress than expected by chance (α = 0.05). When considering RSS, RDT, RST and RDW, the 2 axes explained 94.9% of the overall variance. Four parameters correlated well with the ordination axes. The parameters explaining most of the coarse wood debris (CWD) composition and distribution along axis 1 were RSS, RDT and RDW (Figure 4).
The CWD arrangement along axis 2 was dominated by RST (Figure 4). The NMDS for the three accessibility classes (Figure 4) showed a negative relationship between the degree of accessibility and the main indices referring to CWD (RSS, RDT, RST and RDW). In particular, the class MAC was the most heterogeneous in terms of quantity for types of CWD, while in the class DAC, the environmental quality of CWD was higher than in the other two classes.
4. Discussion
The data collected demonstrate that the human accessibility level affects the volume and characteristics of CWD. The fuel wood collection modifies the characteristics of CWD in total volume amount, in volumes of both snags and downed logs, in decay class distribution as well as in species and diameter class distribution. Local people operates a selection on CWD driven by accessibility and decay condition.
4.1. Human Accessibility Classes and CWD Amount
The total volume of CWD in the study area showed a high variability in relation to human accessibility classes (HAC) and differences statistically significant between the classes. Several studies deal with the amount of CWD focusing on the causes of different management and environmental situations. Forest management intensity affects the deadwood volume, which decreases from extensive management to intensive management [44]. Several studies showed that the volume of CWD in natural forest stands is proportional to the biomass of living trees at the site [45,46,47], although an amount of CWD varying greatly was found. In reserves characterized by beech forests in Europe, Christensen et al. [48] indicated an average volume of 130 m3 ha−1, a value varying greatly which can exceed 700 m3 ha−1 in reserves with a long history of protection. In semi-natural temperate broadleaf woodland, Norden et al. [49] found an amount of deadwood similar to that found in this study, highlighting the great variability of the data. They also noticed that it was more than twice as much as in production forests. Managed forests show a CWD volume lower than in unmanaged forests [44,50,51]. High variability even characterizes the CWD amount in the Hyrcanian forests. In northern Iran, in uneven-age forest dominated by Fagus orientalis Lispsky, the deadwood ranged from 37 to 119 m3 ha−1 in an unmanaged stand [52]. The Nav district, an area which has been protected since 1965, showed a CWD volume two times higher than in a managed forest with a selection cutting system [5]. Behjou et al. [53] detected a statistical difference in the CWD volume between managed forests (8.62 m3 ha−1) and unmanaged ones (22.01 m3 ha−1). In managed forests, Behjou et al. [53] found amounts similar to those found in the EAC in this study. Sefidi and Marvie Mohadjer [54] recorded the lowest CWD volume in the mid-successional stage (25.95 m3 ha−1) along a chronosequence of secondary beech forest succession of Northern Iran. Sefidi et al. [2], for a beech-dominated forest located in the mid elevations of the Alborz Mountains, verified the volume of coarse woody debris ca. 15 m3 ha−1. The study area was in a mid-successional stage and the tree density showed no difference statistically significant between the accessibility classes. Therefore, the stand conditions of the three cases were comparable. In addition, the stumps are the evidence of past harvesting activity and represent a proxy of removed trees and wood volume in recent times [55]. In the study area, the stump volumes are a clear indicator of the homogeneity of the management activity, since they show similar features [51,56]. It should be stressed that the local population does not have permission to cut standing trees, therefore stumps were not created by rural people. On the contrary, stumps were created by foresters during selection cuttings. The silvicultural treatment in the study areas was not a differentiation driver of CWD, as shown by the stand characteristics found. The human accessibility class (HAC) to the stand was the factor driving the amount of coarse woody debris (CWD). CWD decreased significantly with an increase in human accessibility level to the stand. Bate et al. [15] found similar evidence in the forests of North-eastern Oregon. Marquez-Reynoso et al. [57] noticed that the main criteria determining the collection of firewood were proximity and access to stands, located in the northwest part of Chiapas, Mexico.
4.2. Components of CWD
The total amount and the attributes of CWD in managed forests could be modified by anthropogenic disturbance [58,59].
In effect, in the study area, the stump contribution to the total volume of CWD increased due to the log and snag component decreasing with the ease of access. Similarly, the percentage distribution of stump volume in diameter class was similar in the different accessibility classes. Stump volume in each accessibility class increased with an increase in stump diameter but the increase was not equal in the different accessibility classes, therefore these had a significant effect on stump volume in higher diameter classes. Stump importance was recognised in the conservation of the biodiversity of organisms living in wood, even species on the red list. Andersson et al. [60] observed that stumps were occupied by assemblages of saproxylic beetles. Svensson et al. [61] determined that stumps were the most important substrate for wood-dependent lichens in the managed forest.
Generally, the amount of downed log volume is usually larger than snag volume [44,62,63]. In this study, only the EAC followed this pattern, while the MAC and DAC showed higher numbers of snags. Snags often originate through natural mortality due to tree competition which often depends on stand density [64]. Garbarino et al. [65] noted that stands with higher density were detected farther from roads. D’Amato et al. [66] observed a higher number of snags in steep terrain. Therefore, the greater density in the DAC and MAC might explain the higher number of snags. Wisdom and Bate [16] observed the highest mean density of snags in stands far from roads and found an evident cause-effect relationship between increased human access and reduced snag density. In the lowland forest in Iran, similar results were found. Tavankar et al. [20] observed that in open access forest, the snag number and volume were lower than in selectively-logged and in fully protected forest.
4.3. Decay Class of CWD
The results indicated that with increasing decay level, the volume of CWD increased in the EAC and in the MAC. In the EAC plots, the significantly lower amount of CWD in each decay class is due to human pressure in collecting firewood. The amount of lower decayed wood in the EAC and MAC is evidently caused by local people, which prefer wood of better quality and easy to extract.
The deadwood decay process is complex and depends on a great number of factors, sometimes inter-linked: botanical species, forest age and management, climate and moisture content, the insect and fungi community [67,68,69]; CWD size and fragmentation contributes to the decay rate [57]. It must be noted that snags show a decay rate lower than logs [70,71,72]. Decaying wood retains moisture and has an important role in forest regeneration and in microhabitat preservation [73,74]. Numerous wildlife functions depend on decaying wood as a source of food, nutrients and protection for organisms at diverse trophic levels [72,75,76,77,78]. Suitable density and different decay stages of snags are critical for the preservation of biodiversity and the constant functionality of forest ecosystems [40,79]. Müller et al. [68] observed that many saproxylic beetles benefit from former fungal colonization, increasing species numbers in higher stages of wood decay. The level of snag decay is another important factor driving management decisions in sustainable forest management [62,77]. In order to maximize wildlife benefits and, more generally, biodiversity protection, a variety of CWD decay classes is necessary. The forest manager needs to know that the effect of removing deadwood in the more accessible areas is long lasting, as the CWD has been selected as more attractive for firewood. Management strategies are needed to allow the long-term maintenance of CWD to ensure suitable habitats for flora and fauna. Despite the fact that the rules and optimal levels of CWD have not yet been formulated, some authors have analysed strategies for enhancing the amount of CWD in intensively managed forests, as retention of living trees at harvest, producing high stump from lower quality tree, preserving the CWD after final harvest, prolonging rotation periods, retention of dying trees and stipulating temporal conservation contracts to compensate forest private owners [80,81,82,83]. Interventions in favour of local populations with the right to collect deadwood could be undertaken by the public owner, providing a part of the harvested wood.
4.4. Species of CWD
Beech was the most frequent component of CWD pools. This species, in terms of volume, mostly contributed to the CWD in the three accessibility classes. In general observations, CWD mirrored the species composition of the area, as also observed in lowland forests in Iran [20]. The results revealed that the volume of different botanical species of CWD is proportional to the different species of the standing trees. This finding shows that the CWD species was not important to the local population. People did not make a selection based on the characteristics of botanical species but on the accessibility of the area, as the residual volume of CWD by species demonstrated. Each accessibility class was significantly different in terms of volume by species, although the amount in terms of relative frequency was similar in each accessibility class, reflecting the frequency of the living trees. The behaviour of low selection has also been noted in other contexts. Marquez Reynoso et al. [57] concluded that rather than the fuel wood characteristics of the species, what prevailed was availability, proximity to home and feasibility in the choice of species used for firewood. This behaviour is not constant. Sassen et al. [84] also observed a greater depletion of CWD volume in forests located in more densely populated sites but also noted that rural people operated a selection on preferred wood and collected fuel wood up to decay class 3.
4.5. Diameter of CWD
In the area where people can collect deadwood, an anthropogenic influence was noted at the expense of the most easily removable diameters. The results of the analysis of CWD diameter showed that the snag and downed-log volumes increased with a positive relation to their diameters, for the three accessibility classes. The richness in large diameter CWD provides greater potential benefits to wildlife [85]. Ylläsjärvi et al. [86] ascertained that the dbh increase of CWD was even more important than the CWD volume for wood-inhabiting fungal species. They related this evidence to the increasing colonization probability, greater numbers of resources and more stable microclimatic conditions. Large snags and dense canopy cover are habitat conditions for the black woodpecker, Dryocopus martius, in the Hyrcanian Forests [87]. A low richness of epixylic bryophytes was attributed to a low supply of deadwood in large diameter classes [88]. Dunn and Bailey [71] observed that the largest dbh class of snags had the slowest fall rate. Thomas et al. [89] observed that the dbh and height of snags determined which species would use the snag for nesting. Even the CWD size was noted as providing different substrate types. Anderson et al. [60] detected more saproxylic predators in snags and more saproxylic fungivores in logs and stumps. Tillon et al. [90] noted that both snags and logs had a significant positive effect on the richness of the bat species and Svensson et al. [61] demonstrated that even stumps were important for wood-dependent lichens in managed forests.
4.6. RSS, RDT, RST, RDW and RDS
RSS (Snag/Standing volume), RDT (Downed logs/Trees) and RDW (CWD/standing volume) increased with a decrease in human accessibility class (HAC) to the stand. Higher amounts of CWD, as snags, logs and stumps, were related to biomass [45,64,82,91]. It is worth noting that in the study area, the stand volume in the EAC was the highest, consequently differences between the accessibility classes are again associated with differences in the accumulation of CWD. Banaś et al. [82] also observed that a discriminant in CWD accumulation was accessibility and different form of forest protection. In the studied area, stand accessibility allowed different amounts of CWD collection and extraction linked to the size of the fuel wood. Higher stump volume and lower stand volume caused higher RST values in the MAC than in the DAC and EAC. In reality, the harvest intensity index (RST) was higher in the MAC than in the EAC and DAC, because tree volume in the MAC was lower than in the EAC and DAC, while stump volume was almost equal in the three HAC’s. As already underlined above, live tree cutting was carried out by forest operators based on the approved management plan. These high forests are treated by selection cutting and local people are not allowed to cut live trees.
RDS (Downed logs/Snag) value decreased with a decrease in the HAC to the stand. The volume of both snags and downed logs increased with a decrease in the HAC to the stand but the reduction in downed-logs was greater than the reduction in snags, therefore the RDS is reduced by reducing the HAC. The mechanical properties of wood change during decay [92,93], therefore high snags break down, creating logs. Snags of deciduous trees had a higher probability of trunk breakage during the time in temperate zones, particularly the higher and the thinner ones, with the consequence of decay acceleration due to ground contact [94]. Castagneri et al. [64] noted higher log richness in steep slope stands where tree uprooting was probably more frequent. Tavankar et al. [5] observed that snag longevity induced log dynamics, comparing RDS in managed and unmanaged stands, due to a lower volume of snags.
It is now widely accepted that forests should be managed in an ecologically sustainable manner [95]. Wildlife use snags, downed logs and stumps for nesting, roosting, foraging, perching, or territorial displays [16,96]. Senescent trees, snags, logs and stumps, in various sizes, decay classes and species are recognized as fundamental elements in biodiversity conservation, in the sustained functioning of forest ecosystems and evidence of sustainable forest management [40]. Only an adequate reserve of snags and logs can activate an appropriate dynamic that allows the maintenance over time of the transformation of the components of the CWD, preserving a composition that reflects the composition of the forest, a large amount of CWD and degradation states suitable to create biodiversity-friendly habitats.
5. Conclusions
The effect of human accessibility level on the volume and characteristics of CWD in the Hyrcanian forests of Iran was investigated, demonstrating that extraneous interventions in the forest management alter the characteristics of CWD. The volume of CWD decreased with an increase in human accessibility level to the stand. However, the volumes of both snags and downed logs decreased. This decrease in CWD volume was associated more with the decreasing volume of small diameter of low decayed downed wood. A constant supply of snags and downed logs must be preserved so as to sustain wildlife populations that depend on these resources and to assure high level of biodiversity.
Forest roads are the basis of the infrastructure for forest operations. However, their presence makes general human accessibility to the stand easier for other activities as well. They have had an impact on the volume of the CWD collected for firewood. Although local people benefit from forest roads for their own mobility, CWD is selectively reduced by the removal of firewood.
Deadwood retention, in terms of volume, type, species composition, diameter distribution, spatial allocation and decay stage, is specific for organisms and for conservation aims. Management policies for deadwood are recognized as necessary for conservation and the benefits in terms of environmental sustainability have been demonstrated. Forest managers need to monitor impact of local population on CWD changes.
Being conscious of the needs, rights or customary uses of the local population is crucial in order that the management of the forest resource can be effectively and fully sustainable. In sustainable forest management, it is necessary to know how legitimate collection influences the amount and type of deadwood left in the forest. New policies are needed which can make possible to achieve conservative goals with other divergent societal needs, such as the practice or the right to harvest deadwood. In this context, socio-economic aspects have to be taken into consideration. When introducing a policy with the aim of increasing biodiversity by increasing the volume of decomposing wood, it is necessary to take into consideration the needs of the local society. Therefore, in rural areas with good access to forests, there may be the need to increase the volume of decomposing wood, so there is also sufficient wood volume available for local people.
Author Contributions
Conceptualization, F.K.B., F.T., M.N., A.L.M. and R.P.; Methodology, F.K.B., F.T., M.N., A.L.M. and R.V.; Validation, F.K.B., F.T., M.N., A.L.M., R.V., P.S.M. and R.P.; Formal Analysis, F.K.B., F.T., M.N., A.L.M. and R.P.; Investigation, F.K.B., F.T. and M.N.; Data Curation, F.K.B., F.T., M.N., A.L.M. and R.P.; Writing-Original Draft Preparation, F.K.B., F.T., M.N., A.L.M., R.V., P.S.M. and R.P.; Writing-Review & Editing, F.K.B., F.T., M.N., A.L.M., R.V., P.S.M. and R.P.
Funding
This research received no external funding.
Acknowledgments
The authors gratefully acknowledge MIUR (Italian Ministry for education, University and Research) for financial support (Law 232/2016, Italian University Departments of excellence).
Conflicts of Interest
The authors declare no conflict of interest.
References
- Ghadiri Khanaposhtani, M.; Kaboli, M.; Karami, M.; Etemad, V.; Baniasadi, S. Effects of logged and unlogged forest patches on avifaunal diversity. Environ. Manag. 2013, 51, 750–758. [Google Scholar] [CrossRef] [PubMed]
- Sefidi, K.; Marvie Mohadjer, M.R.; Mosand, R.; Copenheaver, C. Coarse and fine woody debris in mature Oriental Beech. Nat. Area J. 2013, 3, 248–255. [Google Scholar] [CrossRef]
- Moghimian, N.; Jalali, S.G.; Kooch, Y.; Rey, A. Downed logs improve soil properties in old-growth temperate forests of Northern Iran. Pedosphere 2017. [Google Scholar] [CrossRef]
- Sefidi, K.; Etemad, V. Dead wood characteristics influencing macrofungi species abundance and diversity in Caspian natural beech (Fagus orientalis Lipsky) forests. For. Syst. 2015, 24, eSC03. [Google Scholar] [CrossRef]
- Tavankar, F.; Nikoy, M.; Picchio, R.; Venanzi, R.; Lo Monaco, A. Long-term effects of single-tree selection cutting management on coarse woody debris in natural mixed beech stands in the Caspian forest (Iran). iForest 2017, 10, 652–658. [Google Scholar] [CrossRef] [Green Version]
- Nourzad Moghaddam, M.; Shamekhi, T.; Etemad, V.; Hemmat, M.A. Firewood consumption by rural households in upland of the Caspian forests in the northern Iran and related factors (Case study: Upland villages in southern parts of Kheyrud Forest). Iran J. For. 2014, 6, 113–125. [Google Scholar]
- Prasad, A.E. Tree community change in a tropical dry forest: the role of roads and exotic plant invasion. Environ. Conserv. 2009, 36, 201–207. [Google Scholar] [CrossRef]
- Coffin, A.W. From roadkill to road ecology: A review of the ecological effects of roads. J. Trans. Geogr. 2002, 15, 396–406. [Google Scholar] [CrossRef]
- Ozturk, T.; Inan, M.; Mustafa Akgul, M. Environmental damages of forest road construction by bulldozer on steep terrain. Afr. J. Biotechnol. 2009, 8, 4547–4552. [Google Scholar]
- Tavankar, F.; Nkkooy, M.; Venanzi, R.; Lo Monaco, A.; Picchio, R. Study of forest road effect on tree community and stand structure in three Italian and Iranian temperate forests. Croat. J. For. Eng. 2018, 39, 57–70. [Google Scholar]
- Caliskan, E. Environmental impacts of forest road construction on mountainous terrain. Iran. J. Environ. Health Sci. Eng. 2013, 10, 1–8. [Google Scholar] [CrossRef] [PubMed]
- Gumus, S.; Acar, H.H.; Toksoy, D. Functional forest road network planning by consideration of environmental impact assessment for wood harvesting. Environ. Monit. Assess. 2008, 142, 109–116. [Google Scholar] [CrossRef] [PubMed]
- Tunay, M. The assessment of environmentally sensitive forest road construction in Calabrian pine forest areas of Turkey. J. Environ. Biol. 2006, 27, 529–535. [Google Scholar] [PubMed]
- Tavankar, F.; Bonyad, A.E.; Nikoy, M.; Picchio, R.; Venanzi, R.; Calienno, L. Damages to soil and tree species by cable-skidding in Caspian forests of Iran. For. Syst. 2017, 26, 1–9. [Google Scholar] [CrossRef]
- Bate, L.J.; Wisdom, M.J.; Wales, B.C. Snag densities in relation to human access and associated management factors in forests of northeastern Oregon, USA. Landsc. Urban Plan. 2007, 80, 278–291. [Google Scholar] [CrossRef]
- Wisdom, M.J.; Bate, L.J. Snag density varies with intensity of timber harvest and human access. For. Ecol. Manag. 2008, 255, 2085–2093. [Google Scholar] [CrossRef]
- Bertolotto, P.; Calienno, L.; Conforti, M.; D’Andrea, E.; Lo Monaco, A.; Magnani, E.; Marinšek, A.; Micali, M.; Picchio, R.; Sicuriello, F.; et al. Assessing indicators of forest ecosystem health. Ann. Silv. Resear. 2016, 40, 64–69. [Google Scholar]
- Picchio, R.; Spina, R.; Calienno, L.; Venanzi, R.; Lo Monaco, A. Forest operations for implementing silvicultural treatments for multiple purposes. Ital. J. Agron. 2016, 11, 156–161. [Google Scholar]
- Tavankar, F.; Picchio, R.; Nikooy, M.; Lo Monaco, A.; Venanzi, R.; Iranparast Bodaghi, A. Healing rate of logging wounds on broadleaf trees in Hyrcanian forest with some technological implications. Drewno 2017, 60, 16. [Google Scholar] [CrossRef]
- Tavankar, F.; Picchio, R.; Lo Monaco, A.; Bonyad, A.E. Forest management and snag characteristics in Northern Iran lowland forests. J. For. Sci. 2014, 60, 431–441. [Google Scholar] [CrossRef]
- Britzke, E.R.; Harvey, M.J.; Loeb, S.C. Indiana bat, Myotis sodalis, maternity roosts in the southern United States. Southwest Nat. 2003, 2, 235–242. [Google Scholar] [CrossRef]
- Bursell, J. Winter abundance of hole-nesting birds in natural and managed woods of Zealand (Denmark). Acta Ornithol. 2002, 37, 67–74. [Google Scholar] [CrossRef]
- Humphrey, J.W.; Davey, S.; Peace, A.J.; Ferris, R.; Harding, K. Lichens and bryophite communities of planted and semi-natural forests in Britain: the influence of site type, stand structure and deadwood. Biol. Conserv. 2002, 107, 165–180. [Google Scholar] [CrossRef]
- Hanberry, B.B.; Hanberry, P.; Demarais, S.; Jones, J.C. Importance of residual trees to birds in regenerating pine plantations. iForest 2012, 5, 108–112. [Google Scholar] [CrossRef] [Green Version]
- Lonsdale, D.; Pautasso, M.; Holdenriede, O. Wood-decaying fungi in the forest: Conservation needs and management options. Eur. J. For. Res. 2008, 127, 1–22. [Google Scholar] [CrossRef]
- Allard, J.; Park, A. Woody debris volumes and carbon accumulation differ across a chronosequence of boreal red pine and jack pine stands. Can. J. For. Res. 2013, 43, 768–775. [Google Scholar] [CrossRef]
- Matsuzaki, E.; Sanborn, P.; Fredeen, A.L.; Shaw, C.H.; Hawkins, C. Carbon stocks in managed and unmanaged old-growth western red cedar and western hemlock stands of Canada’s inland temperate rainforests. For. Ecol. Manag. 2013, 297, 108–119. [Google Scholar] [CrossRef]
- Kim, R.; Son, Y.; Lim, J.H.; Lee, I.K.; Seo, K.W.; Koo, J.W.; Noh, N.J.; Ryu, S.; Hong, S.K.; Ihm, B.S. Coarse woody debris mass and nutrients in forest ecosystems of Korea. Ecol. Res. 2006, 21, 819–827. [Google Scholar] [CrossRef]
- Laiho, R.; Prescott, C.E. The contribution of coarse woody debris to carbon, nitrogen and phosphorous cycles in three Rocky Mountain coniferous forests. Can. J. For. Res. 1999, 29, 1592–1603. [Google Scholar] [CrossRef]
- Strukelj, M.; Brais, S.; Quideaua, S.A.; Angers, V.A.; Kebli, H.; Drapeau, P.; Oh, S. Chemical transformations in downed logs and snags of mixed boreal species during decomposition. Can. J. For. Res. 2013, 43, 785–798. [Google Scholar] [CrossRef]
- Böhl, J.; Brändli, U.B. Deadwood volume assessment in the third Swiss national forest inventory: Methods and first results. Eur. J. For. Res. 2007, 126, 449–457. [Google Scholar]
- Kunttu, P.; Junninen, K.; Kouki, J. Dead wood as an indicator of forest naturalness: A comparison of methods. For. Ecol. Manag. 2015, 353, 30–40. [Google Scholar] [CrossRef]
- Di Cosmo, L.; Gasparini, P.; Paletto, A.; Nocetti, M. Deadwood basic density values for national-level carbon stock estimates in Italy. For. Ecol. Manag. 2013, 295, 51–58. [Google Scholar] [CrossRef]
- Rondeux, J.; Sanchez, C. Review of indicators and field methods for monitoring biodiversity within national forest inventories. Core variable: Deadwood. Environ. Monit. Assess. 2010, 164, 617–630. [Google Scholar] [CrossRef] [PubMed]
- Teissier du Cros, R.; Lopez, S. Preliminary study on the assessment of deadwood volume by the French national forest inventory. Ann. For. Sci. 2009, 66, 1–10. [Google Scholar] [CrossRef]
- Woodall, C.W.; Rondeux, J.; Verkerk, P.J.; Ståhl, G. Estimating dead wood during national forest inventories: A review of inventory methodologies and suggestions for harmonization. Environ. Manag. 2009, 44, 624–631. [Google Scholar] [CrossRef] [PubMed]
- Forest Europe—State of Europe’s Forests. Ministerial Conference on the Protection of Forests in Europe. Forest Europe Liaison Unit Madrid, 2015. Available online: https://www.foresteurope.org/docs/fullsoef2015.pdf (accessed on 4 May 2018).
- Larrieu, L.; Cabannettes, A. Species, live status and diameter are important tree features for diversity and abundance of tree microhabitats in subnatural montane beech-fir forests. Can. J. For. Res. 2012, 42, 1433–1445. [Google Scholar] [CrossRef]
- Perry, R.W.; Thill, R.E. Comparison of snag densities among regeneration treatments in mixed pine-hardwood forests. Can. J. For. Res. 2013, 43, 619–626. [Google Scholar] [CrossRef]
- De Long, S.C.; Sutherland, G.D.; Daniels, L.D.; Heemskerk, B.H.; Storaunet, K.O. Temporal dynamics of snags and development of snag habitats in wet spruce-fir stands in east-central British Columbia. For. Ecol. Manag. 2008, 255, 3613–3620. [Google Scholar] [CrossRef]
- Hurlbert, S.H. Pseudorepliction and the design of ecological field experiments. Ecol. Monogr. 1984, 54, 187–211. [Google Scholar] [CrossRef]
- Forestry of Guilan. Tariff of Hyrcanian Beech Forests; Hyrcanian Forest Management Office: Guilan, Iran, 2010. [Google Scholar]
- Corace, R.G.; Seefelt, N.E.; Goebel, P.C.; Shaw, H.L. Snag longevity and decay class development in a recent Jack Pine clearcut in Michigan. North J. App. For. 2010, 27, 125–131. [Google Scholar]
- Palett, A.; De Meo, I.; Cantiani, P.; Ferretti, F. Effects of forest management on the amount of deadwood in Mediterranean oak ecosystems. Ann. For. Sci. 2014, 71, 791–800. [Google Scholar] [CrossRef] [Green Version]
- Garbarino, M.; Marzano, R.; Shaw, J.D.; Long, J.N. Environmental drivers of deadwood dynamics in woodlands and forests. Ecosphere 2015, 6, 30. [Google Scholar] [CrossRef]
- Siipola, A.L.; Siitonen, J.; Kallio, R. Amount and quality of coarse woody debris in natural and managed coniferous forests near the timberline in Finnish Lapland Scand. J. For. Res. 1998, 13, 204–214. [Google Scholar]
- Siitonen, J.; Martikainen, P.; Punttila, P.; Rauh, J. Coarse woody debris and stand characteristics in mature managed and old-growth boreal mesic forests in southern Finland. For. Ecol. Manag. 2000, 128, 211–225. [Google Scholar] [CrossRef]
- Christensen, M.; Hahn, K.; Mountford, E.P.; Odor, P.; Standovar, T.; Rozenbergar, D.; Diaci, J.; Wijdeven, S.; Meyer, P.; Winter, S.; et al. Deadwood in European beech (Fagus sylvatica) forest Reserves. For. Ecol. Manag. 2005, 210, 267–282. [Google Scholar] [CrossRef]
- Norden, B.; Gotmark, F.; Tonnberg, M.; Ryberg, M. Dead wood in semi-natural temperate broadleaved woodland: Contribution of coarse and fine dead wood, attached dead wood and stumps. For. Ecol. Manag. 2004, 194, 235–248. [Google Scholar] [CrossRef]
- Commarmot, B.; Bachofen, H.; Bundziak, Y.; Burgi, A.; Ramp, B.; Shparyk, Y.; Sukhariuk, D.; Viter, R.; Zingg, A. Structure of virgin and managed beech forests in Uholka (Ukraine) and Sihlwald (Switzerland): A comparative study. For. Snow. Landsc. Res. 2005, 79, 45–56. [Google Scholar]
- Rouvinen, S.; Rautiainen, A.; Kouki, J. A relation between historical forest use and current dead woody material in a boreal protected old-growth forest in Finland. Silva Fenn 2005, 39, 21–36. [Google Scholar] [CrossRef]
- Amanzadeh, B.; Sagheb-Talebi, K.; Foumani, B.S.; Fadaie, F.; Camarerond, J.J.; Linares, J.C. Spatial Distribution and Volume of Dead Wood in Unmanaged Caspian Beech (Fagus orientalis) Forests from Northern Iran. Forests 2013, 4, 751–765. [Google Scholar] [CrossRef]
- Behjou, F.K.; Mollabashi, O.G.; Amirahmadi, N. Effects of management on the amount and characteristics of woody debris in mixed stands of Caspian forests. BioResources 2014, 9, 4108–4116. [Google Scholar]
- Sefidi, K.; Marvie Mohadjer, M.R. Characteristics of coarse woody debris in successional stages of natural beech (Fagus orientalis) forests of Northern Iran. J. For. Sci. 2010, 56, 7–17. [Google Scholar] [CrossRef]
- Kahl, T.; Bauhus, J. An index of forest management intensity based on assessment of harvested tree volume, tree species composition and dead wood origin. J. Nat. Conserv. 2014, 7, 15–27. [Google Scholar] [CrossRef] [Green Version]
- Herrero, C.; Monleon, V.J.; Gómez, N.; Bravo, F. Distribution of dead wood volume and mass in mediterranean Fagus sylvatica L. forests in Northern Iberian Peninsula. Implications for field sampling inventory. For. Syst. 2016, 25, e069. [Google Scholar] [CrossRef]
- Marquez-Reynoso, M.I.; Ramírez-Marcial, N.; Cortina-Villar, S.; Ochoa-Gaona, S. Purpose, preferences and fuel value index of trees used for firewood in El Ocote Biosphere Reserve, Chiapas, Mexico. Biomass Bioenergy 2017, 100, 1–9. [Google Scholar] [CrossRef]
- Barreca, L.; Cutini, A.; Mercurio, R. Dead wood characterisation in Quercus frainetto stands in Calabria (Southern Italy). Forest@ 2008, 5, 187–194. [Google Scholar] [CrossRef]
- Caviedes, J.; Ibarra, J.T. Influence of anthropogenic disturbances on stand structural complexity in andean temperate forests: Implications for managing key habitat for biodiversity. PLoS ONE 2017, 12, e0169450. [Google Scholar] [CrossRef] [PubMed]
- Andersson, J.; Hjältén, J.; Dynesius, M. Wood-Inhabiting Beetles in Low Stumps, High Stumps and Logs on Boreal Clear-Cuts: Implications for Dead Wood Management. PLoS ONE 2015, 10, e0118896. [Google Scholar] [CrossRef] [PubMed]
- Svensson, M.; Johansson, V.; Dahlberg, A.; Frisch, A.; Thor, G.; Ranius, T. The relative importance of stand and dead wood types for wood-dependent lichens in managed boreal forests. Fungal Ecol. 2016, 20, 166–174. [Google Scholar] [CrossRef]
- Jonsson, B.G.; Ekström, M.; Esseen, P.; Grafström, A.; Ståhl, G.; Westerlund, B. Dead wood availability in managed Swedish forests —Policy outcomes and implications for biodiversity. For. Ecol. Manag. 2016, 376, 174–182. [Google Scholar] [CrossRef]
- Pedlar, J.H.; Pearce, J.L.; Venier, L.A.; McKenney, D.W. Coarse woody debris in relation to disturbance and forest type in boreal Canada. For. Ecol. Manag. 2002, 158, 189–194. [Google Scholar] [CrossRef]
- Castagneri, D.; Garbarino, M.; Berretti, R.; Motta, R. Site and stand effects on coarse woody debris in montane mixed forests of Eastern Italian Alps. For. Ecol. Manag. 2010, 260, 1592–1598. [Google Scholar] [CrossRef] [Green Version]
- Garbarino, M.; Weisberg, P.J.; Motta, R. Interacting effects of physical environment and anthropogenic disturbances on the structure of European larch (Larix decidua Mill.) forests. For. Ecol. Manag. 2009, 257, 1794–1802. [Google Scholar] [CrossRef]
- D’Amato, A.W.; Orwig, D.A.; Foster, D.R. The influence of successional processes and disturbance on the structure of Tsuga canadensis forests. Ecol. Appl. 2008, 18, 1182–1199. [Google Scholar] [CrossRef] [PubMed]
- De Groot, M.; Zapponi, L.; Badano, D.; Corezzola, S.; Mason, F. Influenza delle pratiche di gestione forestale sulla conservazione dei vertebrati. Ital. J. Agron. 2016, 11, 32–37. [Google Scholar]
- Müller, J.; Wende, B.; Strobl, C.; Eugster, M.; Gallenberger, I.; Floren, A.; Steffan-Dewenter, I.; Linsenmair, K.E.; Weisser, W.W.; Gossner, M.M. Forest management and regional tree composition drive the host preference of saproxylic beetle communities. J. Appl. Ecol. 2015, 52, 753–762. [Google Scholar] [CrossRef] [Green Version]
- Van Der Wal, A.; Ottosson, E.; De Boer, W. Neglected role of fungal community composition in explaining variation in wood decay rates. Ecology 2015, 96, 124–133. [Google Scholar] [CrossRef] [PubMed]
- Boddy, L. Fungal Community Ecology and Wood Decomposition Processes in Angiosperms: From Standing Tree to Complete Decay of Coarse Woody Debris. Ecol. Bull. 2001, 49, 43–56. [Google Scholar]
- Dunn, C.J.; Bailey, J.D. Temporal dynamics and decay of coarse wood in early seral habitats of dry-mixed conifer forests in Oregon’s Eastern Cascades. For. Ecol. Manag. 2012, 276, 71–81. [Google Scholar] [CrossRef]
- Yatskov, M.; Harmon, M.E.; Krankina, O.N. A chronosequence of wood decomposition in the boreal forests of Russia. Can. J. For. Res. 2003, 33, 1211–1226. [Google Scholar] [CrossRef]
- Sanchez, E.; Gallery, R.; Dalling, J. Importance of nurse logs as a substrate for the regeneration of pioneer tree species on Barro Colorado Island, Panama. J. Trop. Ecol. 2009, 25, 429–437. [Google Scholar] [CrossRef]
- Szewczyk, J.; Szwagrzyk, J. Tree regeneration on rotten wood and on soil in old-growth stand. Vegetatio 1996, 122, 37–46. [Google Scholar] [CrossRef]
- Brunner, A.; Kimmins, J.P. Nitrogen fixation in coarse woody debris of Thuja plicata and Tsuga heterophylla forests on northern Vancouver Island. Can. J. For. Res. 2003, 33, 1670–1682. [Google Scholar] [CrossRef]
- Creed, I.F.; Morrison, D.L.; Nicholas, N.S. Is coarse woody debris a net sink or source of nitrogen in the red spruce–Fraser fir forest of the southern Appalachians, U.S.A.? Can. J. For. Res. 2004, 34, 716–727. [Google Scholar] [CrossRef]
- Nascimbene, J.; Thor, G.; Nimis, P.L. Effects of forest management on epiphytic lichens in temperate deciduous forests of Europe—a review. For. Ecol. Manag. 2013, 298, 27–38. [Google Scholar] [CrossRef]
- Spies, T.A.; Franklin, J.F.; Thomas, T.B. Coarse woody debris in Douglas-fir forests of western Oregon and Washington. Ecology 1988, 69, 689–702. [Google Scholar] [CrossRef]
- Mason, F.; Zapponi, L. The forest biodiversity artery: towards forest management for saproxylic conservation. iForest 2015, 9, 205–216. [Google Scholar] [CrossRef]
- Ahtikoski, A.; Hänninen, R.; Siipilehto, J.; Hynynen, J.; Siitonen, J.; Koskela, T.; Kojola, S. Cost-Efficiency of Alternative Forest Conservation Targets, a Case Study from Finland. J. Biodivers. Manag. For. 2017, 6, 4. [Google Scholar] [CrossRef]
- Ando, A.; Chen, X. Optimal contract lengths for voluntary ecosystem service provision with varied dynamic benefit functions. Conserv. Lett. 2011, 4, 207–218. [Google Scholar] [CrossRef] [Green Version]
- Banaś, J.; Bujoczek, L.; Zięba, S.; Drozd, M. The effects of different types of management, functions and characteristics of stands in Polish forests on the amount of coarse woody debris. Eur. J. For. Res. 2014, 133, 1095–1107. [Google Scholar] [CrossRef]
- Ranius, T.; Ekvall, H.; Jonsson, M.; Bostedt, G. Cost-efficiency of measures to increase the amount of coarse woody debris in managed Norway spruce forests. For. Ecol. Manag. 2005, 206, 119–133. [Google Scholar] [CrossRef]
- Sassen, M.; Sheil, D.; Giller, K.E. Fuelwood collection and its impacts on a protected tropical mountain forest in Uganda. For. Ecol. Manag. 2015, 354, 56–67. [Google Scholar] [CrossRef]
- Regnery, B.; Paillet, Y.; Couvet, D.; Kerbiriou, C. Which factors influence the occurrence and density of tree microhabitats in Mediterranean oak forests? For. Ecol. Manag. 2013, 295, 118–125. [Google Scholar] [CrossRef]
- Ylläsjärvi, I.; Berglund, H.; Kuuluvainen, T. Relationships between wood-inhabiting fungal species richness and habitat variables in old-growth forest stands in the Pallas-Yllästunturi National Park, northern boreal Finland. Silva Fenn 2011, 45, 995–1013. [Google Scholar] [CrossRef]
- Ghadiri Khanaposhtani, M.; Kaboli, M.; Karami, M.; Etemad, V. Effect of habitat complexity on richness, abundance and distributional pattern of forest birds. Environ. Manag. 2012, 50, 296–303. [Google Scholar] [CrossRef] [PubMed]
- Madžule, L.; Brūmelis, G.; Tjarve, D. Structures determining bryophyte species richness in a managed forest landscape in boreo-nemoral Europe. Biodivers. Conserv. 2012, 21, 437–450. [Google Scholar] [CrossRef]
- Thomas, J.W.; Anderson, R.G.; Maser, C.; Bull, E.L. Snags, Wildlife Habitats in Managed Forests: The Blue Mountains of Oregon and Washington; Agricultural Handbook No. 553; USDA Forest Service: Portland, OR, USA, 1979.
- Tillon, L.; Bouget, C.; Paillet, Y.; Aulagnier, S. How does deadwood structure temperate forest bat assemblages? Eur. J. For. Res. 2016, 135, 433–449. [Google Scholar] [CrossRef]
- Russell, M.B.; Kenefic, L.S.; Weiskitte, A.R.; Puhlick, J.J.; Brissette, J.C. Assessing and modeling standing deadwood attributes under alternative silvicultural regimes in the Acadian forest region of Maine, USA. Can. J. For. Res. 2012, 42, 1873–1883. [Google Scholar] [CrossRef]
- Angers, V.A.; Drapeau, P.; Bergeron, Y. Mineralization rates and factors influencing snag decay in four North American boreal tree species. Can. J. For. Res. 2012, 42, 157–166. [Google Scholar] [CrossRef]
- Annesi, T.; Calienno, L.; Picchio, R.; De Simone, D.; Lo Monaco, A. Degradation of some technological features in wood of ornamental species cause by Inonotus rickii (Pat.) Reid. Drewno 2015, 58, 5–18. [Google Scholar]
- Lõhmus, A.; Kraut, A.; Rosenvald, R. Dead wood in clearcuts of semi-natural forests in Estonia: Sitetype variation, degradation and the influences of tree retention and slash harvest. Eur. J. For. Res. 2013, 132, 335–349. [Google Scholar] [CrossRef]
- Kohm, K.; Franklin, J.F. Forestry in 21st Century; Island Press: Covelo, CA, USA, 1997. [Google Scholar]
- Rabe, M.J.; Morrell, T.E.; Green, H.; DeVos, J.C.; Miller, C.R. Characteristics of ponderosa pine snag roosts used by reproductive bats in northern Arizona. J. Wildl. Manag. 1998, 62, 612–621. [Google Scholar] [CrossRef]
Figure 1.
Study area in Hyrcanian forests of Iran.

Figure 2.
(a) Values of RSS (Snag/Standing volume), (b) RDT (Downed logs/Trees), (c) RST (Stump/Trees) and (d) RDW (CWD/standing volume) in the human accessibility classes: EAC = easy accessibility class, MAC = medium accessibility class, and DAC = difficult accessibility class.
Figure 2.
(a) Values of RSS (Snag/Standing volume), (b) RDT (Downed logs/Trees), (c) RST (Stump/Trees) and (d) RDW (CWD/standing volume) in the human accessibility classes: EAC = easy accessibility class, MAC = medium accessibility class, and DAC = difficult accessibility class.
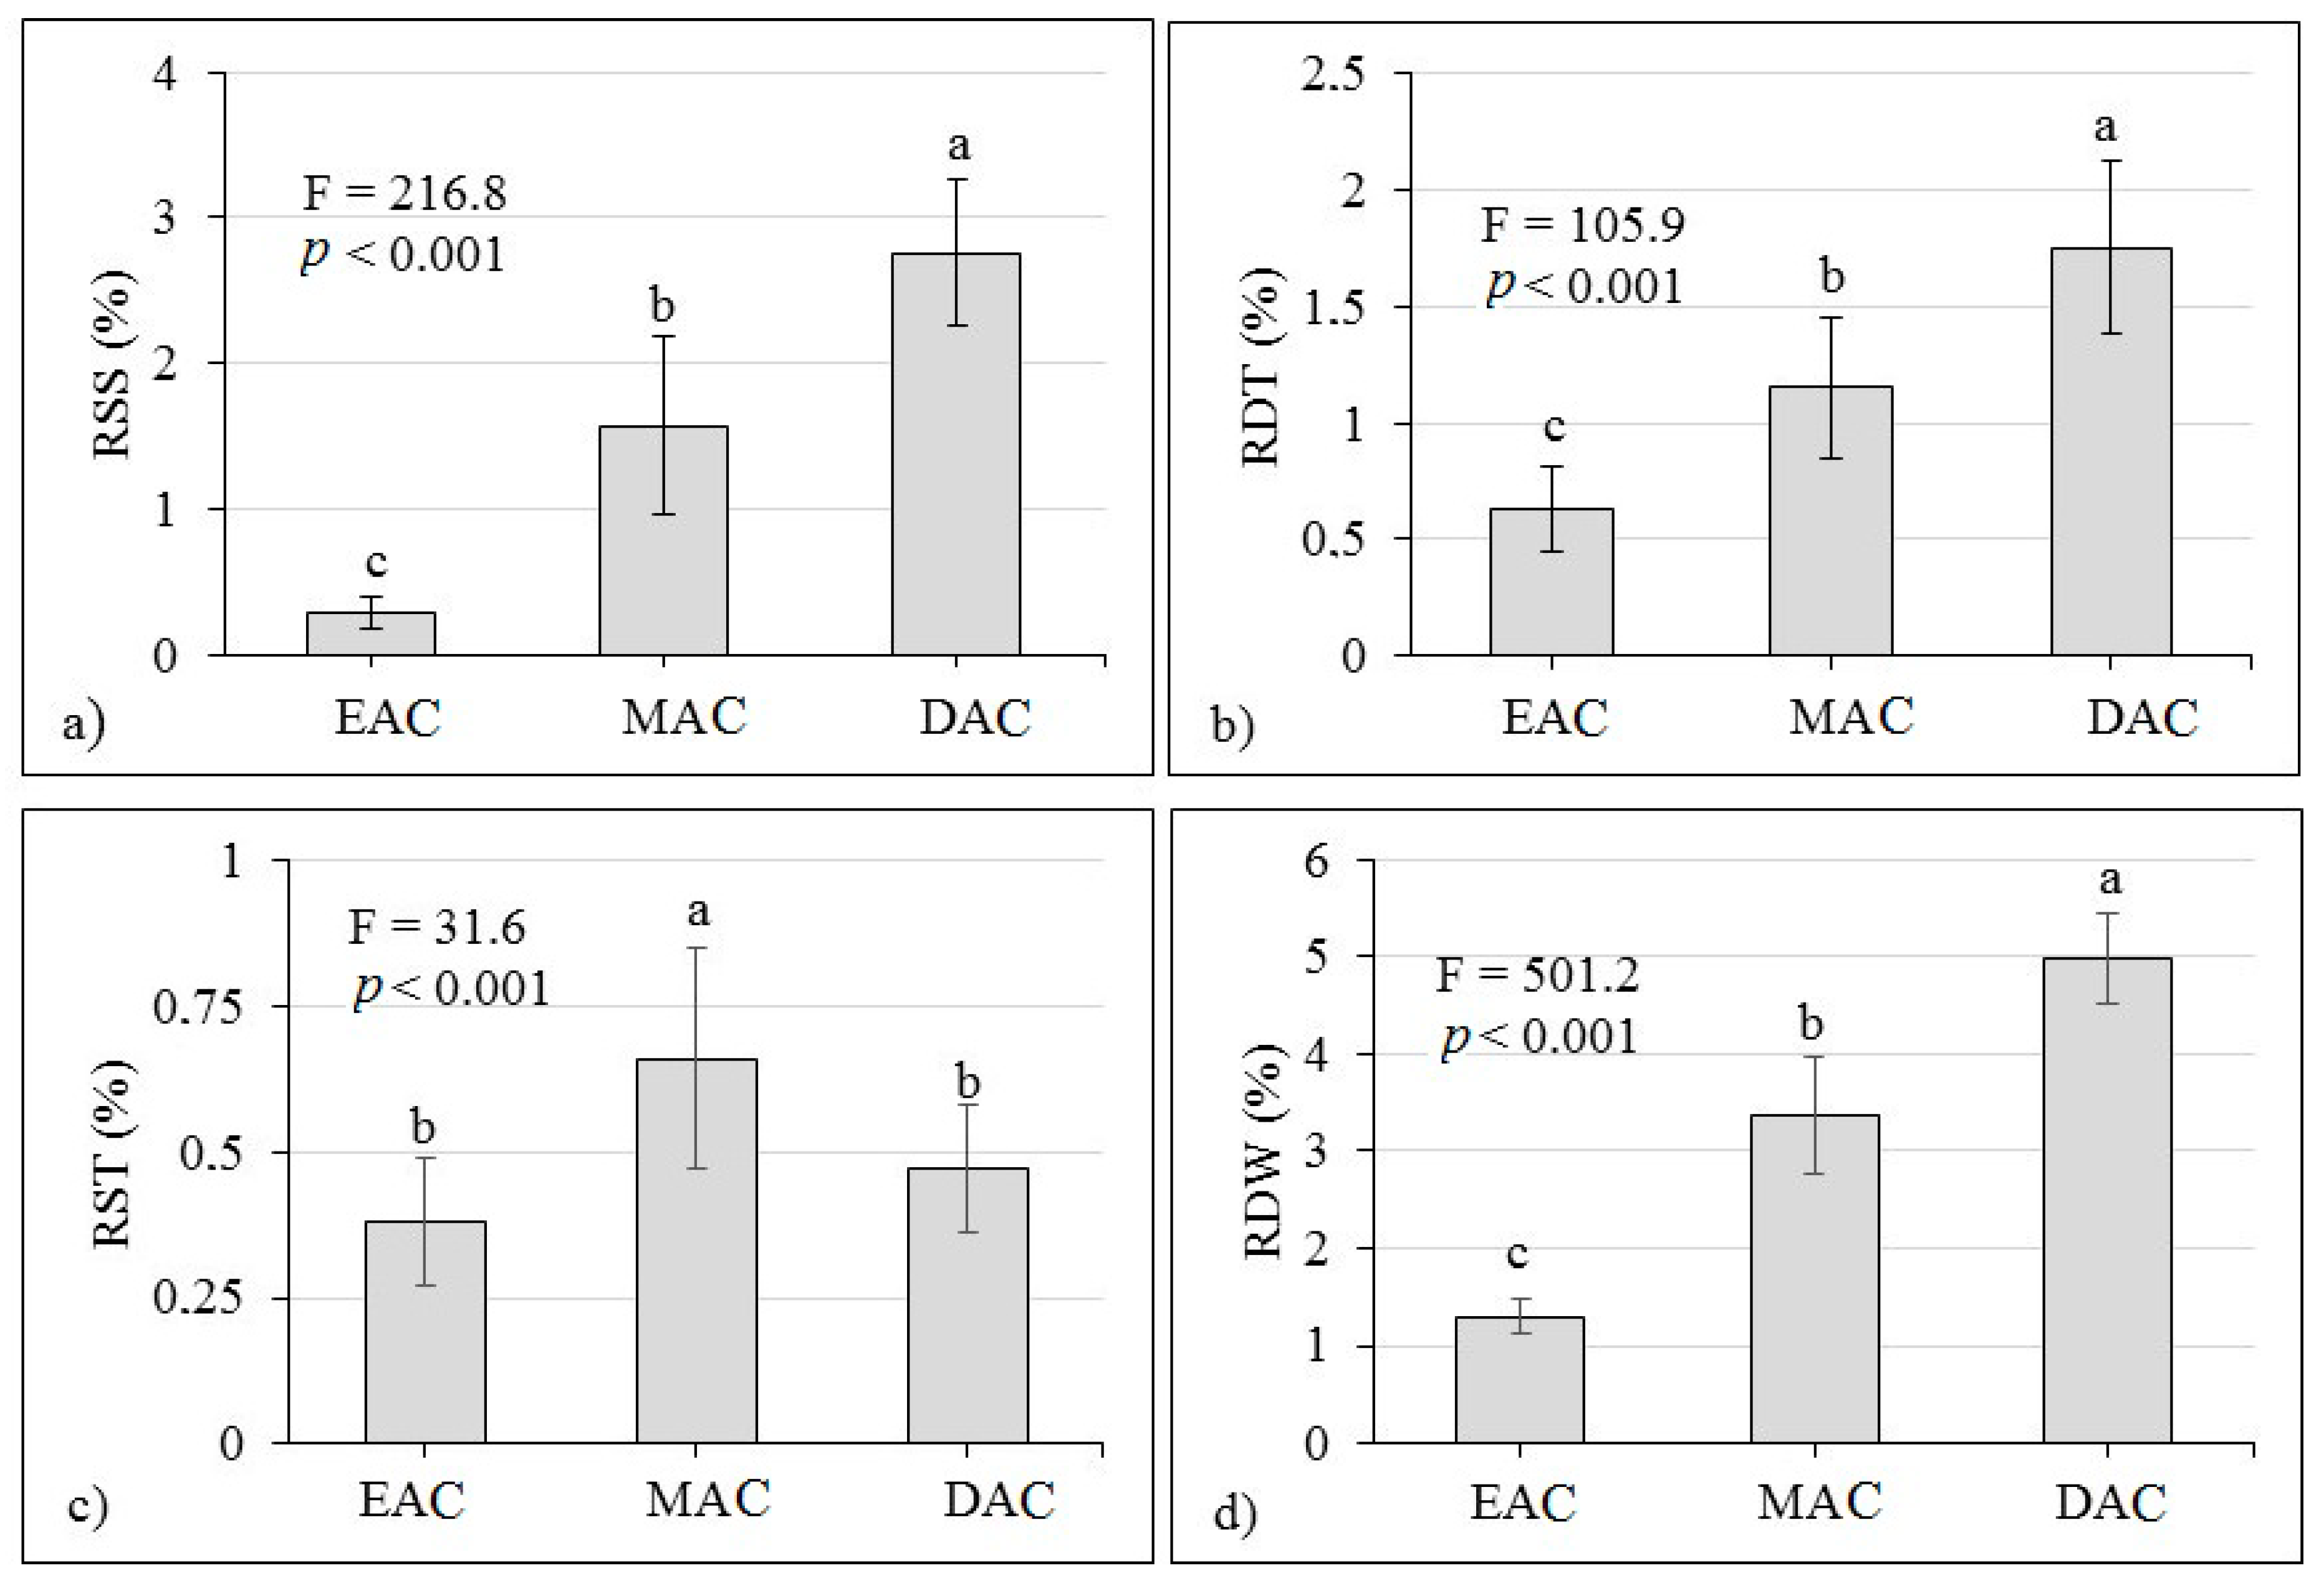
Figure 3.
RDS (Downed logs/Snag) in the human accessibility classes: EAC = easy accessibility class, MAC = medium accessibility class, and DAC = difficult accessibility class.
Figure 3.
RDS (Downed logs/Snag) in the human accessibility classes: EAC = easy accessibility class, MAC = medium accessibility class, and DAC = difficult accessibility class.
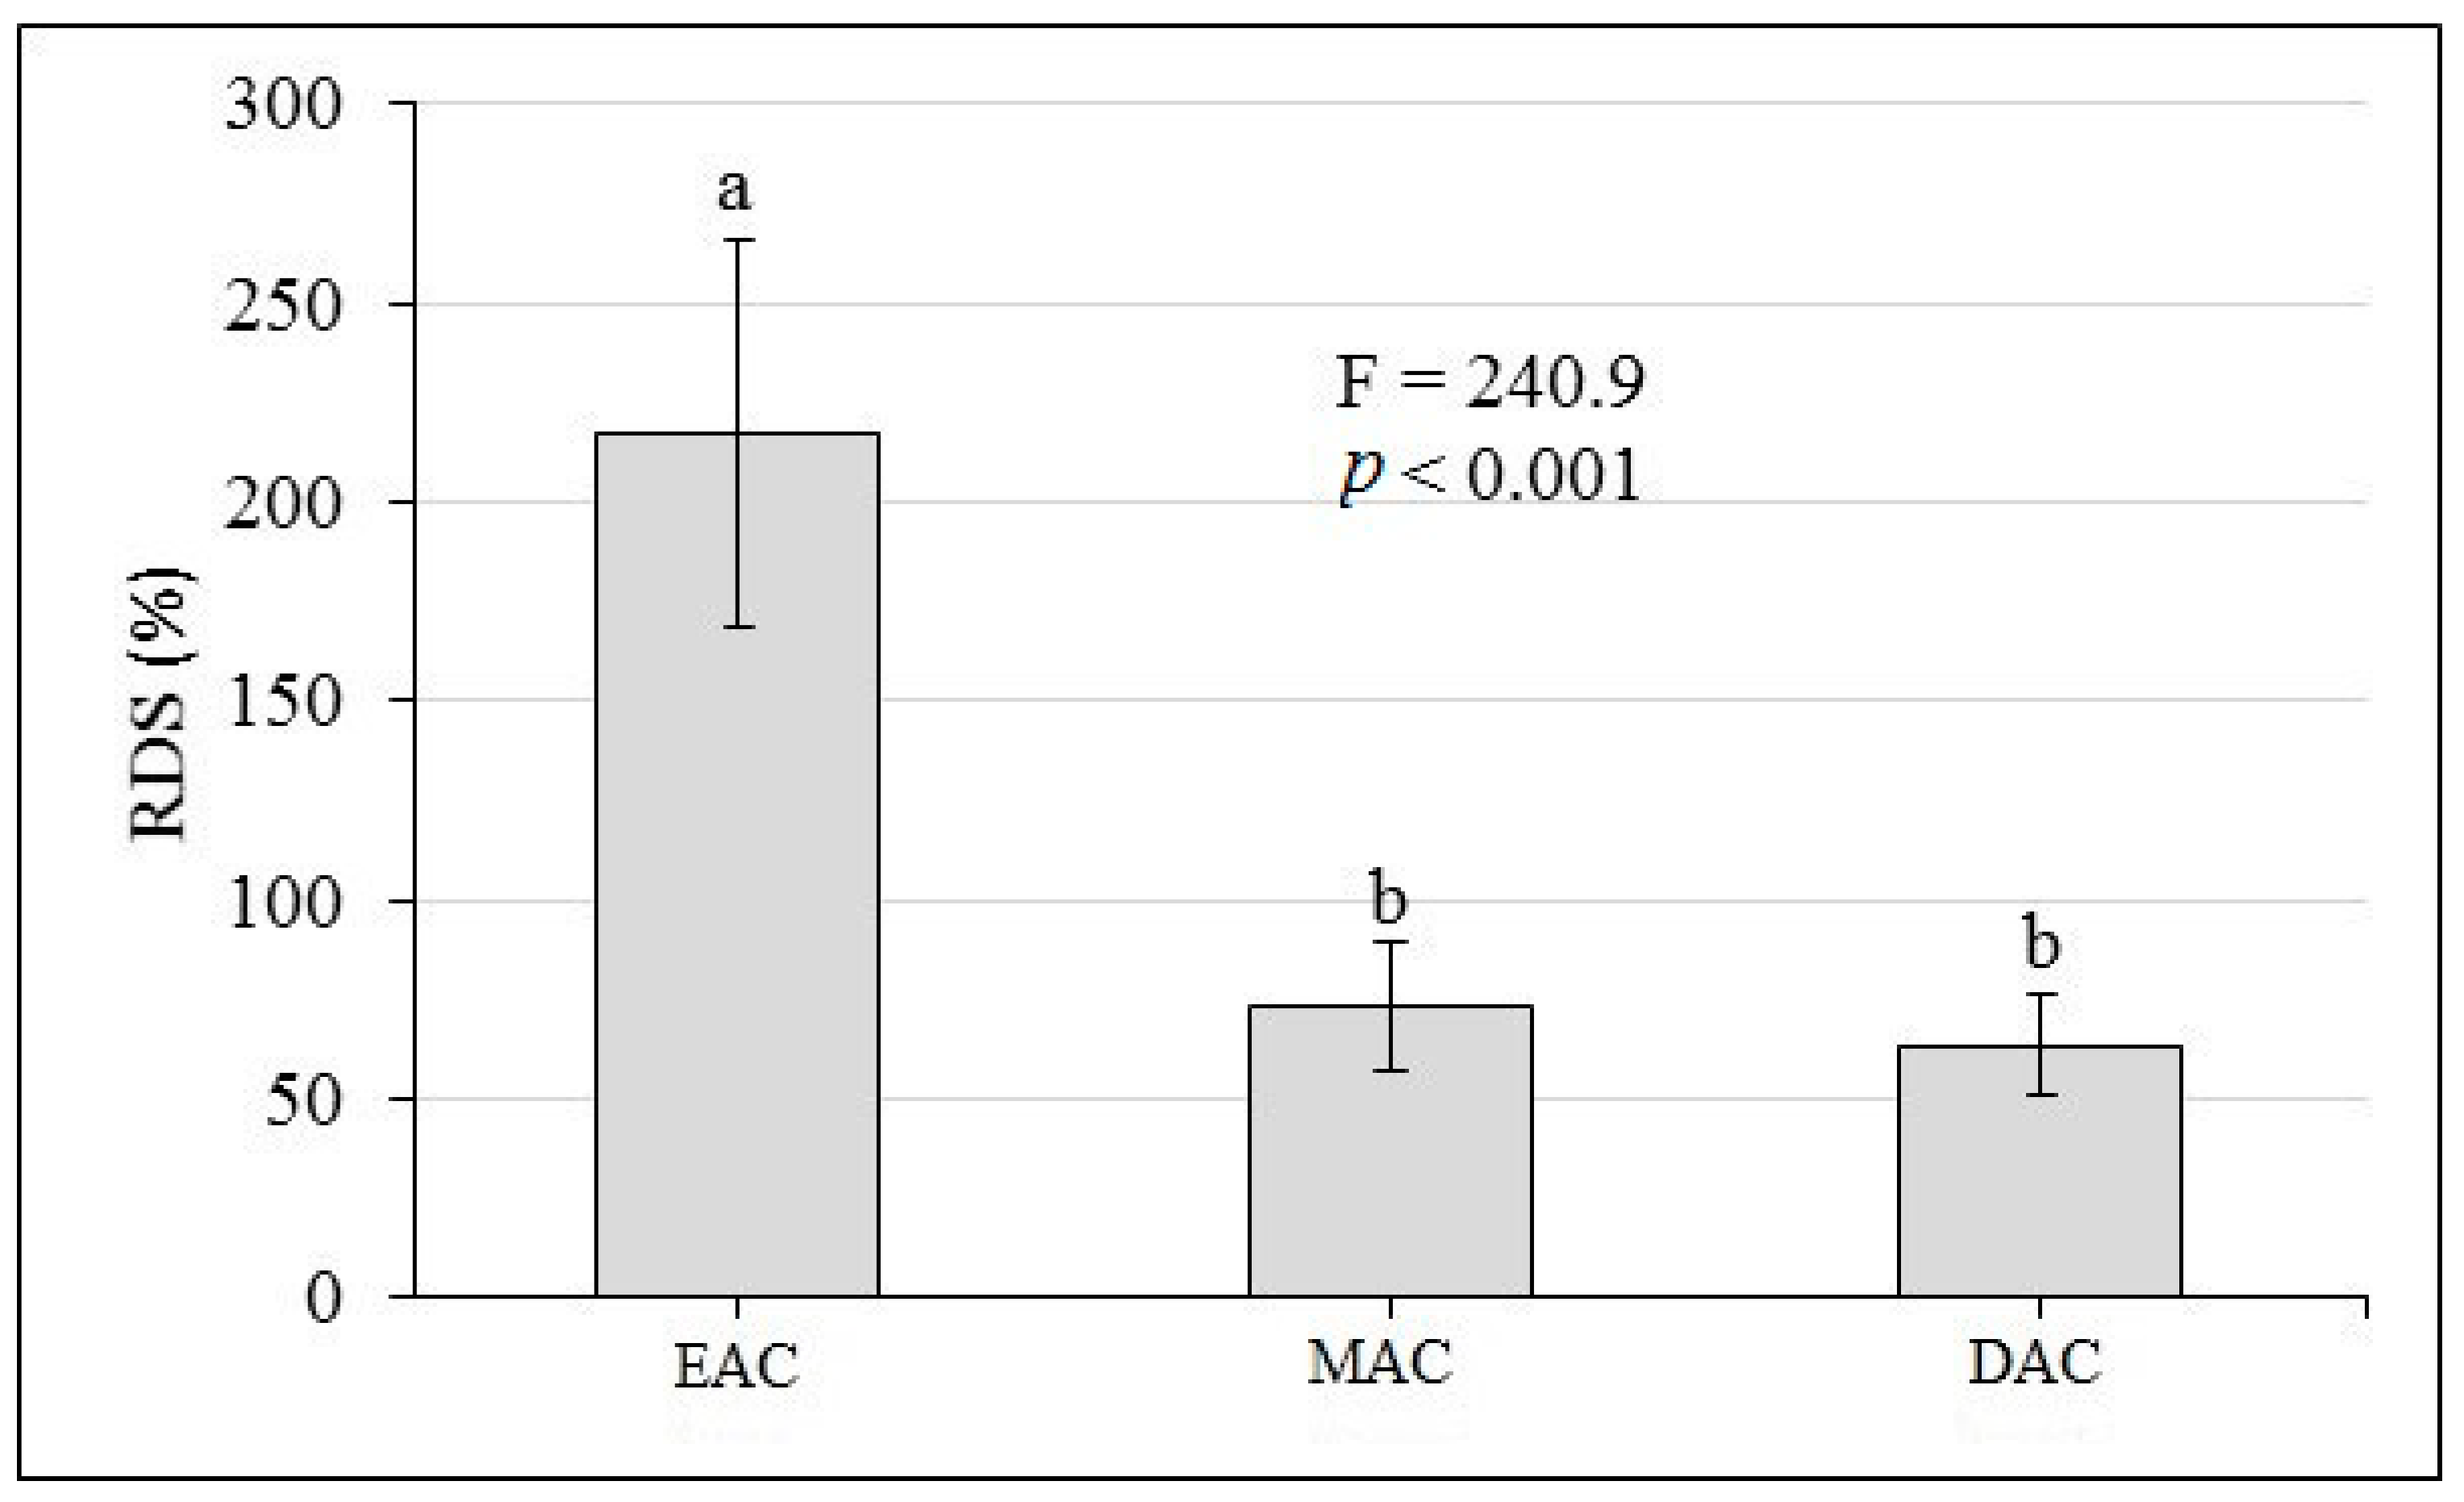
Figure 4.
NMDS analysis for the three human accessibility classes (violet ellipse: EAC; green ellipse: MAC; blue ellipse: DAC), for the main indices referred to CWD (RSS, RDT, RST and RDW). EAC = easy accessibility class; MAC = medium accessibility class; DAC = difficult accessibility class; RSS = Snag/Standing volume; RDT = Downed logs/Trees; RST = Stump/Trees; RDW = CWD/standing volume.

Table 1.
Classification of the sample plots on the base of slope degree, slope direction and road type.
Table 1.
Classification of the sample plots on the base of slope degree, slope direction and road type.
| Slope (%) | Slope Direction | Road Type | No of Sample Plots in Total | No of Sample Plots Selected for Study | HAC |
|---|---|---|---|---|---|
| <20 | Flat | Adjacent Open | 30 | 30 | EAC |
| <20 | Flat | Adjacent Closed | 1 | 0 | - |
| <20 | Flat | Not Adjacent | 2 | 0 | - |
| 20–40 | Uphill | Adjacent Open | 2 | 0 | - |
| 20–40 | Uphill | Adjacent Closed | 3 | 0 | - |
| 20–40 | Uphill | Not Adjacent | 2 | 0 | - |
| 20–40 | Downhill | Adjacent Open | 3 | 0 | - |
| 20–40 | Downhill | Adjacent Closed | 45 | 30 | MAC |
| 20–40 | Downhill | Not Adjacent | 3 | 0 | - |
| >40 | Uphill | Adjacent Open | 3 | 0 | - |
| >40 | Uphill | Adjacent Closed | 4 | 0 | - |
| >40 | Uphill | Not Adjacent | 43 | 30 | DAC |
| >40 | Downhill | Adjacent Open | 3 | 0 | - |
| >40 | Downhill | Adjacent Closed | 3 | 0 | - |
| >40 | Downhill | Not Adjacent | 3 | 0 | - |
HAC = human accessibility class; EAC = easy accessibility class; MAC = medium accessibility class; DAC = difficult accessibility class.
Table 2.
Accessibility class characteristics in the study area.
| HAC | Slope (%) | Slope Direction | Road Type |
|---|---|---|---|
| EAC | <20 | Flat | Adjacent, open |
| MAC | 20–40 | Downhill | Adjacent, closed |
| DAC | >40 | Uphill | Not adjacent |
HAC = human accessibility class; EAC = easy accessibility class; MAC = medium accessibility class; DAC = difficult accessibility class.
Table 3.
Classification system of coarse woody debris (CWD) types in decay classes.
| Types | Decay class | |||||
|---|---|---|---|---|---|---|
| Character | 1 | 2 | 3 | 4 | 5 | |
| Snags | Leaves | Present | Absent | Absent | Absent | As logs |
| Bark | Tight | Loose | Partly present | Absent | ||
| Crown, branches and twigs | All present | Only branches present | Only large branch stubs present | Absent | ||
| Bole | Recently dead | Standing, firm | Standing, decayed | Heavily decayed, Soft and block structure | ||
| Indirect measure | Cambium still fresh, died <1 year | Cambium decayed, knife blade penetrates a few millimetres | Knife blade penetrates <2 cm | Knife blade penetrates 2–5 cm | Knife blade penetrates all the way | |
| Logs | Structural integrity | Sound | Sapwood slightly rotting, heartwood sound | Sapwood missing, heartwood mostly sound | Heartwood decayed | Soft |
| Leaves | Present | Absent | Absent | Absent | Absent | |
| Branches | All twigs present | Larger twigs present | Larger branches present | Branch stubs present | Absent | |
| Bark | Present | Present | Often present | Often present | Absent | |
| Bole shape | Round | Round | Round | Round to oval | Oval to flat | |
| Wood consistency | Solid | Solid | Semisolid | Partly soft | Fragmented, powdery | |
| Colour of wood | Original colour | Original colour | Original colour to faded | Original colour to faded | Heavily faded | |
| Portion of log on ground | Elevated on support point | Elevated on support point | Near or on ground | Whole log on ground | Whole log on ground | |
| Indirect measure | Cambium still fresh, died | Cambium decayed, knife blade penetrates a few mm | Knife blade penetrates <2 cm | Knife blade penetrates 2–5 cm | Knife blade penetrates all the way | |
| Stumps | Indirect measure | Cambium still fresh, died <1 year | Cambium decayed, knife blade penetrates a few mm | Knife blade penetrates <2 cm | Knife blade penetrates 2–5 cm | Knife blade penetrates all the way |
Table 4.
Stand characteristics (average ± SD) in the human accessibility classes (HAC).
| HAC | Area of HAC (ha) | Tree Density 1 (stem ha−1) | Stand Volume 1 (m3 ha−1) |
|---|---|---|---|
| EAC | 25.0 | 166.1 ± 23.2 | 309.2 ± 31.7 a |
| MAC | 74.2 | 169.0 ± 22.8 | 262.8 ± 25.3 b |
| DAC | 53.1 | 171.5 ± 19.8 | 298.6 ± 28.6 a |
| F-value | - | 0.386 N.S. | 21.463 ** |
1 Different lower case letters indicate differences statistically significant between the human accessibility classes (HAC) according to the Tukey HSD test, N.S: no significance, ** significance at α = 0.01. EAC = easy accessibility class; MAC = medium accessibility class; DAC = difficult accessibility class.
Table 5.
Volume (average ± SD) of CWD (m3 ha−1) components (snag, downed log and stump) in the accessibility classes and results of ANOVA and Tukey HSD tests 1.
Table 5.
Volume (average ± SD) of CWD (m3 ha−1) components (snag, downed log and stump) in the accessibility classes and results of ANOVA and Tukey HSD tests 1.
| HAC | Snag | Downed Log | Stump | Total (CWD) |
|---|---|---|---|---|
| EAC | 0.90 ± 0.28 c | 1.96 ± 0.29 c | 1.17 ± 1.07 | 4.03 ± 1.17 c |
| (22.3%) | (48.6%) | (29.1%) | ||
| MAC | 4.11 ± 0.72 b | 3.01 ± 0.54 b | 1.72 ± 1.29 | 8.84 ± 1.54 b |
| (46.5%) | (34.0%) | (19.5%) | ||
| DAC | 8.24 ± 1.13 a | 5.23 ± 0.59 a | 1.40 ± 1.01 | 14.87 ± 1.31 a |
| (55.4%) | (35.2%) | (9.4%) | ||
| ANOVA | ||||
| F-value | 645.4 | 342.6 | 1.78 | 485.5 |
| p-value | <0.001 | <0.001 | 0.174 | <0.001 |
1 Different lower case letters indicate differences statistically significant between the human accessibility classes (HAC) according to the Tukey test. EAC = easy accessibility class; MAC = medium accessibility class; DAC = difficult accessibility class.
Table 6.
Volume (average ± SD) of CWD (m3 ha−1) in decay classes and accessibility classes and results of ANOVA and Tukey HSD tests 1.
Table 6.
Volume (average ± SD) of CWD (m3 ha−1) in decay classes and accessibility classes and results of ANOVA and Tukey HSD tests 1.
| HAC | DC1 | DC2 | DC3 | DC4 | DC5 |
|---|---|---|---|---|---|
| EAC | 0.35 ± 0.10 c | 0.36 ± 0.13 b | 0.72 ± 0.21 b | 1.08 ± 0.28 b | 1.52 ± 0.31 b |
| (8.7%) | (9.0%) | (17.9%) | (26.8%) | (37.7%) | |
| MAC | 0.78 ± 0.26 b | 1.02 ± 0.34 a | 1.11 ± 0.19 b | 2.59 ± 0.49 a | 3.34 ± 0.34 a |
| (8.8%) | (11.5%) | (12.6%) | (29.3%) | (37.8%) | |
| DAC | 2.52 ± 0.58 a | 1.15 ± 0.23 a | 4.23 ± 0.46 a | 2.87 ± 0.41 a | 4.10 ± 0.34 a |
| (16.9%) | (7.7%) | (28.4%) | (19.3% | (27.6%) | |
| ANOVA | |||||
| F-value | 266.7 | 87.9 | 1133.5 | 170.7 | 383.6 |
| p-value | <0.001 | <0.001 | 0<.001 | <0.001 | <0.001 |
1 Different lower case letters indicate differences statistically significant between the human accessibility classes (HAC) according to Tukey test. EAC = easy accessibility class; MAC = medium accessibility class; DAC = difficult accessibility class; DC = decay class.
Table 7.
Volume (average ± SD) of CWD (m3 ha−1) in tree species and accessibility classes and results of ANOVA and Tukey HSD tests 1.
Table 7.
Volume (average ± SD) of CWD (m3 ha−1) in tree species and accessibility classes and results of ANOVA and Tukey HSD tests 1.
| Tree Species | EAC | MAC | DAC | F-Value | p-Value |
|---|---|---|---|---|---|
| Beech | 3.10 ± 0.39 c | 6.13 ± 1.24 b | 9.40 ± 1.62 a | 218.8 | <0.001 |
| (76.0%) | (69.3%) | (63.2%) | |||
| Hornbeam | 0.62 ± 0.18 c | 1.22 ± 0.30 b | 3.13 ± 0.91 a | 173.2 | <0.001 |
| (15.2%) | (14.6%) | (21.0%) | |||
| Alder | 0.22 ± 0.05 c | 0.64 ± 0.20 b | 1.20 ± 0.55 a | 64.8 | <0.001 |
| (5.4%) | (7.7%) | (8.1%) | |||
| Maple | 0.09 ± 0.04 c | 0.50 ± 0.18 b | 0.72 ± 0.26 a | 95.4 | <0.001 |
| (2.2) | (6.0) | (4.8) | |||
| Other Sp. | 0.05 ± 0.02 b | 0.35 ± 0.15 a | 0.42 ± 0.11 a | 88.0 | <0.001 |
| (1.2%) | (4.2%) | (2.8%) |
1 Different lower case letters indicate differences statistically significant between the human accessibility classes (HAC) according to the Tukey test. EAC = easy accessibility class; MAC = medium accessibility class; DAC = difficult accessibility class.
Table 8.
Volume (average ± SD) of CWD (m3 ha−1) in diameter classes and accessibility classes; results of ANOVA and Tukey HSD tests 1.
Table 8.
Volume (average ± SD) of CWD (m3 ha−1) in diameter classes and accessibility classes; results of ANOVA and Tukey HSD tests 1.
| CWD Component | HAC | Diameter of CWD (cm) | ||||
|---|---|---|---|---|---|---|
| 7.5–25 | 26–50 | 51–75 | 76–100 | LINE SUM | ||
| Snag | EAC | 0.05 ± 0.03 b | 0.09 ± 0.04 b | 0.15 ± 0.07 c | 0.67 ± 0.09 c | 0.96 |
| MAC | 0.25 ± 0.09 b | 0.38 ± 0.13 b | 0.63 ± 0.11 b | 2.85 ± 0.39 b | 4.11 | |
| DAC | 0.87 ± 0.19 a | 1.05 ± 0.30 a | 1.66 ± 0.27 a | 4.66 ± 0.67 a | 8.24 | |
| ANOVA | F-value | 361.2 | 200.8 | 583.4 | 580.3 | |
| p-value | <0.001 | <0.001 | <0.001 | <0.001 | ||
| Downed log | EAC | 0.09 ± 0.06 c | 0.19 ± 0.06 b,c | 0.25 ± 0.09 c | 1.43 ± 0.06 b | 1.96 |
| MAC | 0.25 ± 0.07 a,b | 0.47 ± 0.08 a,b | 0.77 ± 0.11 b | 1.52 ± 0.14 b | 3.01 | |
| DAC | 0.48 ± 0.14 a,b | 0.79 ± 0.18 a | 1.21 ± 0.14 a | 2.75 ± 0.44 a | 5.23 | |
| ANOVA | F-value | 122.5 | 173.0 | 484.9 | 546.2 | |
| p-value | <0.001 | <0.001 | <0.001 | <0.001 | ||
| Stump | EAC | 0.09 ± 0.08 | 0.25 ± 0.08 b | 0.40 ± 0.08 b | 0.43 ± 0.07 c | 1.17 |
| MAC | 0.11 ± 0.07 | 0.39 ± 0.10 a | 0.55 ± 0.09 a | 0.67 ± 0.09 a | 1.72 | |
| DAC | 0.09 ± 0.05 | 0.30 ± 0.08 a | 0.46 ± 0.12 b | 0.55 ± 0.09 b | 1.40 | |
| ANOVA | F-value | 1.3 | 20.7 | 14.6 | 52.2 | |
| p-value | 0.270 | <0.001 | <0.001 | <0.001 | ||
1 Different lower case letters indicate differences statistically significant between the human accessibility classes (HAC) according to the Tukey test. EAC = easy accessibility class; MAC = medium accessibility class; DAC = difficult accessibility class.
© 2018 by the authors. Licensee MDPI, Basel, Switzerland. This article is an open access article distributed under the terms and conditions of the Creative Commons Attribution (CC BY) license (http://creativecommons.org/licenses/by/4.0/).
Share and Cite
MDPI and ACS Style
Behjou, F.K.; Lo Monaco, A.; Tavankar, F.; Venanzi, R.; Nikooy, M.; Mederski, P.S.; Picchio, R. Coarse Woody Debris Variability Due to Human Accessibility to Forest. Forests 2018, 9, 509. https://doi.org/10.3390/f9090509
AMA Style
Behjou FK, Lo Monaco A, Tavankar F, Venanzi R, Nikooy M, Mederski PS, Picchio R. Coarse Woody Debris Variability Due to Human Accessibility to Forest. Forests. 2018; 9(9):509. https://doi.org/10.3390/f9090509
Chicago/Turabian StyleBehjou, Farshad Keivan, Angela Lo Monaco, Farzam Tavankar, Rachele Venanzi, Mehrdad Nikooy, Piotr S. Mederski, and Rodolfo Picchio. 2018. "Coarse Woody Debris Variability Due to Human Accessibility to Forest" Forests 9, no. 9: 509. https://doi.org/10.3390/f9090509
Note that from the first issue of 2016, this journal uses article numbers instead of page numbers. See further details here.