Article

Effects of Forest Management Practices on Moth Communities in a Japanese Larch (Larix kaempferi (Lamb.) Carrière) Plantation

1
Department of Biology, Kyung Hee University, Seoul 02447, Korea
2
Forest Ecology and Climate Change Division, National Institute of Forest Science, Seoul 02455, Korea
3
Forest Technology and Management Research Center, National Institute of Forest Science, Pocheon 11186, Korea
4
Department of Life and Nanopharmaceutical Sciences, Kyung Hee University, Seoul 02447, Korea
*
Author to whom correspondence should be addressed.
Forests 2018, 9(9), 574; https://doi.org/10.3390/f9090574
Submission received: 7 July 2018 / Revised: 12 September 2018 / Accepted: 13 September 2018 / Published: 17 September 2018

Abstract

:
Biodiversity in forests is strongly affected by forest management practices, such as clearcutting and aggregated retention. Therefore, the assessment of the effects of forest management on biodiversity is a major concern in forest ecology. In the present study, we aimed to characterize the effects of forest management practices, after one year, on the abundance, species richness, community composition, and functional groups of moths in forests. The moths were sampled in four different forest stands: three stands (clearcutting, aggregated retention, and no cutting) in a planted Japanese larch forest and one stand in a natural Mongolian oak forest. The results revealed that the moth communities changed in response to the changes in vegetation after the implementation of forest management practices, and clearcutting increased the abundance and species richness of herbivorous and warm-adapted species. The structure and function of moth communities were affected by the forest management practices such as clearcutting and aggregated retention, which were reflected by a decrease in community indices and change in moth community composition with changes in vegetation.

1. Introduction

Forest management practices abruptly change the environmental condition of forests, affecting their ecological structures, including biodiversity. Therefore, the assessment of the effects of forest management on biodiversity is a major concern in forest ecology [1], and it is important to evaluate the changes in local flora and fauna caused by the forest management practices [2]. Clearcutting as a timber harvest technique is widely used in forest management practice because it is a cheapest and the most efficient [3,4]. However, many concerns regarding this technique are related to its detrimental effects on the forest ecosystems [5]. To minimize the negative ecological effects of clearcutting, recently the aggregated retention is widely promoted as a way to conserve forest biodiversity [6]. Clearcutting affects the environmental condition of forests, including an increase in sunlight exposure, and fluctuations in temperature, humidity in the ground layers, soil bulk density, and soil hardness [7,8,9]. This results in changes in the vegetation due to changes in the canopy and stem density of trees in the forest [10]. Furthermore, the light-demanding plant species become more abundant than the shade-tolerant species [11]. The growth of some vascular plant species, such as herbaceous forest species (Epilobietea angustifolii Tüxen. and Carex pilulifera L.), is favored by clearcutting [2,12], whereas, several higher plants, bryophytes, and lichens are negatively affected by clearcutting [2].
In South Korea, the retention harvest experiment was initiated in Mongolian oak (Quercus mongolica var. liatungensis (Koidz.) Nakai) forest in 2010 with two patterns (aggregated and dispersed) and two levels of retention (15% and 50%) in 1 ha area [13]. For the maintenance of ecologically healthy forest ecosystems and sustainable forest ecosystem management, Korea Forest Service established a standard in detail for environmentally friendly logging in “Creation and Management of Forest Resources Act” in 2010. After the establishment of the Act, the aggregated retention method is popularly conducted by the local government. However, there are limited studies on the effects of the aggregated retention practices on the ecosystem health and biodiversity [13,14,15,16,17,18]. Among these studies, Kim [13], Ming [14], and Jeong et al. [16] reported the effects of aggregated retention on vegetation and environmental factors. The aggregated retention area showed lower daily change in micro-environment (transmitted light, temperature, humidity) compared to harvested area due to the remaining canopy, showing fewer effects on plant species diversity and ecosystem stability that the dispersal retention [13,14]. Meanwhile, Jeon et al. [15] studied the response of insect fauna in designated regeneration forests for a baseline of comparative analysis of insect diversity, and Roh et al. [17] and Kim et al. [18] studied the changes of coleopteran insect communities in a green-tree retention forest.
The changes in vegetation caused by forest management practices affect the distribution and abundance of animals including insects, which use the forest as a habitat and food resource. Several studies have reported the negative effects of clearcutting on the distribution of insects, such as saproxylic beetles, carabids, lepidopterans, isopods, and Opiliones [7,11,19,20,21,22]. However, clearcutting can increase the abundance of some species adapted to fragmented environments [23].
Among insects, moths are frequently used as bioindicators to evaluate terrestrial ecosystem conditions [24,25]. Most moths can be identified easily, and they live in diverse environments. Some moth species are used as an indicator of environmental changes. Summerville [26] selected the members of Arctiidae and Notodontidae as biodiversity indicators to evaluate habitat disturbance and fragmented landscapes. The abundance of some subfamily members of Arctiidae increased after harvest in Australian rainforest [24]. The abundance of geometrid moths increased during later successional stages, which are characterized by dense vegetation and canopy [27]. Summerville and Crist [28] reviewed that the moth communities respond predictably to forest management practices, outcomes of post-management response are largely driven by the changes in plant community, and significant reductions in moth species richness and changes in community composition correlate with clearcutting.
Moth assemblages have strong temporal occurrence patterns influenced by meteorological factors, host plants, natural enemies, etc. Temporal occurrence patterns of moth assemblages are one of major concerns to forest managers and ecologists because they build high species diversity and larvae of most moths are herbivores taking a role as a pest on forests. Seasonal patterns of moth assemblages have been studied in both larvae and adult stages [29,30]. There are limited studies on the seasonal occurrence of adult moth assemblages [31,32,33], although there are more studies on the occurrence of larvae moth assemblages including the relation to the weather conditions, quality of foliage, and natural enemies [29,34,35,36,37,38]. Sanyal [30] analyzed the temporal variation in diversity and species composition of diverse ensembles of moths along an altitudinal gradient in a Western Himalayan landscape, and Sayama et al. [29] showed that the high species turnover of adult moths during the active season was due to the short occurrence period of each species in northern Japan. These seasonal patterns would be influenced by weather condition and available food resources, resulting in the changes of various biological traits of moths such as species-specific host plant and adaptability to temperature [29,39].
Recently, functional traits are increasingly used to understand the mechanisms of biodiversity responses to environmental changes [40,41]. These traits are characteristics of organisms, such as body size and food resources, which are expressed in the phenotype of individual organisms, including morphology, physiology, structure, phenology, and behavior [40,42,43]. The analysis of functional traits can elucidate the response of communities to the changes in environment. Through the evaluation of the effects of current near-to-nature management strategies on the functional diversity of saproxylic beetles in forests, Gossner [44] reported that forest-stand variables do not have a statistically significant effect on the overall functional diversity, but the beetles were significantly affected by the diversity of single functional traits. Choi et al. [45] reported that the seasonal changes in coleopteran functional groups shifted from regulators of primary production to regulators of decomposition, reflecting their available food resource in pine forests. Schmidt and Roland [46] studied the diversity of moths in a fragmented habitat focusing on the importance of functional groups and landscape scale in a boreal forest and reported that there was no change in the overall moth diversity between low and moderately fragmented stands. However, the changes in diversity pattern within functional groups showed that the total diversity measures might mask the changes in community structure.
In the present study, we aimed to characterize the effects of forest management practice on the abundance, species richness, community composition, and functional groups of moths in forests. We tested two hypotheses: (1) moth communities will change in response to the changes in vegetation after the implementation of forest management practices and (2) clearcutting and aggregated retention will increase the abundance and species richness of herbivorous and warm-adapted species.

2. Materials and Methods
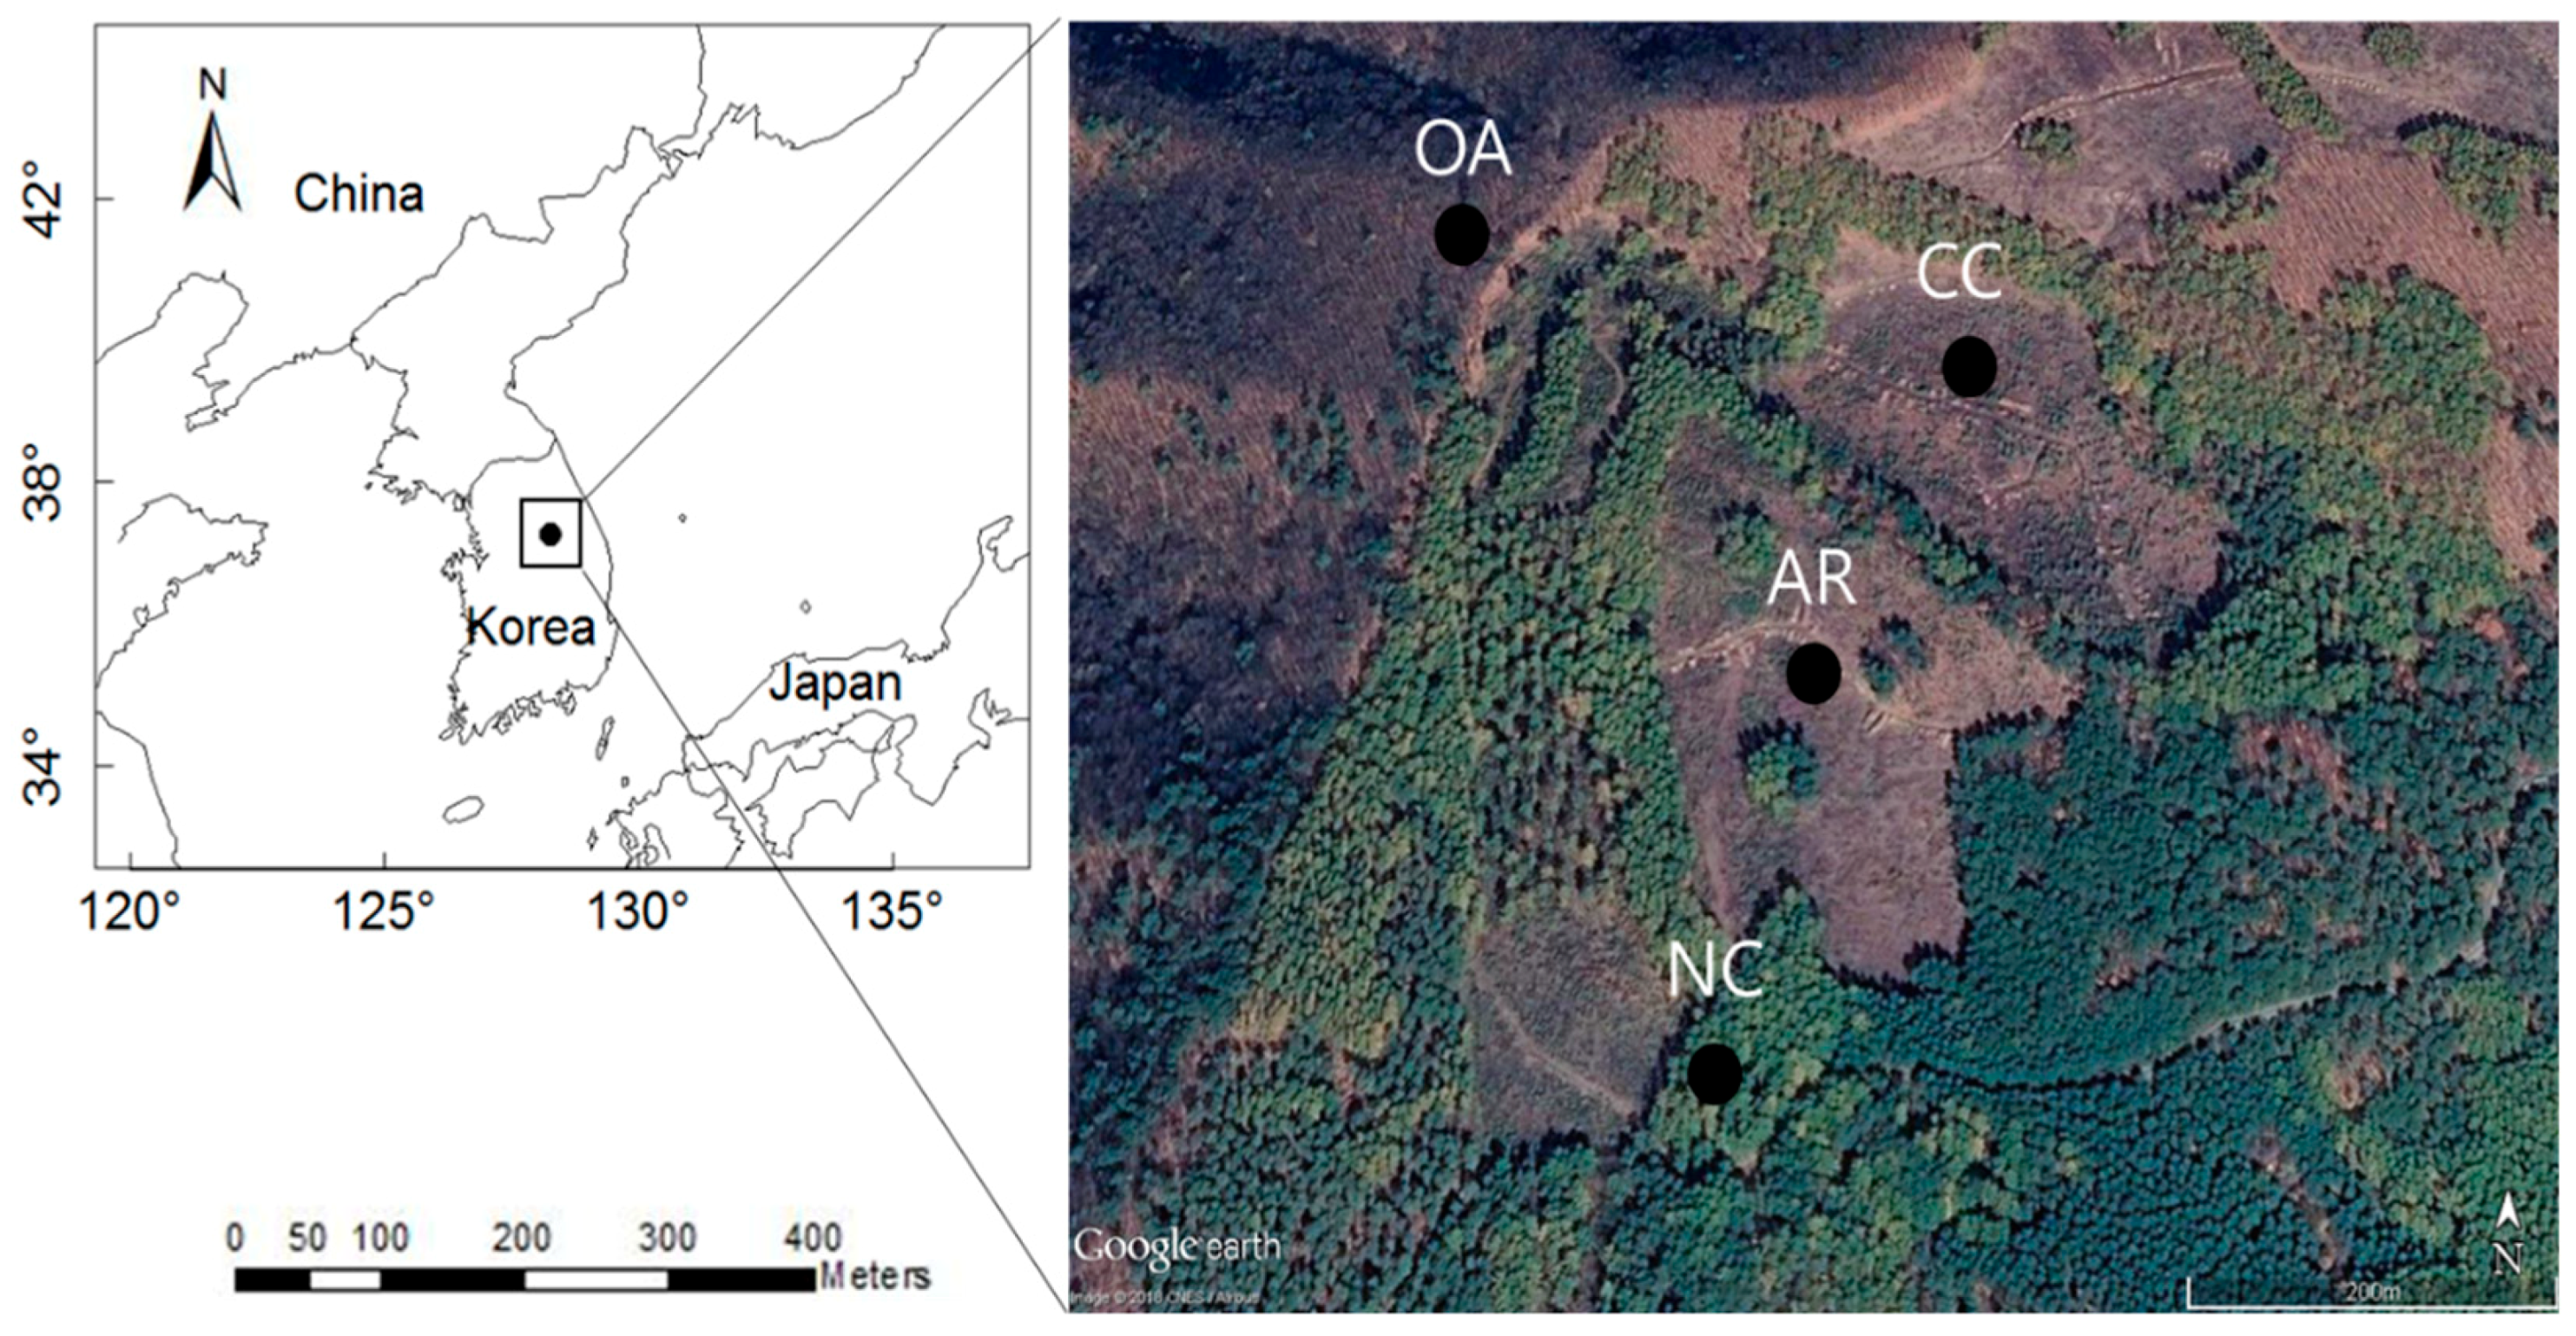
2.1. Field Sampling

The present study was conducted in four different forest stands with different forest management practices in Japanese larch and Mongolian oak forests in Mount Nambyeong (1150 m altitude, 37°25′ N, 128°27′ E) in South Korea (Figure 1), which is adjacent to Mount Gariwang (1560 m altitude). This area is a national forest, and public access and usage are controlled by regional forest service. The forests in the mountains consist of natural broad-leaved tree stands dominated by Quercus mongolica and coniferous stands with Pinus densiflora Siebold & Zucc., Larix kaempferi, Abies nephrolepis (Trautv. ex Maxim.) Maxim., Abies holophylla Maxim., and Taxus cuspidate var. caespitosa (Nakai) Q.L. Wang [47]. Various forest management practices, including clearcutting and tree planting, have been conducted in Nambyeong and Gariwang mountains.
Japanese larches were planted in the study area (excluding the area of Mongolian oak stand) in the 1970s. Clearcutting and aggregated retention as forest management practices were carried out in two different Japanese larch stands (5 ha each) in the study area in 2015 (Figure 1) to investigate the effects of forest management practices on the biodiversity of forests. Aggregated retention was conducted by leaving three patches of diameter 40 m (0.13 ha) with 60 m between patches in an area of 5 ha. Only herbs and small shrubs including Nepalese smartweed (Persicaria nepalensis) and silvervine (Actinidia polygama) developed as vegetation in these stands after clearcutting and aggregated retention (Table 1).
Moths were collected in four different forest stands: three stands (clearcutting: CC, aggregated retention: AR, and no cutting: NC) in a planted Japanese larch forest and one stand in a natural Mongolian oak forest (OA). There was no forest management practice in OA area. The study area is located 910–980 m above sea level (Table 1, Figure 1). NC was used as a control treatment against CC and AR treatments. We collected the moths every month from May to October in 2016 using bucket light traps with black light powered by a battery (12 V, 8 W) in each study stand. The traps were installed for 3 h after sunset, and the function of the light traps was automatically controlled using a timer. Most moth specimens were identified to the species level by a moth expert, whereas micro-moths (microlepidopterans) were identified to higher taxa level, because of the difficulty in identification due to their small body size.

2.2. Functional Groups

We characterized the differences in functional groups among the four study stands and seasons. The functional traits were divided in two categories: the type of host plant as food resource and type of distribution region [48,49]. With respect to the type of host plants, the moths were assigned to one of the plant types (i.e., herbs, shrubs, trees, and lichens) based on the host plant of the larval stage. The distribution region included three groups (i.e., north, south, and others) based on the geographical distribution of moth species in East Asia including Korea and Japan. Northern species inhabit relatively cold northern areas, whereas, southern species inhabit relatively warm southern areas. Others group includes species habiting both southern and northern areas.

2.3. Data Analyses

We compared the community indices including species richness, abundance, and Shannon diversity index (natural logarithm transformed) among four different stands. The species rank abundance curve was plotted to present the relative species abundance to overcome the shortcomings of biodiversity indices that cannot display the relative roles of different variables [50].
We used the hierarchical cluster analysis [51] to classify the samples based on the similarities in moth communities among the study stands by Ward’s linkage method with Bray-Curtis distance measure [52]. Ward’s linkage method reflects the similarities between two clusters based on the increase in the error sum of squares (ESS) when the two clusters are combined. It is robust to noise and outliers and is more appropriate for quantitative variables than for binary variables [53]. Bray-Curtis distance is a widely used for distance measure, as it is easy to handle ecological data with a large proportion of zeroes [54]. The abundance of each species was transformed with natural logarithm to reduce variations among species. One was added to the abundance value to avoid log 0 prior to log-transformation. The data obtained in October were used only to evaluate community indices, and they were excluded in the multivariate analysis because only limited species were collected in October. The same dataset was used for non-metric multidimensional scaling (NMDS) to characterize the effects of forest management practice on moth assemblages. NMDS reduces the number of dimensions to two or three dimensions that can be easily visualized and interpreted. Unlike other ordination techniques that rely on distances for ordination, NMDS is a flexible technique that enables the handling of a variety of data types [55]. The proportion of both abundance and species richness of functional groups is presented as biplot in the NMDS ordination of moth assemblages. The cluster analysis and NMDS were carried out using the package vegan [56] in R (https://cran.r-project.org). The biplot in the NMDS with functional groups was fitted using the function envfit in the vegan package.

3. Results

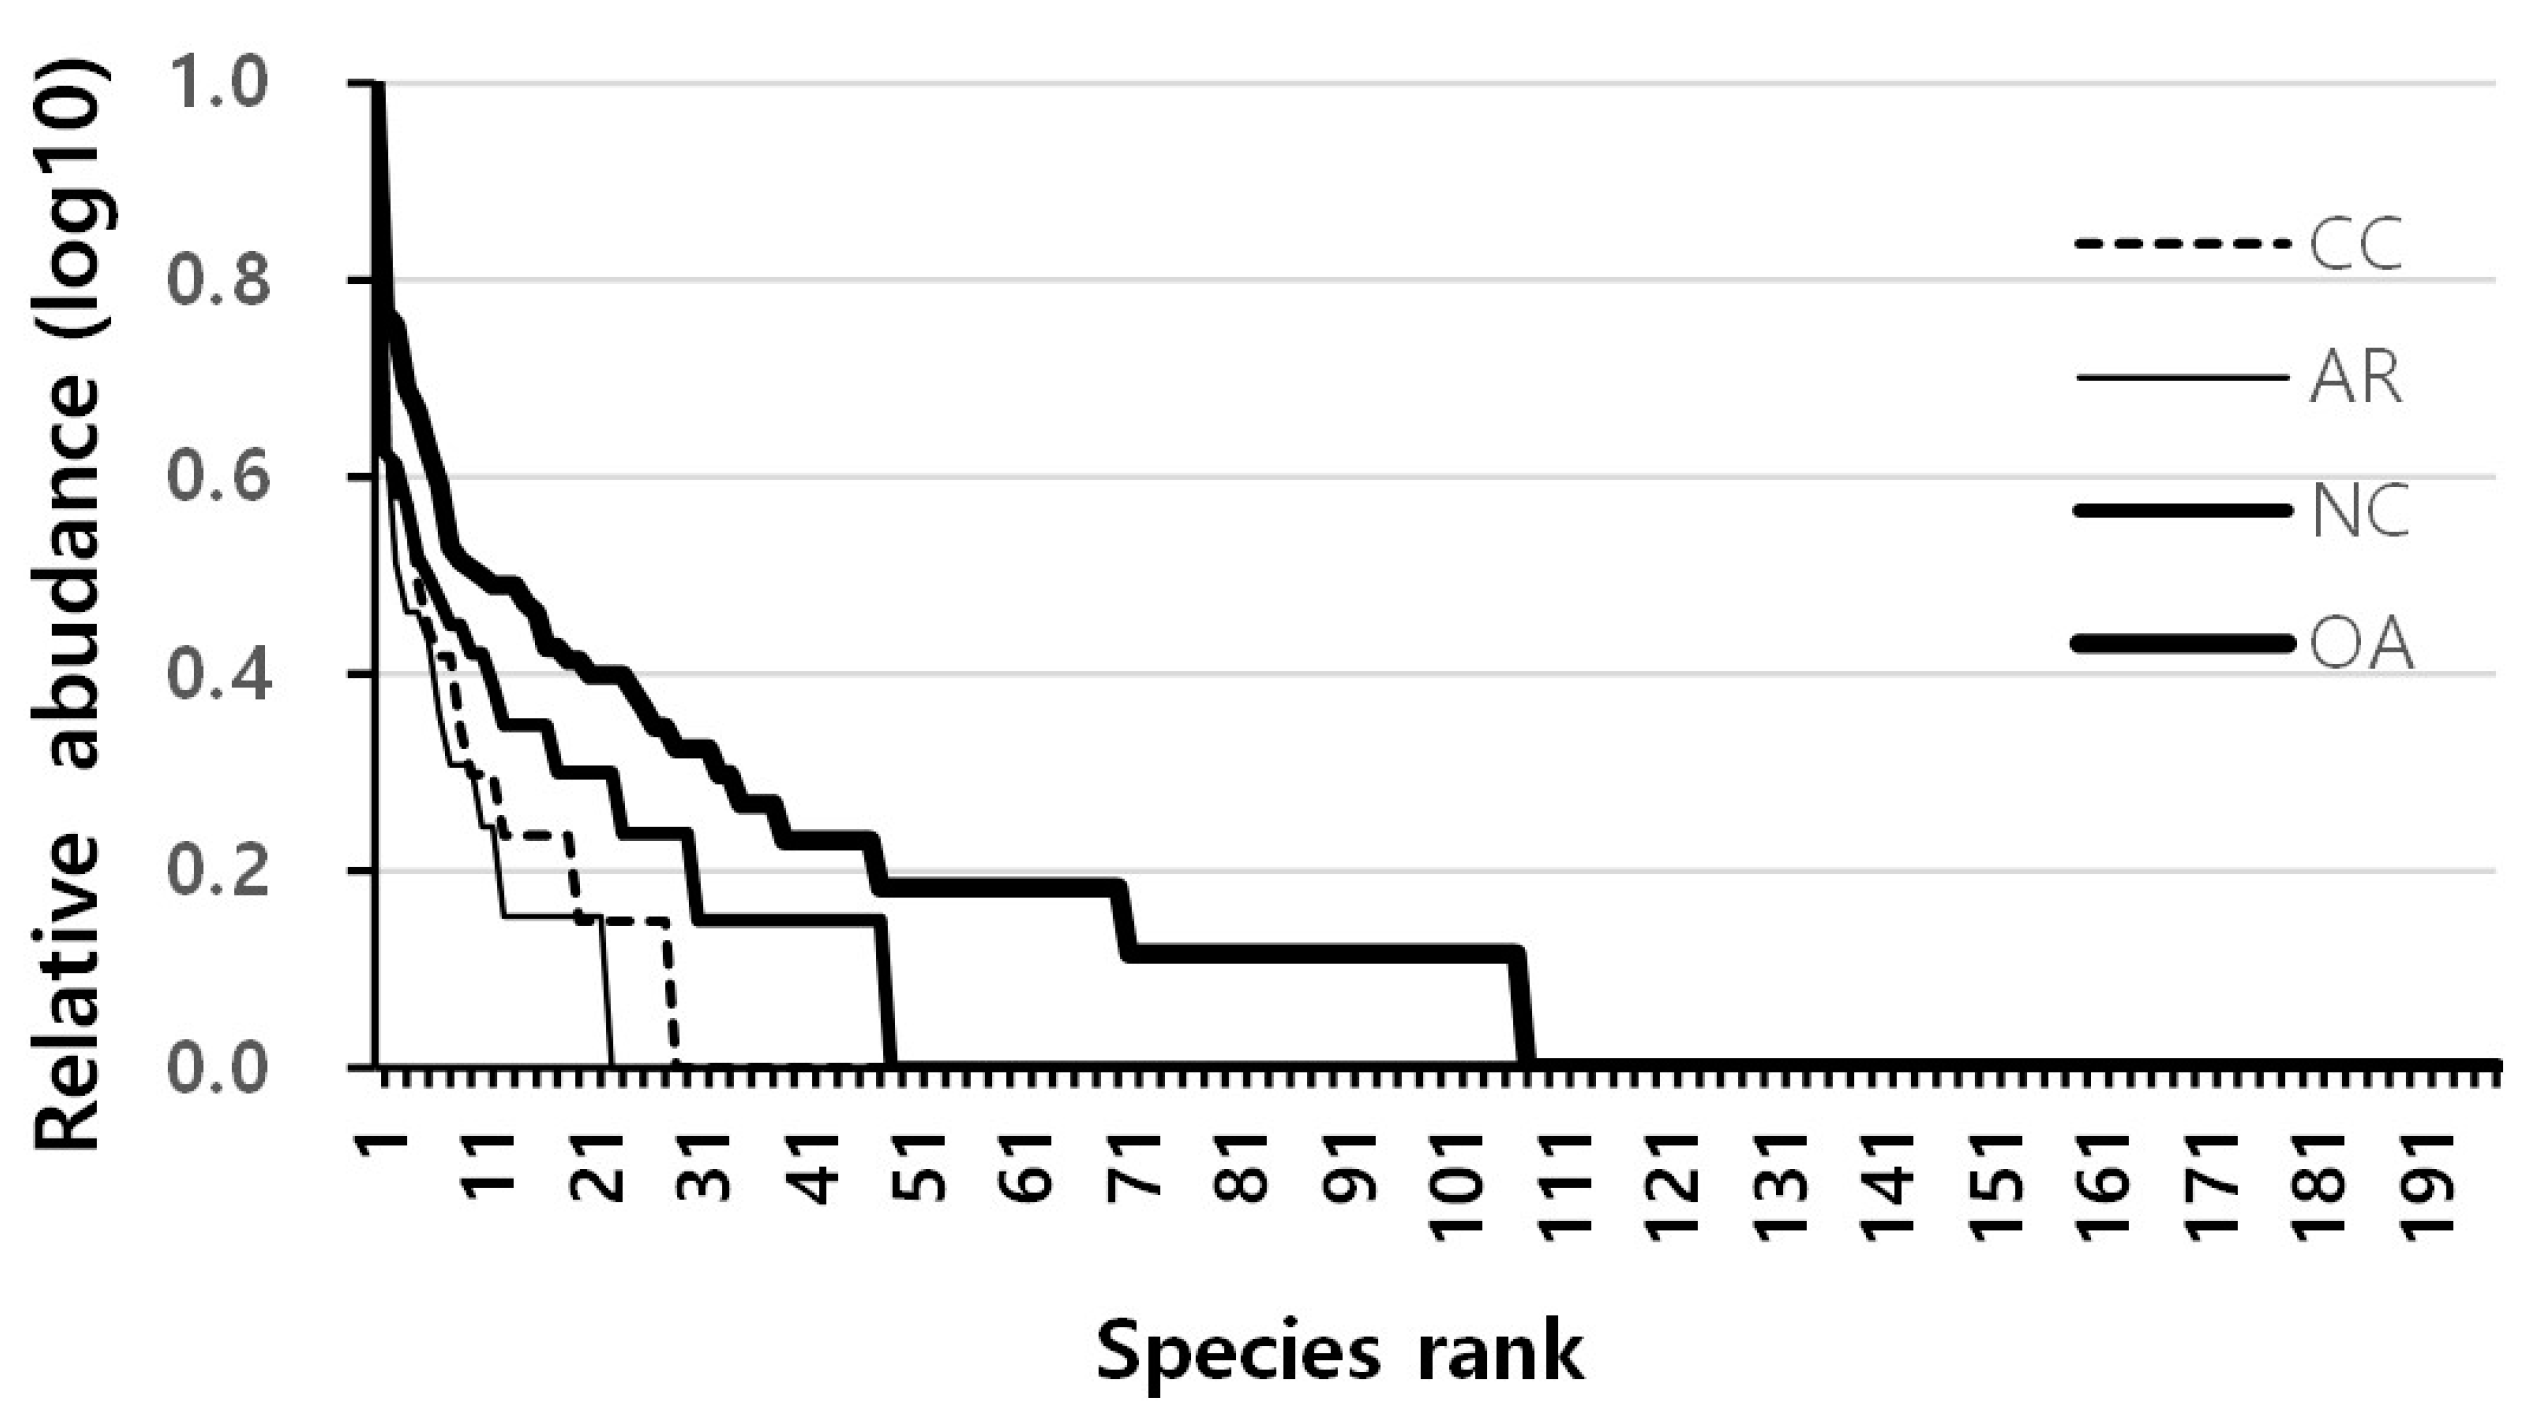
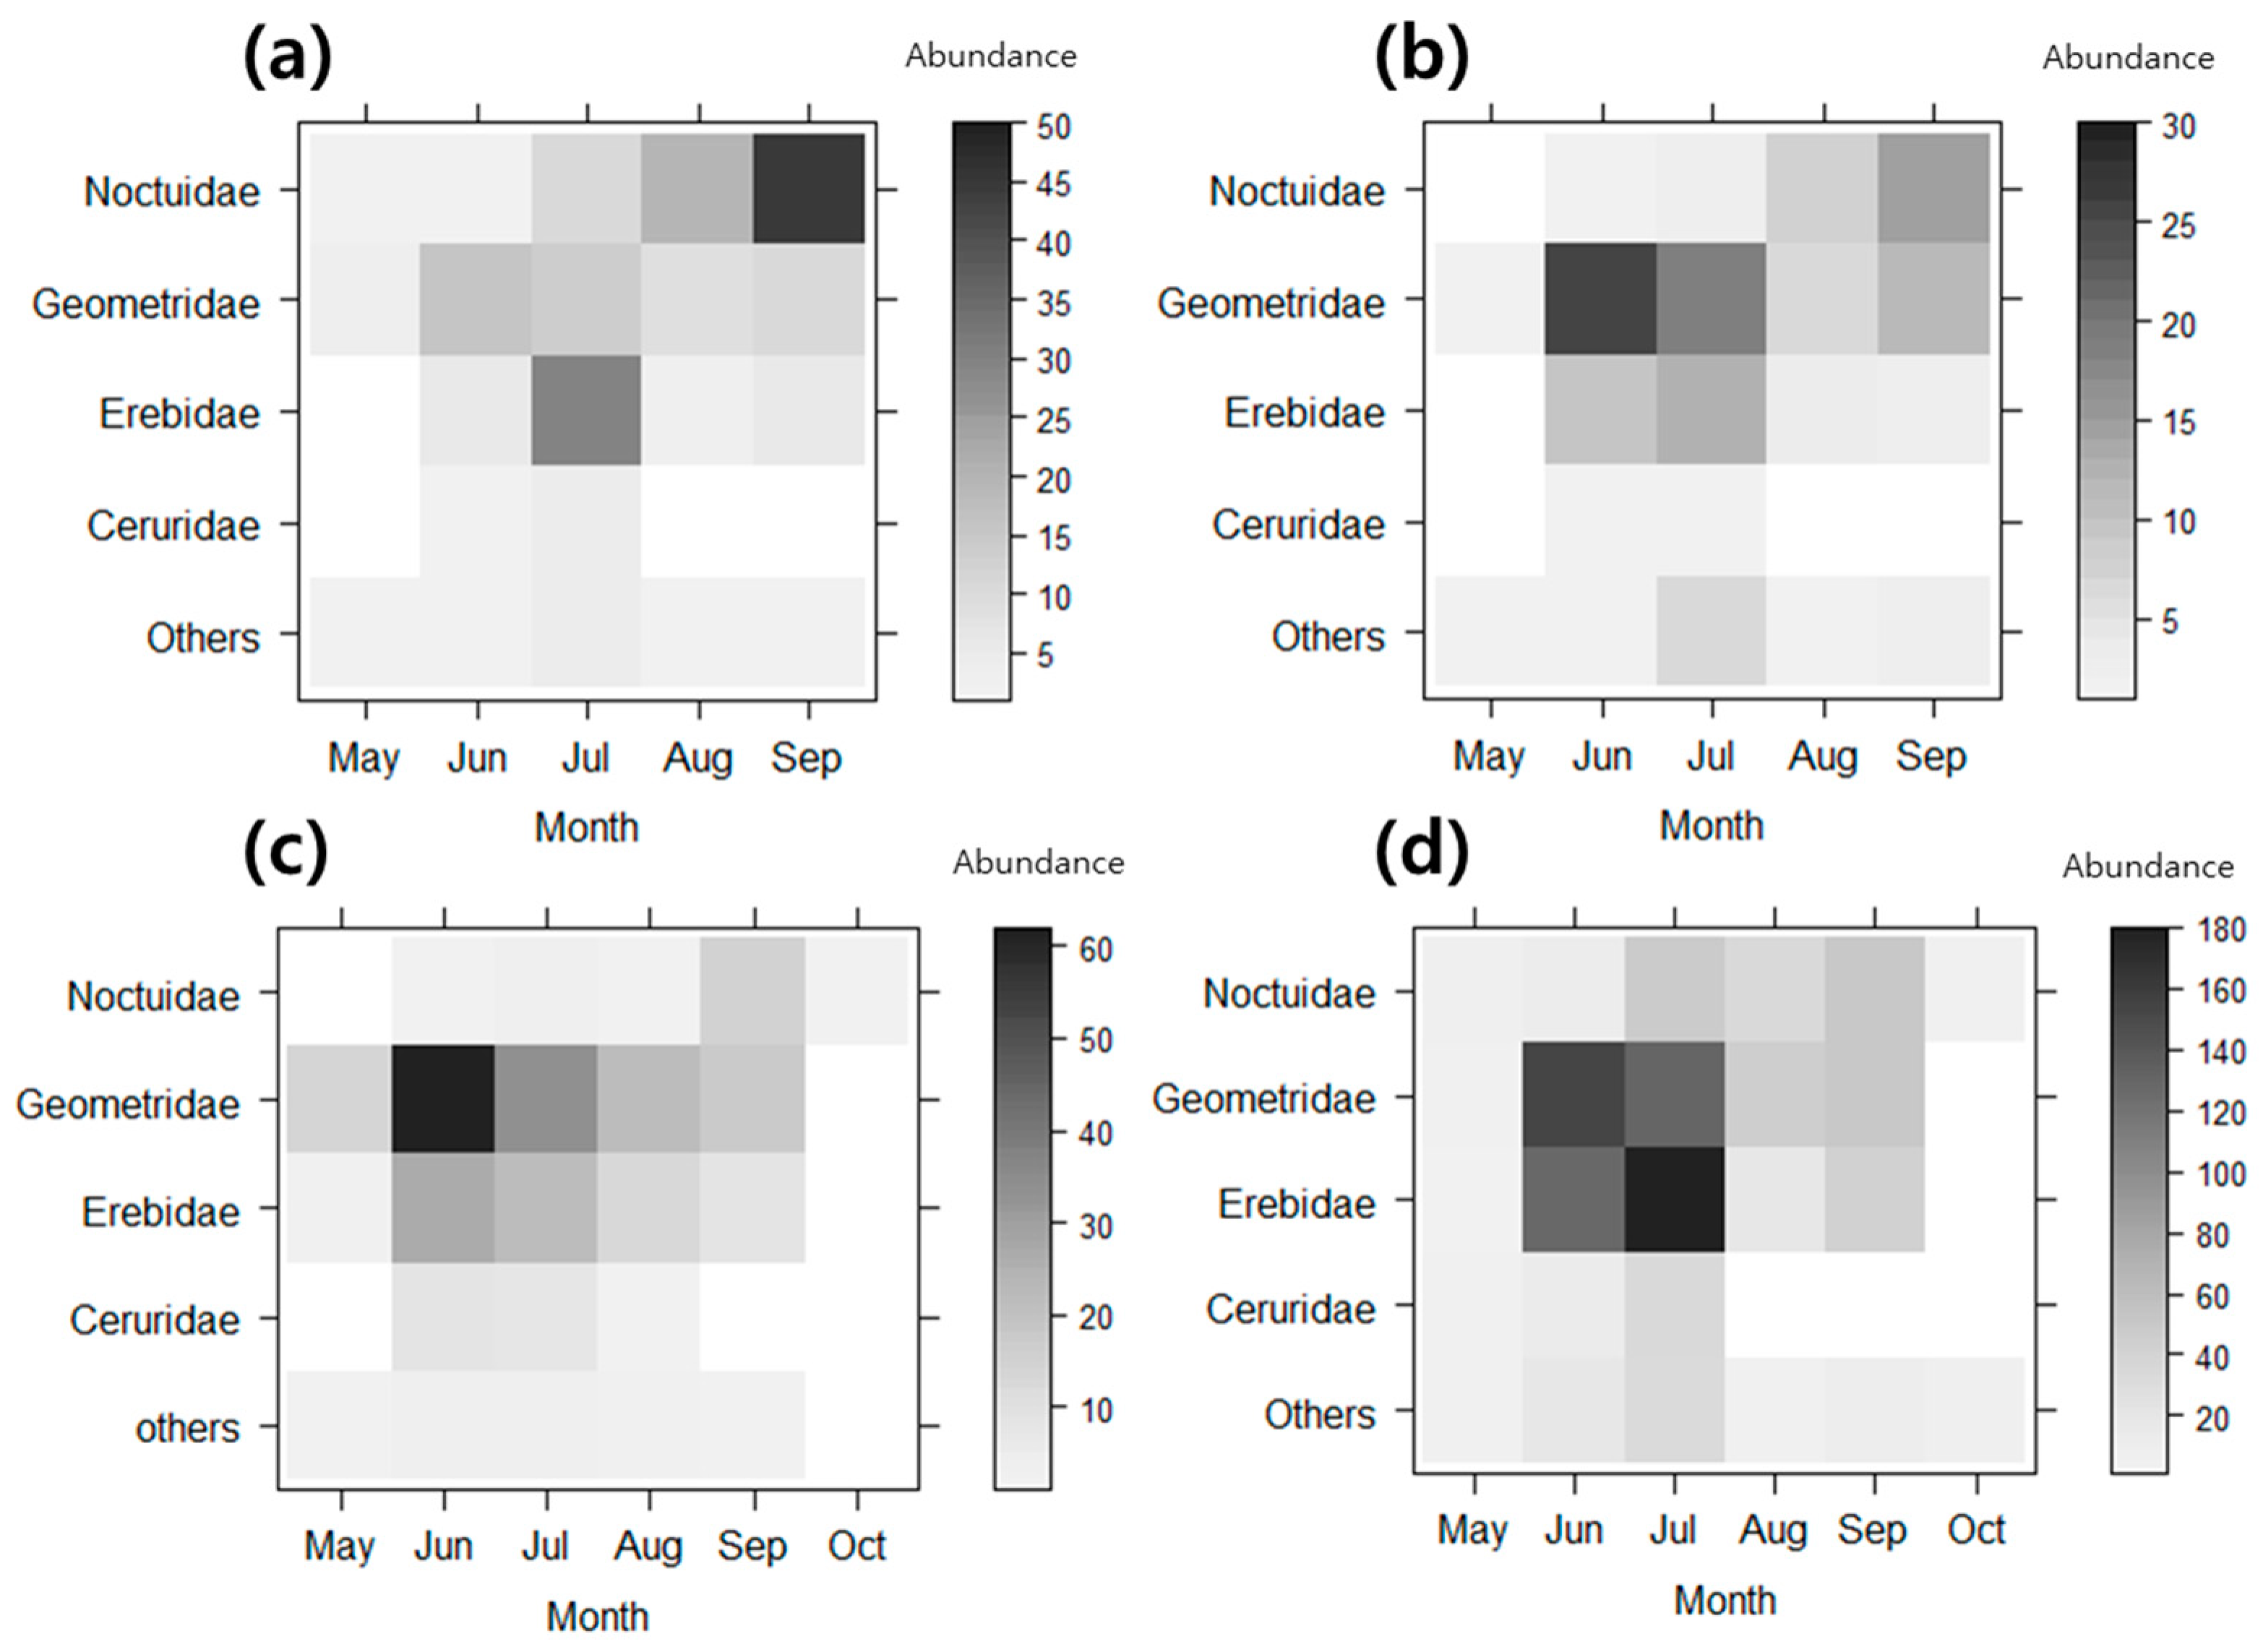
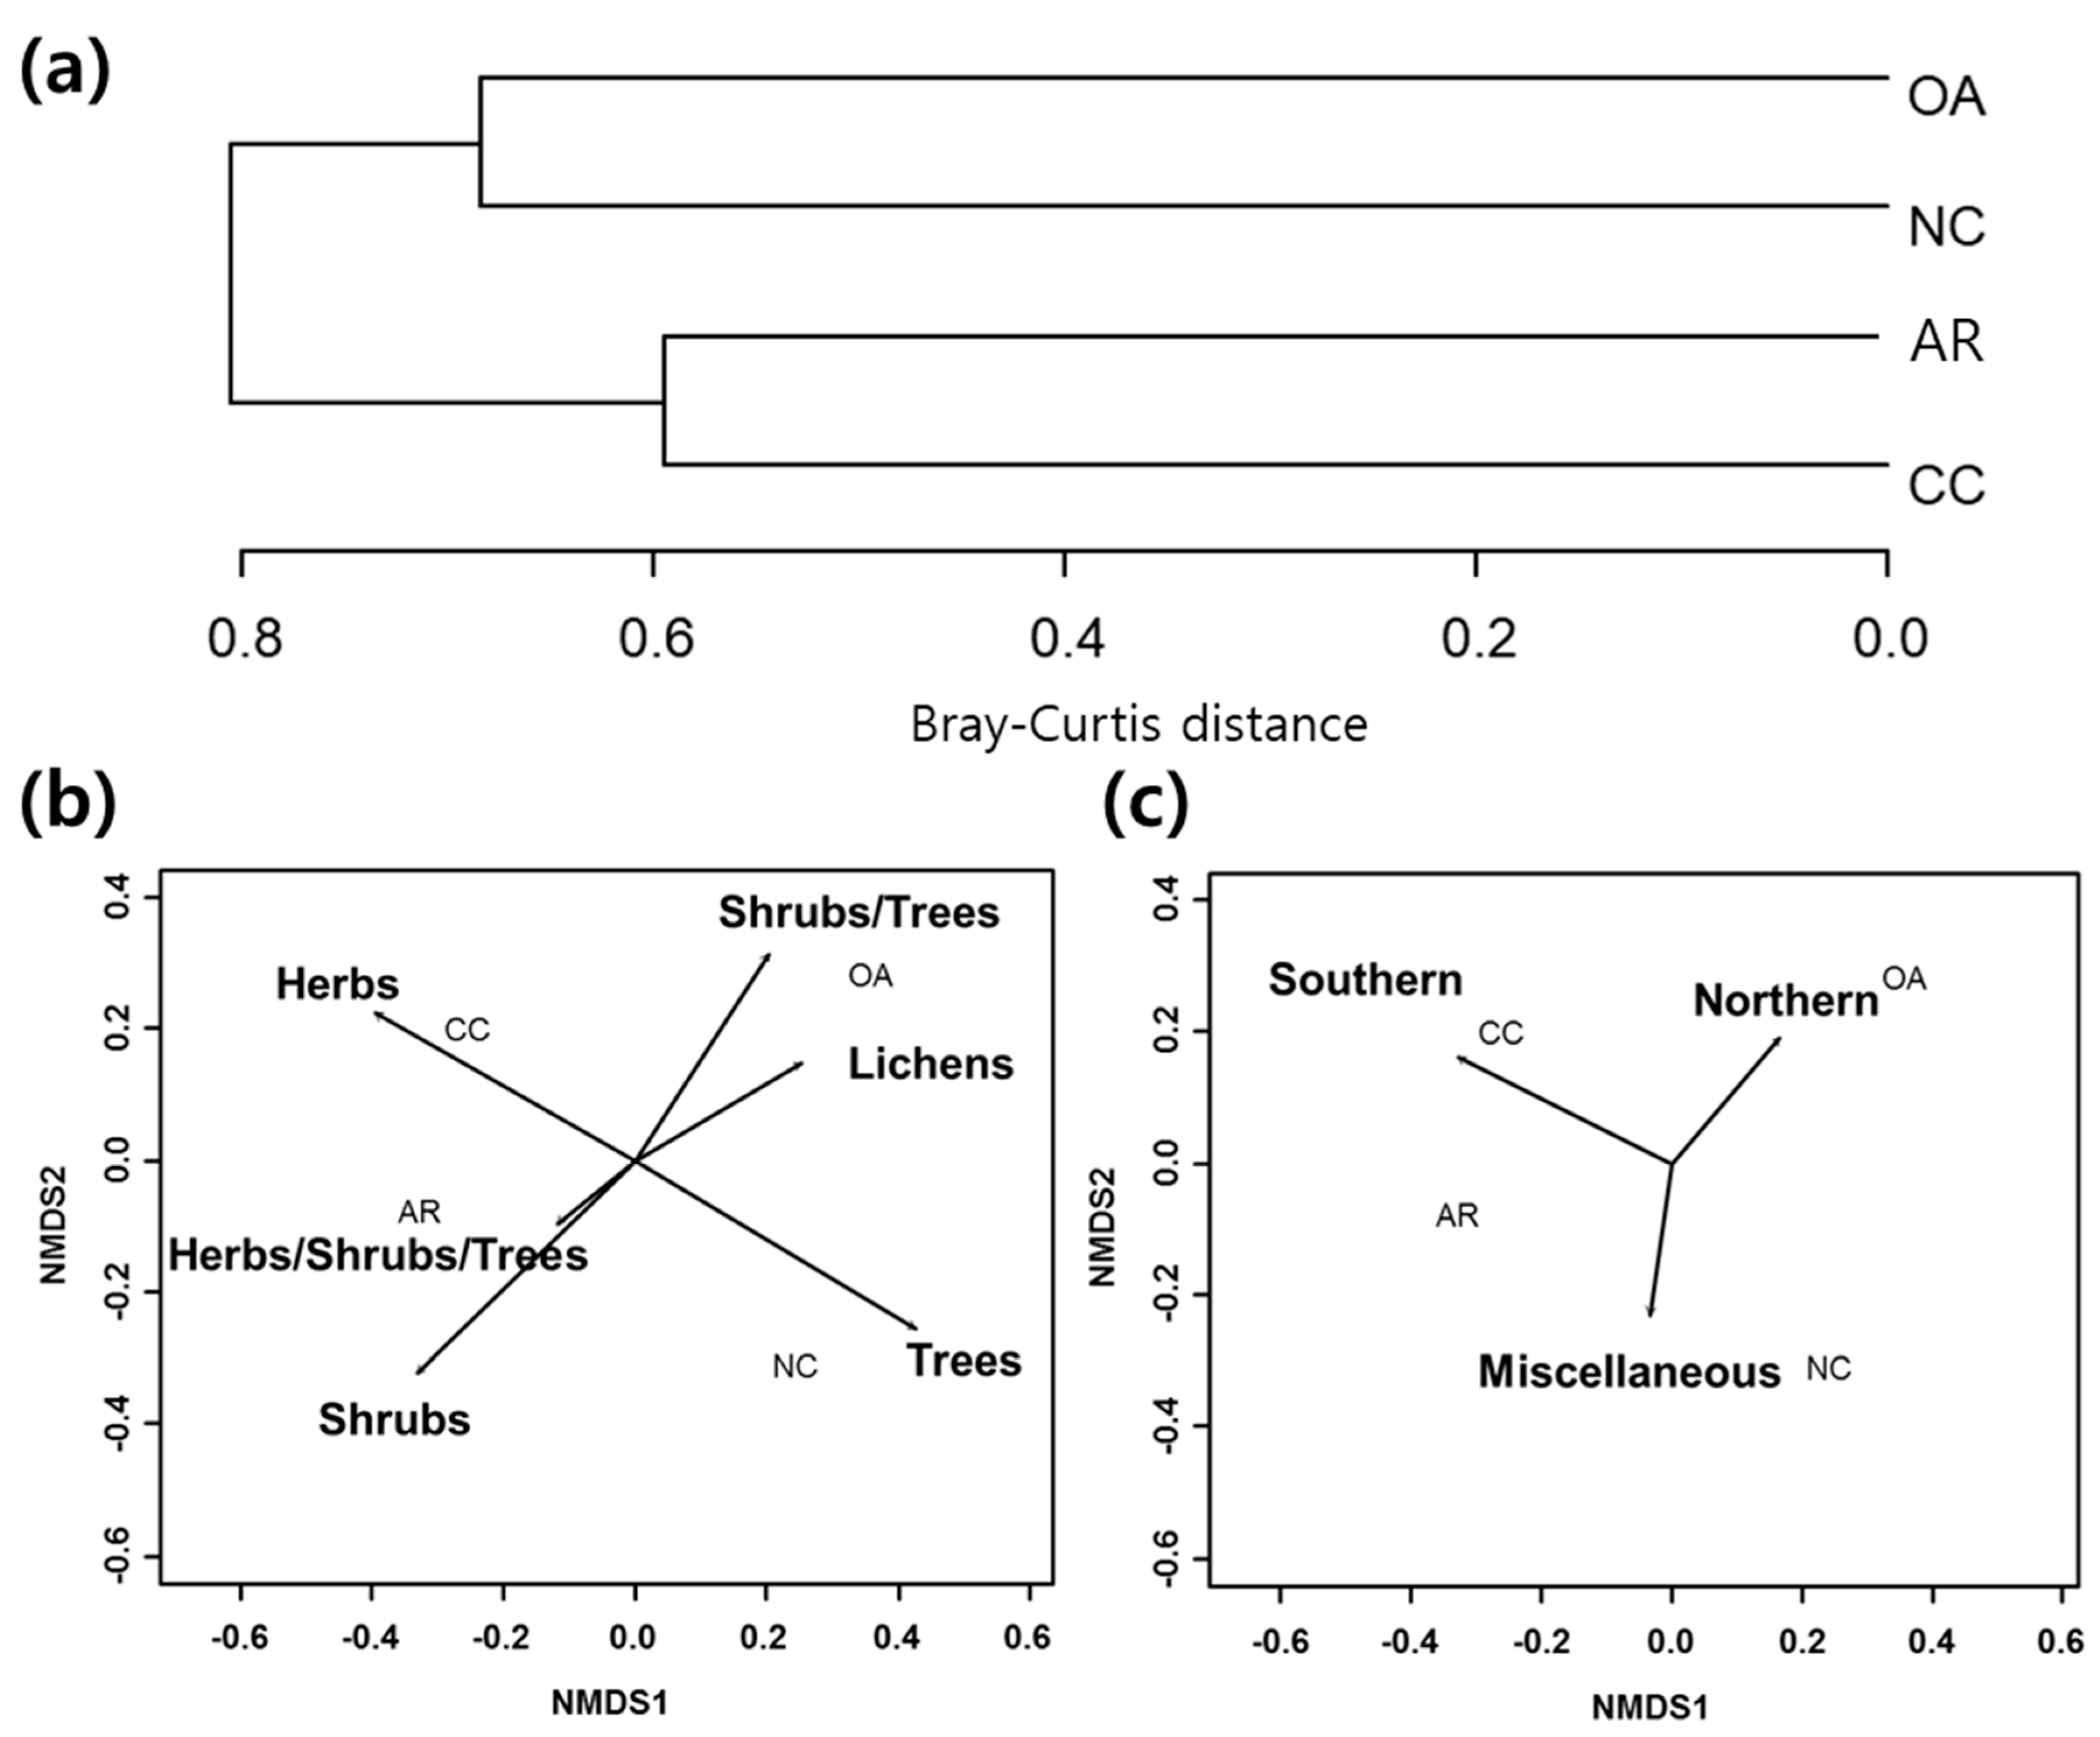
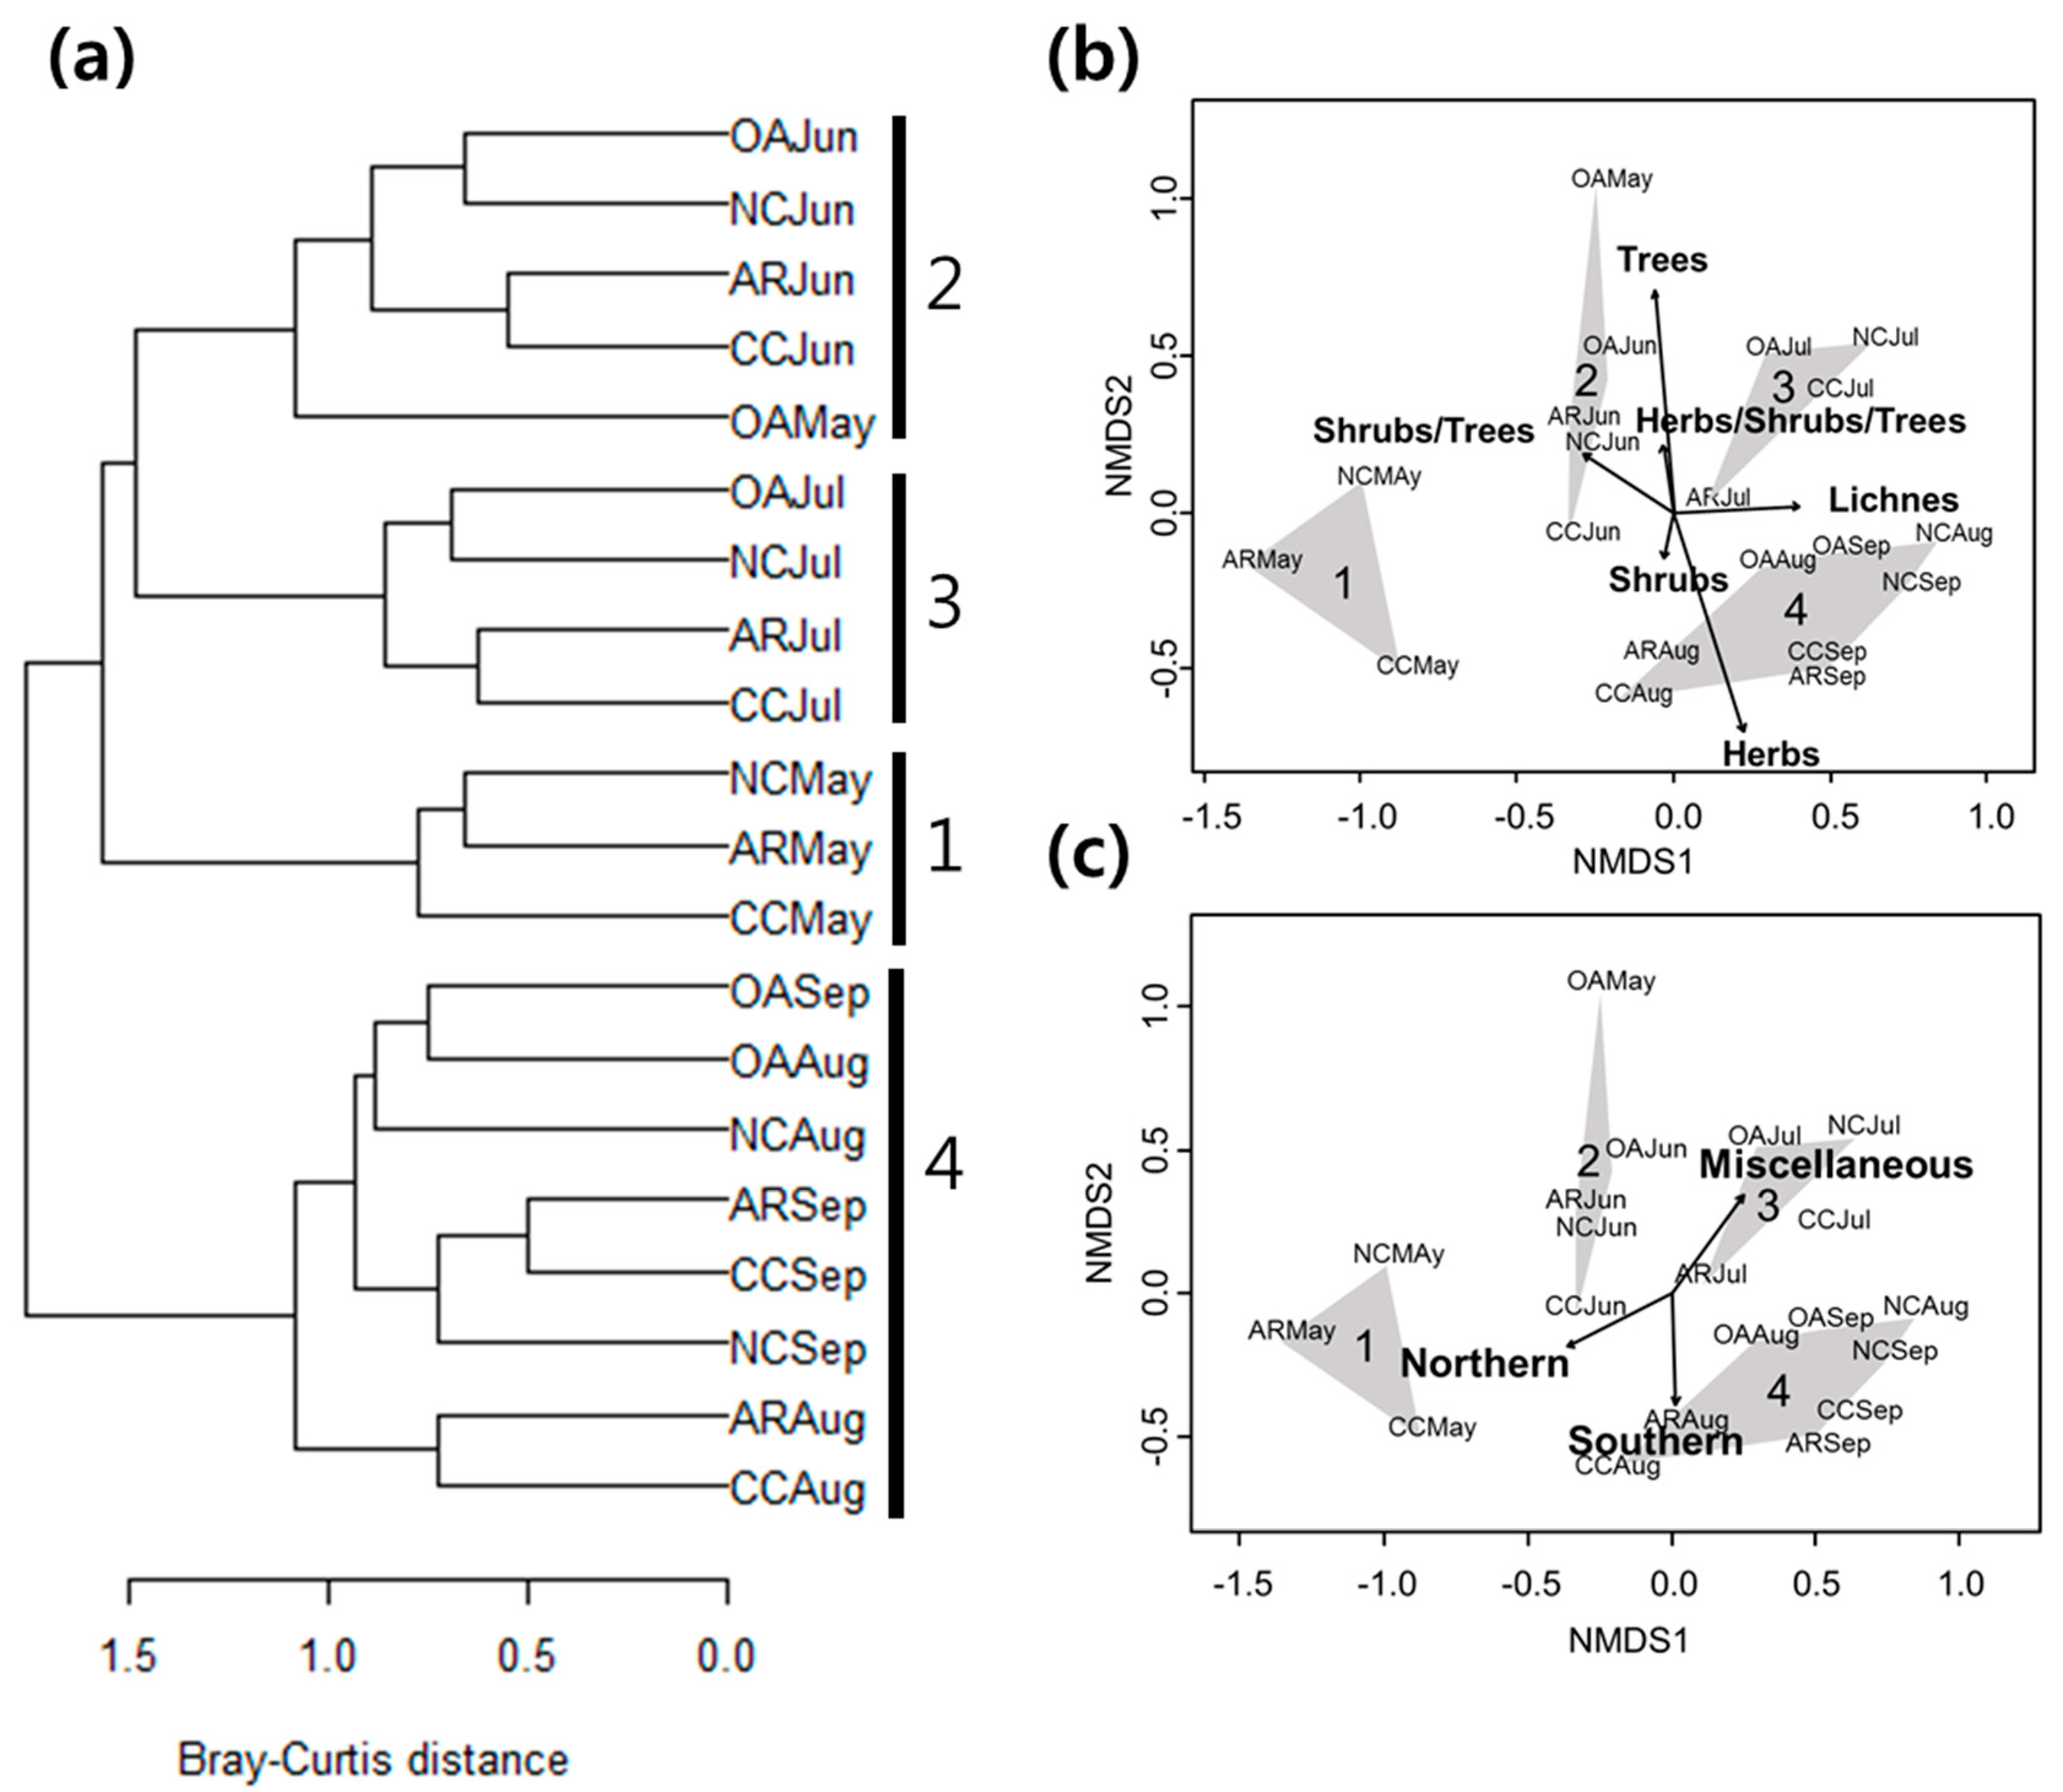
3.1. Differences in Community Composition

We collected 2358 individuals representing 301 moth species belonging to 13 families from four different stands. Three community indices (species richness, abundance, and Shannon diversity index) were higher in the no cutting areas (the NC and OA stands) than in the forest management practice areas (the CC and AR stands), and they presented the highest value in July (Table 2). Among the four treatment stands, the OA stand exhibited the highest species richness and abundance with 201 species and 1444 individuals, respectively, followed by the NC stand with 108 species and 383 individuals, whereas the CC and AR stands presented low species richness and abundance (Table 2, Table S1). Furthermore, Shannon diversity index showed a pattern similar to that of species richness and abundance.
The species rank abundance curve elucidated the effects of forest management practices on moth communities (Figure 2). The curve of the OA stand was on the right with gentle slopes, whereas those of the CC and AR stands were on the left with steep slopes. The curve of the NC stand was in the middle of the OA and CC stands, with a gentle slope.
The composition of moth assemblages was different among the four stands. The most abundant family was Noctuidae in the CC stand, Geometridae in the AR and NC stands, and Erebidae and Geometridae in the OA stand (Figure 3). The abundance of Noctuidae gradually increased in all the four stands from May to September, and decreased in October, with the highest value in September. The members of Erebidae were abundant in July, whereas, the geometrids were abundant in June.
The occurrence of dominant species was different among the four stands. The species Xestia fuscostigma (Bremer), Athetis gluteosa (Treitschke), and Sineugraphe exusta (Butler) of the family Noctuidae accounted for 20.6% of the total abundance in the CC stand (Table 3). Xestia fuscostigma and A. gluteosa, which exhibit host plant preference, such as herbs for food resource, were collected only in the CC and AR stands. Sineugraphe exusta was collected mostly in the CC stand. The species Idaea biselata (Hüfnagel) and Eustroma melancholicum (Butler) of the family Geometridae were collected only in the AR and OA stands, respectively. Alcis angulifera (Butler), which has a wide range of host plant preference, was abundant in the NC stand. Hydrillodes pacifica Owada, which belongs to the family Erebidae, was the dominant species in the OA stand. Zanclognatha griselda (Butler) was collected only in the NC stand, and Duliophyle agitata (Butler) was relatively abundant in the NC stand. Paracolax tristalis (Fabricius) was the dominant species in the CC stand, although it was abundant in all the stands.

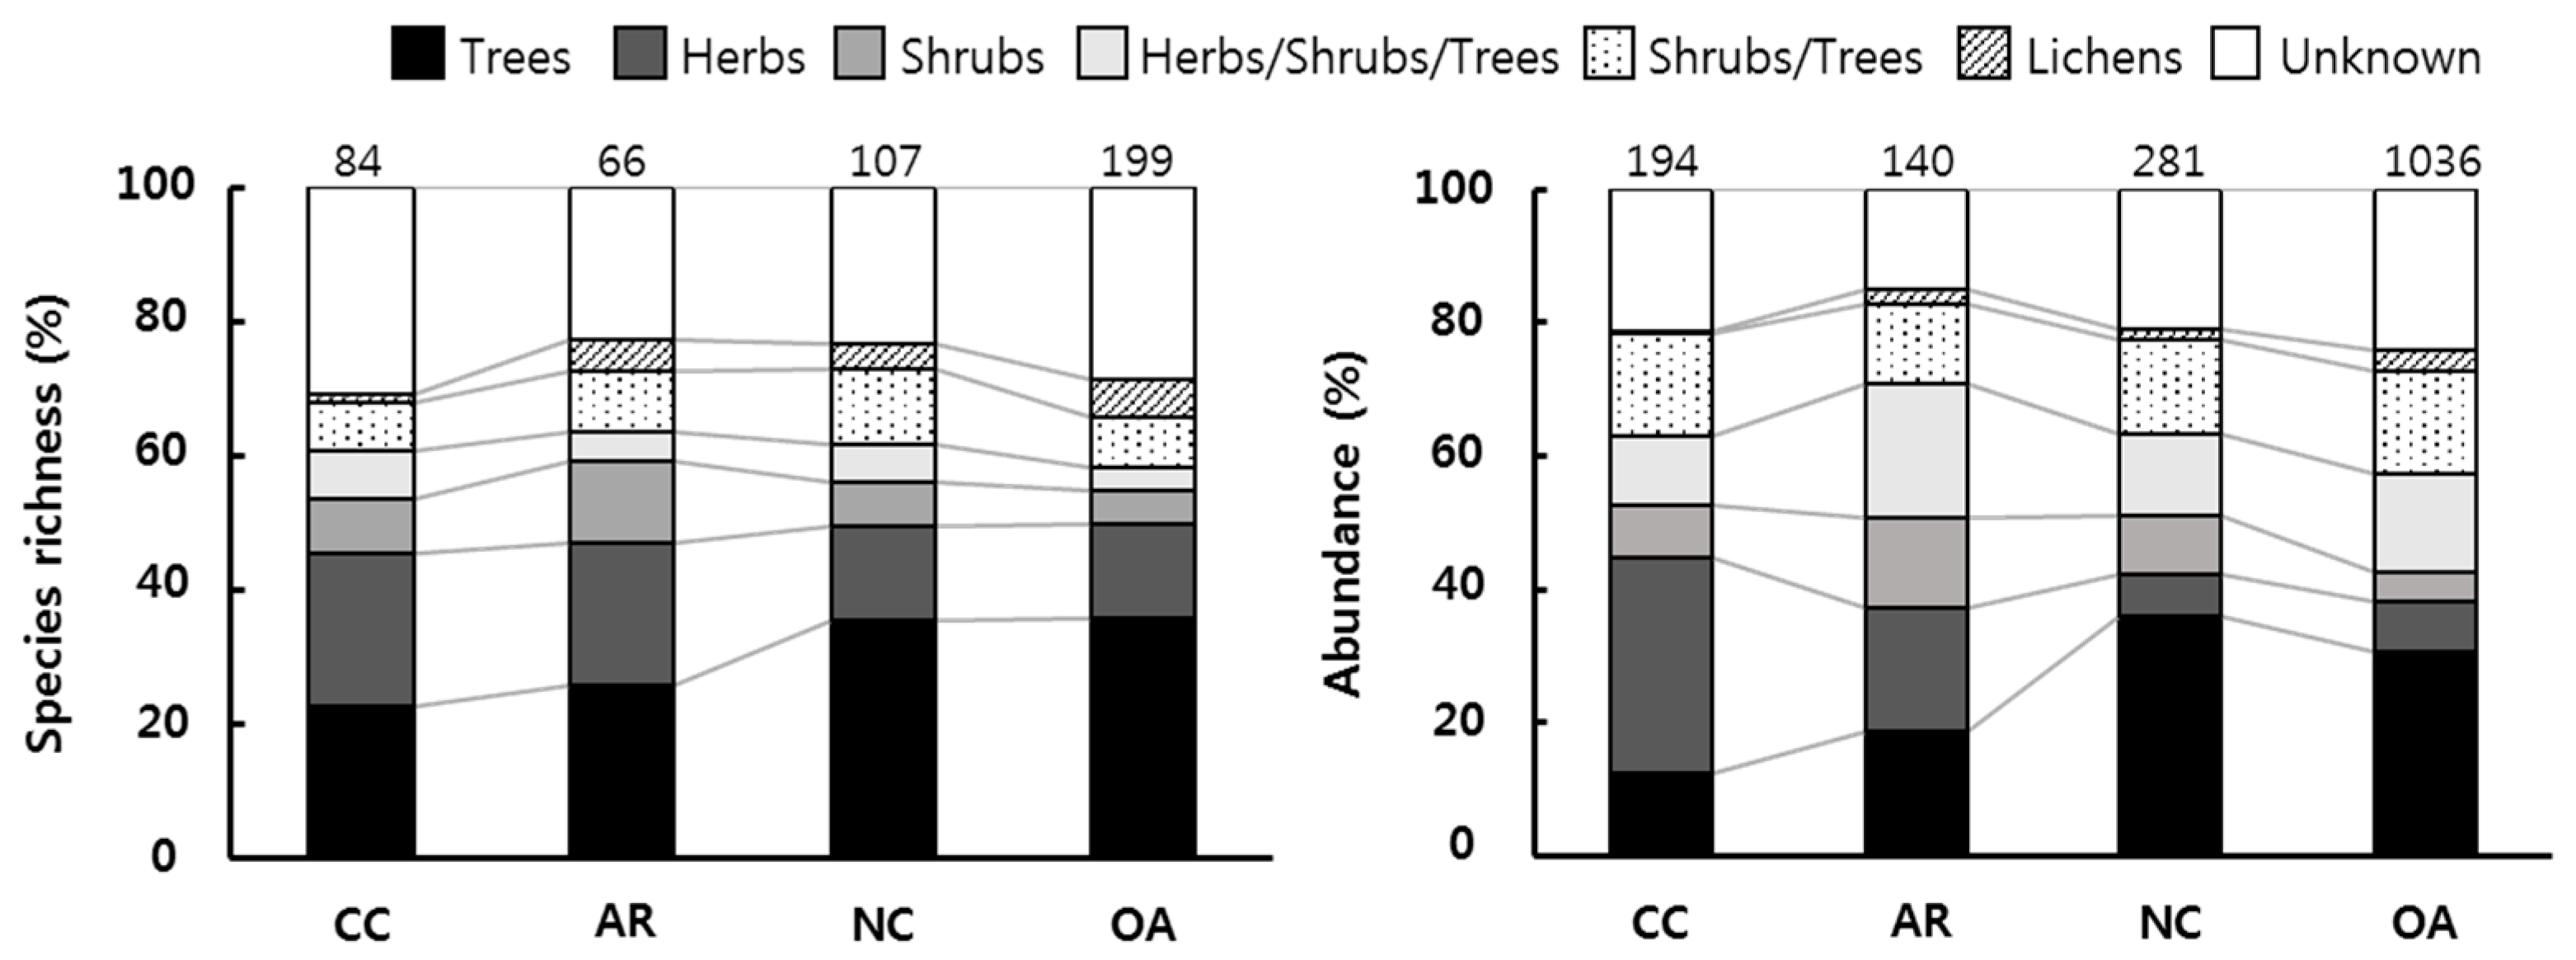
3.2. Functional Groups

The composition of functional groups was different among the four stands (Figure 4 and Figure 5). Both species richness and abundance of groups feeding on herbs were high in the CC and AR stands, whereas those of the groups feeding on trees were high in the NC and OA stands (Figure 4). In addition, they were higher in the AR stand than in the CC stand. The moth species feeding on lichens were also higher in NC areas than in the forest management areas, although their overall proportion was low. The proportion of species richness inhabiting the northern region was the highest in the OA stand, whereas, that of species inhabiting the southern region was high in the CC and AR stands (Figure 5).

3.3. Forest Management Practices and Functional Groups

The cluster analysis revealed the differences in moth communities in the four stands (Figure 6a), reflecting the effects of forest management practice. The CC and AR stands were grouped together, whereas the OA and NC stands formed another group. This was also reflected in the NMDS ordination (Figure 6b,c). The CC and AR stands located on the left side in the ordination map, whereas the OA and NC stands were on the right side. The CC stand was characterized by groups feeding on herbs, the AR stand was characterized by groups feeding on herbs, shrubs, and trees, the OA stand was characterized by groups feeding on shrubs, trees and lichens, and the NC stand was characterized by groups feeding on trees (Figure 6b). Meanwhile, the species inhabiting the southern region were prevalent in the CC stand, whereas, species inhabiting the northern region were prevent in the OA stand. This relationship was more pronounced in richness within the distribution types (Figure 6c).
Additionally, the monthly samples were classified into four clusters (1–4) based on similarities in moth assemblages, reflecting mainly the seasonality of moth communities (Figure 7a). Cluster 1 represented samples for May, cluster 2 for June, cluster 3 for July, and cluster 4 for August and September. However, the effects of forest management practices were reflected in each cluster. For example, in cluster 4, the samples from the OA and NC stands were grouped together, whereas, the samples from the CC and AR stands were grouped together. Similar patterns were observed in other clusters.
The NMDS ordination also elucidated similar patterns in the cluster analysis, presenting the seasonality of moth assemblages and the effects of forest management practices (Figure 7b,c). Cluster 1 was on the left side in the NMDS ordination, whereas cluster 3 and 4 were on the right side. Clusters 2 was in the upper middle area. The abundance of functional groups of species feeding on shrubs and trees were represented in cluster 1 and their richness in cluster 2. The assemblages associated with groups feeding on trees, in particular, the samples from the OA stand, were mainly in cluster 2, and the assemblages associated with groups feeding on herbs were in cluster 4 consisting of the samples from the CC and AR stands (Figure S1). The functional groups based on the distribution region reflected the temperature preference of species. Clusters 1 representing samples collected in May (early season) were characterized by the species inhabiting the northern regions, whereas, cluster 4 representing samples collected in August and September, in particular, the samples from the CC and AR stands, were characterized by the species inhabiting the southern regions.

4. Discussion

4.1. Changes in Community Structure and Function Due to the Forest Management Practices

The results of the present study revealed that the species richness, abundance, and Shannon diversity index of moth communities changed due to the forest management practices. The community indices decreased in the forest management areas compared with NC areas. This is consistent with the findings of earlier studies, that is, moths exhibit high diversity in unmanaged forests than in managed forests [57,58]. In the present study, the NC area presented a complex diversity in plant layers. Willott [58] reported that the composition of species in the understory and canopy of a primary forest was different, with high diversity in the understory. High plant species diversity reflects the heterogeneity of habitat [59,60], providing various habitat conditions for feeding, drying of wings, resting, and breeding of lepidopterans [26,61]. Meanwhile, the forest management practices create a homogeneous habitat, inducing changes in the abiotic factors, such as sunlight exposure, humidity, and temperature [7], and the stand returns to the initial stage of succession. Therefore, it is covered with herbaceous plants [62], which increases species feeding on herbaceous plants. In the present study, the functional groups of moths revealed the effects of forest management practices. The percent of moths feeding on herbs was high in the forest management areas (CC and AR), whereas the percent of moths feeding on lichens and trees was high in the no cutting areas (NC and OA) (Figure 4). Furthermore, the abundance of warm-adapted species (i.e., the species distributed in the southern area) was higher in the forest management areas, with higher light exposure, than in the NC areas (Figure 5).
Furthermore, the functional groups of moths exhibited temporal variability. The functional groups of species feeding on herbs, shrubs, and trees were abundant in June, July, and August, respectively (Figure 7), suggesting that the functional group of moths, which are known to prefer young leaves, is closely related to the leafing period [34,63]. Murakami et al. [64] reported that species diversity in the lepidopteran larval communities that feed on trees was higher during summer than during spring. Choi et al. [45] presented that the herbivores among functional groups of Coleoptera in the pine forest were high in July. The results of the present study supported these findings, suggesting that the phenology of dominant host plants coincided with the abundance of moths. For example, Actinidia polygama (a shrub) leaves in June and Persicaria nepalensis (an herb), leaves and blooms in August. The dominant trees were the members of Pinaceae, including Larix kaempferi that buds in mid-May to early June and grows up to July. Therefore, July is a suitable period for moths feeding on these trees.

4.2. Aggregated Retention and Biodiversity

The green-tree retention is the recolonization sources of the postharvest forests, and the aggregated retention provides continuity in structure, function, and composition of ecosystems between forest generations [65]. Therefore, the recovery of biodiversity is faster in the aggregated retention areas than in the clearcutting areas [66]. This concept in term of biodiversity is related to the metapopulation and metacommunity [65]. In our study, overall species richness decreased in the clearcutting and aggregated retention areas compared to NC areas, and it was higher in clearcutting area than in the aggregated retention area. Halaj et al. [67] reported similar results that overall species richness was lower in high-level of retention (40%) than in low-level of retention (15%). This was caused by an increase of species feeding herbs due to the changes in vegetation.
Meanwhile, our study presented that the differences in the moth community reflected the effects of retained trees in the aggregated retention stand. The proportion of tree feeding group in both species richness and abundance was higher in the AR stand than in the CC stand although the difference was small (Figure 4). The CC stand was characterized by species feeding herb, whereas AR was by the species feeding on herbs, shrubs, trees, and shrubs (Figure 6), supporting the idea that the green-tree retention is the recolonization sources of the postharvest forests.
Richness of forest species, such as species feeding on trees, has a positive relationship with the proportion of retained trees [66]. Forest species richness was higher in the no treatment areas (NC and OA) than in the treatment areas (CC and AR), and it was higher in the AR stand than in the CC stand. The proportion of retention area was 7.5% in this study. Therefore, we could expect more species richness with an increase of the level of retention, enhancing the recolonization of the postharvest forest. However, a threshold of the proportion of retained trees to satisfy all groups of species was not clearly identified [66,67] because different species have different habitat preference and tolerance ranges.
The patterns of retention also influence the regeneration of postharvest forest [66], although it was not considered in this study. In addition, we did not have replication for each treatment, and it might have affected on our results. However, our results are not strongly different from literature, showing the decrease of species diversity and changes of community composition in clearcutting and aggregated retention stands. There are limited studies on the effects of the forest management practices in particular aggregated retention on biodiversity and forest ecosystems in Asian countries including Korea. Our research is the first study on the effects of aggregated retention on the moth communities, especially in Korea, although there are some limitations in this study. In the further study, therefore, integrated studies are expected to be conducted by considering the levels of retention, the patterns of retention, vegetation, and multitaxa with several replications.

4.3. Long-Term Effects of Forest Management Practice

We evaluated the effects of forest management practices, which act on forest ecosystems as an intervention. After the implementation of forest management practices, it takes a long time for the forest to return to its natural condition, following the recovery successional process. Axmacher et al. [68] showed the differences in moth communities according to environmental conditions, such as food resources, elevation, biogeographical and historical condition, and forest types. The results of the present study showed the short-term effects of forest management practice on moth communities after cutting the trees. However, we did not evaluate the long-term responses of moth communities according to the successional stages. The community composition of moths might be dependent on the vegetation, which acts as food resource for moths.
After cutting the trees in the study areas, the vegetation might have changed from grasses and shrubs to trees. Guariguata and Ostertag [69] reported that grasses and shrubs dominated the first decade of forest succession after intervention. Subsequently, long-lived, tall-statured species and tree species were dominant with the characteristics of old-growth forest. We expect that the vegetation in the forest management areas might be similar to that of the OA stand, which represents the natural condition, through the secondary forest successional process. These changes in vegetation can induce changes in the community composition of moths, which inhabit the study areas. Therefore, long-term studies can elucidate the effects of forest management practices on the structure and function of moth communities by comparing the differences in the responses of moths in the successional process of forests.

5. Conclusions

The results revealed that the moth communities changed in response to the changes in vegetation after the implementation of forest management practices. Clearcutting and aggregated retention decreased overall species diversity of moths, but increased diversity of herbivorous and warm-adapted species. The results supported both the hypotheses tested in the present study. The structure and function of moth communities were affected by the forest management practices, reflected by a decrease in community indices and changes in moth community composition. Clearcutting increased the diversity of herbivorous species and warm-adapted species.

Supplementary Materials

The following are available online at https://www.mdpi.com/1999-4907/9/9/574/s1, Table S1: A list of species and their abundance at each study site. Figure S1: Percent of species richness and abundance of each functional group based on the host plants at each site. The first two characters in sample names indicate study stands, and the last three characters are sampling months. Aggregated retention was differentiated from the clearcutting in the composition of functional groups in the moth communities, reflecting the differences of forest management practice techniques.

Author Contributions

Conceptualization, Y.-S.P., H.S.K., H.M.Y. and C.-W.P.; Methodology, S.-S.K., D.-S.L. and Y.-S.P.; Formal Analysis, M.Y.M. and Y.-S.P.; Data Curation, M.Y.M., S.-S.K. and D.-S.L.; Writing-Original Draft Preparation, M.Y.M.; Writing-Review and Editing, M.Y.M., S.-S.K., D.-S.L., H.M.Y., C.-W.P., H.S.K. and Y.-S.P.

Funding

This study was supported by the National Institute of Forest Science and the R&D Program for Forest Science Technology (FTIS 2017042A00-1823-CA01) provided by the Korea Forest Service (Korea Forestry Promotion Institute).

Conflicts of Interest

The authors declare no conflict of interest.

References

  1. Lindenmayer, D.B.; Margules, C.R.; Botkin, D.B. Indicators of biodiversity for ecologically sustainable forest management. Conserv. Biol. 2000, 14, 941–950. [Google Scholar] [CrossRef]
  2. Paillet, Y.; Bergès, L.; HjÄltén, J.; Ódor, P.; Avon, C.; Bernhardt-Römermann, M.; Bijlsma, R.J.; De Bruyn, L.; Fuhr, M.; Grandin, U.; et al. Biodiversity differences between managed and unmanaged forests: Meta-analysis of species richness in Europe. Conserv. Biol. 2010, 24, 101–112. [Google Scholar] [CrossRef] [PubMed]
  3. Wilson, B.; Wilson, L. An economic perspective on clearcut harvesting. For. Chron. 2001, 77, 467–473. [Google Scholar] [CrossRef] [Green Version]
  4. Bliss, J.C. Public perceptions of clearcutting. J. For. 2000, 98, 4–10. [Google Scholar]
  5. Escobar, M.A.H.; Uribe, S.V.; Chiappe, R.; Estades, C.F. Effect of Clearcutting Operations on the Survival Rate of a Small Mammal. PLoS ONE 2015, 10, e0118883. [Google Scholar] [CrossRef] [PubMed]
  6. Lee, S.-I.; Spence, J.R.; Langor, D.W. Combinations of aggregated and dispersed retention improve conservation of saproxylic beetles in boreal white spruce stands. For. Ecol. Manag. 2017, 385, 116–126. [Google Scholar] [CrossRef]
  7. Heliövaara, K.; Väisänen, R. Effects of modern forestry on northwestern European forest invertebrates: A synthesis. Acta For. Fenn. 1984, 189, 1–32. [Google Scholar] [CrossRef]
  8. Park, J.H. Environmental changes after timber harvesting in (Mt.) Paekunsan. J. Korean For. Soc. 1995, 84, 465–478. [Google Scholar]
  9. Kovács, B.; Tinya, F.; Guba, E.; Németh, C.; Sass, V.; Bidló, A.; Ódor, P. The short-term effects of experimental forestry treatments on site conditions in an Oak–hornbeam forest. Forests 2018, 9, 406. [Google Scholar] [CrossRef]
  10. Okuda, T.; Suzuki, M.; Adachi, N.; Quah, E.S.; Hussein, N.A.; Manokaran, N. Effect of selective logging on canopy and stand structure and tree species composition in a lowland dipterocarp forest in peninsular Malaysia. For. Ecol. Manag. 2003, 175, 297–320. [Google Scholar] [CrossRef]
  11. Putz, F.E.; Blate, G.M.; Redford, K.H.; Fimbel, R.; Robinson, J. Tropical forest management and conservation of biodiversity: An overview. Conserv. Biol. 2001, 15, 7–20. [Google Scholar] [CrossRef]
  12. Schmidt, W. Herb layer species as indicators of biodiversity of managed and unmanaged beech forests. For. Snow Landsc. Res. 2005, 125, 111–125. [Google Scholar]
  13. Kim, J.S. A Study on Stand Structure, Environmental Factor and Understory Vegetation for Variable Retention in Quercus Mongolica Forest. Ph.D. Thesis, Kyungpook National University, Daegu, Korea, 2014. [Google Scholar]
  14. Ming, Z. Effect of Aggregated Retention on Understory Vegetation and Micro-Environment in Quercus Mongolica Forest. Master’s Thesis, Kyungpook National University, Sangju, Korea, 2012. [Google Scholar]
  15. Jeon, J.H.; Roh, S.J.; Shin, S.B.; Shin, Y.M.; Son, J.D.; Park, S.W.; Byun, B.K. Insect fauna of the scheduled regeneration forests in Samcheok, Gangwon-do, Korea in summer. J. Asia-Pac. Biodivers. 2014, 7, e72–e75. [Google Scholar] [CrossRef]
  16. Jeong, S.Y.; Cho, Y.C.; Byun, B.K.; Kim, H.J.; Bae, K.H.; Kim, H.S.; Kim, J.S. Initial responses of vegetation regeneration after strip clear cutting in secondary Korean red pine (Pinus densiflora) forest in Samcheok, Gangwon-do, South Korea. Korean J. Environ. Ecol. 2015, 29, 785–790. [Google Scholar] [CrossRef]
  17. Roh, S.J.; Son, J.D.; Jeon, J.H. Initial change of Coleopteran insect community affected by anthropogenic disturbances within pine tree forest. Korean J. Environ. Ecol. 2015, 29, 539–551. [Google Scholar] [CrossRef]
  18. Kim, D.S.; Park, S.W.; Roh, S.J.; Jeon, J.H.; Yoo, T.-H.; Yoon, H.-K.; Kim, H.-S.; Byun, B.-K. Responses of bark beetle (Coleoptera: Curculionidae: Scolytinae) community structure to green-tree retention in pine tree forest from Korea. J. Asia-Pac. Biodivers. 2016, 9, 443–447. [Google Scholar] [CrossRef]
  19. Niemelä, J.; Spence, J.R.; Langor, D.W.; Haila, Y.; Tukia, H. Logging and boreal ground-beetle assemblages on two continents: Implications for conservation. In Perspectives in Insect Conservation; Intercept Ltd.: Andover, UK, 1993; pp. 29–50. [Google Scholar]
  20. Hill, J.K.; Hamer, K.C.; Lace, L.A.; Banham, W.M.T. Effects of selective logging on tropical forest butterflies on Buru, Indonesia. J. Appl. Ecol. 1995, 32, 754–760. [Google Scholar] [CrossRef]
  21. Chey, V.K.; Holloway, J.D.; Speight, M.R. Diversity of moths in forest plantations and natural forests in Sabah. Bull. Entomol. Res. 1997, 87, 371–385. [Google Scholar] [CrossRef]
  22. Park, Y.-S.; Park, Y.K.; Yang, H.M. Effects of clear-cutting on forest arthropod communities at two different vertical levels (Crown and Ground Surface). Korean J. Ecol. Environ. 2016, 49, 271–278. [Google Scholar] [CrossRef]
  23. Kuuluvainen, T.; Tahvonen, O.; Aakala, T. Even-aged and uneven-aged forest management in boreal fennoscandia: A review. Ambio 2012, 41, 720–737. [Google Scholar] [CrossRef] [PubMed]
  24. Kitching, R.L.; Orr, A.G.; Thalib, L.; Mitchell, H.; Hopkins, M.S.; Graham, A.W. Moth assemblages of environmental as indicators in remnants of upland Australian rain forest quality. J. Appl. Ecol. 2000, 37, 284–297. [Google Scholar] [CrossRef]
  25. Summerville, K.S.; Ritter, L.M.; Crist, T.O. Forest moth taxa as indicators of lepidopteran richness and habitat disturbance: A preliminary assessment. Biol. Conserv. 2004, 116, 9–18. [Google Scholar] [CrossRef]
  26. Summerville, K.S. Do smaller forest fragments contain a greater abundance of lepidopteran crop and forage consumers? Environ. Entomol. 2004, 33, 234–241. [Google Scholar] [CrossRef]
  27. Hilt, N.; Brehm, G.; Fiedler, K. Diversity and ensemble composition of geometrid moths along a successional gradient in the Ecuadorian Andes. J. Trop. Ecol. 2006, 22, 155–166. [Google Scholar] [CrossRef]
  28. Summerville, K.S.; Crist, T.O. Structure and conservation of lepidopteran communities in managed forests of northeastern North America: A review. Can. Entomol. 2008, 140, 475–494. [Google Scholar] [CrossRef]
  29. Sayama, K.; Ito, M.; Tabuchi, K.; Ueda, A.; Ozaki, K.; Hironaga, T. Seasonal trends of forest moth assemblages in Central Hokkaido, Northern Japan. J. Lepidopterists’ Soc. 2012, 66, 11–26. [Google Scholar] [CrossRef]
  30. Sanyal, A.K.; Uniyal, V.P.; Chandra, K.; Bhardwaj, M. Diversity, distribution pattern and seasonal variation in moth assemblages along altitudinal gradient in Gangotri landscape area, Western Himalaya, Uttarakhand, India. J. Threat. Taxa 2013, 5, 3646–3653. [Google Scholar] [CrossRef] [Green Version]
  31. Yoshida, K. Seasonal fluctuation of moth community in Tomakomai experimental forest of Hokkaido University. Res. Bull. Coll. Exp. For. Coll. Agric. Hokkaido Univ. 1980, 37, 675–685. [Google Scholar]
  32. Yela, J.L.; Herrera, C.M. Seasonality and life cycles of woody plant-feeding noctuid moths (Lepidoptera: Noctuidae) in Mediterranean habitats. Ecol. Entomol. 1993, 18, 259–269. [Google Scholar] [CrossRef]
  33. Butler, L.; Kondo, V.; Strazanac, J. Light trap catches of Lepidoptera in two central Appalachian forests. Proc. Entomol. Soc. Wash. 2001, 103, 879–902. [Google Scholar]
  34. Feeny, P. Seasonal changes in oak leaf tannins and nutrients as a cause of spring feeding by winter moth caterpillars. Ecology 1970, 51, 565–581. [Google Scholar] [CrossRef]
  35. Niemela, P.; Haukioja, E. Seasonal patterns in species richness of herbivores: Macrolepidopteran larvae on Finnish deciduous trees. Ecol. Entomol. 1982, 7, 169–175. [Google Scholar] [CrossRef]
  36. Butler, L.; Strazanc, J. Occurrence of Lepidoptera on selected host trees in two central Appalachian national forests. Ann. Entomol. Soc. Am. 2000, 93, 500–511. [Google Scholar] [CrossRef]
  37. Summerville, K.S.; Crist, T.O.; Kahn, J.K.; Gering, J.C. Community structure of arboreal caterpillars within and among four tree species of the eastern deciduous forest. Ecol. Entomol. 2003, 28, 747–757. [Google Scholar] [CrossRef]
  38. Murakami, M.; Yoshida, K.; Hara, H.; Toda, M.J. Spatio-temporal variation in Lepidopteran larval assemblages associated with oak, Quercus crispula: The importance of leaf quality. Ecol. Entomol. 2005, 30, 521–531. [Google Scholar] [CrossRef]
  39. Hunter, M.D.; McNeil, J.N. Host-plant quality influences diapause and voltinism in a polyphagous insect herbivore. Ecology 1997, 78, 977–986. [Google Scholar] [CrossRef]
  40. Nock, C.A.; Vogt, R.J.; Beisner, B.E. Functional Traits. ELS; John Wiley & Sons, Ltd.: Chichester, UK, 2016; pp. 1–8. [Google Scholar]
  41. Brown, L.E.; Khamis, K.; Wilkes, M.; Blaen, P.; Brittain, J.E.; Carrivick, J.L.; Fell, S.; Friberg, N.; Füreder, L.; Gislason, G.M.; et al. Functional diversity and community assembly of river invertebrates show globally consistent responses to decreasing glacier cover. Nat. Ecol. Evol. 2018, 2, 325–333. [Google Scholar] [CrossRef] [PubMed]
  42. Violle, C.; Navas, M.; Vile, D.; Kazakou, E.; Fortunel, C.; Hummel, I.; Garnier, E. Let the concept of trait be functional! Oikos 2007, 116, 882–892. [Google Scholar] [CrossRef]
  43. Díaz, S.; Purvis, A.; Cornelissen, J.H.C.; Mace, G.M.; Donoghue, M.J.; Ewers, R.M.; Jordano, P.; Pearse, W.D. Functional traits, the phylogeny of function, and ecosystem service vulnerability. Ecol. Evol. 2013, 3, 2958–2975. [Google Scholar] [CrossRef] [PubMed] [Green Version]
  44. Gossner, M.M.; Lachat, T.; Brunet, J.; Isacsson, G.; Bouget, C.; Brustel, H.; Brandl, R.; Weisser, W.W.; Müller, J. Current near-to-nature forest management effects on functional trait composition of saproxylic beetles in beech forests. Conserv. Biol. 2013, 27, 605–614. [Google Scholar] [CrossRef] [PubMed]
  45. Choi, W.I.; Choi, K.-S.; Lyu, D.-P.; Lee, J.-S.; Lim, J.; Lee, S.; Shin, S.-C.; Chung, Y.-J.; Park, Y.-S. Seasonal changes of functional groups in coleopteran communities in pine forests. Biodivers. Conserv. 2010, 19, 2291–2305. [Google Scholar] [CrossRef]
  46. Schmidt, B.C.; Roland, J. Moth diversity in a fragmented habitat: Importance of functional groups and landscape scale in the boreal forest. Ann. Entomol. Soc. Am. 2006, 99, 1110–1120. [Google Scholar] [CrossRef]
  47. Baek, W.; Park, W.; Lee, W. Flora and vegetation of resources plants in the Mt. Kariwang (Kangwon-do). Korean J. Plant Res. 1998, 11, 217–243. [Google Scholar]
  48. Shin, Y.H. Coloured Illustrations of the Moths of Korea; Academybook: Seoul, Korea, 2001. [Google Scholar]
  49. Heo, U.H. Guide Book of Moth Larvae; Econature Publishing Co.: Seoul, Korea, 2012. [Google Scholar]
  50. Magurran, A.E. Measuring Biological Diversity; Blackwell Science: Oxford, UK, 2004. [Google Scholar]
  51. Everitt, B.S. Cluster analysis: A brief discussion of some of the problems. Br. J. Psychiatr. 1972, 120, 143–145. [Google Scholar] [CrossRef]
  52. Bray, J.R.; Curtis, J.T. An ordination of the upland forest communities of southern Wisconsin. Ecol. Monogr. 1957, 27, 325–349. [Google Scholar] [CrossRef]
  53. Ward, J.; Joe, H. Hierarchical grouping to optimize an objective function. J. Am. Stat. Assoc. 1963, 58, 236–244. [Google Scholar] [CrossRef]
  54. Legendre, P.; Legendre, L. Numerical Ecology, 2nd ed.; Elsevier: Amsterdam, The Netherlands, 1998. [Google Scholar]
  55. Kruskal, J.B. Nonmetric multidimensional scaling: A numerical method. Psychometrika 1964, 29, 115–129. [Google Scholar] [CrossRef]
  56. Oksanen, J.; Blanchet, F.G.; Friendly, M.; Kindt, R.; Legendre, P.; McGlinn, D.; Minchin, P.R.; O’Hara, R.B.; Simpson, G.L.; Solymos, P.; et al. Vegan: Community Ecology Package. R Package, Version 2.5-2, 2018, The Comprehensive R Archive Network. Available online: http://cran.r-project.org/web/packages/vegan (accessed on 17 May 2018).
  57. Intachat, J.; Holloway, J.D.; Speight, M.R. The effects of different forest management practices on geometroid moth populations and their diversity in Peninsular Malaysia. J. Trop. For. Sci. 1997, 9, 411–430. [Google Scholar]
  58. Willott, S.J. The effects of selective logging on the distribution of moths in a Bornean rainforest. Philos. Trans. R. Soc. Lond. 1999, 354, 1783–1790. [Google Scholar] [CrossRef] [PubMed]
  59. Simpson, E.H. Measurement of diversity. Nature 1949, 163, 688. [Google Scholar] [CrossRef]
  60. Lack, D. The numbers of bird species on islands. Bird Study 1969, 16, 193–209. [Google Scholar] [CrossRef] [Green Version]
  61. Brown, K.S., Jr. Conservation of neotropical environments: Insects as indicators. In The Conservation of Insects and Their Habitats; Collins, N.M., Thomas, J.A., Eds.; Academic Press: London, UK, 1991; pp. 349–404. [Google Scholar]
  62. Brubaker, L.B. Long-term forest dynamics. In Forest Succession; West, D.C., Shugart, H.H., Botkin, D.B., Eds.; Springer: New York, NY, USA, 1981; pp. 95–106. [Google Scholar]
  63. Janzen, D.H.; Waterman, P.G. A seasonal census of Phenolics, Fiber and Alkaloids in foliage of forest trees in Costa-Rica: Some factors influencing their distribution and relation to host selection by Sphingidae and Saturniidae. Biol. J. Linn. Soc. 1984, 21, 439–454. [Google Scholar] [CrossRef]
  64. Murakami, M.; Ichie, T.; Hirao, T. Beta-diversity of lepidopteran larval communities in a Japanese temperate forest: Effects of phenology and tree species. Ecol. Res. 2008, 23, 179–187. [Google Scholar] [CrossRef]
  65. Gustafsson, L.; Baker, S.C.; Bauhus, J.; Beese, W.J.; Brodie, A.; Kouki, J.; Lindenmayer, D.B.; Lõhmus, A.; Martínez Pastur, G.; Messier, C.; et al. Retention forestry to maintain multifunctional forests: A world perspective. Bioscience 2012, 62, 633–645. [Google Scholar] [CrossRef]
  66. Fedrowitz, K.; Koricheva, J.; Baker, S.C.; Lindenmayer, D.B.; Palik, B.; Rosenvald, R.; Beese, W.; Franklin, J.F.; Kouki, J.; Macdonald, E.; et al. Can retention forestry help conserve biodiversity? A meta-analysis. J. Appl. Ecol. 2014, 51, 1669–1679. [Google Scholar] [CrossRef] [PubMed] [Green Version]
  67. Halaj, J.; Halpern, C.B.; Yi, H. Effects of green-tree retention on abundance and guild composition of corticolous arthropods. For. Ecol. Manag. 2009, 258, 850–859. [Google Scholar] [CrossRef]
  68. Axmacher, J.C.; Tünte, H.; Schrumpf, M.; Müller-hohenstein, K.; Lyaruu, H.V.M.; Fiedler, K. Diverging diversity patterns of vascular plants and geometrid moths during forest regeneration on Mt Kilimanjaro, Tanzania. J. Biogeogr. 2004, 31, 895–904. [Google Scholar] [CrossRef]
  69. Guariguata, M.R.; Ostertag, R. Neotropical secondary forest succession: Changes in structural and functional characteristics. For. Ecol. Manag. 2001, 148, 185–206. [Google Scholar] [CrossRef]
Figure 1. Location of the study sites in South Korea. CC: clearcutting area; AR: aggregated retention area; NC: no cutting area; OA: Mongolian oak area.
Forests 09 00574 g001
Figure 2. Species rank abundance curve of moths collected from four different treatment stands. CC: clearcutting area; AR: aggregated retention area; NC: no cutting area; OA: Mongolian oak area.
Forests 09 00574 g002
Figure 3. Abundance of the dominant family of species in the four treatment stands at different sampling months. (a) Clearcutting area, (b) aggregated retention area, (c) no cutting area, and (d) Mongolian oak area.
Forests 09 00574 g003
Figure 4. Proportion of species richness and abundance of the functional groups based on the type of host plants. The numbers on the bar indicate species richness (number of species) and abundance (number of individuals) in the corresponding treatment. CC: clearcutting area; AR: aggregated retention area; NC: no cutting area; OA: Mongolian oak area.
Forests 09 00574 g004
Figure 5. Proportion of species richness and abundance of the functional groups based on the distribution region. The numbers on the bar indicate species richness (number of species) and abundance (number of individuals) in the corresponding treatment. CC: clearcutting area; AR: aggregated retention area; NC: no cutting area; OA: Mongolian oak area.
Forests 09 00574 g005
Figure 6. (a) Cluster analysis of the four treatment stands based on the abundance of moth communities using Ward’s linkage methods with Bray-Curtis distance measure. (b,c) Ordination of non-metric multidimensional scaling (NMDS) using the same data used in the cluster analysis (stress value for the first two axes = 0.01). The abundance proportion of each functional group for host plants (b) and distribution patterns (c) is presented in the NMDS. CC: clearcutting area; AR: aggregated retention area; NC: no cutting area; OA: Mongolian oak area.
Forests 09 00574 g006
Figure 7. (a) Cluster analysis of species abundance of moths in the monthly samples using Bray-Curtis distance and Ward’s linkage method. (b,c) Ordination of NMDS using the same data used in the cluster analysis (stress value for the first two axes = 0.15). The abundance proportion of each functional group for host plants (b) and distribution patterns (c) is presented in the NMDS. The first two characters in sample names indicate study stands, and the last three characters are sampling months.
Forests 09 00574 g007
Table 1. Characteristics of environmental factors at each study site.
Study Site (Stand)AcronymAltitude (m)Area (ha)Dominant Vegetation
ClearcuttingCC9805Actinidia polygama, Persicaria nepalensis
Aggregated retentionAR9505Magnolia sieboldii K. Koch, Actinidia polygama, Persicaria nepalensis,
Japanese larch (no cutting)NC9105Larix kaempferi, Acer pseudosieboldianum var. ambiguum Nakai, Commelina communis L., Actinidia polygama
Mongolian oak (no cutting)OA9505Quercus dentate Thunb., Actinidia polygama, Ainsliaea acerifolia var. subapoda Nakai
Table 2. Community indices of the moths in four different treatment stands at each sampling month.
Community IndexTreatmentMayJuneJulyAugustSeptemberOctoberTotal
Species richnessCC a820322124086
AR216281722067
NC9363324302108
OA13578754444201
Overall248412285746301
AbundanceCC8409671860301
AR3526752560230
NC241359174572383
OA36418576171232111444
Overall71645830368431132358
Shannon diversityCC2.082.462.572.012.530.003.19
AR0.642.142.551.762.330.002.95
NC1.902.892.962.233.050.693.69
OA1.932.643.12.872.831.163.65
Overall2.562.953.242.863.201.523.84
a CC: Clearcutting area; AR: Aggregated retention area; NC: No cutting area; OA: Mongolian oak area.
Table 3. Biological trait of dominant moth species in four different treatment stands.
FamilySpeciesDominant Species aBiological Trait
CC bARNCOAHost Plant cDistribution Pattern d
NoctuidaeXestia fuscostigma25HRM
Athetis gluteosa3HRN
Sineugraphe exusta4UnknownN
GeometridaeIdaea biselata513HR/TSM
Eustroma melancholicum2SRM
Alcis angulifera414HR/SR/TS/LCM
Duliophyle agitata4SR/TSM
ErebidaeParacolax tristalis1352SR/TSN
Hydrillodes pacifica21UnknownS
Zanclognatha Griselda3TSN
Zanclognatha lunalis (Scopoil)5SR/TSN
a Dominant species ranking from first to fifth: 1 stands for the most dominant and 5 for the least one. b CC: Clearcutting area; AR: Aggregated retention area; NC: No cutting area; OA: Mongolian oak area. c HR = herbs SR = shrubs TS = trees LC = lichens. d M = miscellaneous, N = northern, S = southern.

