Human Geomatics in Urban Design—Two Case Studies

Abstract
:1. Introduction
2. Methodology
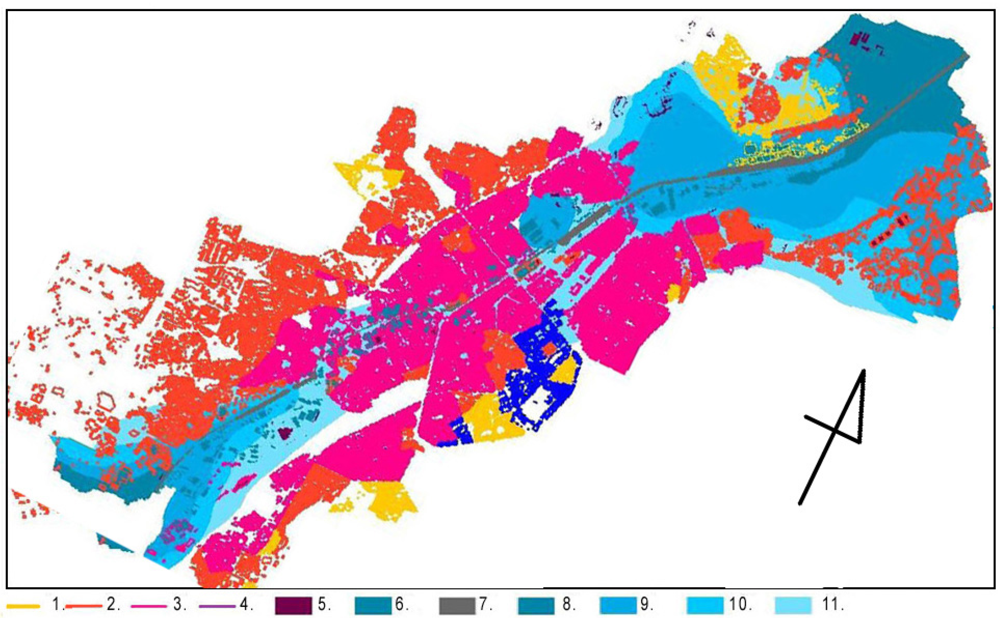
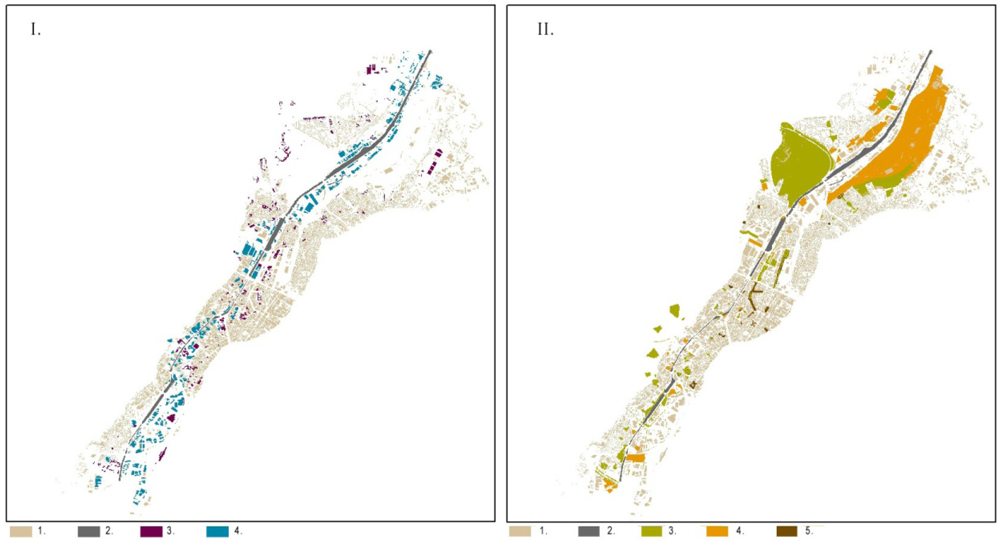
3. Brussels Ethnic Division
3.1. Methodology

3.2. Results

3.3. Conclusions
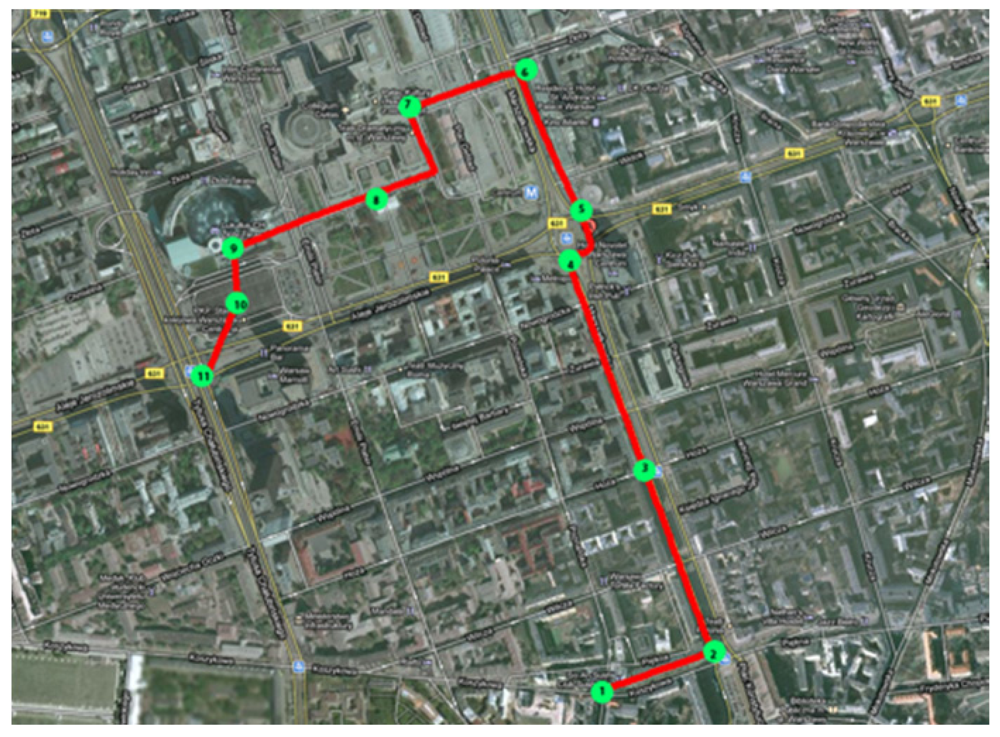
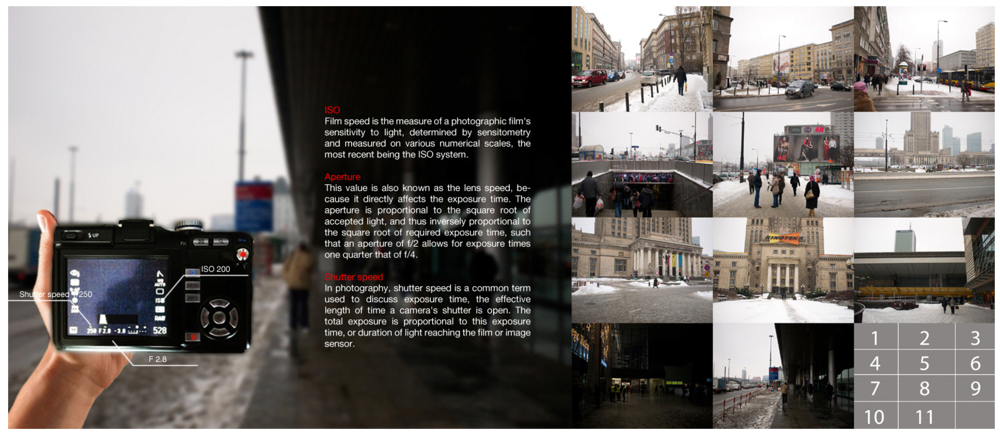
4. City Tagging
4.1. Methodology


4.2. Results


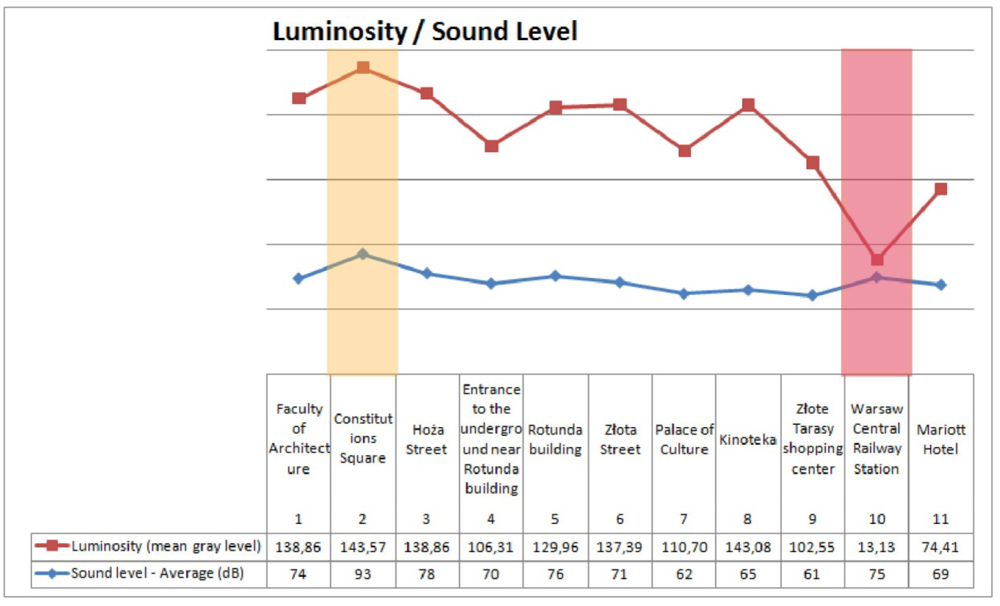
| Minimum/maximum values | Nr | Location | Average sound level |
|---|---|---|---|
| loudest point | #2 | Konstytucji Square | 93 dB |
| quietest point | #9 | Złote Tarasy shopping center | 61 dB |
| darkest point | #10 | Warsaw Central Railway Station | |
| brightest point: | #2 | Konstytucji Square |


4.3. Conclusions
5. Results Summary
6. Conclusions
Acknowledgments
References and Notes
- Tuan, Y.F. Space and Place the Perspective of Experience; University of Minnesota Press: Minneapolis, MN, USA, 2001. [Google Scholar]
- Carmona, M.; Heath, T.; Oc, T.; Tiesdell, S. Public Places Urban Spaces The Dimensions of Urban Design; Architectural Press: Oxford, UK, 2009. [Google Scholar]
- Perseus Digital Library. Available online: http://www.perseus.tufts.edu/ (accessed on 19 March 2011).
- Broadie, S. Interpreting Aristotle’s Directions. In Method in Ancient Philosophy; Gentzler, J., Ed.; Oxford University Press: New York, NY, USA, 1998; pp. 291–306. [Google Scholar]
- Wiśniewski, M. Część Ogólna—Problemy oraz Podstawy Merytoryczne. In Study on the Preconditions and Directions for The Physical Development of Lodz; UMŁ: Lodz, Poland, 1997–2002; p. 9. [Google Scholar]
- Cityware: urban design and pervasive systems. Available online: http://gow.epsrc.ac.uk/ ViewGrant.aspx?GrantRef=EP/C547691/1 (accessed on 19 March 2012).
- Hillier, B.; Hanson, J. The Social Logic of Space; Cambridge University Press: Cambridge, UK, 2003. [Google Scholar]
- Hillier, B. Space Is the Machine. Available online: http://www.spacesyntx.com (accessed on 12 December 2011).
- e.g. Space Syntax conferences: 8th International Space Syntax Symposium, Santiago de Chile; 3–6 01 2012.
- MIT Senseable City Lab. Available online: http://senseable.mit.edu/ (accessed on 14 March 2012).
- Rensch, B.; Britter, R.; Ratti, C. Live Urbanism—Towards SENSEable Cities and Beyond. In Sustainable Environmental Design in Architecture: Impact on Health; Springer: Heidelberg, Germany, 2012; Volume 56, pp. 175–184. [Google Scholar]
- Calabrese, F.; Ratti, C. Nolli 2.0 or How to Rebuild Rome Without Even Asking Permission from the Historic Preservation Authority! In Uneternal City Urbanism beyond Rome; Betsky, A., Ed.; Marsilio: Rome, Italy, 2008; pp. 40–47. [Google Scholar]
- Pereira, F.C.; Vaccari, A.; Giardin, F.; Chiu, C.; Ratti, C. Crowdsensing in the Web: Analyzing the Citizen Experience in the Urban Space. In From Social Butterfly to Engaged Citizen: Urban Informatics, Social Media, Ubiquitous Computing, and Mobile Technology to Support Citizen Engagement; Foth, M., Forlano, L., Satchell, C., Gibbs, M., Eds.; The MIT Press: Cambridge, MA, USA, 2011; pp. 353–373. [Google Scholar]
- Urban Informatics Research Lab at Queensland University of Technology. Available online: http://www.urbaninformatics.net (accessed on 14 March 2012).
- Towards the Sentient City Project. Available online: http://www.sentientcity.net (accessed on 14 March 2012).
- Nold, C., Ed. Emotional Cartography, Technologies of the Self. 2009. Available online: http://emotionalcartography.net/ (accessed on 14 March 2012).
- Gartner, G. EmoMap Project. Available online: http://www2.ffg.at/verkehr/projekte.php?id=754&lang=en&browse=programm (accessed on 14 March 2012).
- Hannerz, U. Exploring the City, Inquiries towards an Urban Anthropology; Columbia University Press: New York, NY, USA, 1980. [Google Scholar]
- Mitchell, W.J. City of Bits; The MIT Press: Cambridge, MA, USA, London, UK, 1996. [Google Scholar]
- Mitchell, W.J. E-topia; The MIT Press: Cambridge, MA, USA, London, UK, 2000. [Google Scholar]
- Mitchell, W.J. Me++; The MIT Press: Cambridge, MA, USA, London, UK, 2003. [Google Scholar]
- Faludi, A.; Waterhout, B. Introducing Evidence-Based Planning. disP Plan. Rev. 2006, 165, 4–13. [Google Scholar]
- Healey, P. Collaborative Planning: Shaping Places in Fragmented Societies; University of British Columbia Press: Vancouver, BC, Canada, 1997. [Google Scholar]
- Habermas, J. The Theory of Communicative Action: Reason and the Rationalization of Society; Beacon Press: Boston, MA, USA, 1985; Volume 1. [Google Scholar]
- Lynch, K. The Image of the City; MIT Press: Cambridge, MA, USA, 1960. [Google Scholar]
- Tollitt, P. The Illusion of Illustration—Urban Design London Online Training Cataloque. Available online: http://www.urbannous.org.uk/urbandesignlondon/Penelope%20Tollitt.htm (accessed on 14 March 2012).
- Mintzberg, H.; Westley, F. Decision making: It’s not what you think. MIT Sloan Manag. Rev. 2001, 42, 89–93. [Google Scholar]
- Amoroso, N. The Exposed City, Mapping the Urban Invisibles; Routledge: New York, NY, USA, USA, 2010. [Google Scholar]
- Lima, M. VisualComplexity. blog. Available online: http://www.visualcomplexity.com (accessed on 14 March 2012).
- Rankin, B. Radical Cartography. blog. Available online: http://www.radicalcartography.net/ (accessed on 14 March 2012).
- OWjL summer course. Available online: http://mappingweirdstuff.wordpress.com/ (accessed on 20 November 2011).
- Hudson-Smith, A. Digital Urban. blog. Available online: http://www.digitalurban.org/ (accessed on 20 November 2011).
- Brail, R.; Klosterman, R. Visualizing the City, Communicating Urban Design to Planners and Decision Makers. In Planning Support Systems: Integrating Geographic Information Systems, Models and Visualization Tools; Brail, R.K., Klosterman, R.E., Eds.; ESRI Press: Redlands, CA, USA, 2001; pp. 405–443. [Google Scholar]
- Batty, M.; Crooks, A.; Hudson-Smith, A.; Milton, R.; Anand, S.; Jackson, M.; Morley, J. Data mash-ups and the future of mapping. Available online: http://discovery.ucl.ac.uk/1312085/ (accessed on 14 March 2012).
- Kempf, P. You are the City, Observation, Organization and Transformation of Urban Settings; Lars Müller Publishers: Baden, Switzerland, 2009. [Google Scholar]
- Manau, J.L.E.; Ortoneda, J.M., Solano. Squatting Geometries-Guerilla Barcelona. In Sensing the 21st-Century City Close-Up and Remote; McGrath, B., Shane, G., Eds.; Academy Press: London, UK, 2005; Volume 75, pp. 58–63. [Google Scholar]
- Passoneau, J.R.; Wurman, R.S. Urban Atlas: 20 American Cities: A Communication Study Notating Selected Urban Data at a Scale of 1:48 000; MIT Press: Cambridge, MA, USA, 1966; p. 4. [Google Scholar]
- Kesteloot, C. Brussels: Post-Fordist Polarization in a Fordist Spatial Canvas. In Globalizing Cities: A New Spatial Order, Studies in Urban and Social Change; Marcuse, P., van Kempen, R., Eds.; Blackwell Publishing Ltd.: Oxford, UK, 2008. [Google Scholar]
- Stankiewicz, E.; Wierzbicka, A.Ł. Charleroi Canal in Brussels. Available online: http://system.asknow.eu/groups/canalinbrussels/ (accessed on 20 November 2011).
- Sense of the City: An Alternate Approach to Urbanism; Zardini, M.; Schivelbusch, W. (Eds.) Lars Müller Publishers: Baden, Switzerland, 2006.
- Calabrese, F.; Kloeckl, K.; Ratti, C. WikiCity: Real-time Urban Environments. Pervasive Comput. Mobile Ubiquitous Syst. 2007, 6, 52–53. [Google Scholar]
- FixVegas iPhone Application. Available online: http://www.urbaninformatics.net/projects/fixvegas/ (accessed on 14 March 2012).
- Dzik, K.; Kowalczyk, P.; Kwieciński, K. City Tagging 1: Noise and Luminosity. Available online: http://system.asknow.eu/groups/citytagging/blog/?tag=ct1 (accessed on 20 November 2011).
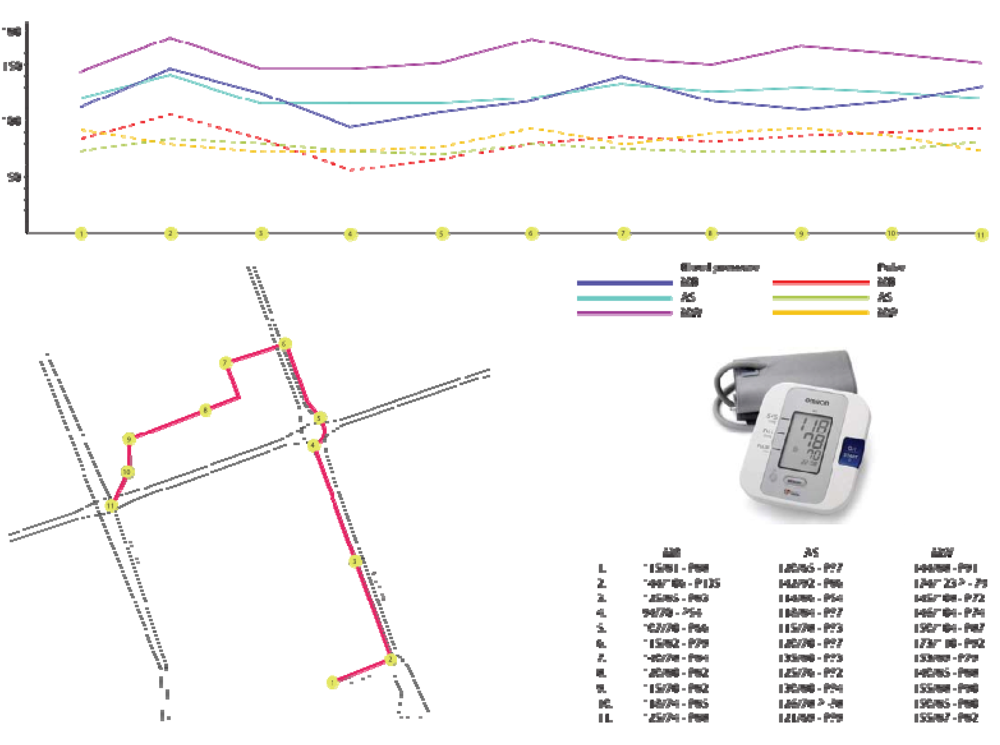
- Burdalski, M.; Śliwka, A.; Wójcicki, M. City Tagging 2: Pulse and Blood Pressure. Available online: http://system.asknow.eu/groups/citytagging/blog/?tag=ct2 (accessed on 14 March 2012).
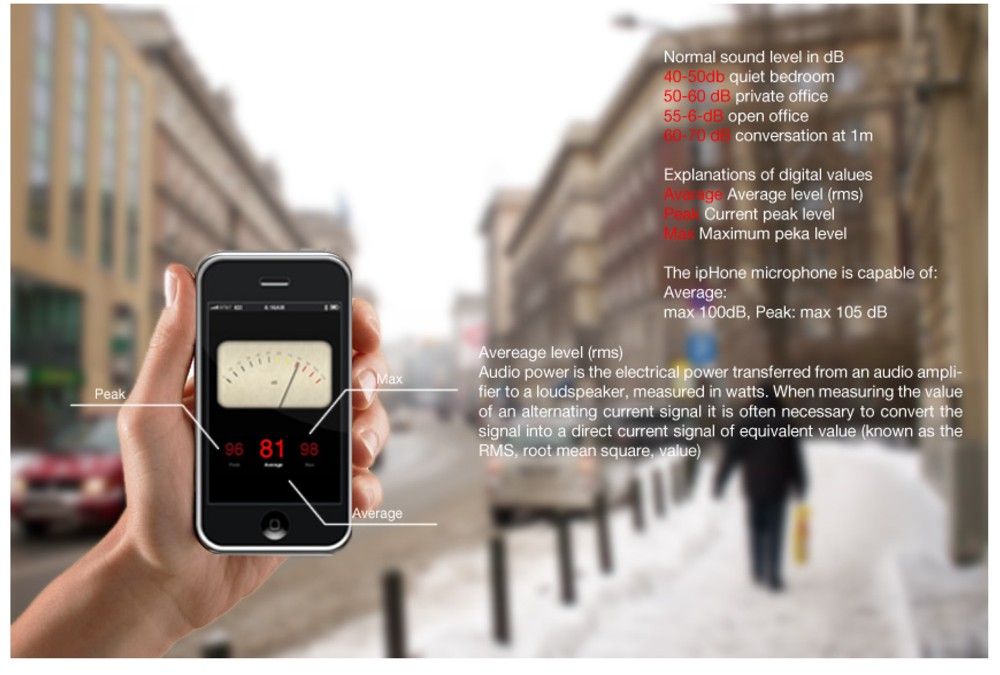
- Decibel application, iTunes. Available online: http://itunes.apple.com/app/decibel/id290788852?mt=8 (accessed on 14 March 2012).
- Ladányi, J. The Hungarian Neoliberal State, Ethnic Classification, and the Creation of a Roma Underclass. In Poverty, Ethnicity, and Gender in Eastern Europe During the Market Transition; Emigh, R.J., Szelényi, I., Eds.; Praeger: London, UK, 2001; pp. 67–82. [Google Scholar]
- Wirth, L. Urbanism as a way of life. Am. J. Sociol. 1938, 44, 1–24. [Google Scholar]
- Redfield, R. The folk society. Am. J. Sociol. 1947, 52, 293–308. [Google Scholar]
- Hirschfield, A.; Yarwood, D.; Bowers, K. Crime Pattern Analysis, Spatial Targeting and GIS: The development of new approaches for use in evaluating Community Safety initiatives. In Crime and health data analysis using GIS; Evans-Mudie, N, Ed.; SCGISA: Sheffield, UK, 1997. [Google Scholar]
- Buhmann, E.; Pietsch, M. Maltese Criminological Landscapes: A Spatio-Temporal Case Where Physical and Social Worlds Meet. In Peer Reviewed. In Proceedings of Digital Landscape Architecture; Anhalt University of Applied Sciences, Wichmann Verlag: Berlin/Heidelberg, Germany, 2010. [Google Scholar]
- Bottoms, A.E.; Wiles, P.W. Explanations of Crime and Space. In Crime, Policing and Place: Essays in Environmental Criminology; Evans, D.J., Fyfe, N.R., Herbert, D.T., Eds.; Routledge: London, UK, 2001. [Google Scholar]
- Rankin, W. Cartography and the Reality of Boundaries. Perspecta 2010, 42, 42–45. [Google Scholar]
- Rankin, W. Radical Cartography: Chicago Boundaries. Available online: http://www.radicalcartography.net/index.html?chicagodots (accessed on 12 November 2011).
- Rossi, A. The Architecture of the City; MIT Press: Cambridge, MA, USA, 1984. [Google Scholar]
- Krier, R. L’espace de la ville, Theorie et Pratique; Archives d’Architecture Modern: Brussels, Belgium, 1975. [Google Scholar]
- Panerai, P.; Depaule, J.C.; Demorgon, M. Analyse Urbaine; Édition Parenthèses: Marseille, France, 2009. [Google Scholar]
- Bandini, M. Some Architectural Approaches to Urban Form. In Urban Landscapes International Perspectives; Whitehand, J.W.R., Larkham, P.J., Eds.; Routledge: London, UK, 2000. [Google Scholar]
- Cullen, G. The Concise Townscape; Elsevier Architectural Press: Oxford, UK, 2008. [Google Scholar]
- Dresmé, F. Mapping Rotterdams city center. Available online: http://www.21bis.nl/project/22 (accessed on 14 March 2012).
- Lefebvre, H. The Urban Revolution; University of Minnesota Press: Minnesota, MN, USA, 2003. [Google Scholar]
- Guhathakurta, S. Urban modeling as storytelling: Using simulation models as a narrative. Environ. Plan. B 2002, 29, 895–911. [Google Scholar] [CrossRef]
- Hanzl, M.; Stankiewicz, E.; Wierzbicka, A.; Kujawski, T.; Dzik, K.; Kowalczyk, P.; Kwiecinski, K.; Burdalski, M.; Śliwka, A.; Wójcicki, M. Mapping Invisibles—Acquiring GIS for Urban Planner Workshop. Lect. Notes Comput. Sci. 2011, 6783, 63–77. [Google Scholar]
© 2012 by the authors; licensee MDPI, Basel, Switzerland. This article is an open-access article distributed under the terms and conditions of the Creative Commons Attribution license (http://creativecommons.org/licenses/by/3.0/).
Share and Cite
Hanzl, M.; Dzik, K.; Kowalczyk, P.; Kwieciński, K.; Stankiewicz, E.; Wierzbicka, A.Ł. Human Geomatics in Urban Design—Two Case Studies. Future Internet 2012, 4, 347-361. https://doi.org/10.3390/fi4010347
Hanzl M, Dzik K, Kowalczyk P, Kwieciński K, Stankiewicz E, Wierzbicka AŁ. Human Geomatics in Urban Design—Two Case Studies. Future Internet. 2012; 4(1):347-361. https://doi.org/10.3390/fi4010347
Chicago/Turabian StyleHanzl, Małgorzata, Karol Dzik, Paulina Kowalczyk, Krystian Kwieciński, Ewa Stankiewicz, and Agata Ł. Wierzbicka. 2012. "Human Geomatics in Urban Design—Two Case Studies" Future Internet 4, no. 1: 347-361. https://doi.org/10.3390/fi4010347