1. Introduction
The popularity of social media has cemented the World Wide Web (WWW) as
the platform for personal communication, information sharing and the broadcasting of opinion. Tools characteristic of Web 2.0 such as Facebook, YouTube and Twitter have created an extra source of “big data”, a term coined as part of a NASA project by Michael Cox and David Ellsworth [
1] to describe work involving the visualisation of datasets generated by supercomputers. Big data now often exceed petabytes in size [
2]. Taking Twitter as an example, approximately 400 million tweets (140-character messages) are posted daily [
3]. Identifying suitable technology and approaches with sufficient scale to process this data is an interdisciplinary challenge [
4] and a key concern of neogeography [
5]. This raises questions such as does data size affect information quality, what contextual dimensions are missing and how might representational limits be mitigated? Drawing on early experiences of an ongoing cross-disciplinary project called Tweet My Street (TMS), this paper contributes reflections on these questions whilst also describing the development of a fully scalable software framework for diverse analyses of geo-located data derived from Twitter.
Involving computing scientists and geographers TMS aims to determine the extent to which data derived from Twitter can aid understandings of spatial-temporal behaviours and their meanings at different geographical scales. In part, this has been motivated through recognition that whilst current social media analytics platforms like
Ushahidi [
6] are highly valuable for data collection, they lack diverse functionality to support different types of analysis [
7]. TMS involves the ongoing development of a software framework capable of supporting low latency queries of archived and real-time datasets (separately and in tandem) in ways that can be tapered to different research foci. Applied to a sample of geo-located tweets collected from Twitter’s Firehose, the result is a system that is becoming more capable in respects contextualising content as well as visualising connections and clusters of activity among social media users.
As well as describing the TMS framework and discussing the challenges inherent to its development, this paper elucidates three methodological issues confronting the research team in the analysis of social media data locally. It is hoped discussion of these issues can contribute to ongoing dialogue within the emerging field of neogeography as to how best to engage different academic disciplines (and non-scholarly groups) in the field given the potential for divergent methodological, ethical and analytical standpoints and the subsequent challenges these can bring into view. For example, a key challenge for computer scientists has been the ability to provide flexible and low latency queries without losing the benefits of real-time streams. This can be particularly useful for focus on a specific event like a concert or sports fixture. At the same time, social scientists have been concerned with the paradoxical levels of proximity social media enable to research subjects, wherein digital content can reveal uncomfortable amounts about people’s activities “at distance” from traditional opt-in and informed consent protocols. Central to both concerns is the need to balance the statistical approaches demanded by the big data movement (which bear similarity to the 1960s quantitative revolution) and the “slower”, more discursive techniques typically used to answer subjective questions pertaining to actual lived experiences [
8,
9]. We suggest that the latter are starting to get lost in the hype over data volume and a stampede to capitalise on it. Given the projects’ iterative nature, we use TMS to annotate experiences in capturing, storing and visualising data derived from sources that could, in future, generate considerable academic inquiry.
Following a review of literature which synthesises commentary from computing science, sociology and geography, this paper details the software framework and schema design and the technical challenges inherent to its development. We then turn to the methodological issues inherent to testing a first version of the framework with a small sample of pilot data. The issues we focus on include closeness with research subjects, ethics and issues of interdisciplinarity that are crucial if researchers are to benefit from one another’s expertise and gain from emerging sources of big data within neogeography. A concluding section offers thought on scholars’ digital responsibilities during the current turn towards computational approaches.
2. Neogeography, Social Media and Resurging Interest in “Big Data”
Though participation is uneven and there remain infrastructural barriers to internet access, one in four people now use social media, with penetration of platforms like Facebook and Twitter in almost every part of the world [
10]. The data trails left by users of social media are of key concern to researchers because they reveal social, economic and political practices at a scale once unimaginable [
11]. This is why social media are looked to as additional sources of big data alongside others such as government repositories, telephone logs and archives [
12]. boyd and Crawford [
13] suggest that scientists, technologists, health specialists, business professionals and others are clamouring for access to these new sources and the frequency of celebratory assertions leveled about them supports this claim. For example, an article in
Wired magazine claimed “the end of science in the Petabyte Age” with links to studies explaining how the mining of big data could support the filing of successful lawsuits, track breaking news, monitor outbreaks of disease and predict airfares [
14]. Similarly, Qualman [
15] and Galagan [
16] suggest a slew of businesses and marketing commentators looking to big data to inform consumer decisions on a range of products and services.
Twitter is the most prominent source of data in a social media context [
17]. Miller [
18] lauds the social networking tool as an unprecedented opportunity to study human communication whilst Ampofo
et al. [
19] underline its popularity as an open platform for third party developers as it makes several years worth of archives available through its application programming interfaces (APIs). The latter includes tweets, user profile information, and geo-located data that we collect, organise and visualise through the TMS software. However, the rise of Web 2.0 tools like Twitter is as challenging for academic researchers as it is promising. Social media offer vast reserves of information but are not without limits. These tools therefore need to be approached cautiously [
20]. Questions include: how can we make information from these sources more manageable for socially beneficial research, what skills and technologies are needed to harvest and analyse the data from these constantly changing sources and crucially, what might big data hide as well as reveal? A key concern is that whilst many look to the networks characteristic of these sources as unbounded, these can actually give way to a “rich gets richer” effect [
21]. Working with the PR firm Edelmann, Tinati
et al. [
21] developed a five-category model of influence based on Twitter exchanges that identify prominent players across Twitter’s network by analysing their conversation habits. Whilst this aids researchers in identifying established nodes of information (and power) within the “Twittersphere”, it also indicates that the most established nodes increase their connectivity at the expense of younger, less connected ones. However, evidence also indicates that Twitter is allowing for broader participation than possible in other forms of media. In particular, the visual representation described in the aforementioned paper by Graham
et al. [
11], matches tweets against percentages of internet access in different countries to show that the six largest countries of information production via Twitter’s network are the US, Brazil, Indonesia, the UK, Mexico and Malaysia. In other words, just two countries are in the Global North as traditional hubs of codified knowledge production.
Claims of democratisation via Twitter are also strongest in relation to its political role. Smalls’ [
22] content analysis of tweets (referenced with the Canadian political hashtag #cdnpoli) makes clear that it functions as a disseminator of information and is used by individuals scouring the internet for content around particular political events. However, she also points out that whilst Twitter can be a democratic tool by allowing participation in news making practices, tweets include gaps and inaccuracies. Smalls uses an example tweet allegedly posted by the Indian government during the 2008 Mumbai attacks. This requested Twitter users to cease broadcasting about the police and military operations in the city but after being retweeted numerous times, a BBC journalist needed to retract a story, live, on-air after the poster could not be verified. Therefore, whilst social media are particularly sensational sources in terms of participation and the diversity of voices able to speak, critics emphasise that there are no mechanisms for determining whether the information is credible, suggesting that it is a platform to “anything and everything” [
22].
A lot of the excitement around social media rests on the idea that data volume increases rigor but “volume” needs interrogating—for instance, having a large amount of data can mislead people into concluding that it is representative and/or of excellent quality when this isn’t always the case [
23]. We also see a need to question the parameters denoting the types of content getting sidelined as “back chatter” or “white noise”. This is important because the information and opinion being produced about people, things, places and activities are becoming part of the “layers, experiences and landscapes of place” [
24]. In other words, as big data is being utilised in the production of knowledge, we need to think critically about its limits, restrictions and biases.
Twitter is used by a tiny proportion of people globally, is not universally popular, and there are alternatives like China’s Weibo. Editorial intent, social and political bias and other cultural, linguistic, gendered and political factors also need to be understood to account for the presences and absences that exist in emerging data sources and how the knowledge(s) they give way to might then influence individual lives. boyd and Crawford [
13] make a similar suggestion, extending a concern with data volume to critical reflection on the abilities to aggregate and analyse this data. Describing how big data is positioned as both a tool against societal ills and a danger to civil freedoms (the heightening of corporate and state controls), they call for focus on the subtle shifts underway, drawing parallels to post-Fordism in suggesting that the current turn involves similar “cellular level” changes to how society views itself. This means foregrounding questions of epistemology and ethics, reminding us that just as Ford’s automated assembly line had its limits, big data is also constrained. For instance, boyd and Crawford underline Twitter’s poor search features. This means researchers are more likely to focus on the present or immediate past (a political election or natural disaster) because of the impossibility of gaining other types of data. This is why they stress questions must go beyond what the sciences can learn from sources like Twitter to how harvesters of such data might change the meaning of learning and the limits and possibilities of this.
Furthermore, with the current turn to capturing social data from globally networked sources like Twitter, there has also been a parallel shift from thinking about the local scale, where the implications of such tools are lived and felt. That is, whilst network society scholars like Rainie and Wellman [
25] have underlined social media’s role in facilitating new forms of networked civil engagement at a global level, less remains known about what tools like Twitter mean for information production, knowledge sharing and social interaction locally. Within geography, Dodge and Kitchen [
26] were among the first to build on early commentary about the internet to suggest that social media are “augmenting place” by, for example, leading to meetings between propinquitous networks of friends and family members. Despite this, few researchers have focussed on what Twitter might be able to tell us about connections and spatial behaviours at a very local level. This is what we aimed to do with the first stage of our work in TMS. Consequently, in subsequent parts of this paper, we describe the software developed and the methodological issues faced in exploring what can be learnt from Twitter in (and about) several interconnected neighbourhoods in Newcastle Upon Tyne (UK) known as the “West End”.
3. Software Architecture
A majority of researchers have focused on Twitter as a global communications network [
27,
28] rather than identifying its attributes, relations and effects locally. TMS has employed a software framework for the retrieval, storage and visualisation of geo-located tweets at a very local level. The framework executes historic queries over a noSQL database responding with low latency and linear scaling writes. Data was purchased from a Twitter-affiliated company called Datasift [
29] and the TMS application was piloted over a 28-day period with geographical focus limited to the West End. Recognising our privileged position in being able to subscribe to Twitter’s Firehose via Datasift, we wish to point out that there are a number of useful open source alternatives like nTweetStreamer [
30] and twitter4j [
31]. However, these curtail access to 1% of tweets offered via Twitter’s Firehose, hence much higher data loss. Twitter analysis has previously concentrated on various components of tweets themselves, for example, rating news websites by counting URL mentions [
32]. Our framework provides a flexible range of capabilities based on rate and topic analyses rather than focusing on one context alone. For example, whilst Meeder
et al. [
33] count Twitter followers to explore the links of Twitter users to celebrities and Burnap
et al. [
34] use sentiment analysis to track racism in football, TMS is novel in the sense that we are aiming to build a tool with multiple functions, capable of supporting both of these research foci.
In this sense, SensePlace2 [
35,
36] and the Geosocial Gauge [
37] are two comparable systems highly worthy of attention as they are also undergoing similar “iterative” development so that these too can support work on a range of topics. In the contexts of both of these powerful analytical tools, the authors underline architectural challenges pertaining to the rate of data production and capacities to fuse diverse data sources and types of data [
38]. Though SensePlace2 has been applied mainly in the context of Twitter data visualisation for actors in the crisis management community [
35], MacEchren
et al. [
36] describe a desire to extend their software into other domains as with TMS. To enable this, proposed changes to SensePlace2 that have already been tackled in our project include the development of a cloud-based infrastructure (to enable far greater data storage and handling), demonstrable potential to fuse data from multiple social media platforms, and features for adding notes/documenting data.
The TMS software provides a mechanism for deriving meaning from locally extracted tweets. During piloting, a small batch of data was collected from Twitter to understand the type of information it is possible to elicit before collecting data at volume. We did not aim for the 1254 tweets that were extracted during this “scoping” period to be representative. However, it is worthwhile pointing out that whilst the pilot dataset was bias towards 16–24 year olds and there was a higher concentration of tweets in parts of the West End that flank Newcastle’s central business district, it was relatively even in respects of gender and ethnicity. This is in-line with what we might expect from larger Twitter datasets given the social network’s demographics. A higher proportion of Twitter users are young (especially those aged 18–29), above average earners and urban dwellers [
39]. Given this composition, by aggregating people’s spatial and temporal behaviours via Twitter at volume, the TMS algorithm might be predisposed to give way to a what Ross
et al. [
40] describe as the “false consensus effect”, a form of bias identified by cognitive psychologists that could subsume the experiences of Twitter users who are of a minority group of users in Twitter’s overall network. As well as making such biases explicit, future TMS case studies will involve the capture of publicly available data from groups identified as being on the margins of Twitter’s demographic.
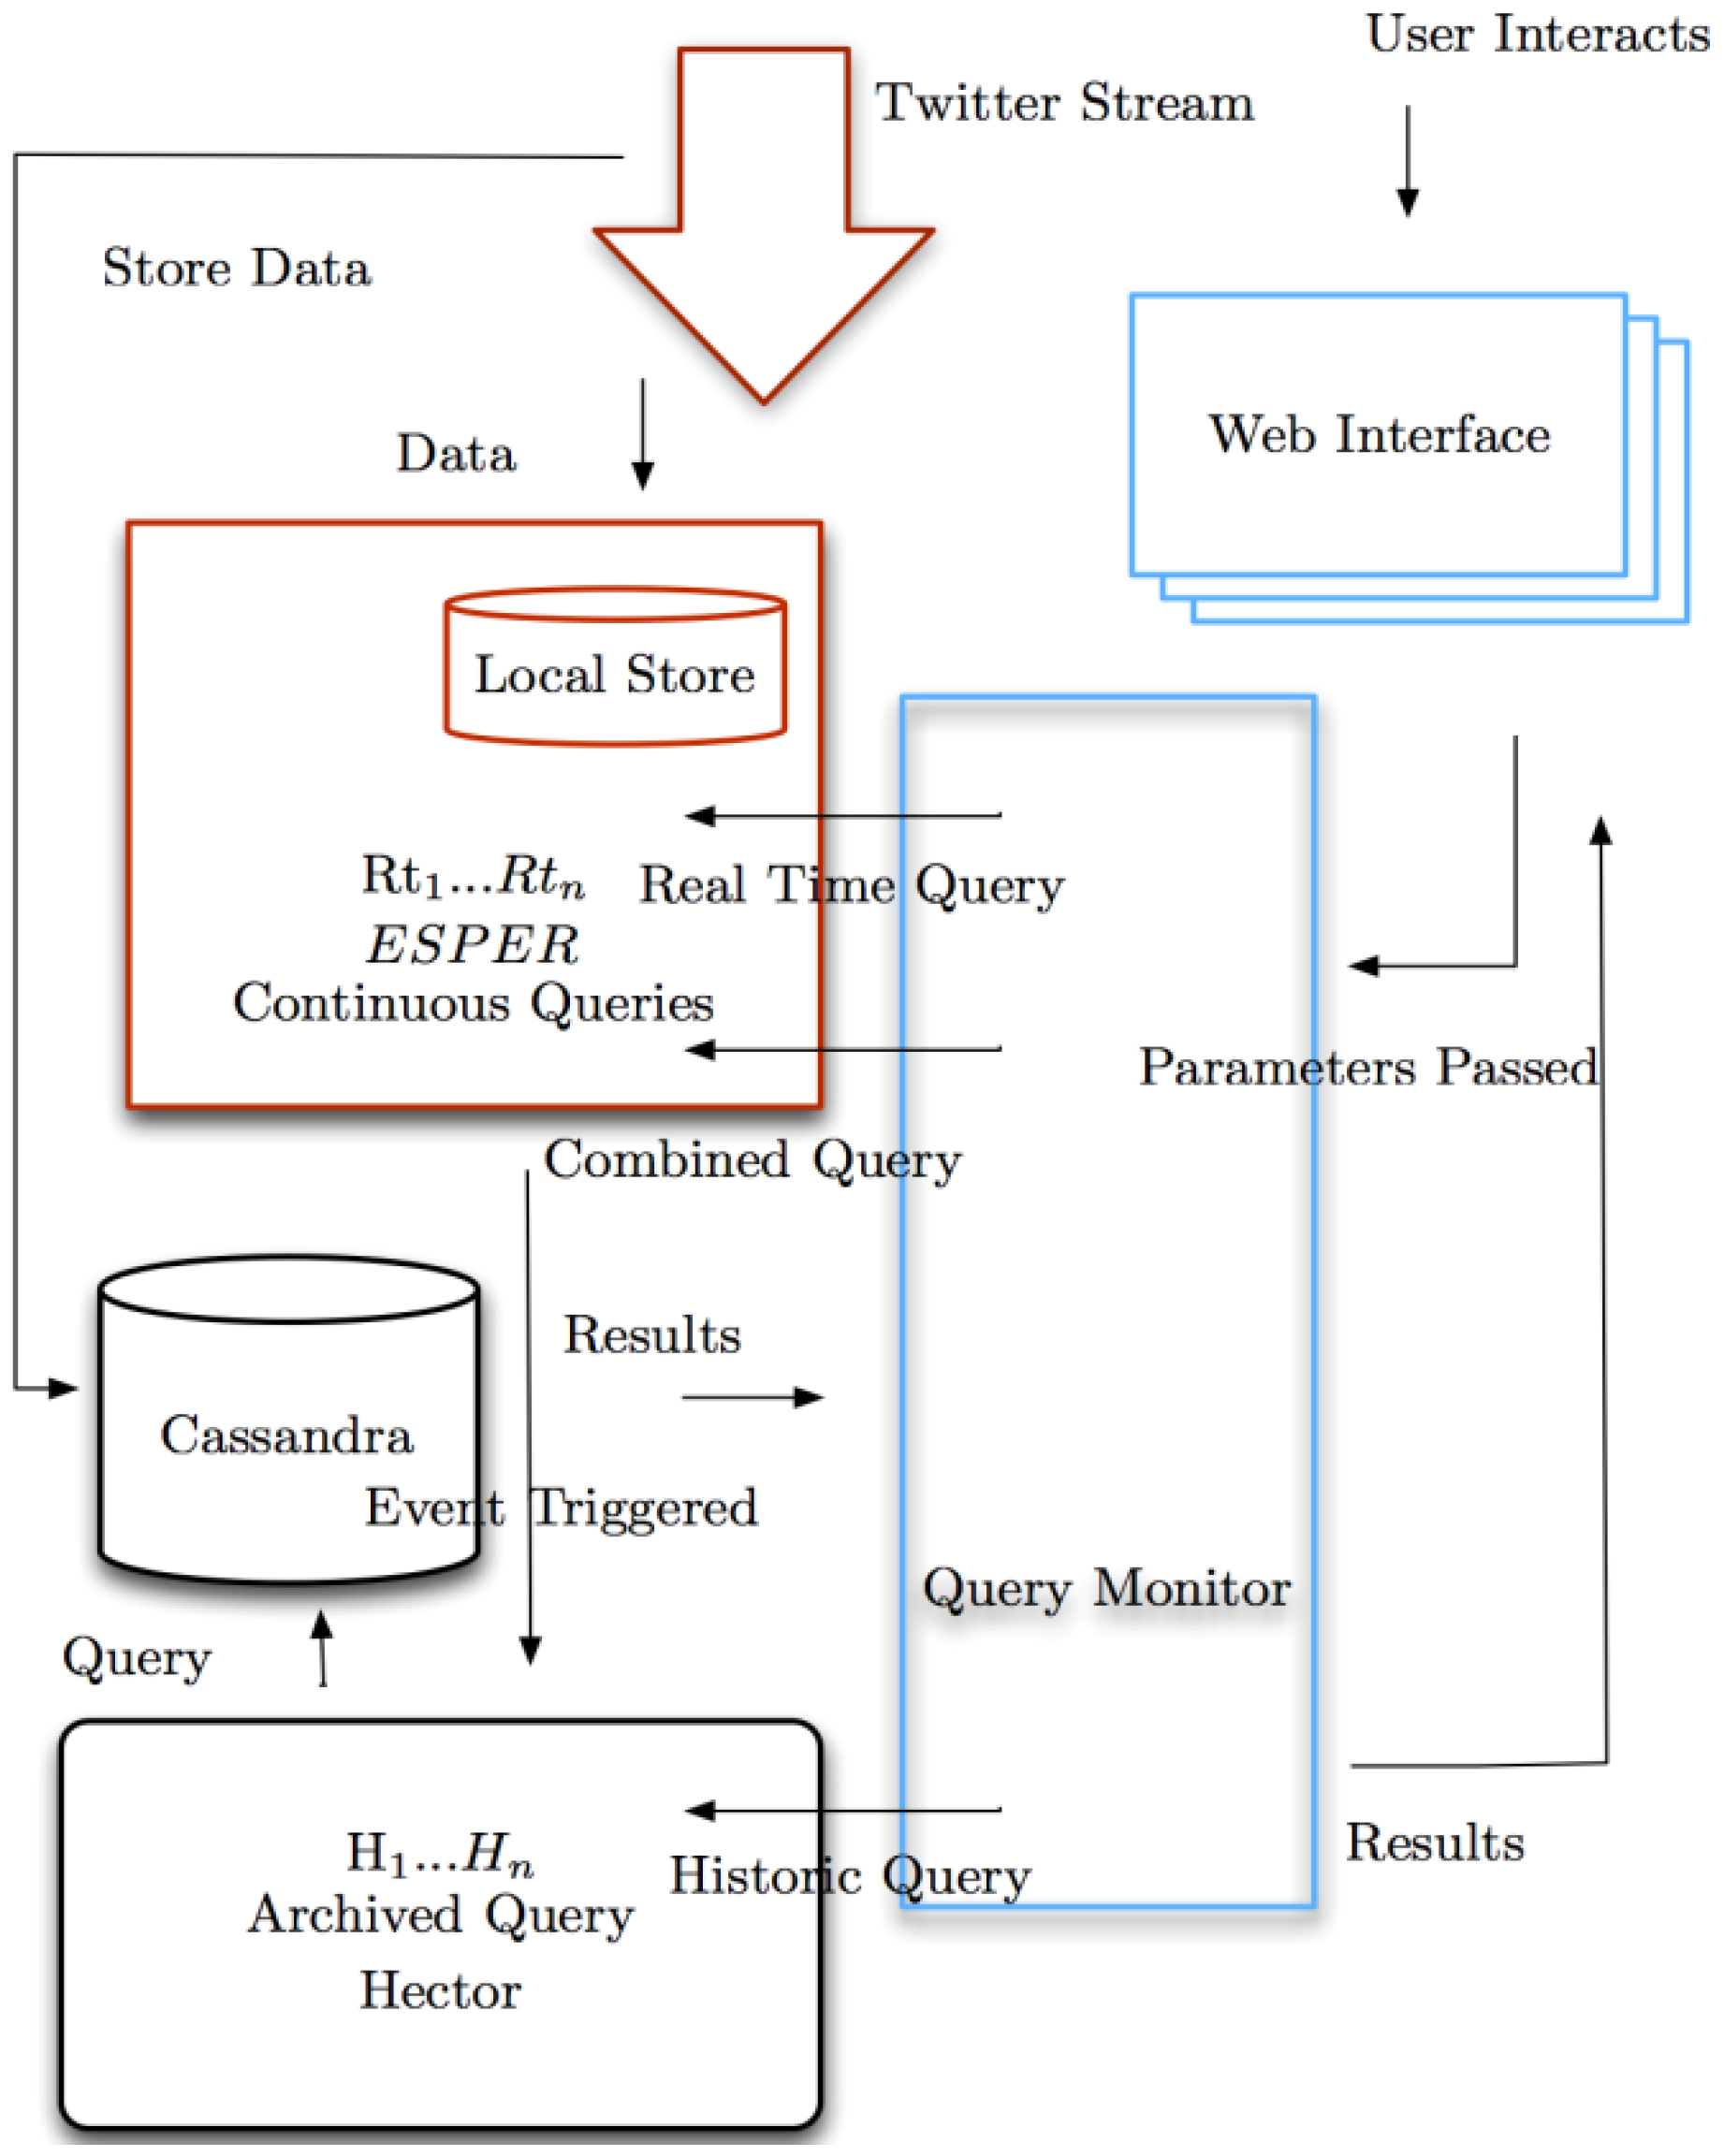
Figure 1 denotes the software architecture and its various modules—those depicted in red represent real-time analysis modules and the historic, in black. The real-time module is centred on the Twitter stream. As tweets enter the application they are either stored or processed by an events system called ESPER. Parameters are passed to the query through the user interface. ESPER then executes a continuous query (containing the values) across the Twitter stream. If the tweets are stored they become part of the historic dataset.
Figure 1.
Architecture diagram showing the work flow of the system.
Figure 1.
Architecture diagram showing the work flow of the system.
Cassandra is the noSQL “column store” database that is used and this comprises “keyspaces” which are equivalent to a database in SQL. Each keyspace is divided into “column families” that are similar to tables (and in turn, comprise rows and sets of columns). The API used for connections to Cassandra is Hector, a Java library providing mechanisms for data manipulation [
41]. If a user inputs a time period into the interface these values are then passed to the historic query. This is then executed across Cassandra, a scalable database with high velocity writing abilities. This is appropriate for Twitter data as petabytes are often received in quick succession. It is also schemaless and promotes denormalised data. Together, this provides a unique mechanism combining historic and real-time data. Events identified across the stream will trigger historic query execution. The user interface is a web application (
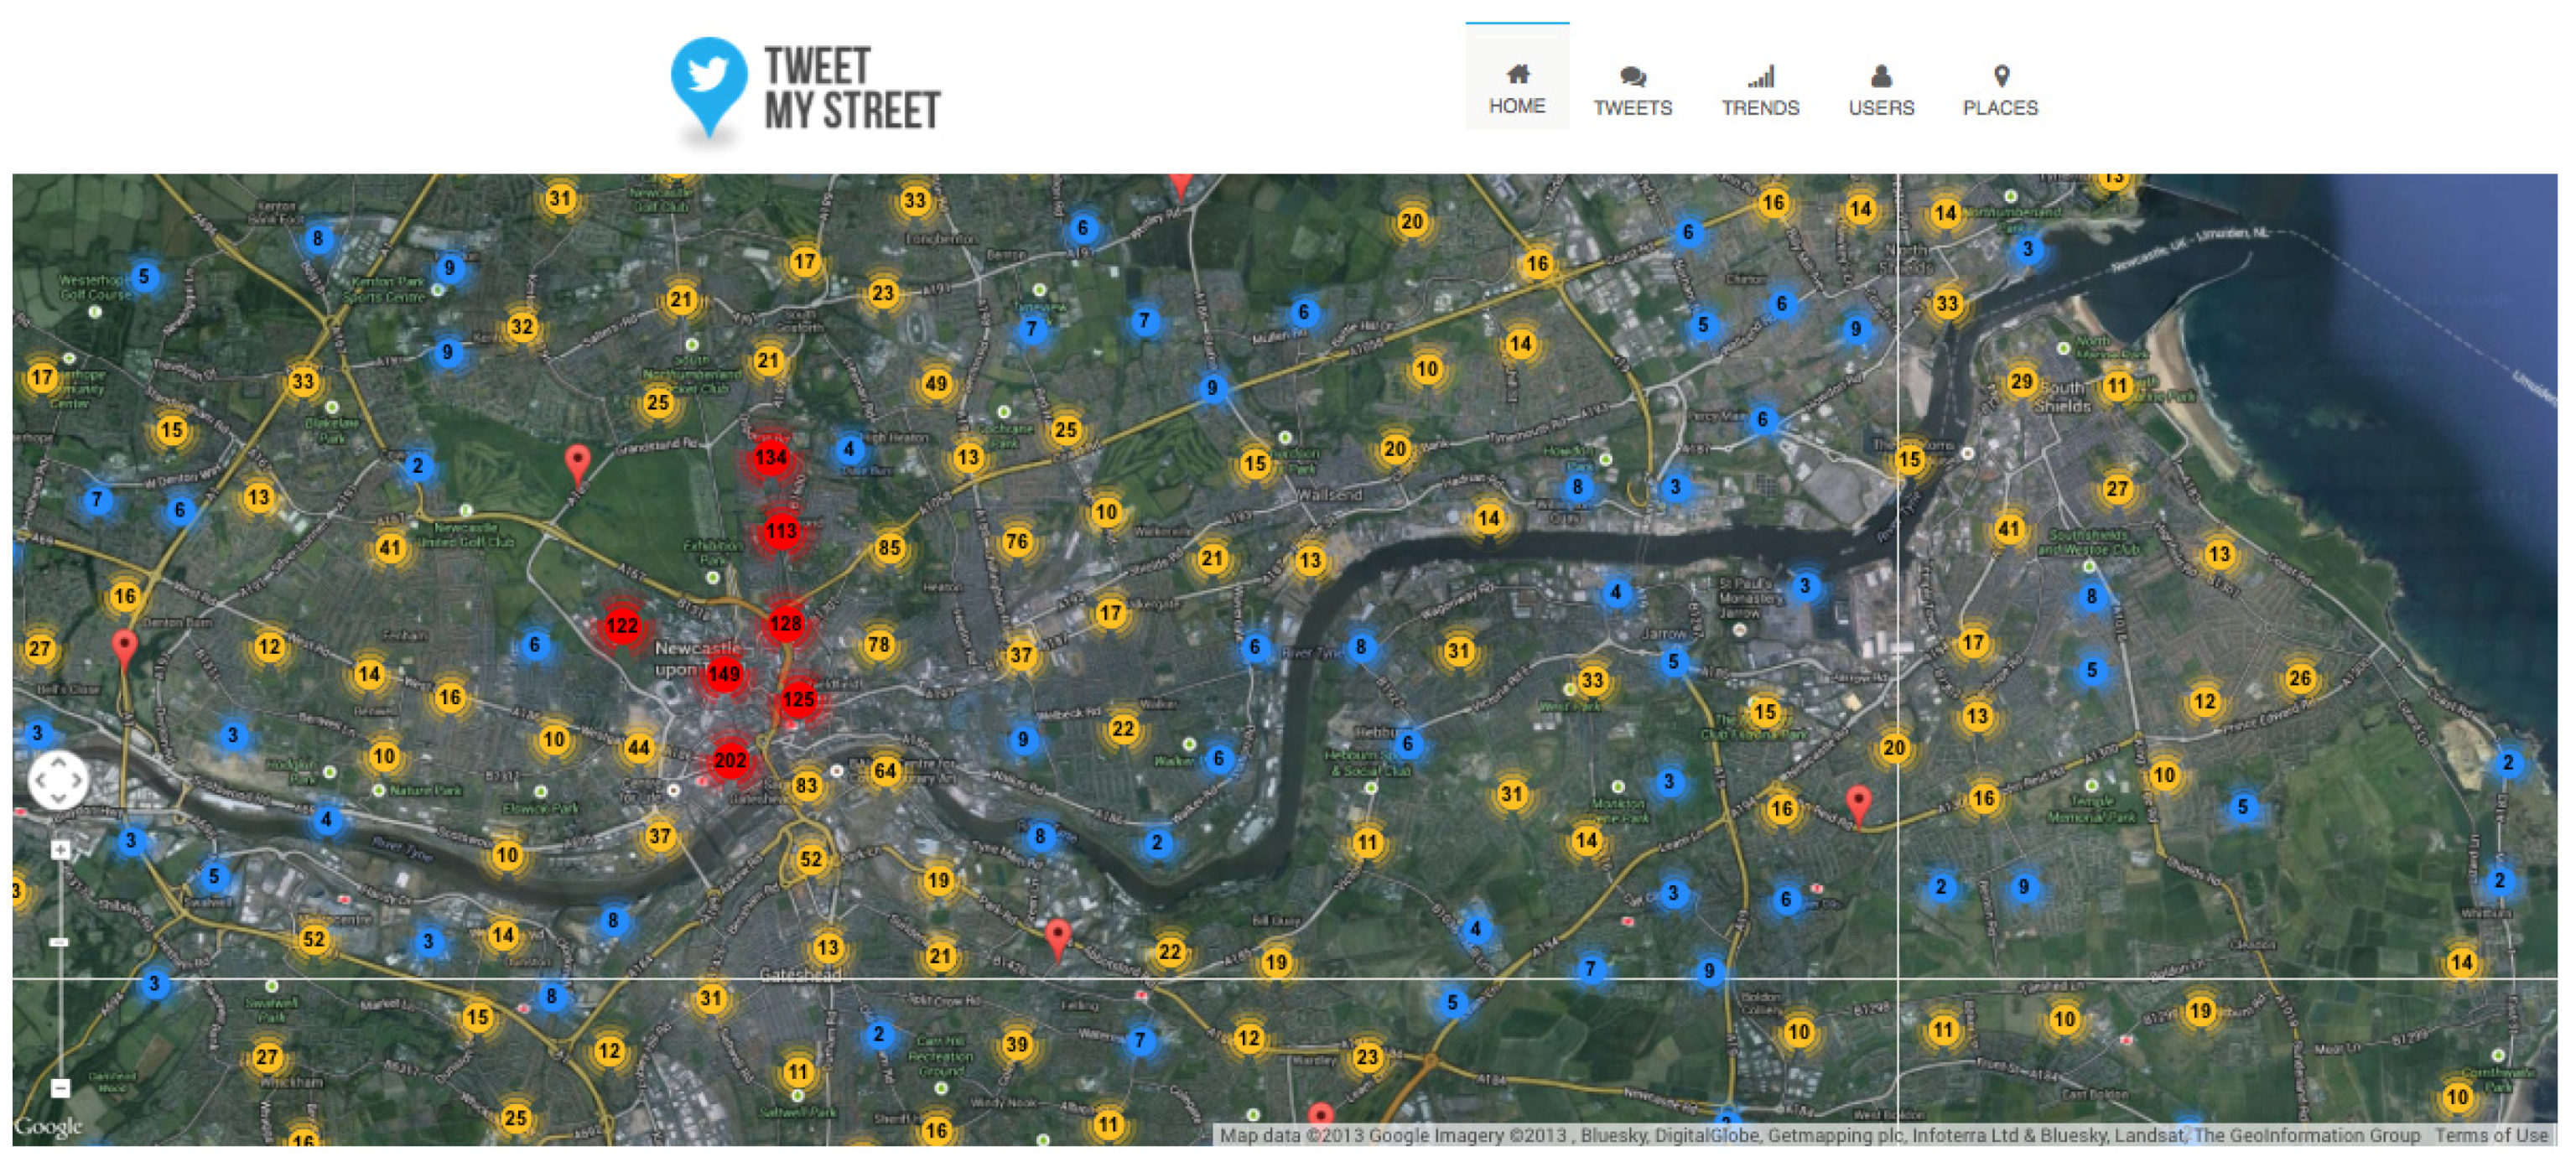
Figure 2) that allows inputted values to be passed as parameters to the queries. The results are then returned and visualised for the user.
Figure 2.
The user interface of the Tweet My Street (TMS) application.
Figure 2.
The user interface of the Tweet My Street (TMS) application.
3.1. Schema Design
Illustrated in
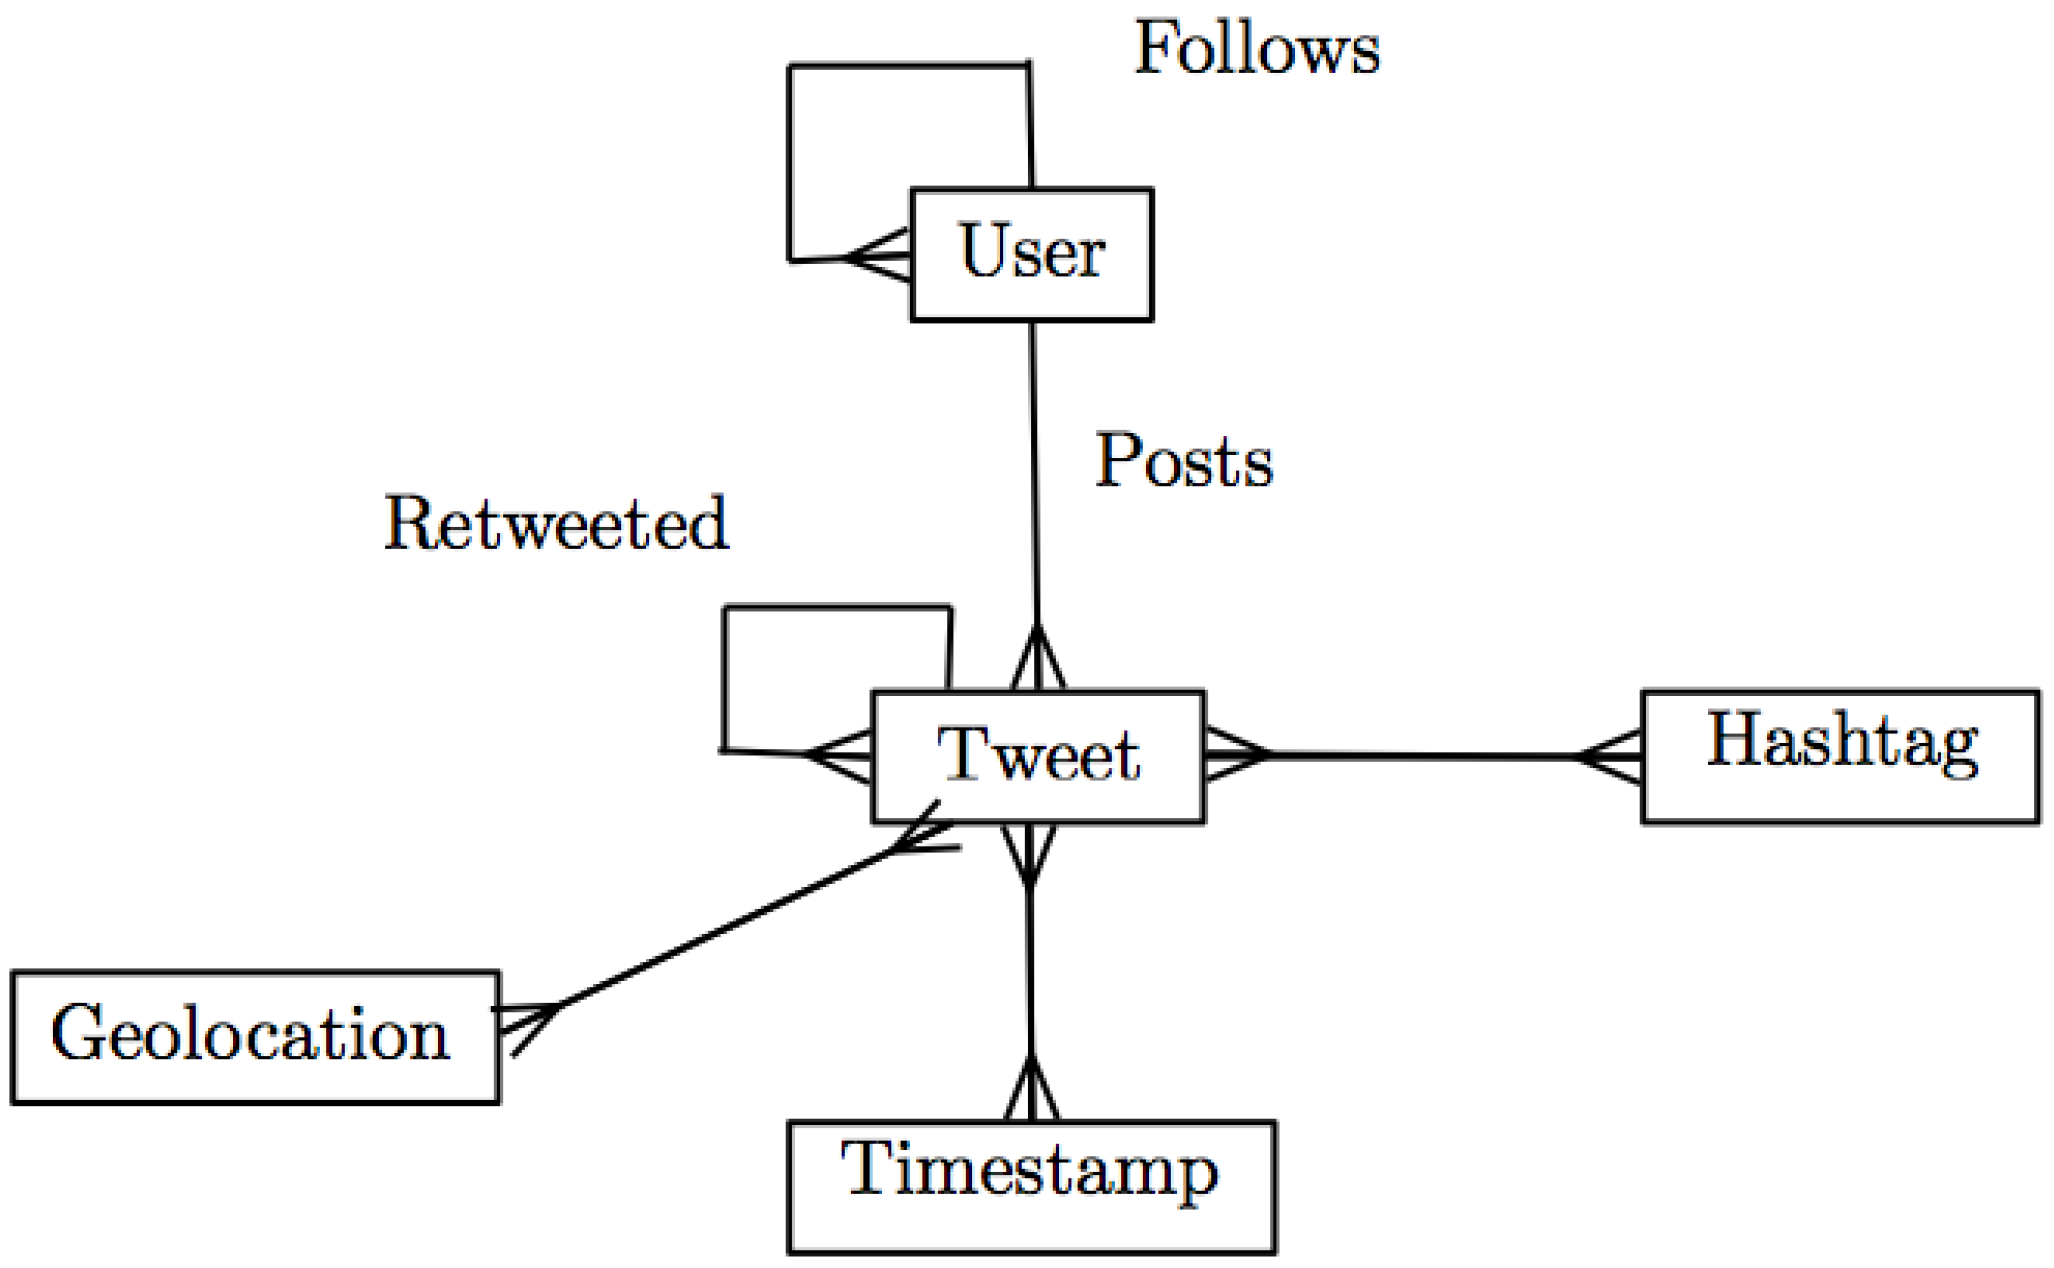
Figure 3 is Twitter’s data model and the data stored within Cassandra.
Figure 3.
Twitter data model and flow.
Figure 3.
Twitter data model and flow.
Twitter users follow others and have the ability to post one or more tweets that can also be “retweeted”. Hashtags can be employed by users to label groups of topics. This has been used to design and develop the database schema that describes the organising of data and provides a blueprint for database construction. The schema centres around three key questions: what is the frequency of tweets posted a given area; where have tweets been posted; and what topics trended last week? Queries were defined using a language called CQL (continuous query language) [
42]. This provides a formal method of describing the queries that can be easily understood and have standardised semantics. The language itself is SQL-based so has familiar characteristics. Another attribute is the time window, which demonstrates the bounds of the query. This is important due to the temporal nature of the queries that are displayed in
Table 1 and are written as follows:
Table 1.
Example queries and user-defined parameters.
Table 1.
Example queries and user-defined parameters.
| Queries | Parameters |
|---|
| threshold | startTime | endTime |
|---|
| Q1 | | x | x |
| Q2 | | | |
| Q3 | x | x | x |
Q1 (startTime, endTime)
SELECT COUNT (tweet)
FROM tweet_time [$startTime-$endTime]
Q2 ( )
SELECT *
FROM tweet_geo
Q3 (startTime, endTime, threshold)
SELECT hash
FROM hashtag_time [$startTime-$endTime]
HAVING COUNT (hash) > $threshold
Table 2 shows the two column families that index the data to enable efficient query execution. The data is denormalised to reduce execution time for capturing real-time results and eliminating the cost of joins. Denormalisation is the attempt to optimise reads to the database by adding redundant information. Joins are an SQL technique of combining data from two or more tables.
Table 2 illustrates the column family used in answering the first question. The row key creates a lower bound for the time period which results in the row being a time bucket of one day. The column name is a composite-type composed of the minute a tweet was posted. For instance, “1400” would be the last minute of a 24-hour period. The second half of the column name is the tweet ID; for example, <1400:3348585>. The time period specifies the range of the query and will return each column in that period. The column value is a counter that increases each time a tweet is mentioned. The column families indicate the elapsed time since a tweet was posted. The “tweet geo” family is used to answer the second query by storing the geo-coordinates of each tweet. The row key is the tweet identification and the two column names “latitude” and “longitude” indicate the values that each saves.
Table 2.
Column families: “tweet time” and “tweet geo”.
Table 2.
Column families: “tweet time” and “tweet geo”.
| tweet_geo | tweet_time |
|---|
| Row Key = tweeted | Column Name = Latitude | Column Name = Longtitude | Row Key = lower bound 1 day | Column Name = <minute:hashtag> |
| Value = lat | Value = lon | Value = counter |
3.2. Visualisation
Data is represented by a user interface in
Table 2 to allow efficient navigation and usage. The web application consists of five pages: “tweets”, “trends”, “users”, “places” and “time”. The first allows users to specify a time for retrieving the total number of tweets in a given period. Trends allow users to specify a window in which a common occurrence, event, news report or otherwise might have been cited. Trends are dependent on Twitter users deploying a hashtag in their tweet(s) and the TMS framework captures those that have been deployed more than once and specifies its value. Hashtags are a powerful, efficient and systematic way to derive key themes from Twitter as they make it possible to filter tweets. However, because it is not possible to fully understand the contexts of tweets referenced only with hashtags, other ways of analysing tweet content are being interwoven into the software. The users page returns a list of those whose tweets have been captured and summarises profile details including Twitter username, location, language, time zone, and their total number of tweets, followers and friends. On the place page, geo-located tweets are superimposed on a map divided into the UK Office of National Statistics’ Lower Super Output Areas (LSOAs—Used to help measure levels of deprivation and report other small area statistics; there are 32,482 LSOAs in England). This allows users to see the different locations of tweets and maps all geo-located data from Twitter’s Firehose irrespective of what is trending. The map also offers “heat” and “LSOA” layers to help users of the TMS application observe occurrences of tweets geographically and ease cross-analysis of tweets with policy data. The different layers of the map can be enabled and disabled depending on individual requirements. Similarly, the time page illustrates peaks and troughs in the number of tweets posted in graph form. The X-axis is dynamic, visualising “bursts” and anomalies in Twitter activity to make clearer event-driven tweeting-such as a spike in activity during a sports fixture.
Using the software, geo-located Twitter data can be filtered, organised and visualised for analysis spatially and temporally, offering a basis from which researchers can cut through the volume and interrogate more closely tweets from Twitter to help pose more refined research questions on a given topic (for instance, understanding local Twitter user responses to #austerity during an election campaign). Based on the run-up and undertaking of the 28 day pilot, we now turn to discussion of several issues that need to be overcome whilst refining the software.
4. Closeness to Subjects and “Digital Responsibilities”
To further understand how the software might be improved, content and network analysis techniques were employed. At this stage, ascertaining Twitter users’ locations was the main challenge. There are two ways location(s) can be shared. Firstly, by manually inputting a city or neighbourhood into a user profile and secondly, by enabling GPS and cellular triangulation of individual tweets, a process known as “geo-tagging”. The latter means a Twitter user does not have to manually update their current location (say, during travel) and geo-tags are also language agnostic and so can capture a precise street address. Conversely, the location field of a user profile is static and subject to inaccurate and fabricated locations. Geo-tagging must also be enabled (from a default, non-tracked option) with each tweet. This provides researchers an extra layer of assurance that a person wants their location known. Geo-located tweets are therefore preferred but severely constrained. For example, an average of just 1%–2% of data posted to Twitter is geo-tagged in a typical day [
43].
This is a wider challenge inherent to Twitter’s geography. For instance, Leetaru
et al. [
44] explain how researchers involved in “Global Twitter Heartbeats” [
45] had to assign a location to every possible tweet within an average of 38 million tweets from 13.7 million users daily to successfully produce real-time heat maps displaying changing patterns of human emotion globally via Twitter’s Decahose (roughly, 10% of all tweets). This revealed that 15% of all Twitter users account for 85% of tweets, hence a small proportion of people dominating the network. More importantly, Leetaru
et al. contend that to expand the number of tweets it is possible to map, geotag algorithms need to be applied. However, a key problem with this is that these have only been designed for English text. This means that if English is rarely used in particular places or “if English tweets have a fundamentally different geographic profile than other languages, this will significantly skew geocoding results” [
44]. Consequently, there will always be geographical bias in social data collected from Twitter’s Firehose. One of the avenues we are exploring to minimise its impact is to combine real-time and historic datasets, thereby increasing the number of tweets and incorporating a finer temporal granularity to the visualisations. That is, we are aiming for a constant stream of real-time and historic data into the framework from available sources.
This works in a similar fashion to the Twitter-based event detection and analysis system (TEDAS) system described by Li
et al. [
46] which helps users to detect occurrences of crime, analyse their spatial patterns and determine levels of importance through a framework of historic and real-time queries. Such frameworks have been possible following Twitter’s “Rainbird” [
47] but as with other comparable frameworks to TEDAS, queries tend to remain context-specific. Where TMS differs is in its scope of querying. It uses aggregate functions and time series data to answer varied questions posed by the user. The Summingbird project [
48] provides three querying techniques (historic, stream and composite) and our system aims to improve this by querying historic data as if it were a live stream. Similarly, where McCreadie
et al. [
49] outline their stream processing technique, TMS is going further to allow a combination of historic and stream processing. With our framework, we do not seek to discount tweets from the Firehose through, say, trying to set criteria to focus on crime or transport-related tweets in isolation but weave additional features into the software to help users of the web application identify and focus on clusters of tweets of interest to their own research foci or requirements.
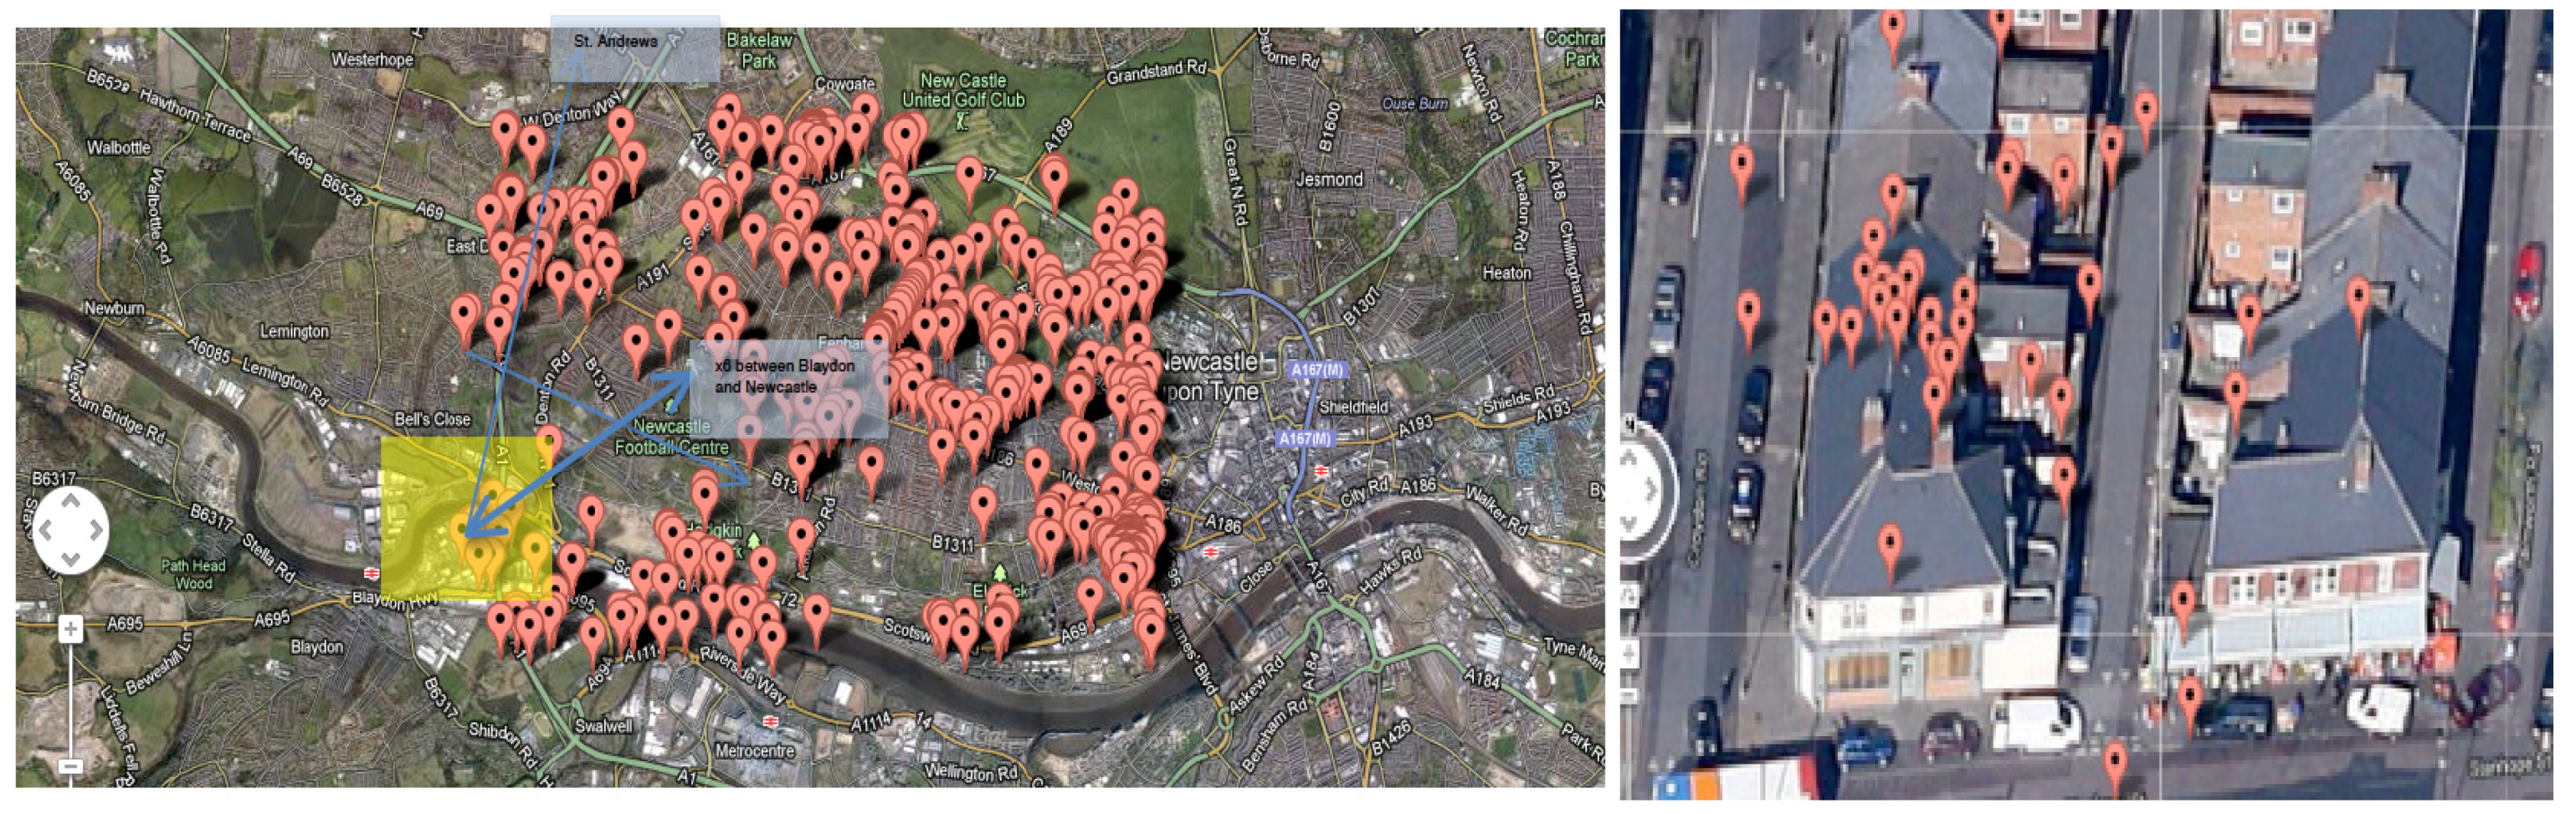
Figure 4 shows the “map page” of the TMS web application, demonstrating how the tool can be harnessed to focus on particular clusters of Twitter activity by location and time. This particular example is a cluster of tweets captured in part of Newcastle’s West End known as Fenham, flanking a main thoroughfare of shops, cafes and other businesses catering to one of the most diverse resident populations in Newcastle upon Tyne in terms of ethnicity, race and national background. 6.2% of residents identified as “White-Mixed” or “Asian” in the 2010 update to the UK National Census. There has also been considerable focus in Newcastle City Council in terms of identifying changing local needs and tapering services provision according to, for example, the growing range of spoken and written languages now represented in Fenham, as well as challenges pertaining to cultural misunderstandings and cohesion between different ethnic groups [
50]. For social, cultural and urban geographers, the ability of the TMS application to visualise clusters of tweets with such fine granularity is of relevance because in this instance, the tool has managed to gather, pattern and present social data from people who are often disadvantaged in respects of having the ability to have their say through formal decision-making channels. We reiterate that this is a small sample of pilot data and the capture would need to be repeated longitudinally to make any definitive conclusion but it gives a sense of the micro-scale analyses that it is possible to perform.
Figure 4.
“Clusters” of Twitter activity in the West End as seen through the first iteration of the TMS application.
Figure 4.
“Clusters” of Twitter activity in the West End as seen through the first iteration of the TMS application.
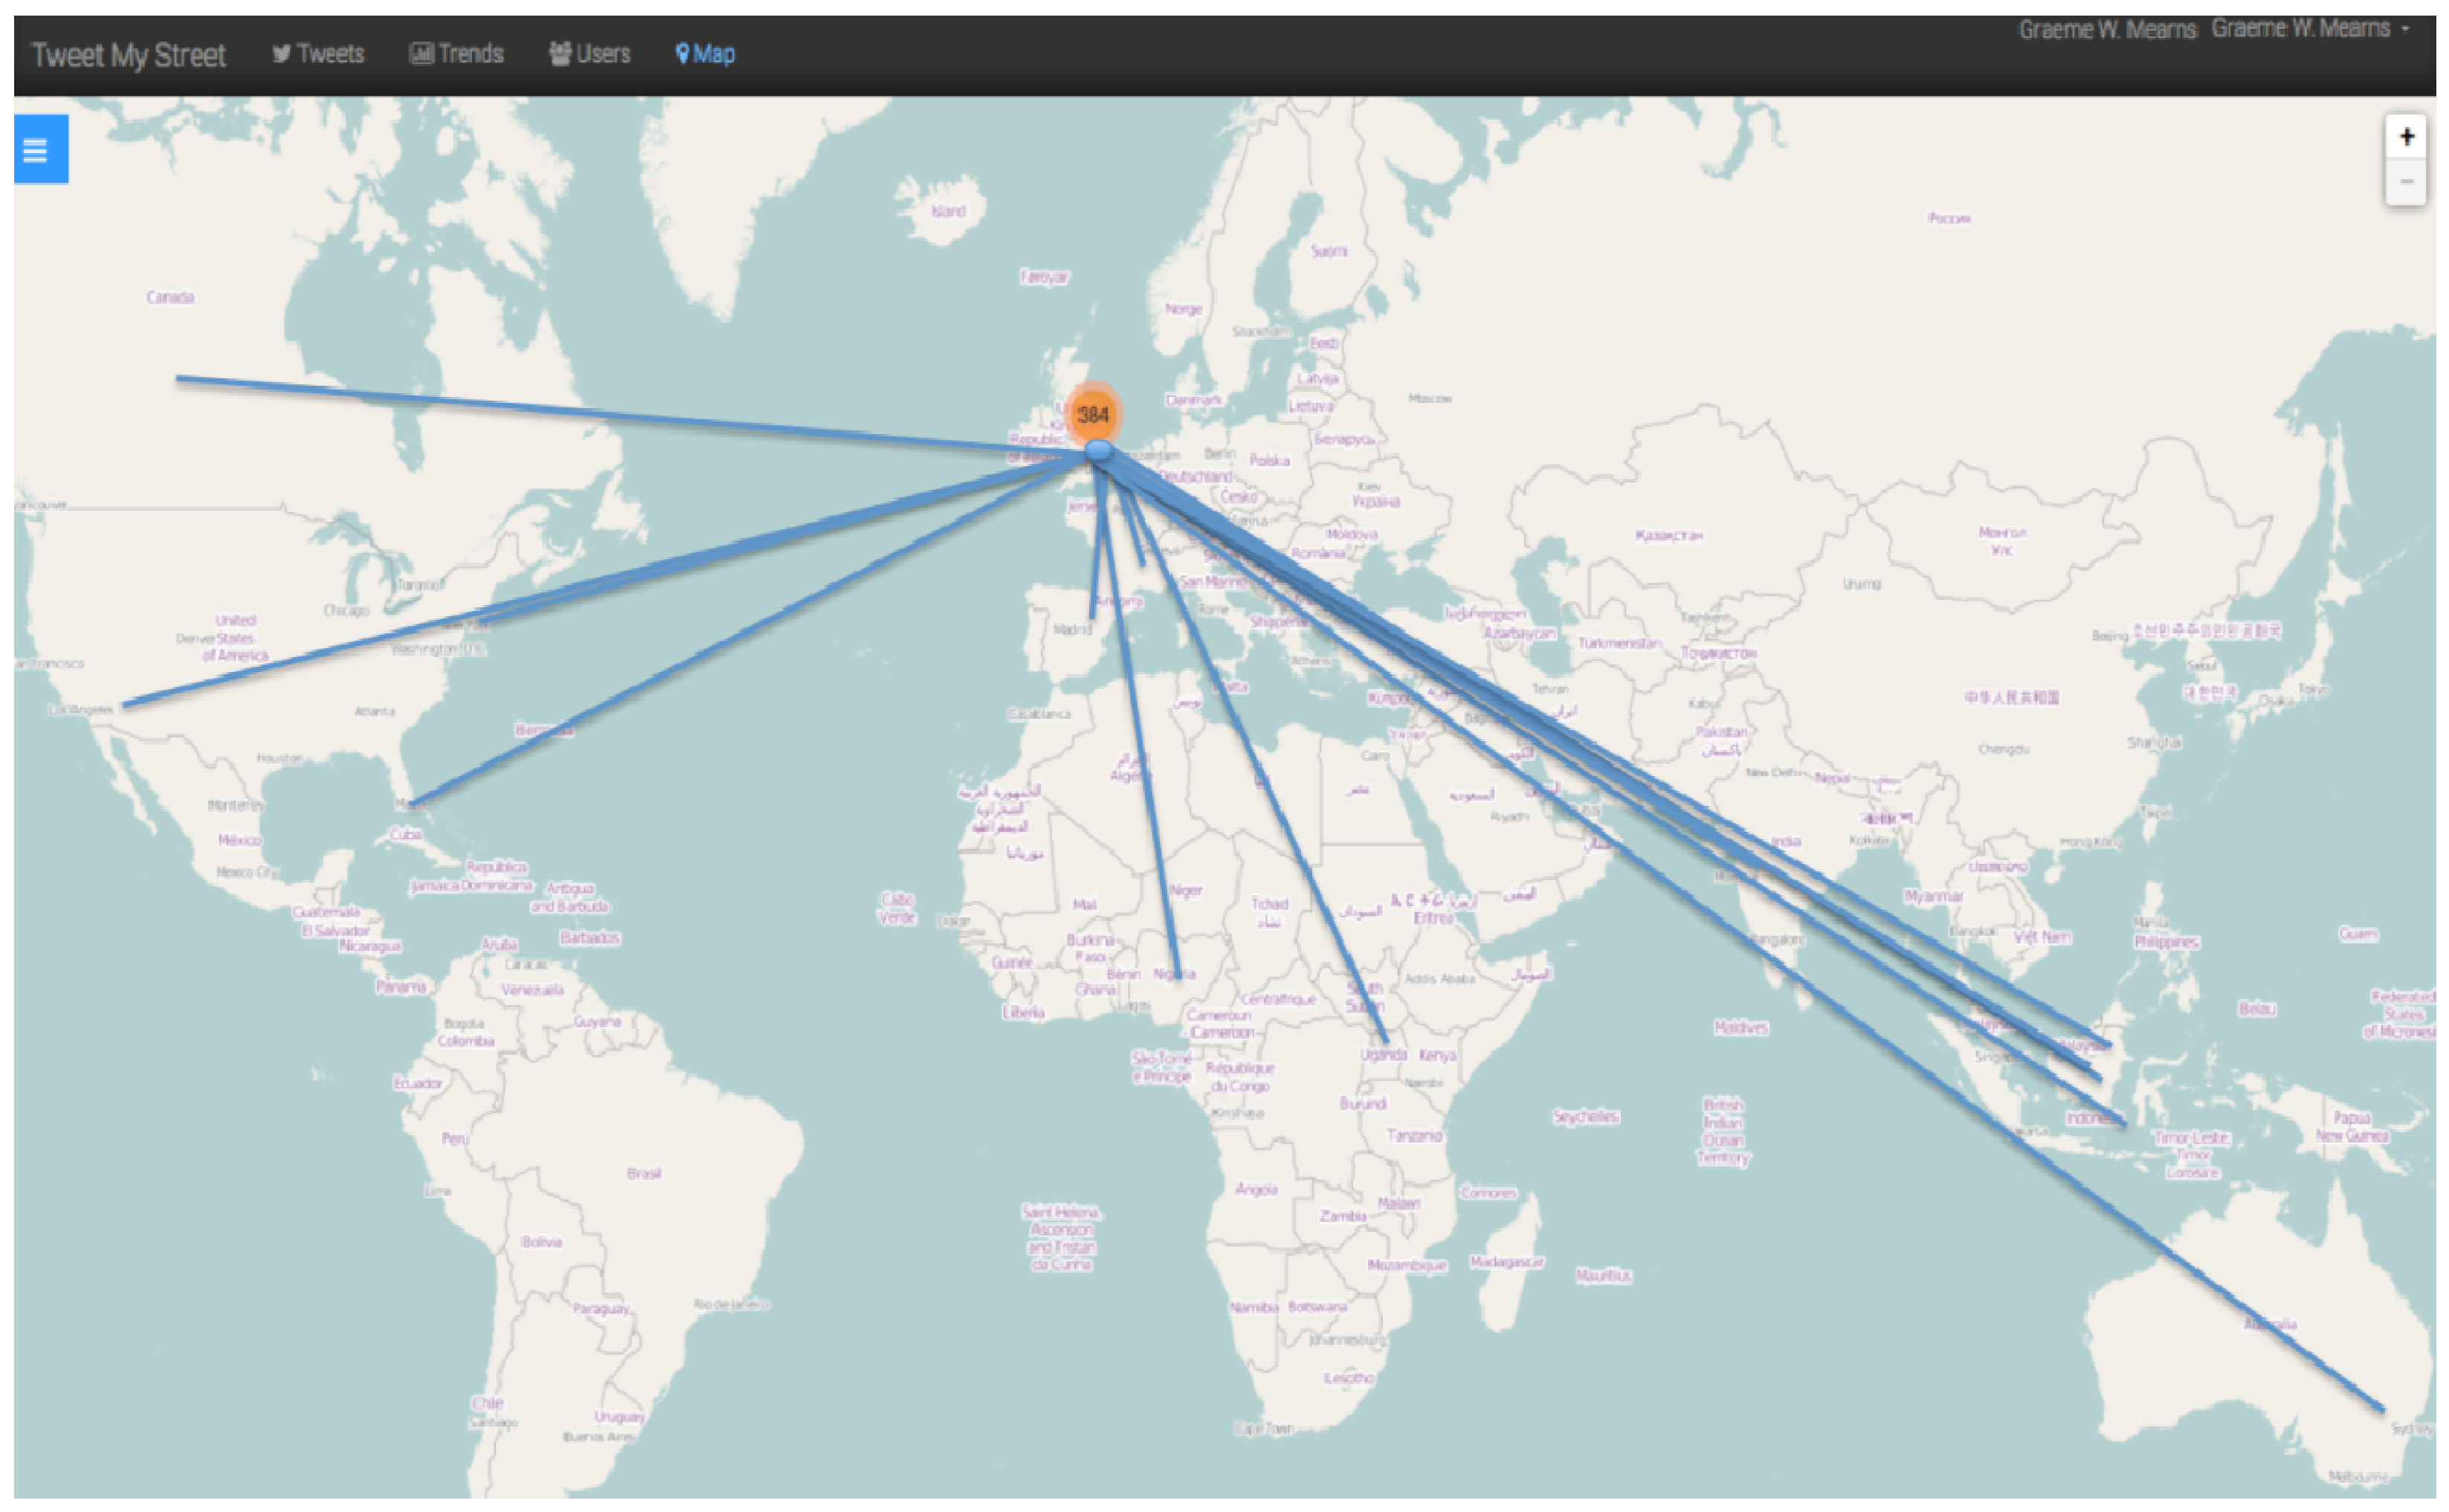
Furthermore, through closer examination of the user profile data behind this cluster of tweets in Fenham, the TMS application enabled us to gain a snapshot of the connections being made at a neighbourhood level. As made apparent in
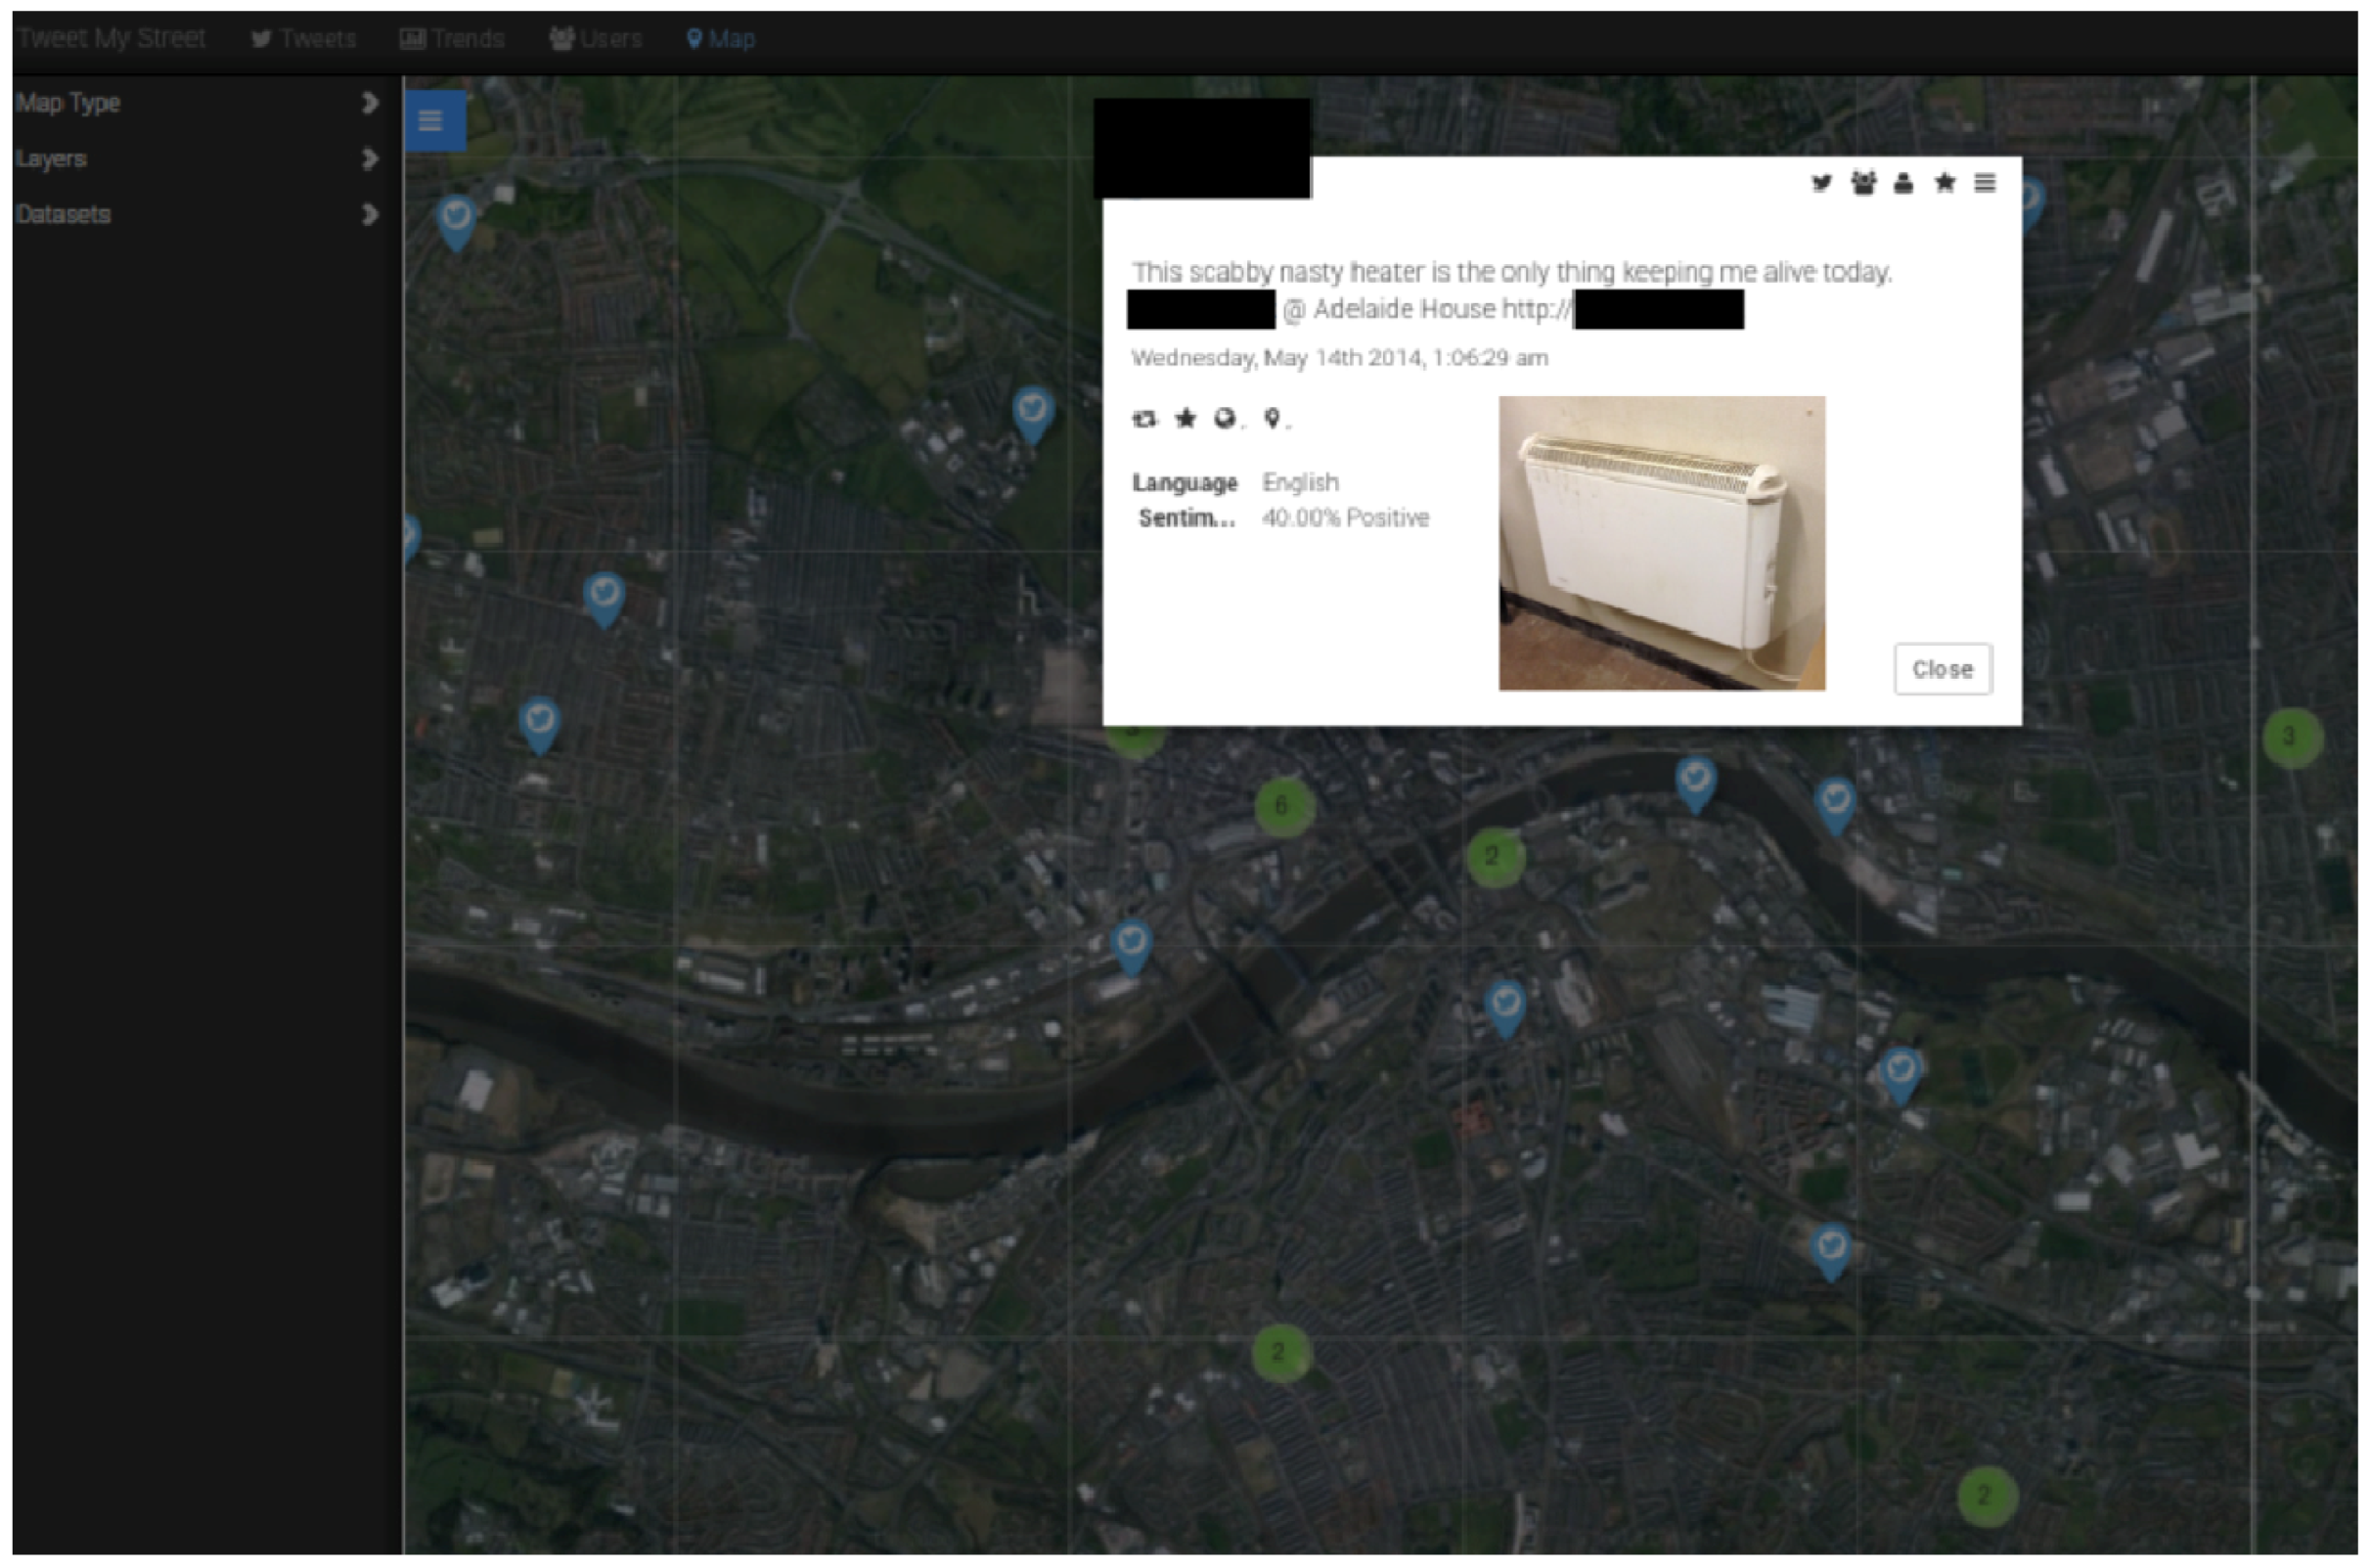
Figure 5, in this particular instance, most of the conversations taking place via Twitter were to maintain distant relationships between Fenham and Ipoh, Seri Kembanyan, Kuching, Labuan, Sunway City and Kuala Lumpur (Malaysia). We are not suggesting that local-level interaction is not occurring between the Indonesian and Malaysian student populations in this part of the city, but over half of the captured tweets involved an @mention and were therefore direct messages to someone else residing outside of the UK. Notable topics included studying, nights out, fashion, football, the right to equal marriage (legal as of 29 March 2014) and as shown in
Figure 6, complaints about social housing stock and traffic. Should such patterns stand ground over longer periods of time and with greater data volume, they make an interesting basis from which a social researcher might decide to investigate further through in-depth and/or face-to-face methodologies. TMS therefore has the power to draw attention to geographical connections that might not be illuminated through other means. Scholars, decision makers and others can use the tool as a basis for further research based on their specialism and requirements. In time, it is hoped this will enable current events in local communities to be spotlighted in such a way that could prompt support mechanisms for people living in the area in real-time.
Figure 5.
Increasing TMS functionality to visualise connections between people and places.
Figure 5.
Increasing TMS functionality to visualise connections between people and places.
Figure 6.
Spotlighting of tweet content via “map page” of the TMS web application.
Figure 6.
Spotlighting of tweet content via “map page” of the TMS web application.
Sui and Goodchild [
51] contend that social media combine volume and depth whilst increased access to rich and plentiful data brings fresh opportunities and challenges. Despite high data loss and uncertainty around the Firehose [
52], TMS offers a powerful entry point for those wishing to capture, pattern and visualise Twitter data geographically. This could be especially useful during scoping stages of research in terms of identifying local level issues for further investigation through traditional approaches like ethnography in much the same way Sui and Goodchild envisage. So for example, our pilot data revealed a high density of tweets (in terms of content and connections) in a deprived part of Newcastle between young people concerning hip-hop. These included connections beyond Newcastle to urban music fans and artists in Los Angeles and New York. Hypothetically, if the application were to reveal these over an extended time and at volume, further qualitative study could be undertaken to determine the extent and scope of connections with young people themselves. This could include, for example, working with a local authority and/or youth workers to determine the social benefits of increasing urban music provision in the geographical areas TMS highlights.
Beyond being a scoping tool to instigate inquiry, we are also looking at increasing the frameworks’ capability to provide users with a lens into more subjective dimensions. Chiefly, we are working to understand what textual and audio-visual content (included in tweets) might mean rather than simply teasing out connections between tweets and Twitter users. Building aspects of sentiment analysis into the software is one means we are considering to better understand the affective state of Twitter users and their intended emotional responses. Others have done similar [
53] but have also shown limited results because there are no standard algorithms for sentiment analysis available, resulting in a simple count of “negative” and “positive” words. In response, we have looked to expand abilities to thematise tweets beyond Twitter’s own hashtag feature. This ought to reveal additional trends when users evade (intentionally or not) the most common hashtags for a given Twitter trend. The latter will be particularly useful in the promotion of trends among proximate actors (for instance, studies creating a “wave” through Twitter to gain mass responses about a explicit topic) and in the longer-term, enable mechanisms for alerting local decision makers to issues faced within the communities served.
However, there are bigger methodological and ethical issues impacting our collaboration. The first of these relates to the paradoxical levels of proximity enabled to research subjects. Each member of the team were shocked by the level and depth of information about individual lives we have been able to elicit from Twitter, including personal photos, videos and details of individual workplaces and commuting habits that are available to anyone with a basic knowledge of Twitter’s public timeline. The latter could easily be attained with or without the application created as part of this project, but our role in developing it (and handling the pilot data) has made these issues far clearer. This has given rise to a number of tensions around privacy, security and the public-private dichotomy.
On the one hand, all of the tweets captured via Datasift are available because individual Twitter users have “volunteered” this data by not setting their accounts to a “private mode”. But is it expected that researchers check that every user whose tweets are extracted is knowingly aware that their broadcasts are public? When considering mechanisms to scale up the TMS application, we realise that this would be near impossible but an option we are considering is acting overtly in respects of highlighted individuals. That is, in any tweets (or interrelated social media content) intended for publication, we see the need to inform individuals that we have been able to capture a given tweet for the purposes of research and provide them with traditional study information and an “opt out”. This is deemed better than stopping social research that harnesses data from sources like Twitter because the data is being made available and sold irrespective of whether or not scholars attempt access and utilise the data with good intent. Arguably, it is an ethical imperative for neogeographers to understand and help inform people about the nature of their data trails rather than leaving these open to businesses and other actors seeking to capitalise through surveillance.
A second issue pertains to epistemological questions regarding neogeographic inquiry. Whilst data volume can affect levels of knowledge attained, TMS has demonstrated that the approaches used to collect Twitter data are crucial to its quality. Often positioned in opposition [
54], qualitative and quantitative approaches both have a role to play in the big data movement but the emphasis is heavily weighted to the latter. This is problematic. For example, whilst statistical analyses of tweets can provide researchers evidence of increasing followers of a particular user on Twitter, it will provide little to no demographic context on who is following whom and the extent of this relationship. For instance, what Granovetter [
55] describes as the “strength tie” in indicating the importance of personal relationships (such as whether communication is fleeting or longer lasting and whether this extends to face-to-face interaction). Big data can be particularly flawed in this respect. For instance, boyd and Crawford point out that when statistical approaches are used in isolation to examine mobile phone data that suggests workers spend more time with colleagues than with their spouse, this does not mean that spouses are less important than colleagues—no matter how big the phone data, context is lost in this instance.
TMS has involved a virtuous circle of collaboration. Geographers involved in the project use the web-based tool to analyse Twitter data and advance a case study that leads to new software requirements addressed by computing colleagues. The tool is then enhanced and passed back to the social scientists in cycle. This way of working has made apparent a third interrelated challenge which stems from the fact that our research is cross-disciplinary and we are confronted with different ways of conceiving and approaching a research problem and different ways of working [
56]. Such tensions have long been common. For instance, Williford and Henry [
57] cite Snow’s (the English novelist and chemist) distinctions between the intellectual positions of “humanists” and “scientists” in discourse around the Industrial Revolution. He noted that scientists largely viewed this as the product of science and engineering whilst humanists ignored this shift. His point is an assumption that science embraces technology and the humanities does this reluctantly. Each member of the research team has been made consciously aware of this “two culture” way of thinking and the academic and institutional structures that remain anchored by the traditional perspective Snow described. Nevertheless, there are notable differences in how computing science and social science researchers position themselves. For example, the computing scientists have been integral in illustrating what is possible with the technology whereas the geographers have been fundamental in clarifying the type of information collection possible to inform the features automated by computing scientists in the TMS tool. The fact remains that whilst TMS has proven a successful iterative process of design, prototyping and testing similar to that identified by Nielsen [
58], extra support is necessary for researchers working across disciplines to gain the most from the current turn to computational (
vis-à-vis neogeographic) approaches. Increased opportunities for social scientists to learn basic computing language and the case-by-case ways in which computing scientists work would be advantageous, as would additional routes through which computing researchers might be expected to explore more critically the possible outcomes of the tools they develop.
5. Conclusions
TMS has proven a successful collaboration which has resulted in a cloud-based software architecture for the real-time and historic analysis of content derived from Twitter. This is fully scalable and able to process data at the full rate at which tweets are generated globally. The objective of this paper has not been to describe a concluded project or to present a Twitter-based map of Newcastle upon Tyne. Rather, we sought to annotate key issues pertaining to the use of social media data for neogeographic inquiry with examples of how a multifaceted analytics tool has been piloted in the city’s West End. The provided examples indicate the potential of TMS for highlighting patterns of communication via Twitter, uncovering trending topics and deriving user-generated content at a very local level. In the longer-term, we see this as having possible application beyond scholarly inquiry in, for example, the contexts of social housing provision or other public services.
The software architecture is already undergoing enhancement with the addition of sentiment and thematic analysis features that will assist social researchers (and other users) in being able to perform more advanced queries of trends and topics by time and location. Real-time streaming further enhances the frameworks’ capabilities. Local or global events will be highlighted to the second, enabling immediate information distribution with the public, whilst the combined historic and real-time querying will allow social researchers greater functionality in respects of interrogating clusters of Twitter activity as has been seen with initial examples in the West End. However, the main features of the current web-based application are driven by geospatial “trace data” (geotags and time stamps attached to tweets). To support the work of geographers, our collaboration has made clear that the real challenge of social media data is perhaps not simply one of volume but of diverse functionality, software that empowers researchers to undertake varied analyses that go beyond visualising connections between users. Central to this is the need to focus on longitudinal activity as well as events and to combine abilities to map user connections with functions that help researchers derive meaning from what users are posting—what users write and say and the imagery and audio-visual aspects they post within tweets.
The research team is now exploring contemporary statistical techniques to help efficiently store and query connection graphs over time, enabling more depth in respects of the flows of tweets, changes to information flow, significance and patterns between senders and recipients. Similarly, a new case study will involve deploying the TMS tool to qualitative inquiry focussed on an international event, allowing us to better determine the relationships between dataset size and the “quality” of information derived. This will involve cross-analysis with existing secondary datasets (LSOA data) and data resulting from semi-structured interviews to determine similarities and discrepancies in conclusions made from social data attained through the TMS application.
However, TMS has also highlighted that whilst Twitter is a valuable new source of data, geospatial content can be particularly intrusive and additional steps are needed to mitigate any possible negative consequences. Safeguarding steps have included password protection of the TMS tool and anonymisation of all highlighted content (including user profile details in a given tweet) and providing Twitter users with a means to opt-out. The latter will involve making “spotlighted” Twitter users aware of the level of personal information they might have unknowingly broadcast publicly (or semi-publicly). As well as bringing light to such issues from within our home disciplines, greater reflection on the “digital responsibilities” inherent to doing neogeography is equally crucial in thinking about how different groups and modes of analysis can come together to compliment the field. This is because thinking about issues such as ethics, privacy, security, the growth of information and in/formal surveillance cultures forces different perspectives to congeal around a fundamental question of neogeography: how might we ourselves as academic and non-academic researchers, local officials, artists, community practitioners, software developers and other vested parties be enacting new relationships in the construction of spatial knowledge, to what effects and on whom?


