1. Introduction
In the recent years the progress in technology and the increasing availability of fast connections has produced a migration of functionalities in Information Technology (IT) services, from static servers to distributed technologies. This phenomenon is commonly well known as
Cloud Computing; the most exhaustive and official definition comes from the US National Institute of Standards and Technology (NIST) [
1], which introduces all the fundamental concepts of the cloud systems, such as on-demand access to resources by the end user and offering services with minimal infrastructures and management effort.
NIST definition points out that cloud computing includes data processing and data storage, both performed on remote servers.
The arrival of cloud computing is also changing many core concepts in IT, defining new service models for distribution to final customers. Summarizing the definitions in [
1]:
Software as a Service (SaaS): the consumer can use various cloud devices to take advantage of a provider’s application (web application) that is stored on a cloud infrastructure.
Platform as a Service (PaaS): business users can deploy and distribute their applications onto the cloud, taking advantage of the tools supported by the provider without having to manage the underlying infrastructure
Infrastructure as a Service (IaaS): in addition to all the functionalities of the PaaS model, the user can also control the operating system and the storage as well as select some network components (e.g., host firewalls).
We can therefore understand the importance of cloud technology, primarily in business environment. The companies that choose to move their assets on the cloud will only take care of their core-business (e.g., software developing, for a software house). No more need for data management strategies (security, persistence, geographically scattered backups, etc.) nor hardware updating to guarantee adequate computing power and storage space.
The end user, by accessing a SaaS from a common browser, benefits of all the software features without the need for an adequate hardware or installation/configuration steps.
In research, often the set up of a proper work environment is a time consuming and costly activity. In order to guarantee enough storage space and computing power, new hardware has a short obsolescence time. In machine-learning and data-mining, the researchers often deal with High Performance Computing (HPC) and Big Data. These are the typical conditions where cloud technologies can offer the best advantages: large amounts of data and high computational power. Cloud architectures applied to these contests have been called Analytics-as-a-Service (AaaS) and have been largely treated in literature in the last years [
2,
3,
4,
5,
6].
In this article we will start describing some of the available systems and platforms for analytics and their specificities. Afterwards we will describe a case study where one of these tools has been tested to face a problem concerning a pathology called Hearth Failure (HF), very well described in literature. We used machine-learning to predict the presence of the disease, relying only on the Hearth Rate Variability (HRV) analysis.
The following is a brief summary of the available analytics systems/platforms. We selected the top ten systems according to the rankings from Martin Butler [
7], and basing on the review published by Butler Analytics [
8].
2. Related Studies: State of the Art about Analytics Tools on the Market
The following information has been extracted from the public websites of vendors and from the above mentioned reviews by M. Butler [
7]. The intent is exclusively to provide an overview on the state of art about the currently available cloud-based products for analytics.
2.1. Revolution Analytics
Revolution Analytics is a system of analysis based on the R language, which is a well-known programming language widely used for statistical issues. Revolution Analytics integrates this open source language into a form easily usable by enterprises. Revolution R is distributed in two versions, Open and Enterprise editions, and offers high-performance, scalable, enterprise-capable analytics and Big Data analysis. The Enterprise edition supports several ready to use tools that allow users to exploit features for model building/deployment, as well as advanced data analysis. Revolution Analytics was recently acquired by Microsoft, which has promoted a campaign of facilities for academic accounts and non-profit associations.
2.2. Statistica
Statistica is a suite from StatSoft, recently acquired by Dell Software. The Statistica suite offers many products, such as Data Visualization, BigData, DataMiner, TextMiner, decision-making and sentiment analysis tools. The application fields where Statistica has specific solutions are multiple: cross-industry, energy oil and gas, financial, healthcare, insurance, manufacturing, pharmaceutical. In the healthcare field, Statistica offers a variety of graphical modules that enable analytics for several tasks like: patient/customers profiling, prediction of hospital readmissions, cost estimation, risks management.
2.3. Oracle Advanced Analytics
Oracle Advanced Analytics is an analytics platform based on Oracle Database that includes two tools: Oracle R Enterprise and Oracle Data Mining. The specificity of the Oracle Analytics System is that it is provided by a company whose core business is database. This is reflected in the product Oracle Advanced Analytics in providing data analysis directly on data that are stored in Oracle Database: customers can run the algorithms directly where the data are located, in the database (no slow input-output operations). As mentioned, Oracle offers two types of systems: Oracle R Enterprise that allows users to use their R-language skills and tools to analyze their data, and Oracle Data Mining that allows users to create data mining functions using SQL language.
2.4. FICO
FICO provides predictive analytics with the peculiarity of being combined with prescriptive analytics and business rules management. It offers specialized solutions oriented to market, such as functions for customers engagement, or oriented to the bank scoring, as mortgage calculation or risk functions. FICO has an entire section dedicated to analytics on the cloud, providing these technologies to be suitable also for smaller businesses without having to keep local analytics server.
2.5. KXEN
KXEN in 2013 was acquired by SAP. KXEN originally offered solutions primarily geared to risk minimization including heavy duty products, mainly suitable for large organizations.
2.6. Salford Systems
Salford offers the SPM (Software Predictive Modeler) suite for analytics and data mining. It includes some of the most popular machine learning algorithms, such as Leo Breiman CART—Classification And Regression Trees (Salford offers a patented extended version); Random Forests; MARS—multivariate Adaptive Regression Splines; TreeNet (Stochastic Gradient Boosting). Salford also offers custom demonstrations called Rapid Response Data Mining to evaluate the potential benefits that a company could obtain from its adoption and the ROI (Return Of Investment).
2.7. TIBCO Spotfire
TIBCO Spotfire provides analytics capabilities focused on the management of events (Complex Event Processing) and data visualization. The product is offered in three variants: Desktop (for single local users), Cloud (SaaS) and Platform (business oriented scalable solution), all including visual tools and advanced analytics. In addition, TIBCO offers specific vertical solutions for the energy field, finance, manufacturing, customer management and telecommunications.
2.8. SAP Predictive Analytics
SAP is perhaps one of the most famous management software for business, providing both general purpose and special purpose tools in various fields. SAP Predictive Analytics has the advantage that many companies, already relying on SAP systems, may integrate SAP predictive analytics without having to refer to another software company, thus obtaining a full integrated macro-solution.
The SAP product provides predictive analytics automation, Big Data analysis, model management, predicting score and more. An interesting feature is that this product offers a tight integration with R language to give the user the chance of using a large number of available algorithms and reusing custom R scripts.
2.9. SAS
SAS (Statistical Analytics System) [
9] is a big company that started its activities by offering analytical services for agriculture; today SAS offers services in all application areas, from the academic field, to the life science field, from medical to management-aid. SAS offers a vast set of solutions whose names recall the area of application, such as: SAS Curriculum Pathways, SAS Data Management, SAS Visual Analytics, etc.
Starting from SAS 9.4, the solution is deployable also onto the cloud. To be used with its full power, the system is mainly directed to expert users. The fields of application are several, mainly related to business intelligence and bank trading. We also found examples of applications in healthcare ([
10,
11]) and Big Data ([
12]).
2.10. IBM Watson Analytics
IBM Watson Analytics [
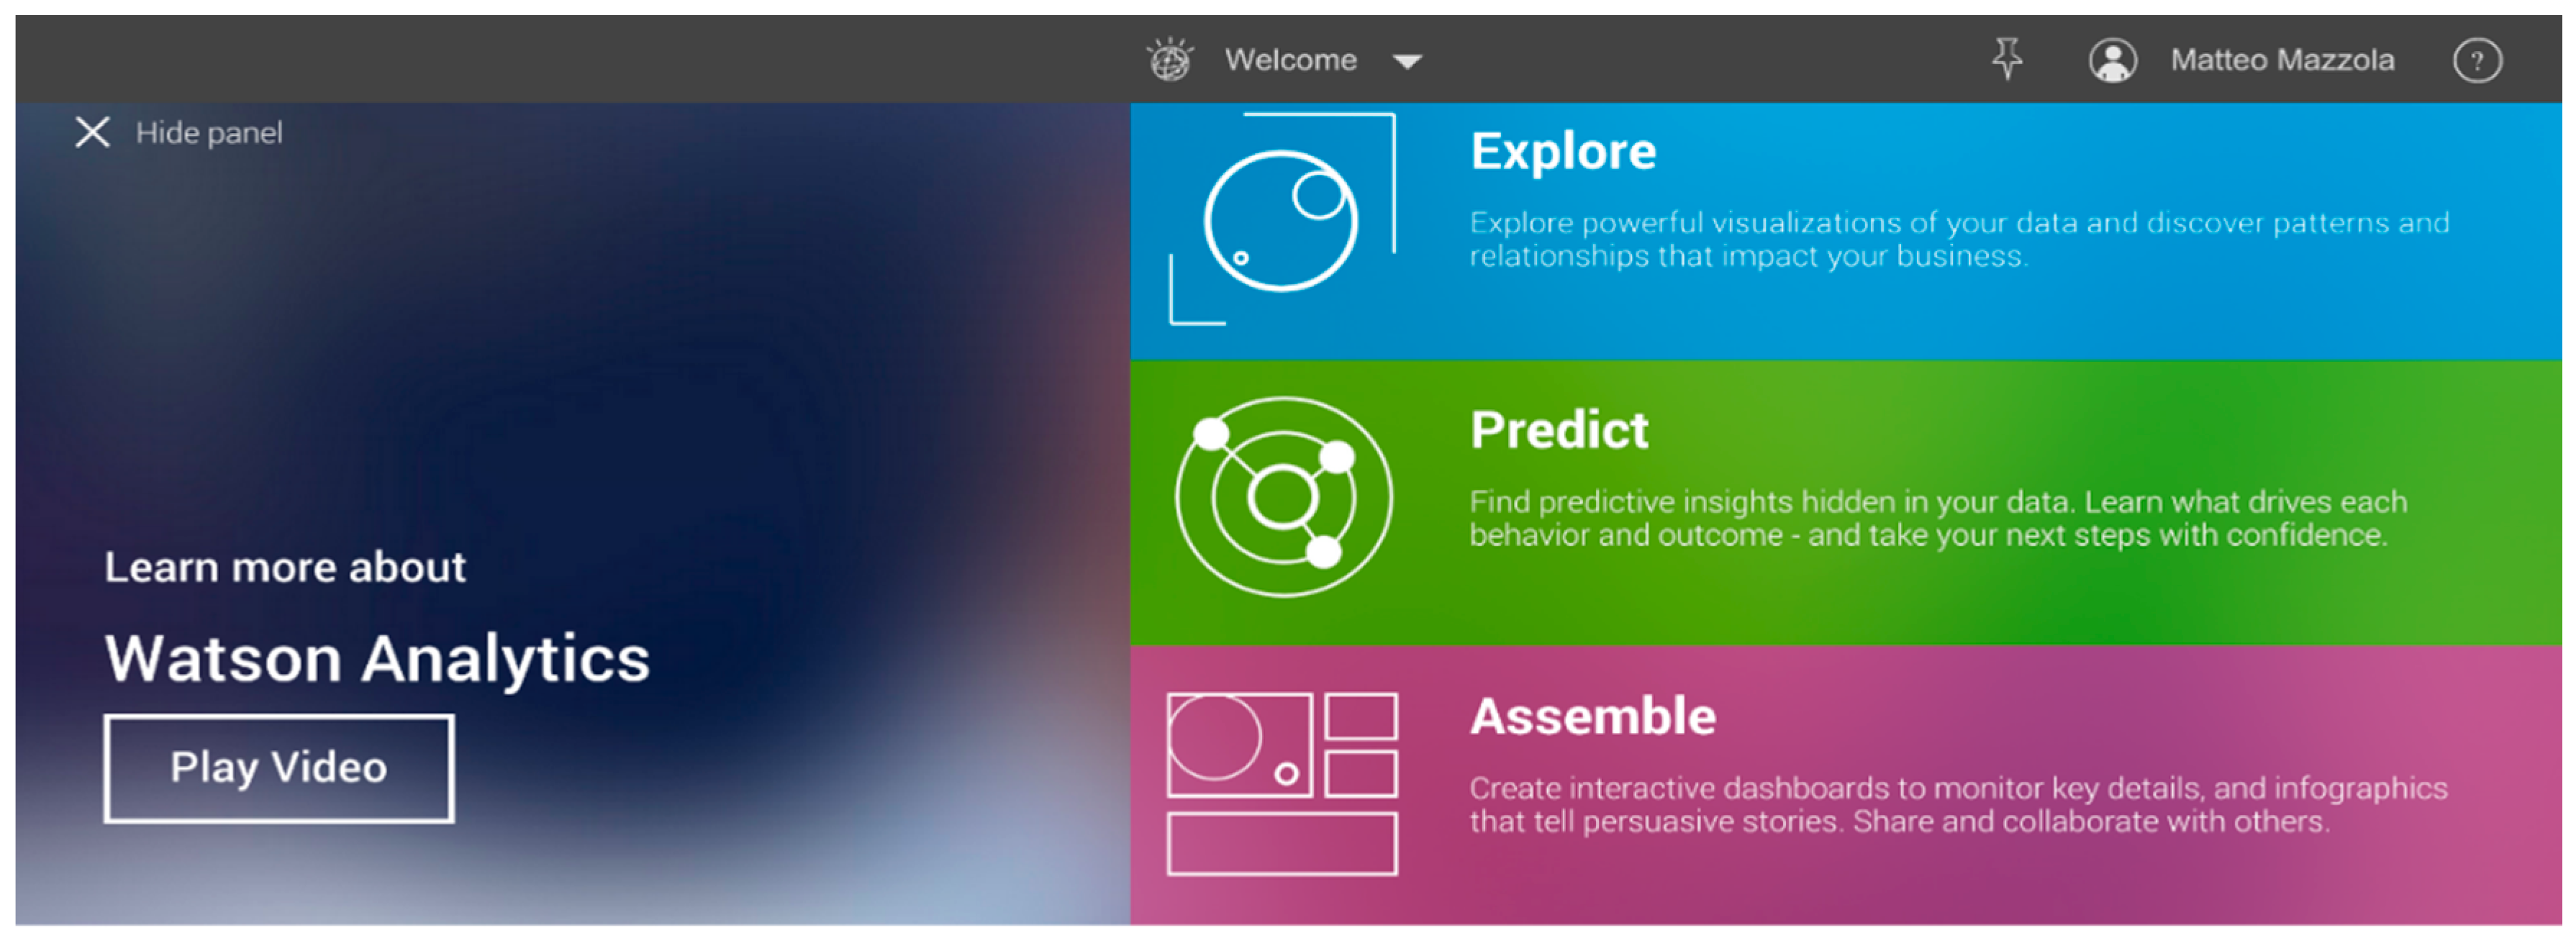
13] is a cloud based system that allows the final user to run complex analytics using a simple interface, using nothing but a web browser (no specific clients or plug-ins to be installed on local machines). The goal is allowing users, experts who may be familiar with data analytics techniques or not, to focus only on their experiment or case study.
Once the database is uploaded on the cloud, the system offers three categories of functions: Explore, Predict and Assemble (
Figure 1). The “Explore” mode provides data clustering to detect patterns and intrinsic relationships between data (non-supervised training techniques). The “Predict” mode allows the user to perform predictions on the data, disclosing the predictive strength of the most significant parameters, compared to a single target parameter set up by the user. “Assemble” mode is dedicated to efficiently show data using infographics.
The fields of application of such general purpose systems are very large; there is a Watson Analytics Community where users can share use cases as samples of application in various areas [
14].
For example, the system is used by a human resource manager to identify the parameters that affect the workers resignations [
15]. One more example is the analysis of product sales near particular events, such as fireworks near July 4th in US [
16]. Other use cases include banking, insurance, retail, telecommunications, government, nonprofit, education, marketing, sales, information technology, finance and more.
One of the strengths of Watson Analytics, is the automation of many steps of the analysis, allowing also non expert users to start using it. Main automation functionalities can be summarized as:
- -
Automatic Data Preparation
- -
Automatic Modeling
Auto selection of best models and detection of strongest relationships: Decision Tree (CHAID) and Key Driver
Auto selection of best predictive statistical method basing on data type: Watson Analytics automatically chooses the best regression model for the user data between linear, logistic, multivariate etc.
In addition, Watson Analytics includes an engine for text cognitive analysis (IBM is the world leader); the user can submit a question typed in natural language to extract information from data.
3. Use Case: Watson Analytics as AaaS to Identify HF Patients Analyzing Only the ECG Signal
3.1. Purpose of the Use Case
The goal of this use case is to report the experience of using a well-known AaaS system, IBM Watson Analytics, for medical information technology research purposes. The chosen task is: identifying the presence of Heart Failure (HF) by the simple analysis of the electrocardiographic signal (ECG). The research trends for analysis and decision support systems in HF are typically performed using two different approaches. One seeks to obtain predictive models that are as exhaustive as possible by including in the analysis a big amount of parameters of different nature (blood tests, biometrical values, etiology, comorbidities etc.) [
17,
18,
19]. The other approach, through the application of tele-care systems, tries to obtain predictive models by restricting the inputs to easily measurable parameters detectable in tele-monitoring environments [
20,
21,
22].
This study belongs to the second line of research and has the purpose of determining whether the analysis of the Heart Rate Variability (HRV) on an ECG signal is enough to determine the presence or absence of HF, and if the result with a signal acquired for 24 h (Long Term) is comparable to an acquisition of five minutes (Short Term). The HRV technique will be described later in the article.
The Prediction Strength (PS) obtained using cloud Watson Analytics system will be evaluated as well. The obtained results will be assessed in comparison with the existing literature, where the same goal is pursued by analyzing similar signals with different modalities (analytics using machine learning, non-cloud techniques) [
23,
24].
3.2. Medical and ECG-Analysis Background
3.2.1. Heart Failure
The Heart Failure is an alteration of the structure and function of the heart that involves the body's inability to provide the proper amount of blood to the organism. The body’s reaction to HF causes sodium and water accumulation in the lungs and tissues causing fatigue, difficulty to perform physical efforts, shortness of breath and pulmonary edema. As time goes, patient's condition can worsen increasing the severity of lung edema and causing death. Clinical course of the disease leads the patient through a chronic stage that is quite stable but often alternated with worsening requiring hospitalization. In some cases, these severe episodes could be avoided with a preventive therapy. Obtaining additional information on this disease and its evolution would be greatly important for the health of patients. The overall prevalence of HF is slowly increasing due to the aging of the population and the success in the survival of patients suffering from a heart attack [
25].
The literature shows improved outcomes for HF patients supported by tele-monitoring systems [
26,
27]; hence, a non-invasive system of investigation on HF presence based on analysis of ECG recordings (possibly Short-Term), may be useful to timely administer a specific therapy and to prevent worsening.
3.2.2. Heart Failure Diagnosis Methods
The “ESC (European Society of Cardiology) Guidelines for the diagnosis and treatment of acute and chronic heart failure” [
25] make explicit that the diagnosis of HF is a complicated process because symptoms are often similar to those of other diseases. In addition, symptoms specifically related to HF (i.e., orthopnoea and paroxysmal nocturnal dyspnoea) are less common. Monitoring of symptoms and signs may be useful to evaluate the effectiveness of the therapy, but for HF diagnosis physicians need to get objective evidence of a structural or functional cardiac abnormality by instrumental examination.
The ESC Guidelines clearly state which tests are required for a comprehensive diagnosis:
- -
Echocardiogram: it provides immediate information about the volumes of the atrial and ventricular chambers, and in particular about the ejection fraction.
- -
Electrocardiogram: it provides information about the rhythm of the heartbeat and possible faults in the electrical signal transmission (atrioventricular block etc.).
- -
Natriuretic Peptides: they are another important marker of HF. The examination consists in the analysis of blood concentration of the BNP (B-type Natriuretic Peptide) or NT-proBNP (N-terminal pro-B type), hormones secreted in abnormal amounts when the heart is diseased or the load on any chamber is increased.
- -
Chest X-ray: this examination is often more useful to identify lung diseases that cause symptoms similar to HF. However, this examination may show pulmonary venous congestion or edema in a patient with HF.
- -
Other laboratory tests: the guidelines indicate a multitude of laboratory parameters that may be related to HF, including biochemical (sodium, potassium, creatinine) and hematological tests (hemoglobin, hematocrit, ferritin, Leucocytes, and platelets). Also thyroid hormone is important because it can have an impact on HF.
ESC Guidelines also report a complex graph showing the algorithm that manages HF diagnostic decisions (a sequence of given tests related to the symptoms).
In this complex scenario, some of the mentioned useful parameters for HF diagnosis are not appropriate for a home telemonitoring context. One of the aims of this study is to establish in which cases the sole ECG-HRV analysis could be appropriate to perform a preliminary and early diagnosis of HF.
3.2.3. ECG Signal Analysis through HRV
The electrocardiogram (ECG) is the graphic reproduction of the heart activity during its cycle of operation, recorded via sensors (electrodes) placed on the skin. Specifically, the cardiac activity can be estimated by measuring the voltage differences in some defined point of the body. For decades the electrocardiogram has been the easiest, practical, less invasive and less expensive method to observe the electrical activity of the heart. The ECG outcome has a characteristic shape, whose variations can indicate problems. It contains several sections called waves, positive and negative, which are repeated for each cardiac cycle:
- -
P wave: the first wave of the cycle, which corresponds to ventricular depolarization of the atria; the contraction is quite weak and the wave is small.
- -
QRS complex: set of three waves in rapid succession corresponding to the depolarization of the ventricles: the Q wave is negative and small, the R is a high positive peak, while S is again a small negative wave.
- -
T Wave: it refers to the ventricle repolarization.
- -
U Wave: due to the repolarization of the papillary muscles, which is also not always identifiable
- -
ST Section: period during which the ventricular cells are depolarized, therefore isoelectric, so electrical changes are not greater than 1 mm on the graph.
- -
QT interval: interval in which occurs ventricular depolarization and repolarization; its duration varies with the heart rate, but generally remains between 350 and 440 ms.
Heart Rate Variability (HRV) nomenclature refers to the physiological phenomenon of time length variation between two heart beats; once defined the peak wave in the cardiac cycle as “R”, we can also refer to HRV as “RR variation” or “RR interval”, meaning the time frame between two R waves. HRV can be performed using two ways:
- -
Long-term analysis: performed on a ECG signal acquired for 24 h in a row, using a device called Cardiac Holter
- -
Short-term analysis: performed on a ECG signal acquired for just 5 min or less
HRV analysis can be carried on in both time and frequency domain. The values obtained from the ECG signal performing the time domain analysis are summarized in [
28], and are:
SDANN: Standard deviation of the averages of NN intervals in all 5-min segments of a 24-h recording
AVNN: Average of all NN intervals
pNN50: Percentage of differences between adjacent NN intervals that are greater than 50 ms; a member of the larger pNNx family
SDNNIDX: Mean of the standard deviations of NN intervals in all 5-min segments of a 24-h recording
rMSSD: Square root of the mean of the squares of differences between adjacent NN intervals
SDNN: Standard deviation of all NN intervals
In the frequency domain parameters from the ECG signal are:
LF/HF: Ratio of low to high frequency power
TOTPWR: Total spectral power of all NN intervals up to 0.04 Hz
LF: Total spectral power of all NN intervals between 0.04 and 0.15 Hz.
ULF: Total spectral power of all NN intervals up to 0.003 Hz
HF: Total spectral power of all NN intervals between 0.15 and 0.4 Hz
VLF: Total spectral power of all NN intervals between 0.003 and 0.04 Hz
3.3. Material and Methods
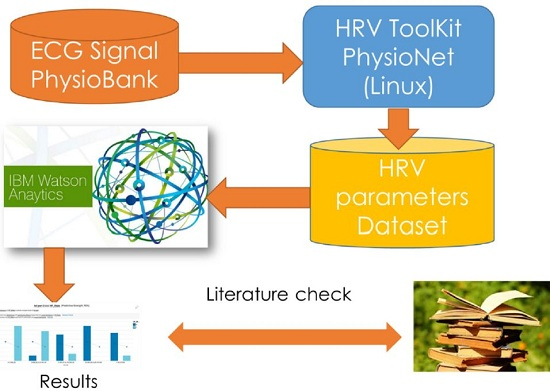
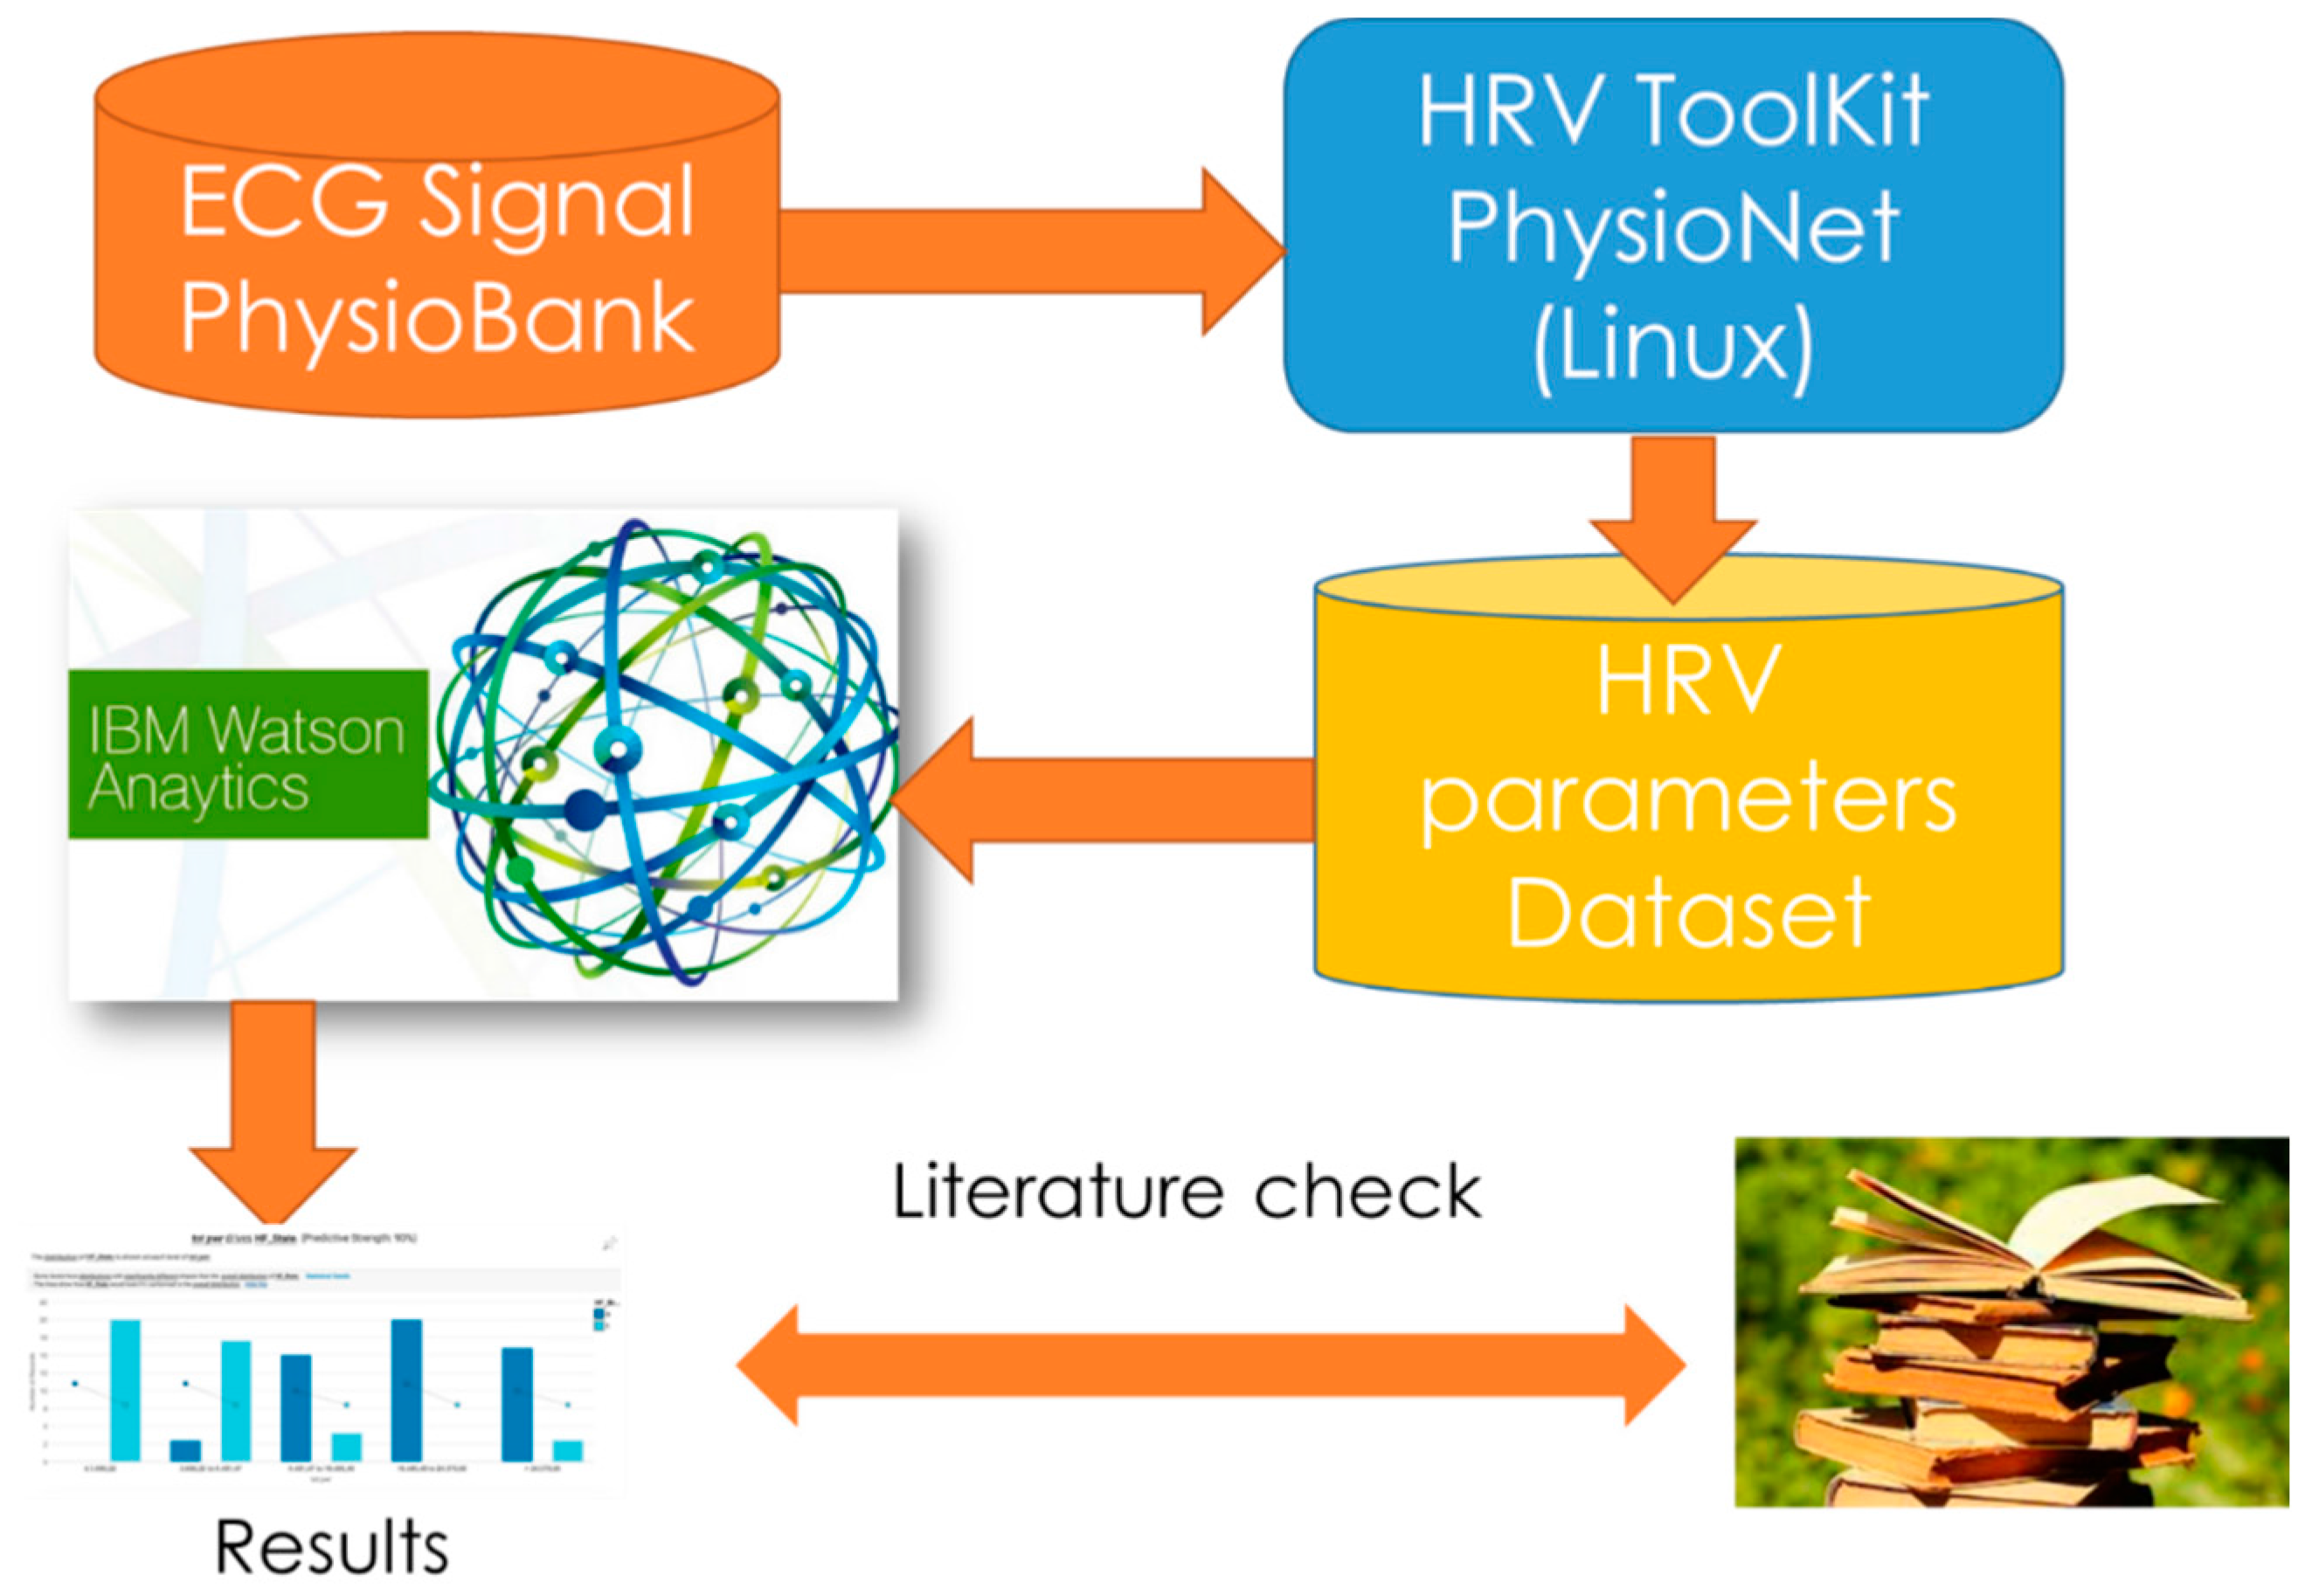
The diagram in
Figure 2 shows the workflow of the study that has been carried out.
3.3.1. Dataset ECG Signals
The ECG signals on which the analysis has been performed were obtained from the PhysioBank PhysioNet public database [
28]. The data used for the test were extracted from three separate datasets found in PhysioBank database:
CHFDB: Congestive Heart Failure Database contains 15 subjects including 11 men, (age range: 22–71), and 4 women (age range 54–63), with high severity of heart failure disease.
CHF2DB: contains 29 subjects aged between 34 and 79 years with medium severity of heart failure; the subjects include 8 men and 2 women; the sex of the remaining 19 patients is not known.
NSR2DB: the Normal Sinus Rhythm Database contains 54 healthy subjects including 30 men (age range: 28–76), and 24 women (age range 58–73).
Table 1 summarizes the overall dataset analyzed.
3.3.2. Extraction of HRV Parameters
For the extraction of HRV parameters we used the tool set provided by PhysioNet called HRV Toolkit, used on Ubuntu Linux.
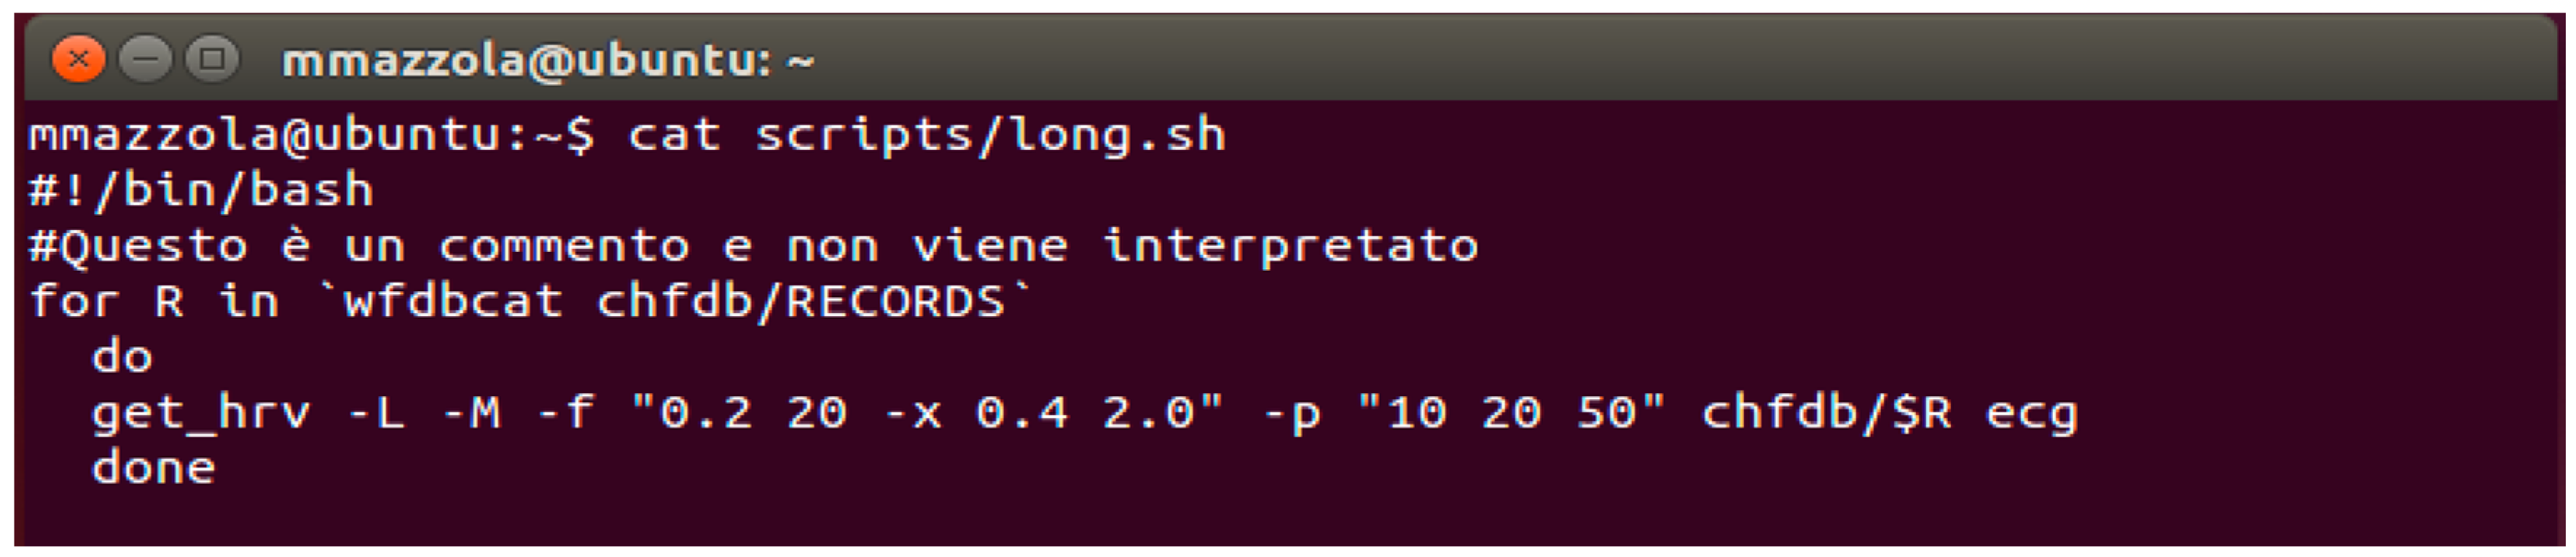
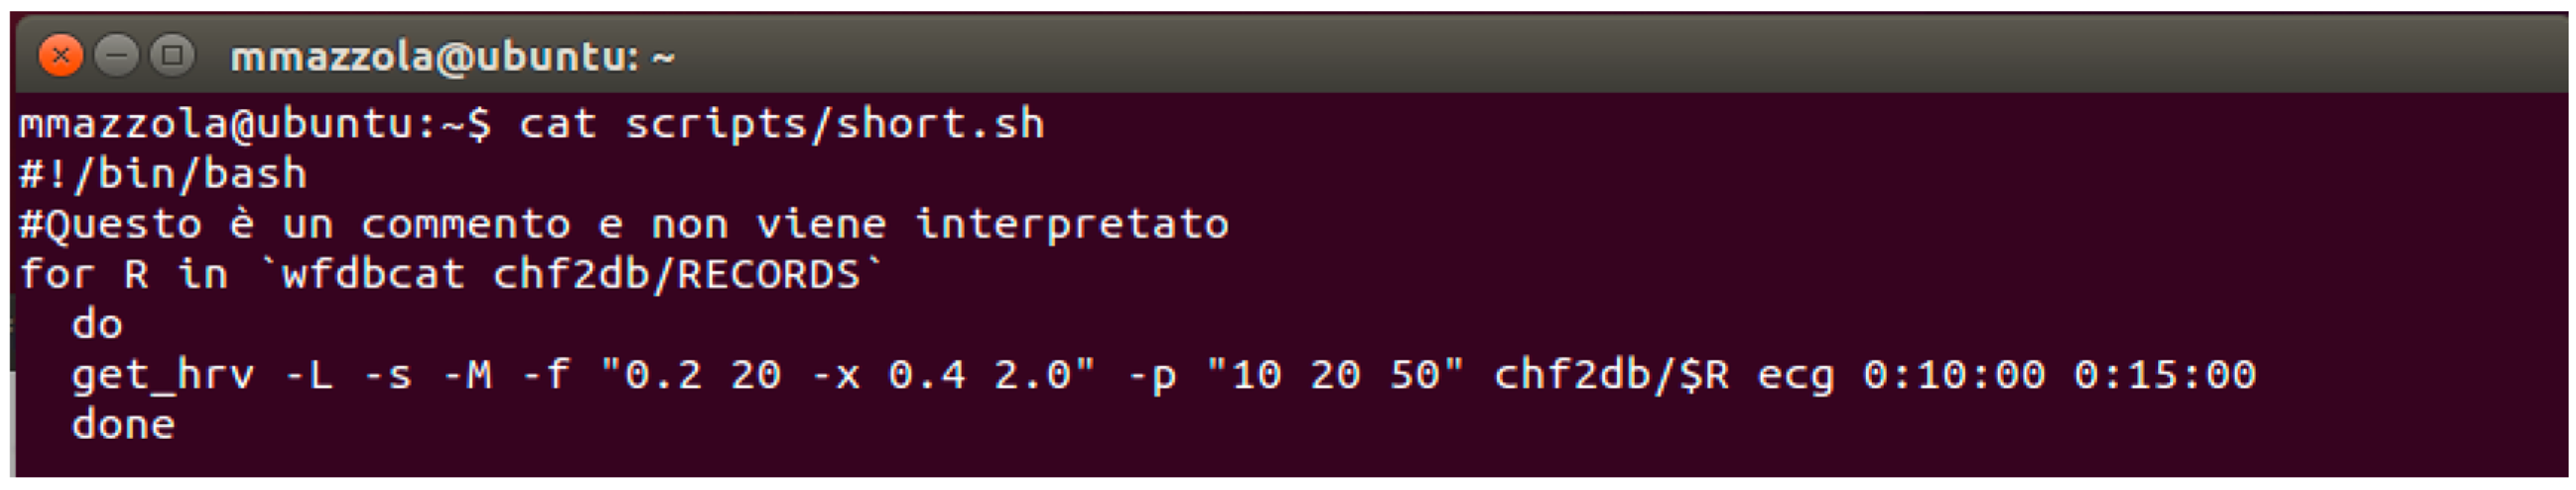
In order to make repeatable tasks, we report some details on the data extraction, that has been performed creating two scripts, which recall separately the short-term and long-term analysis, both set by literature instructions: 5 min time frame for the short-term analysis and the entire recording duration, 24 h, for the long-term. In both cases, the outliers are filtered and the results are expressed in milliseconds. The scripts are shown in
Figure 3 and
Figure 4. Note that, for the short-term analysis, only the 5 min of recording ranging from tenth to fifteenth minute of acquisition are selected, in order to remove the possible noise due to the first seconds/minutes of recording.
3.3.3. Database Setup for Watson Analytics Analysis.
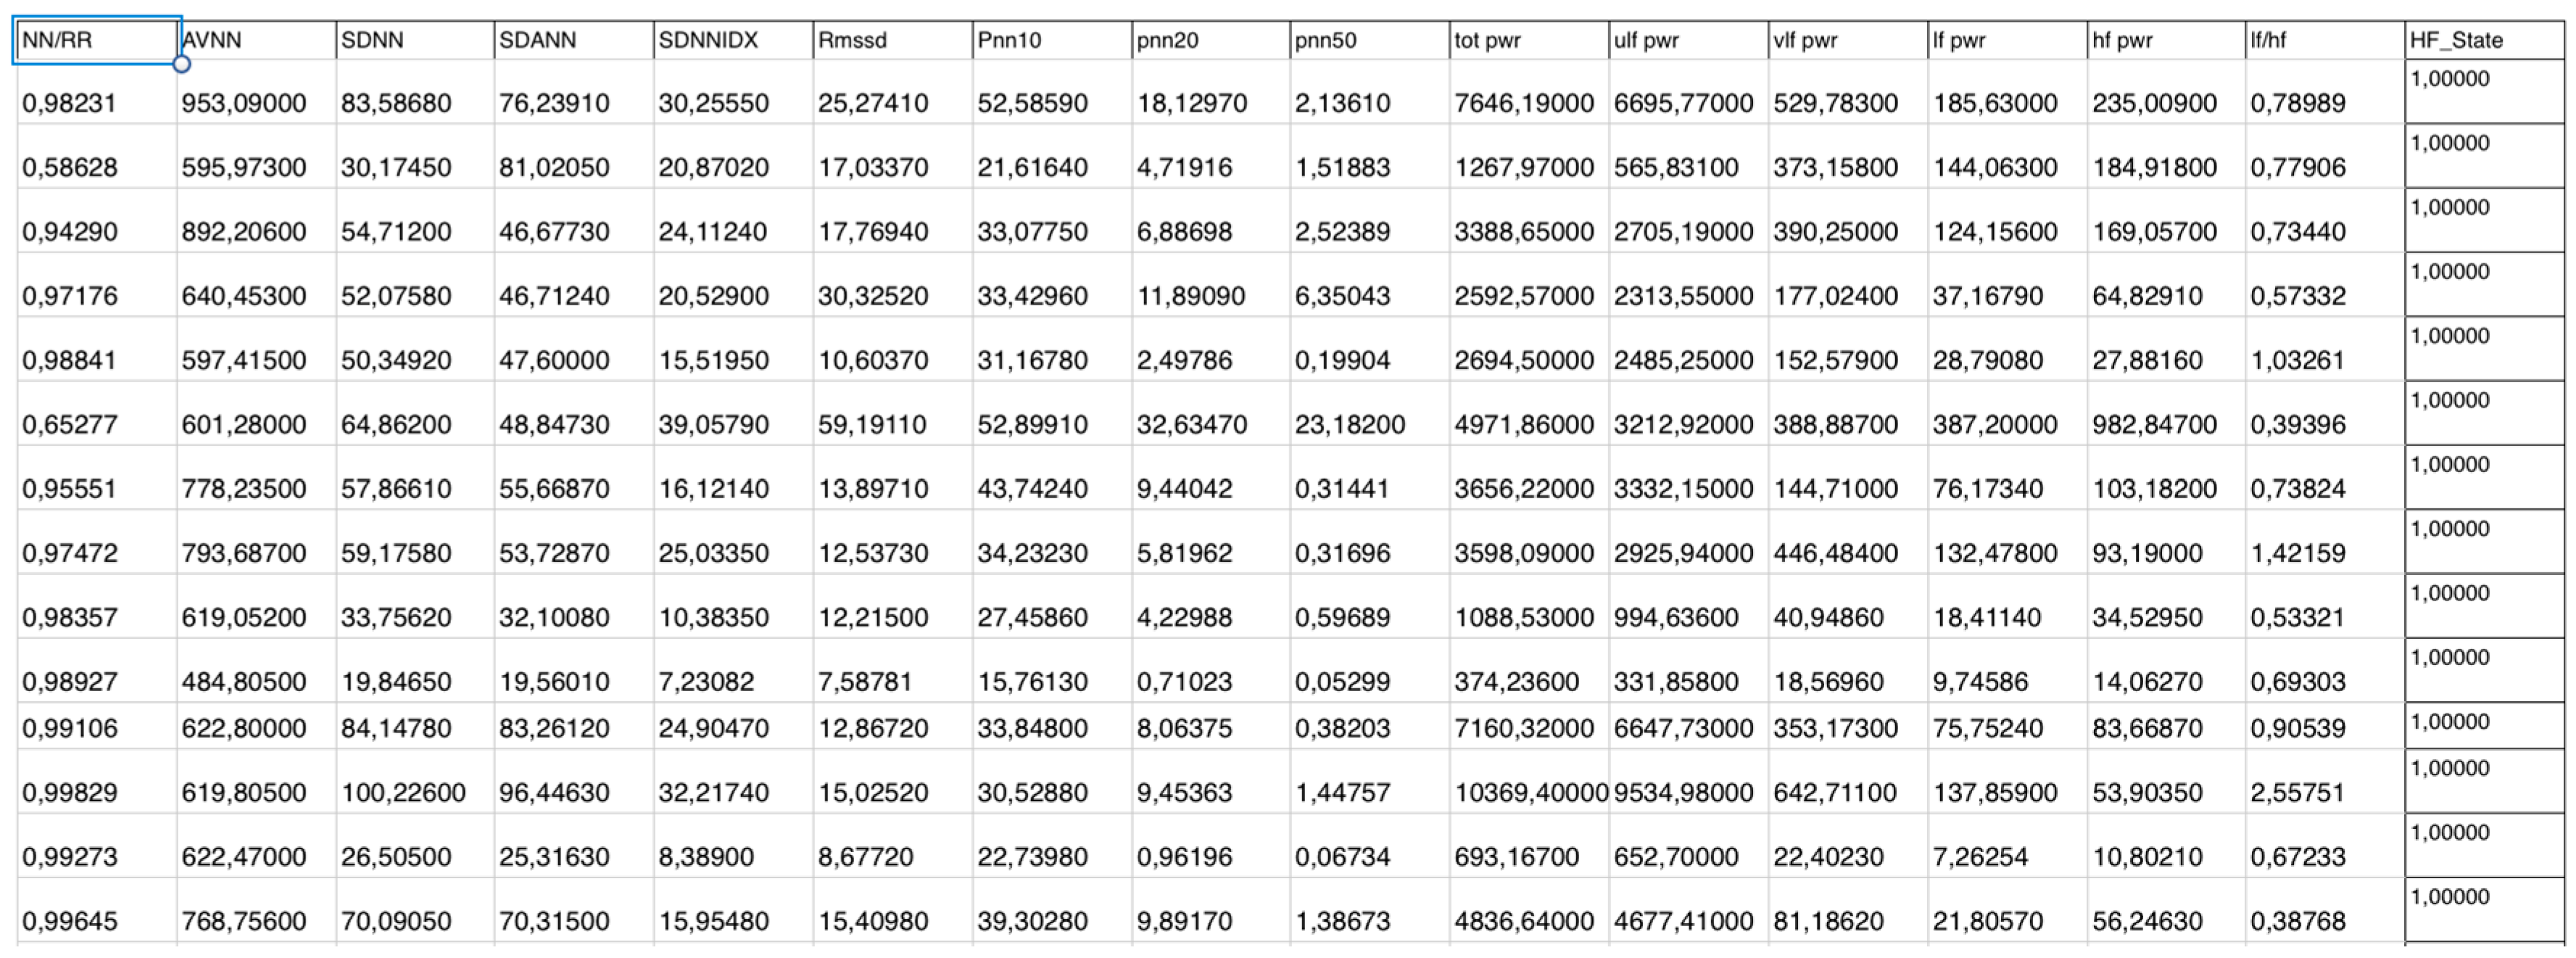
Watson Analytics (WA) is a cloud system based on regressive techniques and supervised training. The analysis dataset has been structured in a format suitable to be analyzed, as shown in
Figure 5.
Each data column corresponds to an HRV parameter while each row is assigned to a different patient. Note that the last column at the right, “HF_State”, represents the target prediction, which is the presence (1) or absence (0) of HF in the corresponding patient.
3.3.4. Data Analysis with Watson Analytics
When HRV features dataset is ready, you can start the analysis with WA. Until now the actions are performed locally; from this point on, the dataset is ready to be uploaded to the cloud and analytics operations will be performed as AaaS. Watson Analytics accepts the most common matrix formats, such as .CSV, .XSL, .XSLX. After loading the dataset, the system assigns an index value of data quality, by considering the completeness of the fields, possible presence of constant values, low number of records compared to the columns and other qualitative factors.
Now it is possible to process the dataset using the modalities offered by WA: “Assemble”, “Explore”, and “Predict” (see
Section 2.10 above).
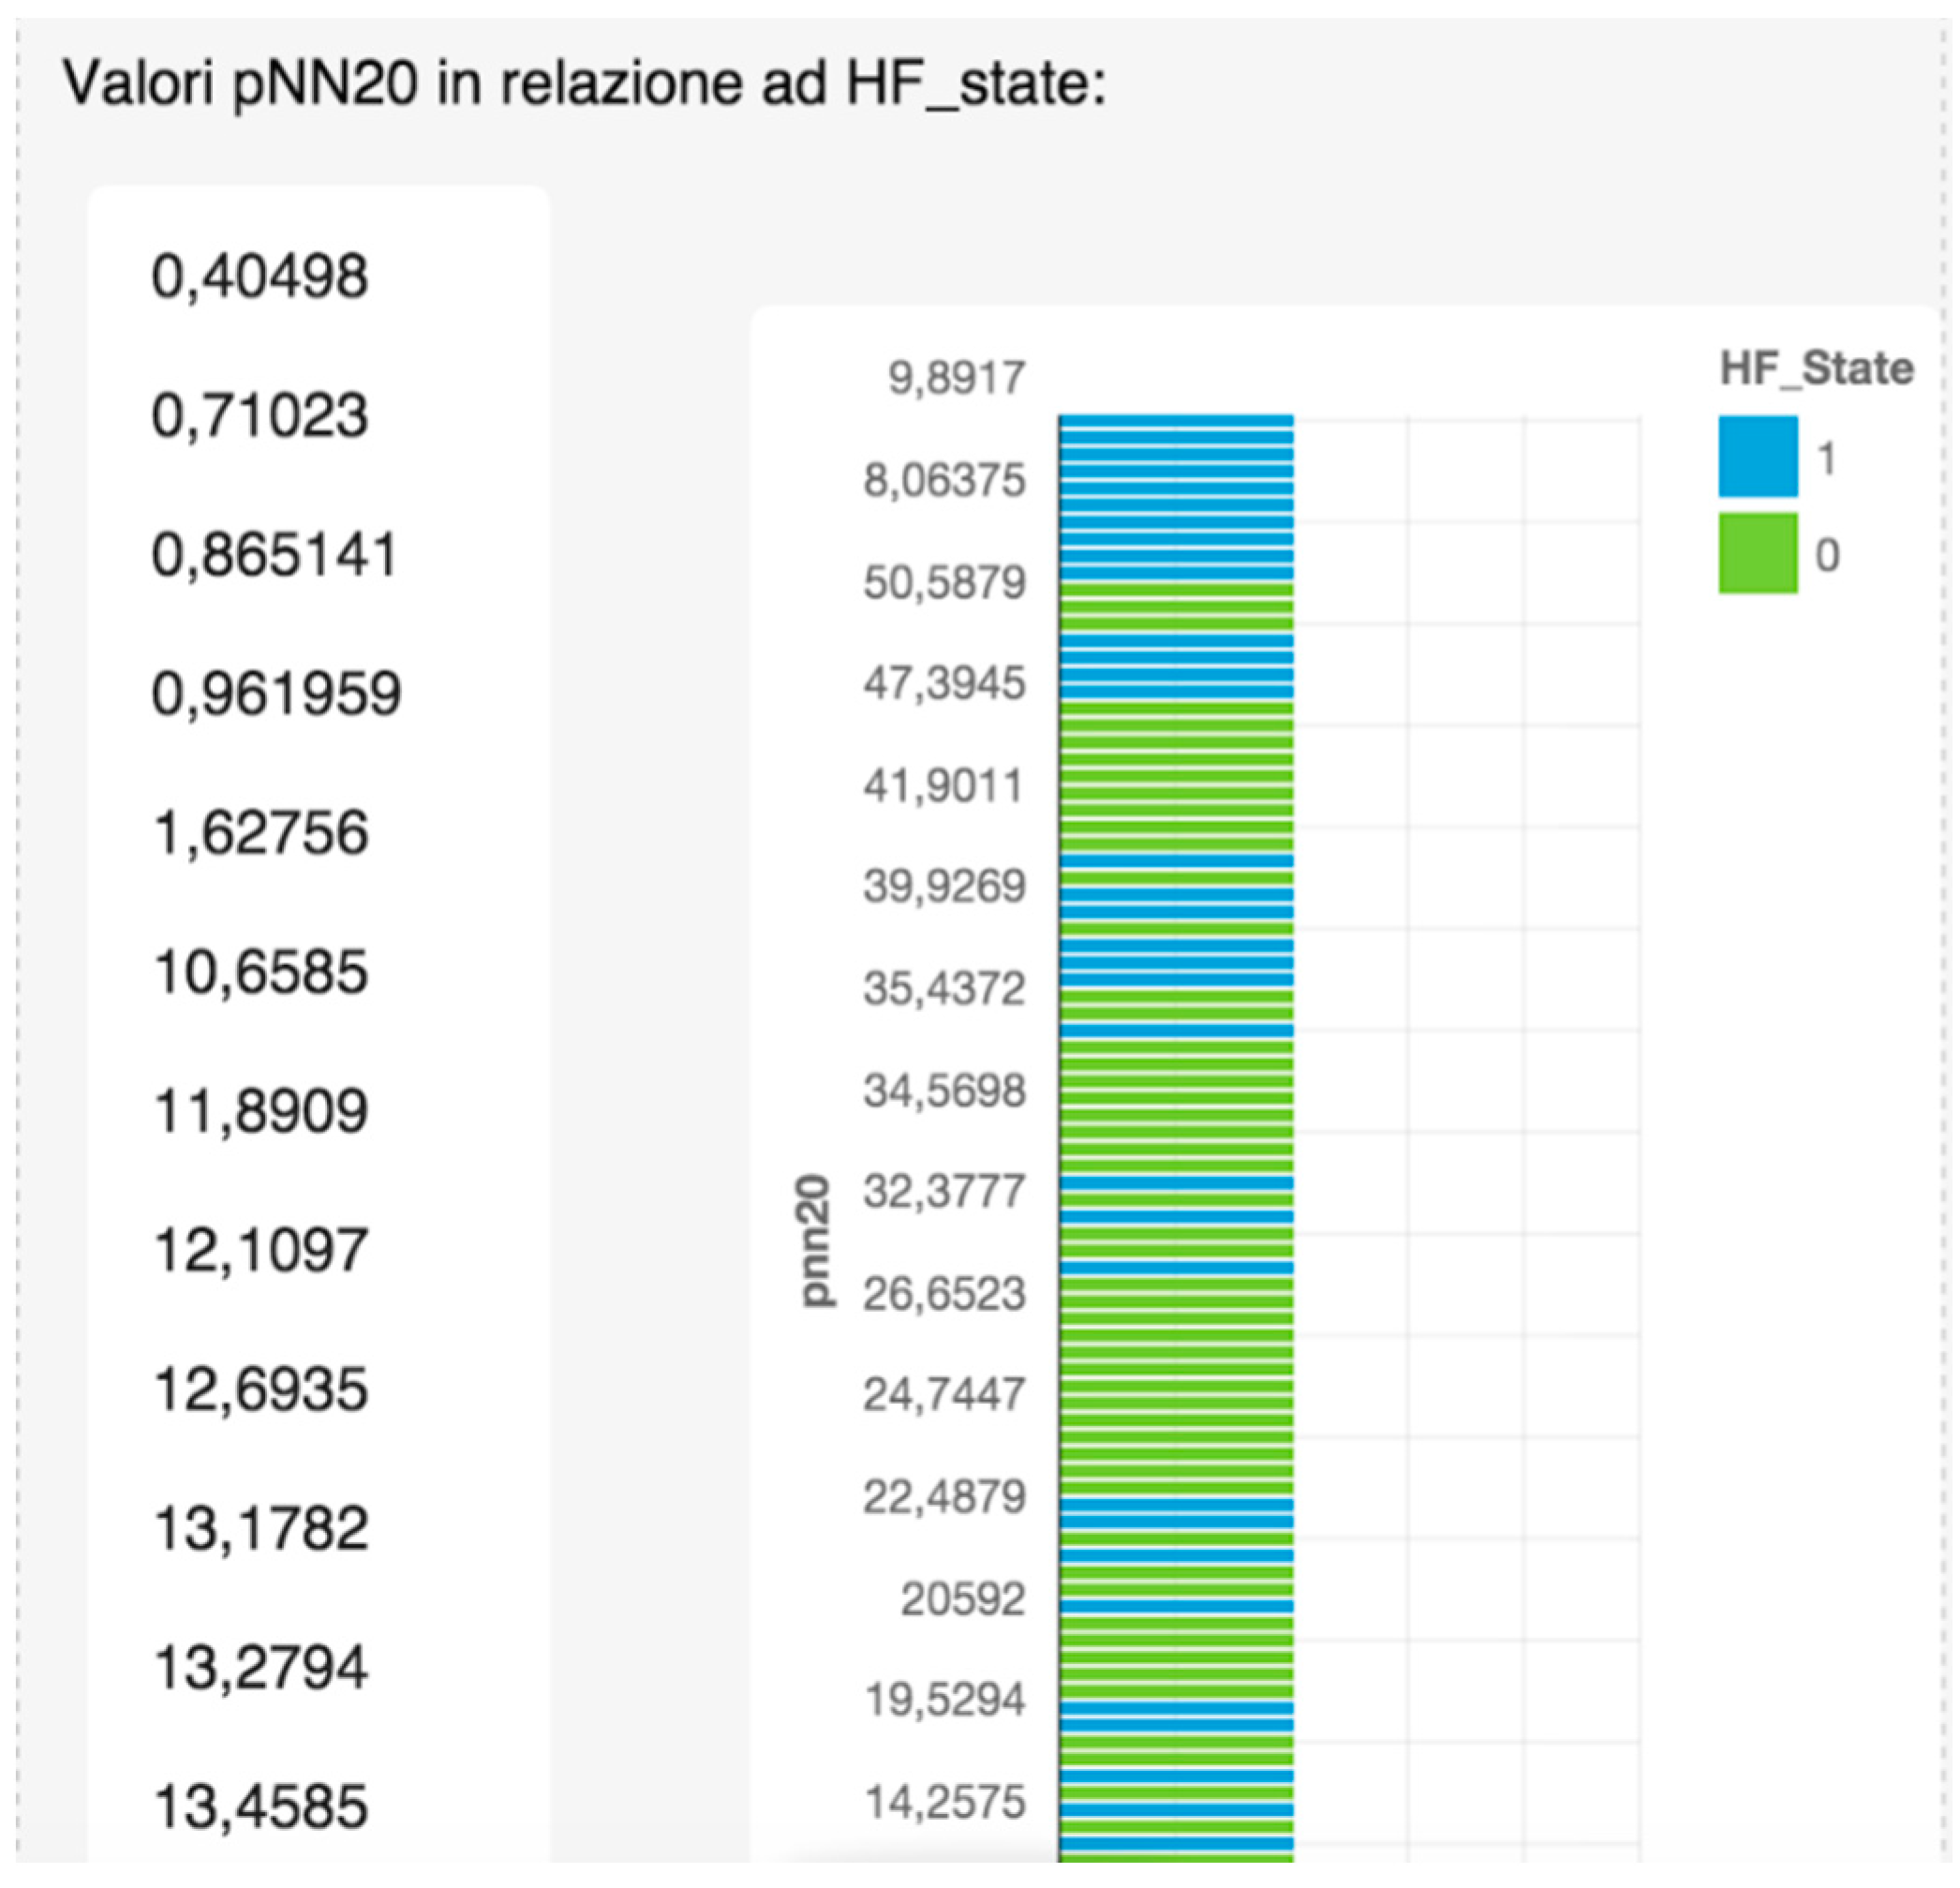
In
Figure 6 is shown an example of use of the Assemble feature, where the distribution of Target value (HF_State) is compared to an HRV parameter (pNN20).
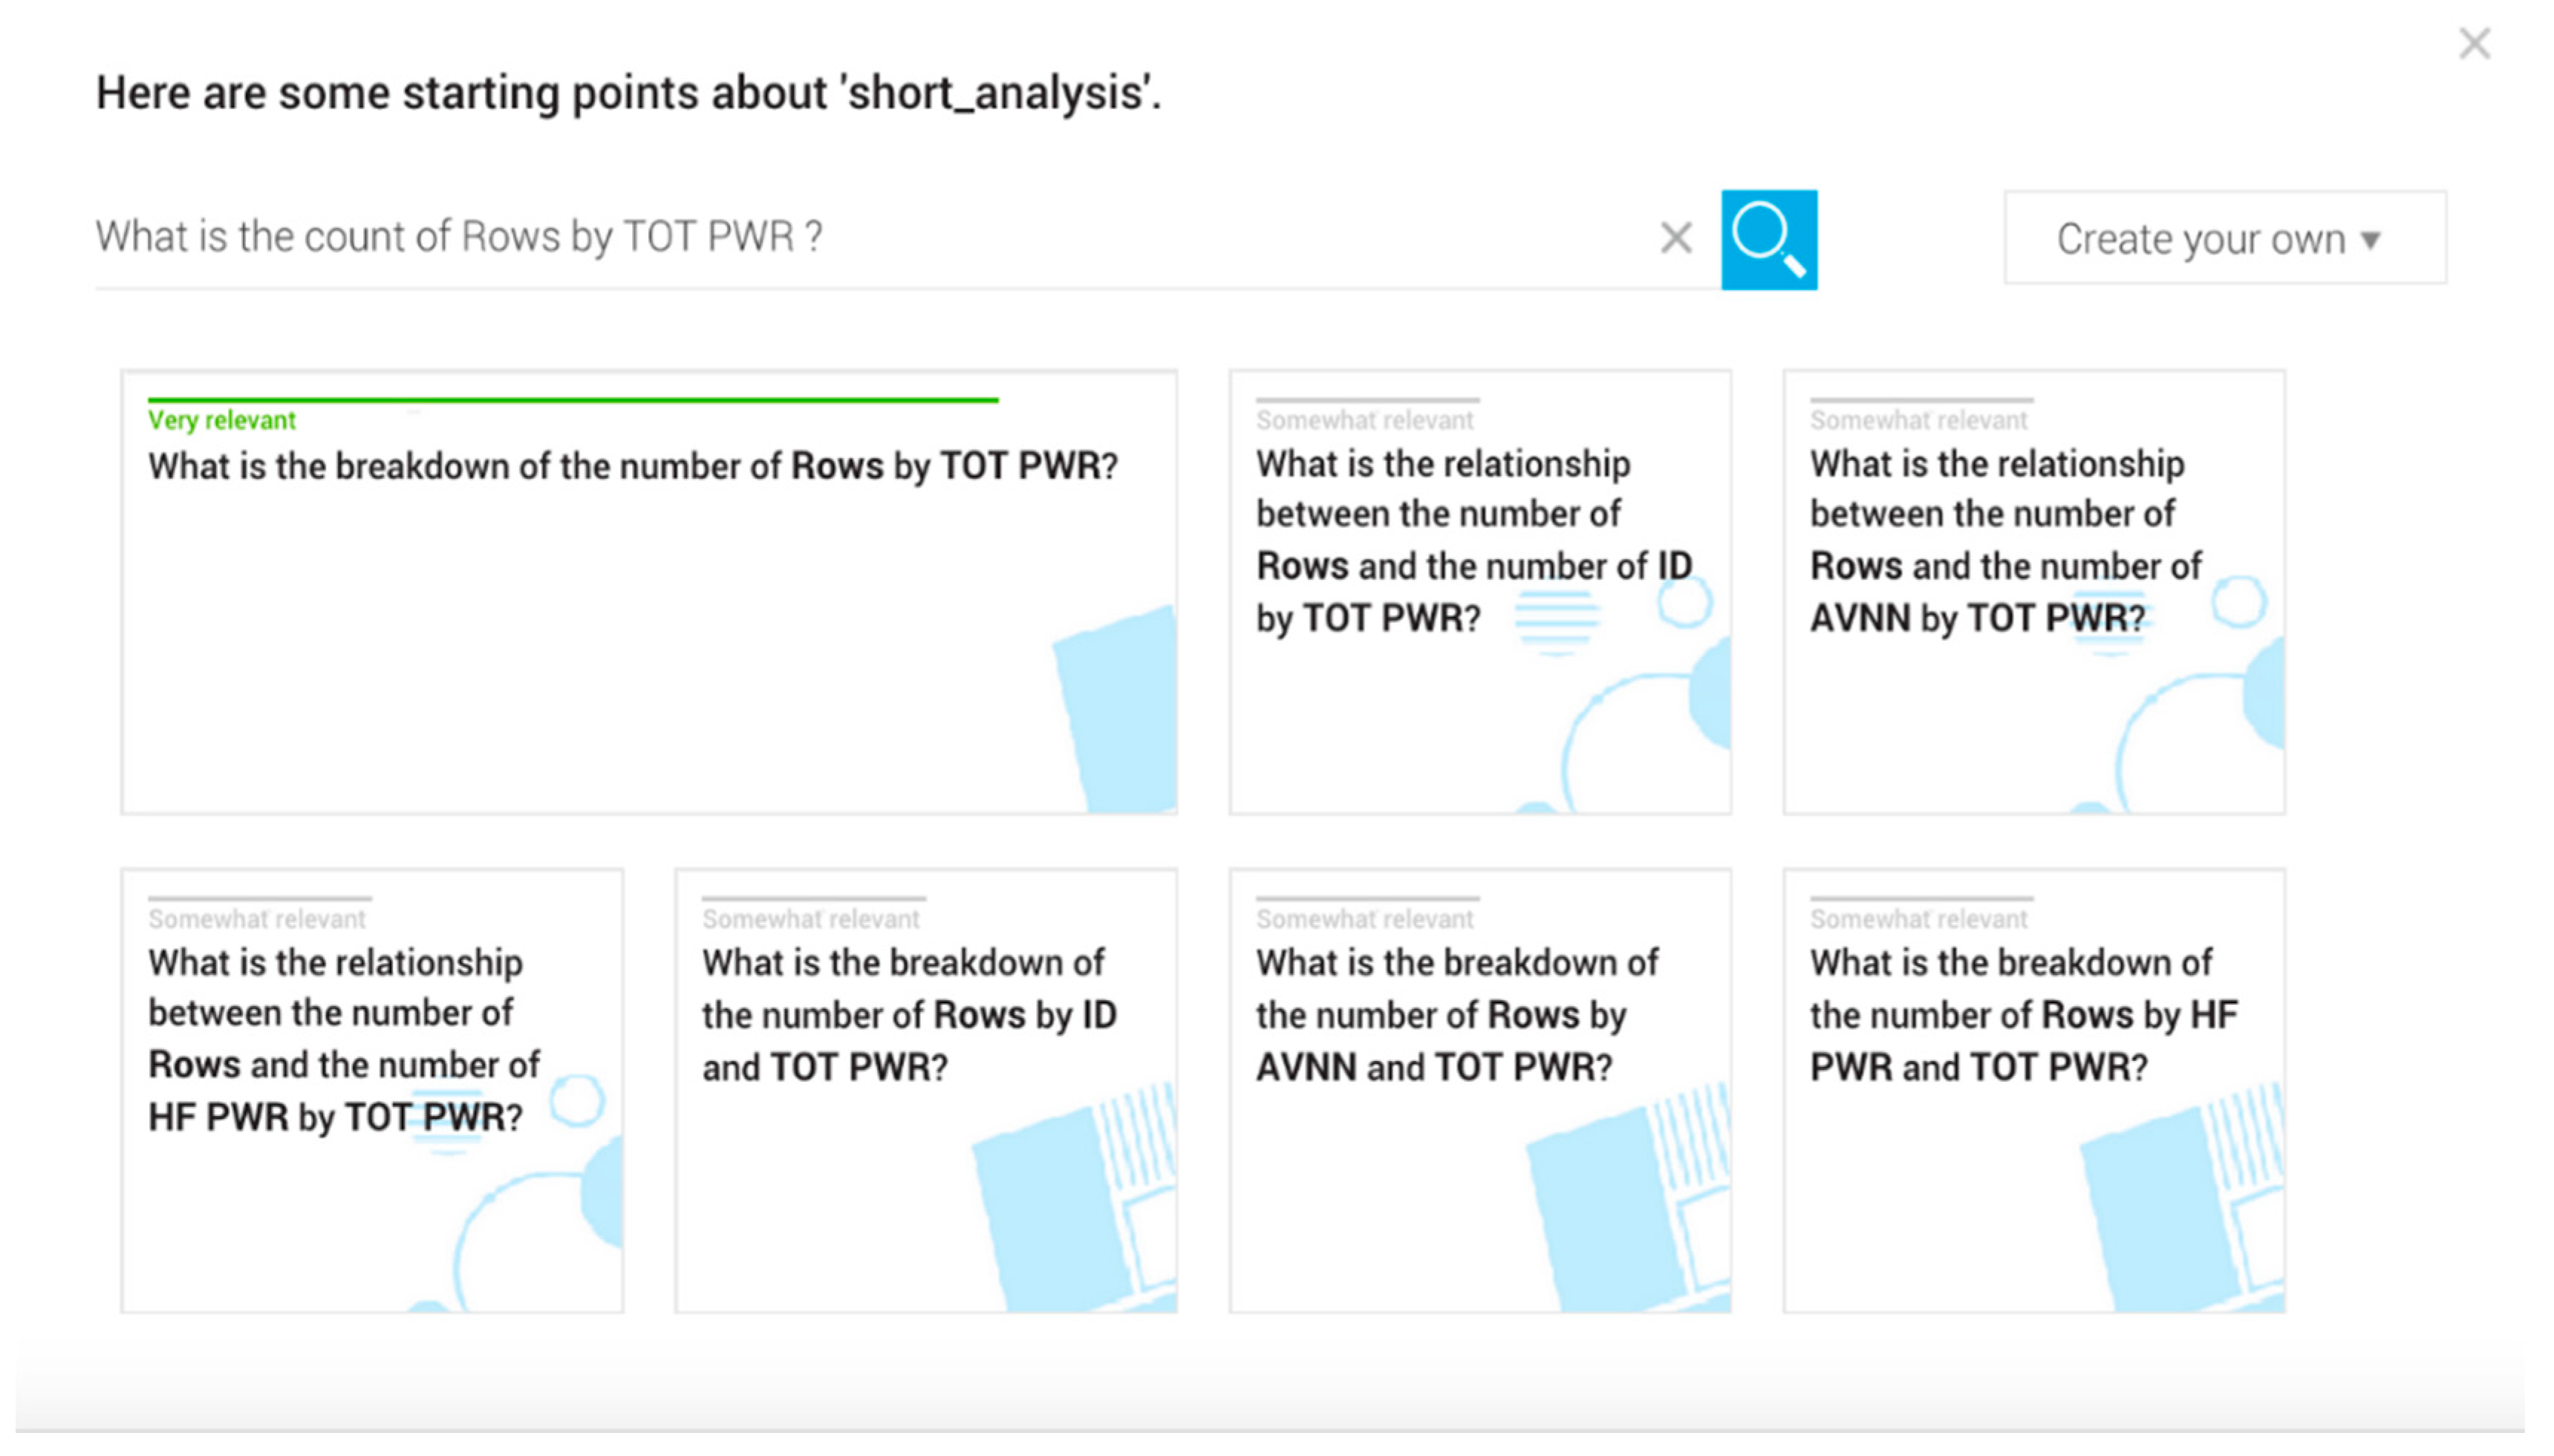
We can consider the Explore mode as a facilitator for the Predict mode. As seen in
Figure 7, the Explore mode proposes some questions to the user in natural language. These questions are generated by relationships that WA automatically extracted from the dataset parameters (without setting any parameters as a target).
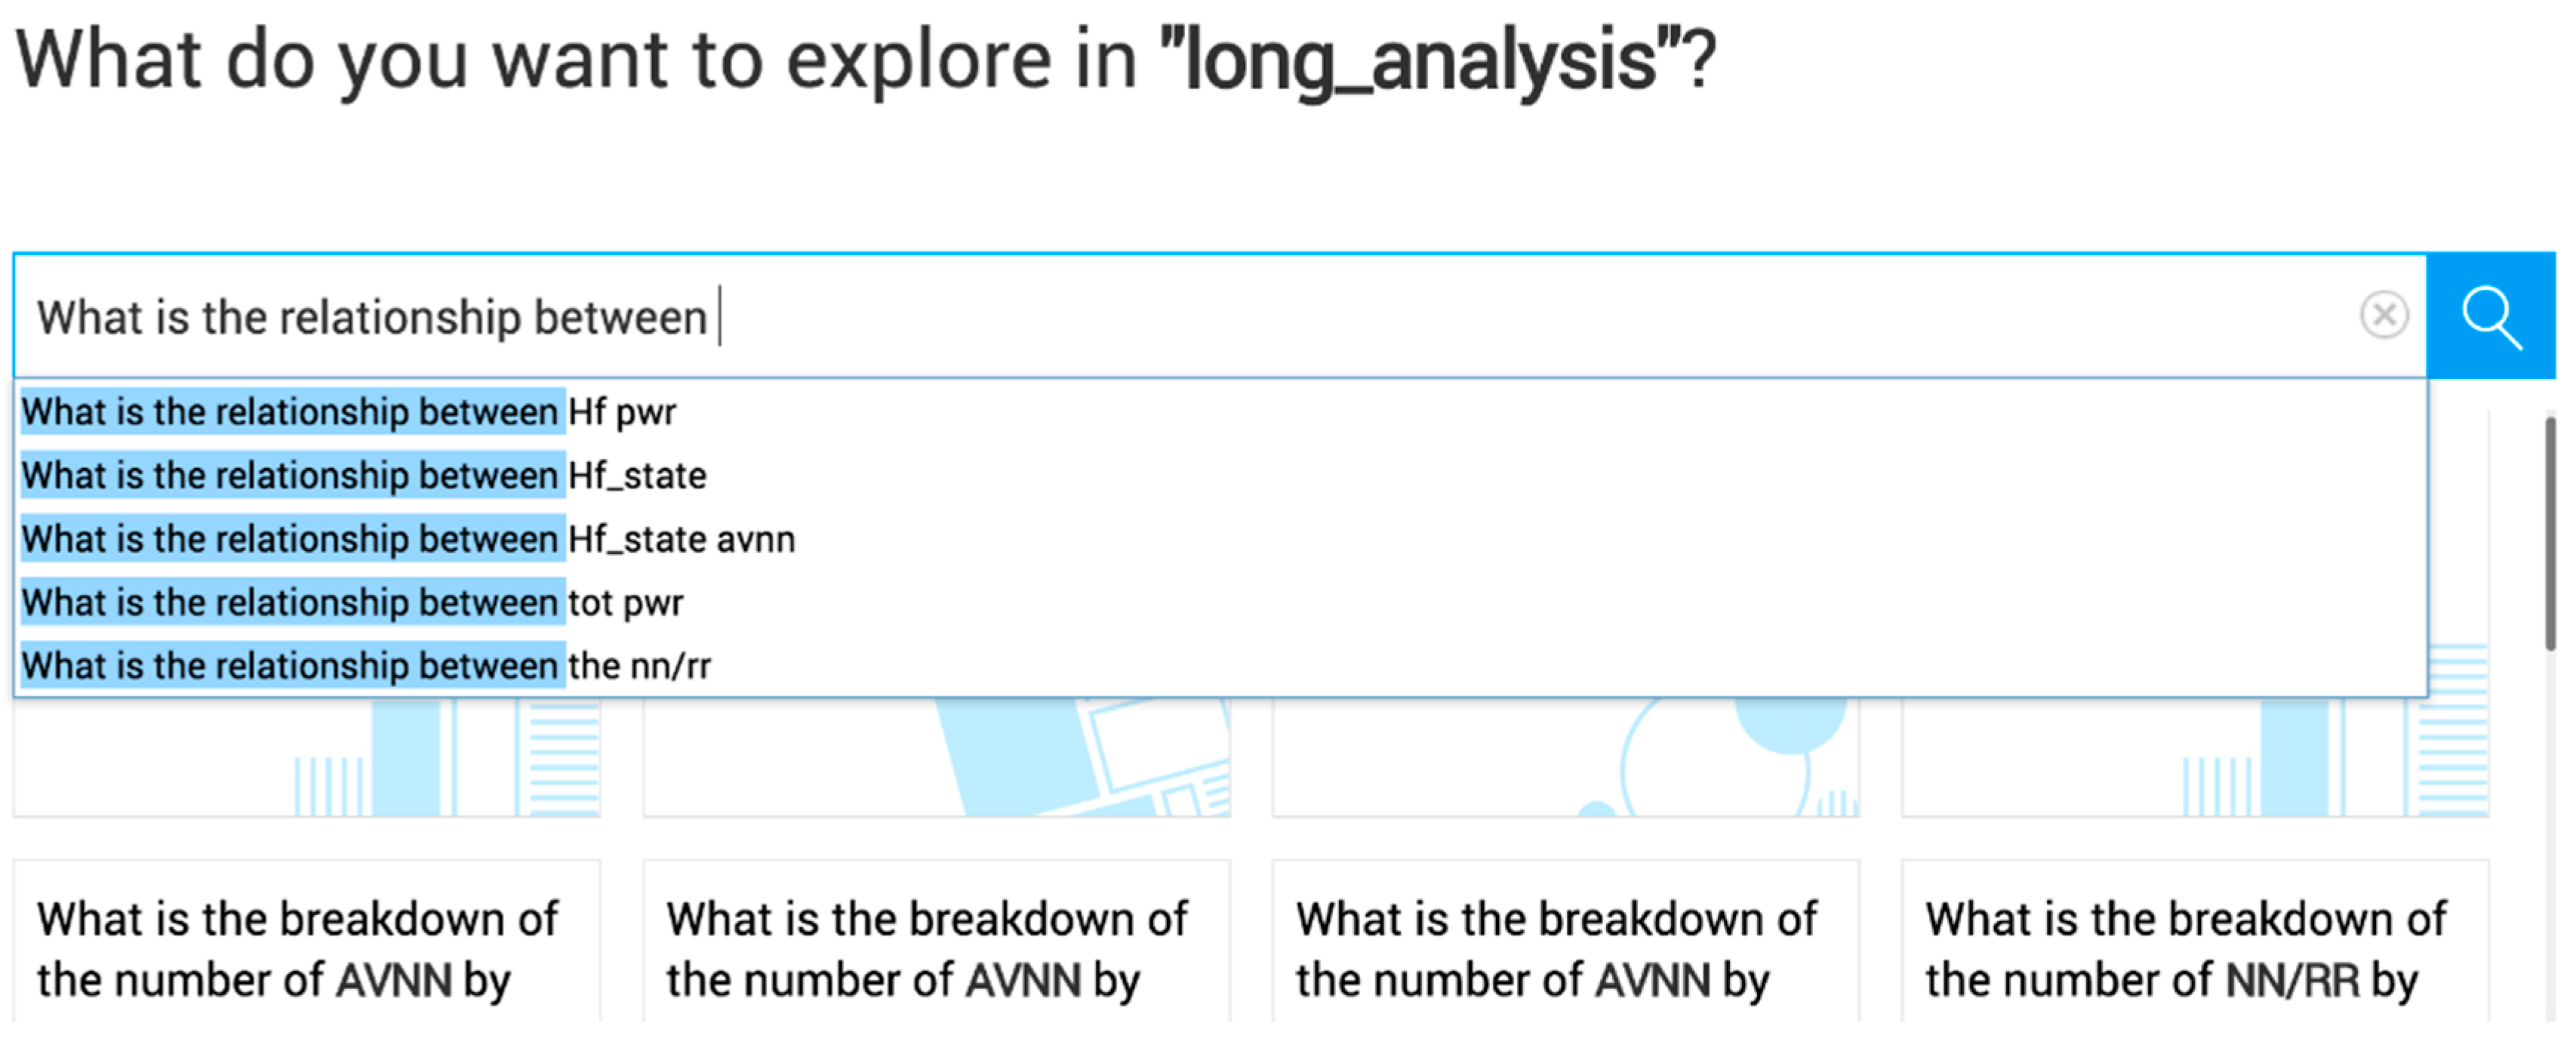
In Explore mode, the user can also ask questions in natural language, as shown in
Figure 8.
The most interesting mode is “Predict” that allows supervised analyses by setting a prediction target. In this mode it is possible to inspect the predictive power of any other parameter.
We created two different instances of the Predict module, one for the Long-Term HRV dataset parameters and one for Short-Term HRV dataset, as explained in
Section 3.3.2.
An interesting feature offered by WA is that, regardless of the type of dataset as target, it automatically chooses the most appropriate model to treat that type of data. In our case study, being HF_State a dichotomous variable, the system automatically selected the logistic regression model, as shown in
Figure 9.
3.4. Results
In this section are shown results about the above-described AaaS use case: search for the presence of heart failure, starting from the analysis of ECG signals, using IBM Watson Analytics.
The system sets out the results both as graphics and text, in three ways:
- -
“single predictor”: shows the predictive value of the most influent parameter
- -
“double predictor”: the first two most predictive parameters are shown
- -
“combination”: the various parameters are combined for a more accurate prediction.
Switching from “single predictor” to two or more predictors, the overall prediction accuracy can increase, but at the expense of the results intelligibility. In some fields of application this can be less acceptable than losing some percentage points in accuracy.
Figure 10 (left box) shows these concepts.
3.4.1. Long-Term HRV Results
For the Long-Term HRV analysis many parameters have been spotted, having a Predictive Strength (PS) of 90% on the Target HF State, in “single predictor” mode. The most influent predictors are:
- -
In the Time Domain: SDNN (PS = 90%), SDANN (PS = 90%), SDNNIDX (PS = 88%)
- -
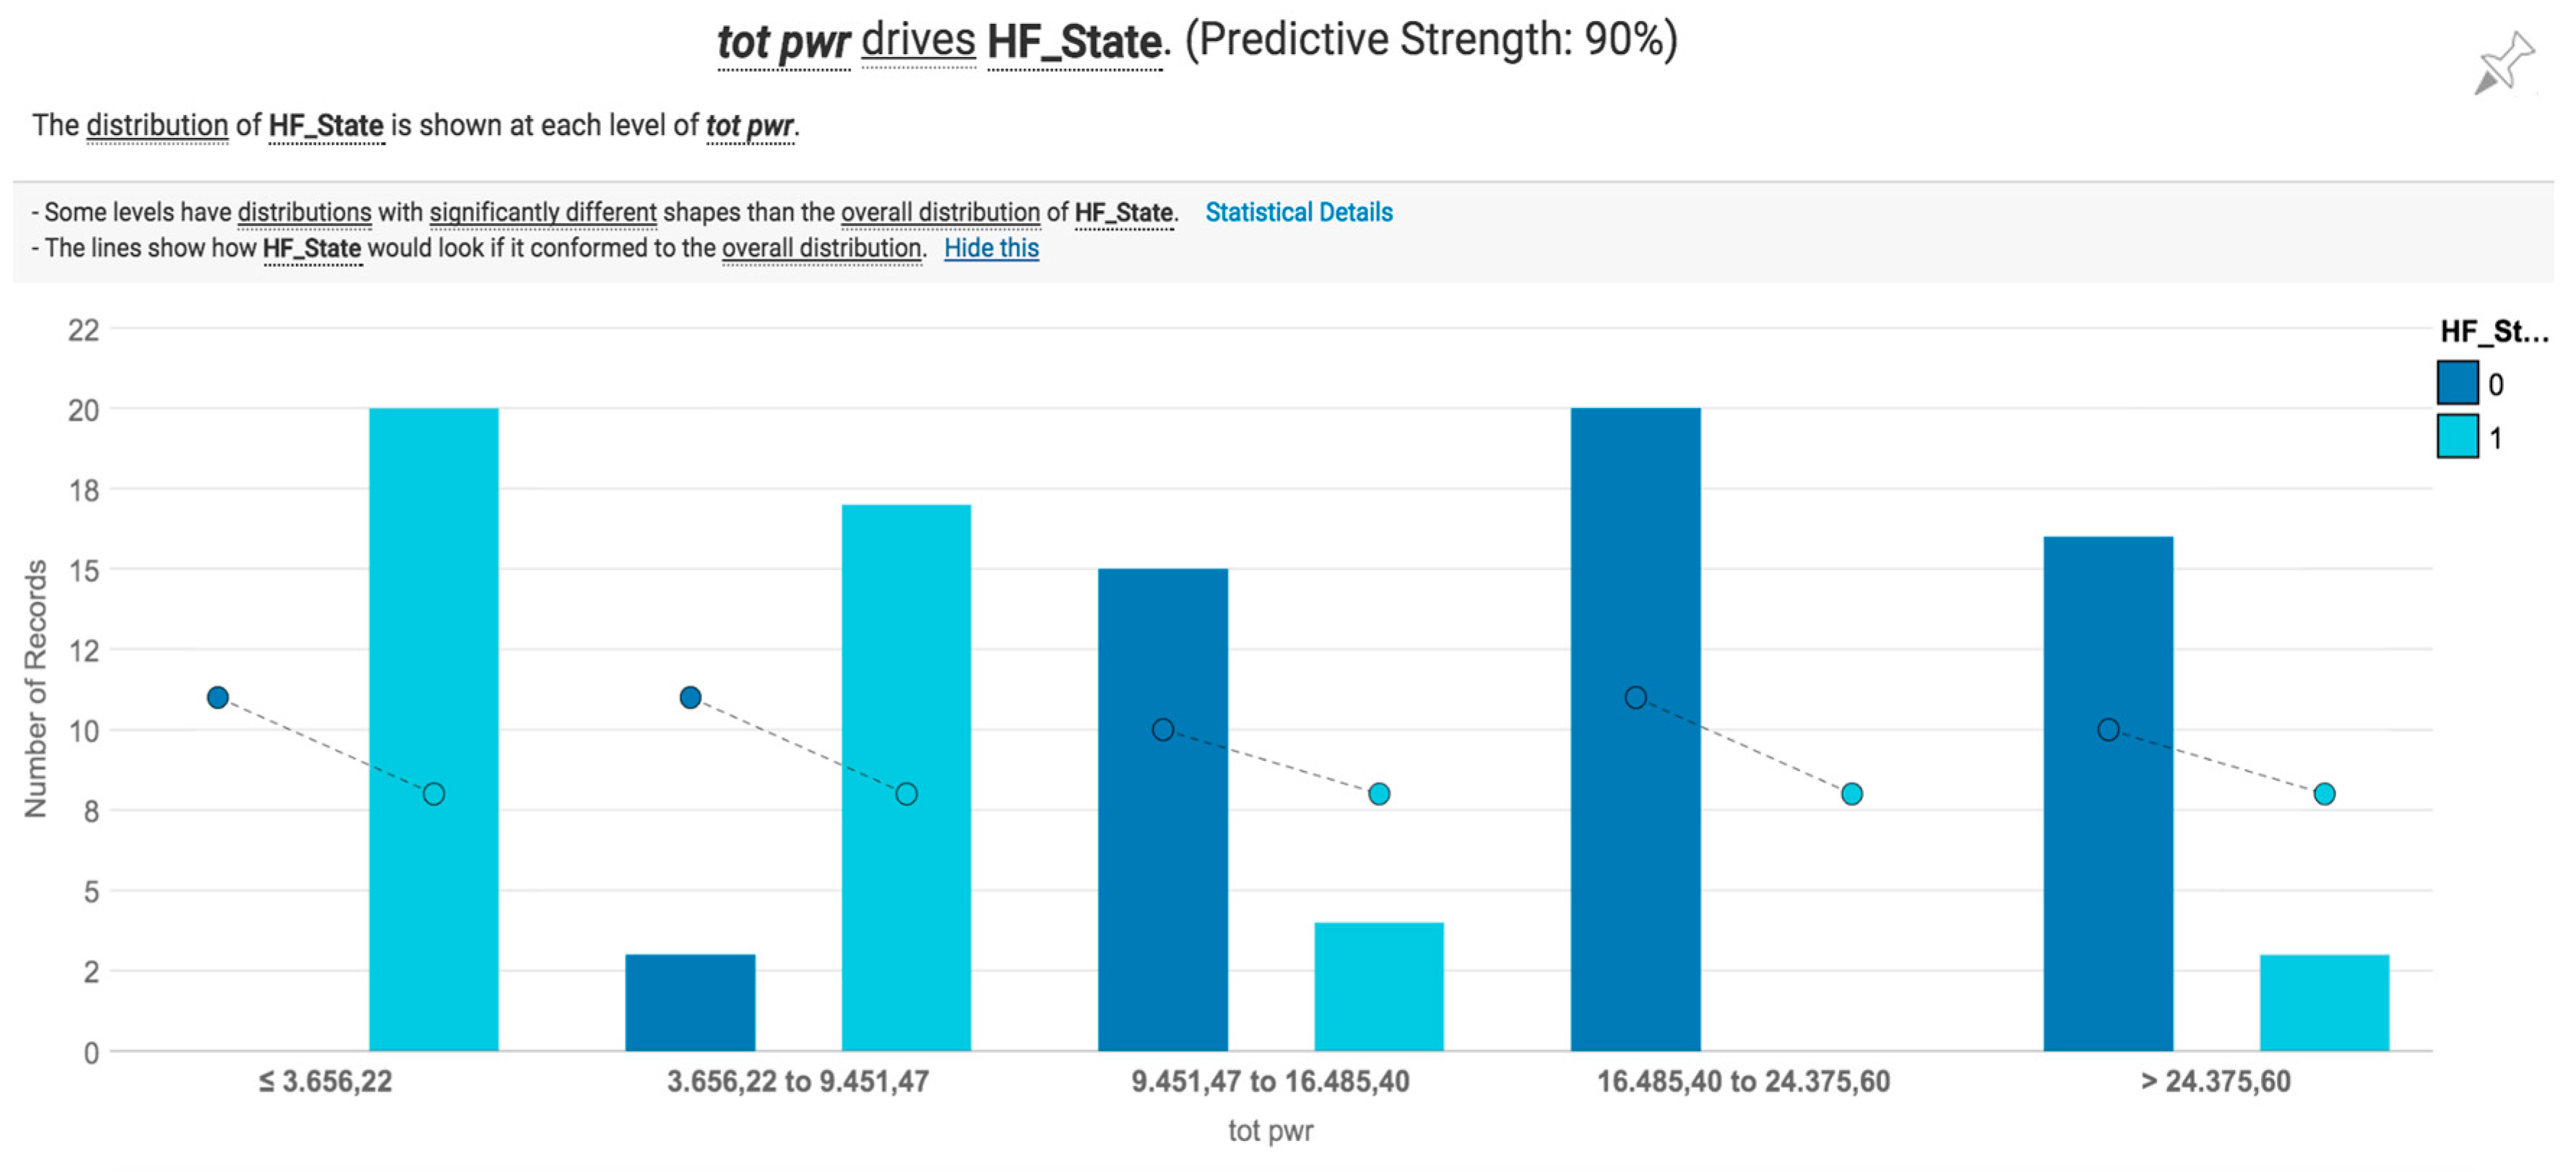
In the Frequency Domain: TOT_PWR (PS = 90%), ULF_PWR (PS = 90%)
Figure 11 shows, as an example, the screenshot for the parameter TOT_PWR. It can be noted that the results are displayed as numbers, text and graphics.
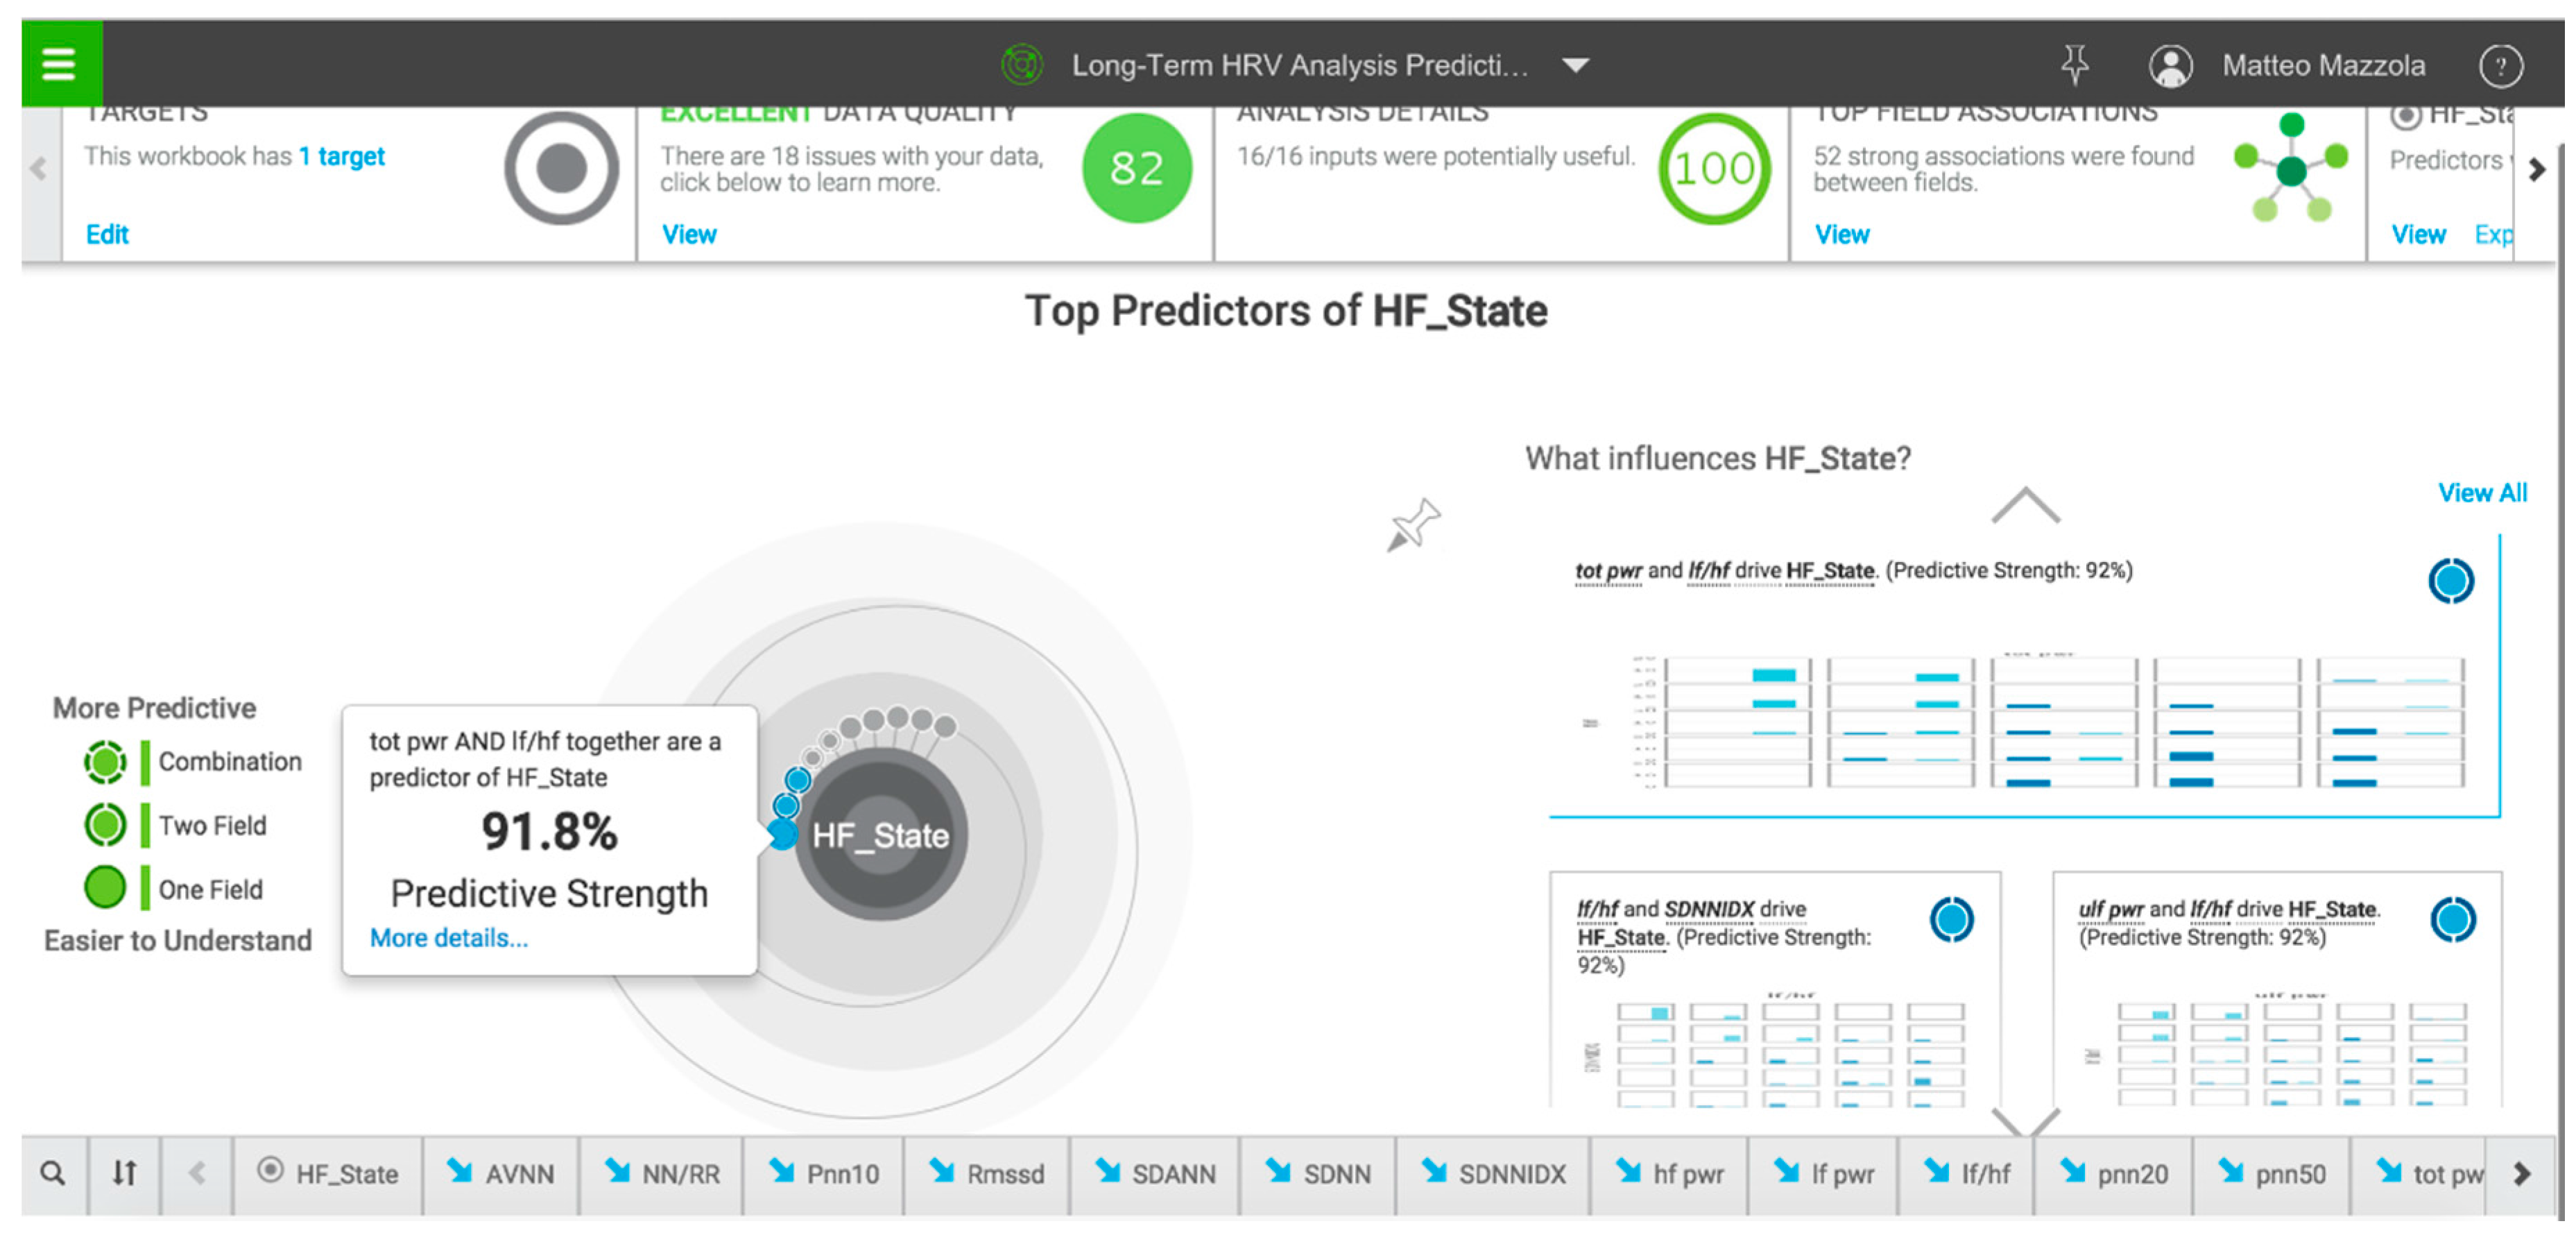
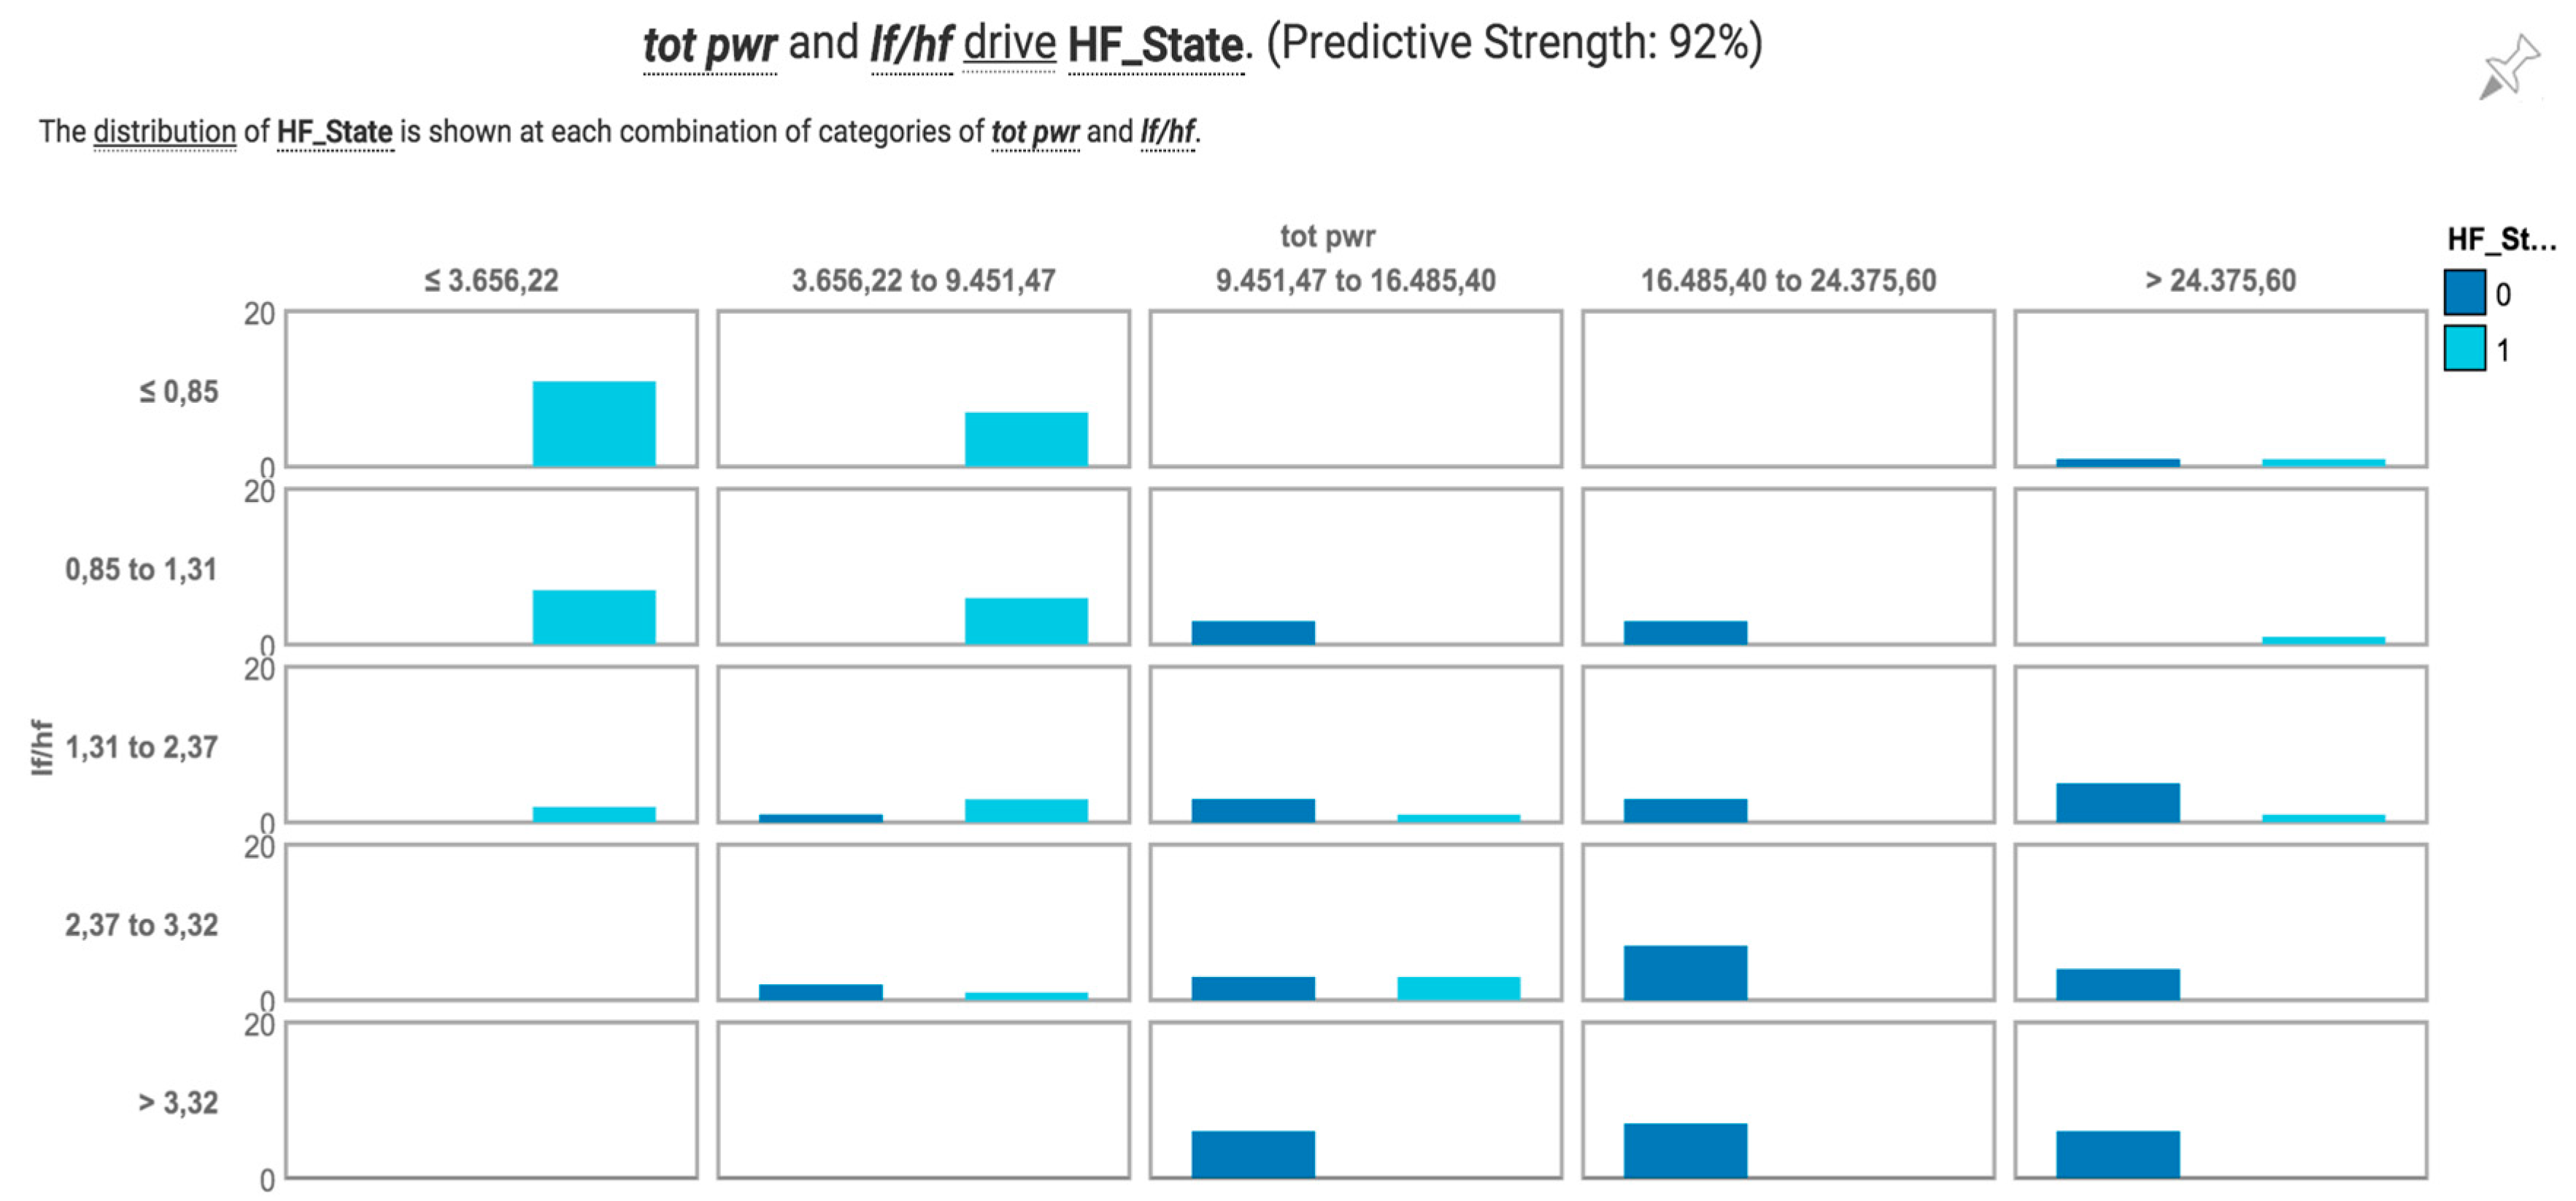
Increasing the number of predictors to be used for the analysis, we can find many combinations with a maximum overall PS of 92%.
Figure 12 shows, as an example, the combination of TOT_PWR and LF/HF.
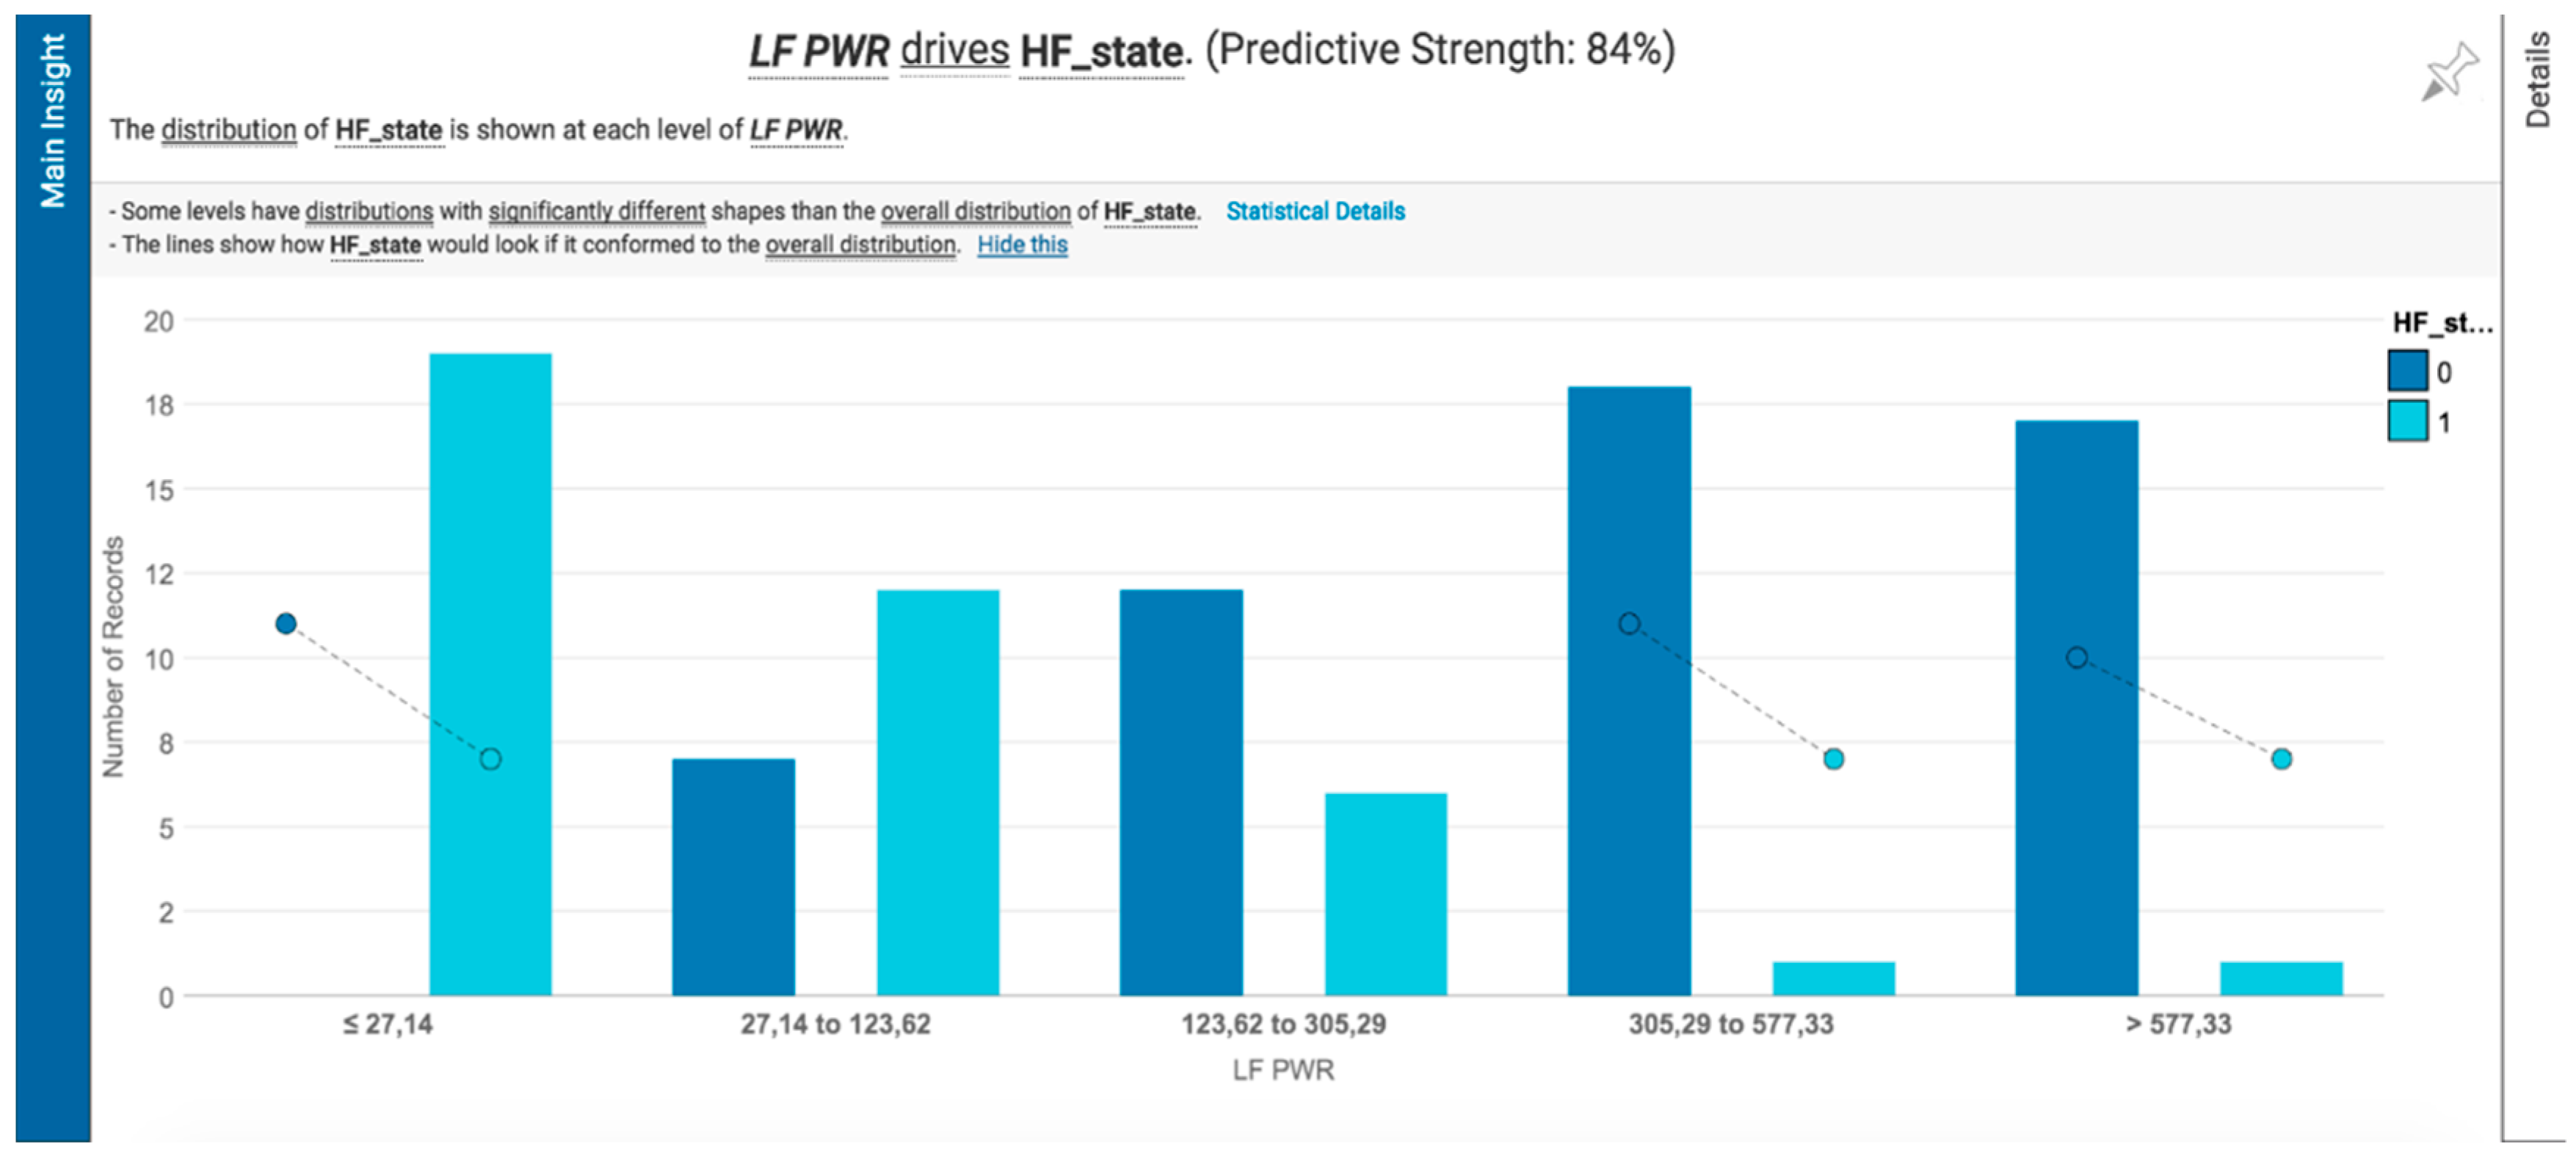
3.4.2. Short-Term HRV Results
The results for the Short-Term analysis show a lower predictive power (single predictor) if compared to the Long-Term analysis. The most influent parameters on the HF_State target are:
- -
LF_PWR (PS = 84%)
- -
LF/HF (PS = 83%)
- -
TOT_PWR (PS = 80%)
Figure 13 shows the results for the LF_PWR parameter.
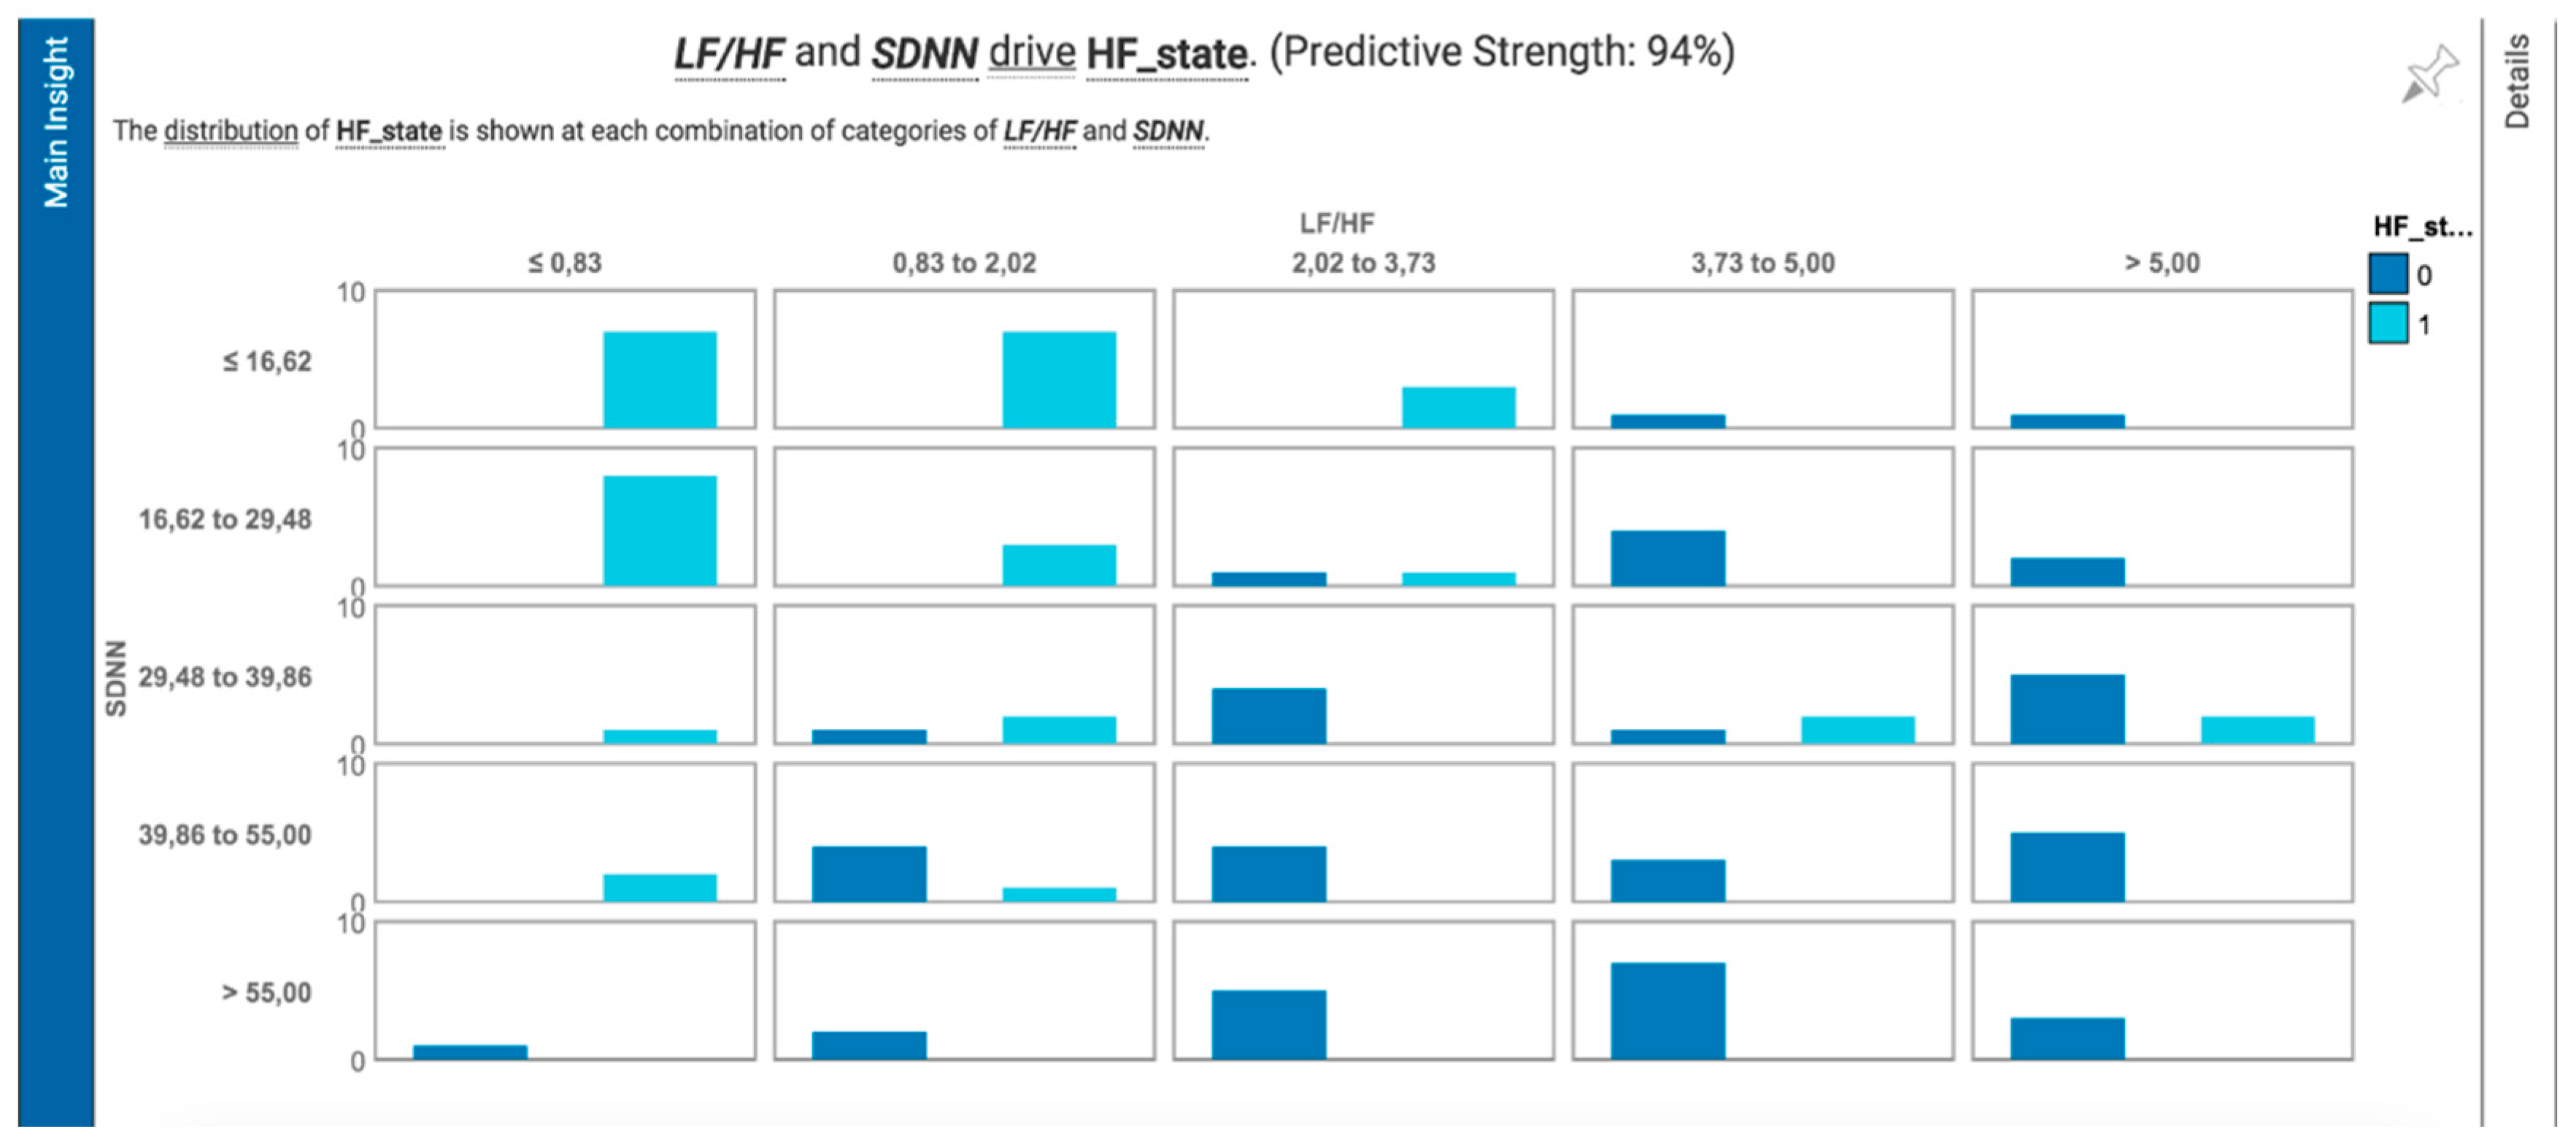
The results are greatly enhanced by combining more predictors, achieving values similar to the Long-Term analysis:
- -
LF/HF combined with SDNN: PS = 94%
- -
LF_PWR combined with LF/HF: PS = 92%
- -
pNN20 combined with LF/HF: PS = 92%
Figure 14 shows the results using the combination of LF/HF and SDNN.
4. Discussion on Results
The results show that the Long-Term and Short-Term HRV analyses are comparable in terms of predictive power on the detected parameters, when the target is identifying if patients are healthy or diseased (Heart Failure). The Short-Term HRV method is highly preferable, since it is much less invasive for the patient (five minutes for ECG acquisition, compared to a 24 h Holter ECG acquisition). It is also very suitable for tele-monitoring scenarios, such as those described in [
29].
These results are comparable with the literature. In [
23] similar results are obtained—using a static (non cloud) Classification And Regression Tree (CART) approach on MatLab—in terms of overall accuracy (>90%) and most predictive parameters (SDNN, SDANN and TOT_PWR). In [
24] is described a Short-Term approach; the obtained results are similar to ours, both in terms of overall accuracy and of most effective predictors (LF/HF).
We can therefore assert that the results obtained using a cloud approach on IBM WA are comparable to the results obtained on ad hoc custom desktop platforms. The results are shown in a clear and friendly way, easily understandable also by non experts.
The main advantage of the proposed approach for the researcher is the possibility of being quickly operative, focusing only on the experiment, without taking care of hardware requirements (high computational power is needed for these analyses) or machine learning algorithms development.
From a medical point of view, the results of this study can be interpreted as the possibility to perform a preliminary and early diagnosis of HF, basing solely on the analysis of the ECG signal (accepting a certain level of uncertainty, as shown by the accuracy values).
These findings are not meant to replace the diagnostic procedures for an exhaustive diagnosis, explained in the ESC guidelines, but can be very helpful in many scenarios such as home telemonitoring for the daily monitoring of patient status.
As shown, even short term analysis has a strong predictive power: this means that the patient will benefit of the proposed approach, having to stay connected to an electrocardiograph for only 5 min (instead of 24 h).
It is very important to note that HRV analysis is based only on the progress of heart rate without any further analysis of the ECG wave form. This means that for the proposed system it is only needed a device for high quality detection of the heartbeat (for example, a 2-lead ECG measured from hands) instead of a costly and less practical 12-lead electrocardiograph. This aspect is particularly important for enabling mobile applications.
5. Conclusions
In this paper, after a brief introduction of the main AaaS cloud systems, we reported the experience of using a cloud-based analytics software applied to the following case study: identifying the presence of HF by analyzing the ECG signal only.
We verified that the results obtained are comparable to those found in the literature, where the same issue is addressed through custom machine learning systems, purposely developed and set up for the target case. Hence the AaaS cloud systems could be a valid alternative to local hardware and software systems for analyzing data. A major obstacle to AaaS could be transferring big datasets onto the cloud. Typical machine learning projects require the analysis of large images that can easily reach the size of 2 TB, not simply transferable onto the cloud. The model used in our case study can solve this problem by locally performing the data extraction, in order to reduce the dataset size to be transferred to the cloud.
In this study the HRV analysis has been locally performed starting from the raw ECG signal (medium size). The analysis gives back a small size vector of numeric parameters that can quickly and easily be transferred onto the cloud. This model allows you to take advantage of the full power of the AaaS approach, no matter how big is the size of the initial dataset. From a medical point of view, performing HF detection by analyzing the ECG signal only, opens the possibility of easy tele-monitoring applications (we only analyze the heart rate, not the ECG waveform, so a very basic electrocardiograph is necessary) for an early and preliminary diagnosis. Furthermore, by combining the HRV analysis with systems for assisted drugs delivering [
30], it is possible to enable scenarios in which the patient is technologically aided both in diagnosis and therapy, making him more autonomous in preserving the state of his health. A more comprehensive diagnosis can then be made by performing clinical tests and following protocols as described in the ESC guidelines, and the HRV-based home tele-monitoring can be used as a daily check of patient status. Also mobile applications can highly benefit of this approach, given that it requires simple electro-medical hardware and low computational power on the local device.
Acknowledgments
We would like to thank IBM Italy for supporting us in the use of Watson Analytics, as well as for providing us with free student-accounts for research purposes. We would like to thank also Massimo Milli, MD, for his crucial clinical support.
Author Contributions
Gabriele Guidi and Ernesto Iadanza equally contributed to this manuscript. Matteo Mazzola is a student in engineering that performed the analyses using IBM Watson Analytics, supervised by Gabriele Guidi. Roberto Miniati contributed in finding the state of the art.
Conflicts of Interest
The authors declare no conflict of interest.
References
- Mell, P.; Grance, T.; Grance, T. The NIST Definition of Cloud Computing Recommendations of the National Institute of Standards and Technology. Available online: http://nvlpubs.nist.gov/nistpubs/Legacy/SP/nistspecialpublication800-145.pdf (accessed on 30 June 2016).
- Sun, X.; Gao, B.; Fan, L.; An, W. A Cost-Effective Approach to Delivering Analytics as a Service. In Proceedings of the 2012 IEEE 19th International Conference on Web Services, Honolulu, HI, USA, 24–29 June 2012; pp. 512–519.
- Barga, R.S.; Ekanayake, J.; Lu, W. Project Daytona: Data Analytics as a Cloud Service. In Proceedings of the 2012 IEEE 28th International Conference on Data Engineering, Arlington, VA, USA, 1–5 April 2012; pp. 1317–1320.
- Talia, D. Clouds for Scalable Big Data Analytics. Computer 2013, 46, 98–101. [Google Scholar] [CrossRef]
- Demirkan, H.; Delen, D. Leveraging the capabilities of service-oriented decision support systems: Putting analytics and big data in cloud. Decis. Support. Syst. 2013, 55, 412–421. [Google Scholar] [CrossRef]
- Chen, Q.; Zeller, H. Experience in Continuous analytics as a Service (CaaaS). In Proceedings of the 14th International Conference on Extending Database Technology, Uppsala, Sweden, 21–24 March 2011; Volume 1, pp. 509–514.
- 10 Enterprise Predictive Analytics Platforms Compared. Available online: http://www.kdnuggets.com/2013/08/10-enterprise-predictive-analytics-platforms-compared.html (accessed on 30 June 2016).
- Enterprise Predictive Analytics Comparisons 2014. Available online: http://www.butleranalytics.com/enterprise-predictive-analytics-comparisons-2014/ (accessed on 30 June 2016).
- SAS Analytics Home Page. Available online: Http://www.sas.com/en_us/home.html (accessed on 30 June 2016).
- Gordon, L. Using Classification and Regression Trees (CART) in SAS ® Enterprise Miner TM For Applications in Public Health. In SAS Global Forum—Data Mining and Text Analytics, Proceedings of the SAS Global Forum 2013, SanFrancisco, CA, USA, 28 April–1 May 2013; pp. 1–8.
- Klatsky, A.L.; Hasan, A.S.; Armstrong, M.A.; Udaltsova, N.; Morton, C. Coffee, Caffeine, and Risk of Hospitalization for Arrhythmias. Perm. J. 2011, 15, 19–25. [Google Scholar] [CrossRef] [PubMed]
- Abousalh-Neto, N.A.; Kazgan, S. Big data exploration through visual analytics. In Proceedings of the IEEE Conference on Visual Analytics Science and Technology (VAST), Seattle, WA, USA, 14–19 October 2012; pp. 285–286.
- IBM Watson Analytics Home Page. Available online: Http://www.ibm.com/analytics/watson-analytics/ (accessed on 30 June 2016).
- IBM Watson Analytics Community Page. Available online: https://community.watsonanalytics.com/ (accessed on 30 June 2016).
- Watson Analytics Use Case for HR: Retaining Valuable Employees. Available online: https://www.ibm.com/blogs/watson-analytics/watson-analytics-use-case-for-hr-retaining-valuable-employees/ (accessed on 30 June 2016).
- Watson Analytics Use Case Independence Day Edition: Fireworks and the 4th of July. Available online: http://www.scoop.it/t/gaming-analytics/p/4046911509/2015/07/02/watson-analytics-use-case-independence-day-edition-fireworks-and-the-4th-of-july (accessed on 30 June 2016).
- Panahiazar, M.; Taslimitehrani, V.; Pereira, N.; Pathak, J. Using EHRs and Machine Learning for Heart Failure Survival Analysis. Stud. Health Technol. Inform. 2015, 216, 40–44. [Google Scholar] [PubMed]
- Guidi, G.; Pettenati, M.C.; Miniati, R.; Iadanza, E. Random Forest for Automatic Assessment of Heart Failure Severity in a Telemonitoring Scenario. Conf. Proc. IEEE Eng. Med. Biol. Soc. 2013, 2013, 3230–3233. [Google Scholar] [PubMed]
- Guidi, G.; Melillo, P.; Pettenati, M.; Milli, M.; Iadanza, E. Performance Assessment of a Clinical Decision Support System for analysis of Heart Failure. IFMBE Proc. 2014, 41, 1354–1357. [Google Scholar]
- Chui, K.T.; Tsang, K.F.; Wu, C.K.; Hung, F.H.; Chi, H.R.; Chung, H.S.; Man, K.F.; Ko, K.T. Cardiovascular diseases identification using electrocardiogram health identifier based on multiple criteria decision making. Expert Syst. Appl. 2015, 42, 5684–5695. [Google Scholar] [CrossRef]
- Boursalie, O.; Samavi, R.; Doyle, T.E. M4CVD: Mobile Machine Learning Model for Monitoring Cardiovascular Disease. Procedia Comput. Sci. 2015, 63, 384–391. [Google Scholar] [CrossRef]
- Guidi, G.; Pettenati, M.C.; Miniati, R.; Iadanza, E. Heart Failure analysis Dashboard for patient’s remote monitoring combining multiple artificial intelligence technologies. Conf. Proc. IEEE Eng. Med. Biol. Soc. 2012, 2012, 2210–2213. [Google Scholar] [PubMed]
- Melillo, P.; Fusco, R.; Sansone, M.; Bracale, M.; Pecchia, L. Discrimination power of long-term heart rate variability measures for chronic heart failure detection. Med. Biol. Eng. Comput. 2011, 49, 67–74. [Google Scholar] [CrossRef] [PubMed]
- Pecchia, L.; Melillo, P.; Sansone, M.; Bracale, M. Discrimination power of short-term heart rate variability measures for CHF assessment. IEEE Trans. Inf. Technol. Biomed. 2011, 15, 40–46. [Google Scholar] [CrossRef] [PubMed]
- McMurray, J.J.V.; Adamopoulos, S.; Anker, S.D.; Auricchio, A.; Böhm, M.; Dickstein, K.; Falk, V.; Filippatos, G.; Fonseca, C.; Gomez-Sanchez, M.A.; et al. ESC Guidelines for the diagnosis and treatment of acute and chronic heart failure 2012: The Task Force for the Diagnosis and Treatment of Acute and Chronic Heart Failure 2012 of the European Society of Cardiology. Developed in collaboration with the Heart. Eur. Heart J. 2012, 33, 1787–1847. [Google Scholar] [CrossRef] [PubMed]
- Inglis, S.C.; Clark, R.A.; McAlister, F.M.; Ball, J.; Lewinter, C.; Cullington, D.; Stewart, S.; Cleland, J. Structured telephone support or telemonitoring programmes for patients with chronic heart failure. Cochrane Lybrary 2010, 8. [Google Scholar] [CrossRef]
- Takeda, A.; Sjc, T.; Rs, T.; Khan, F.; Krum, H.; Underwood, M. Clinical service organisation for heart failure. Cochrane Database Syst Rev. 2012. [Google Scholar] [CrossRef]
- Goldberger, A.L.; Amaral, L.A.N.; Glass, L.; Hausdorff, J.M.; Ivanov, P.C.; Mark, R.G.; Mietus, J.E.; Moody, G.B.; Peng, C.-K.; Stanley, H.E. PhysioBank, PhysioToolkit, and PhysioNet: Components of a New Research Resource for Complex Physiologic Signals. Circulation 2000, 101, E215–E220. [Google Scholar] [CrossRef] [PubMed]
- Guidi, G.; Pollonini, L.; Dacso, C.C.; Iadanza, E. A multi-layer monitoring system for clinical management of Congestive Heart Failure. BMC Med. Inform. Decis. Mak. 2015, 15 (Suppl. S3). [Google Scholar] [CrossRef] [PubMed]
- Iadanza, E.; Baroncelli, L.; Manetti, A.; Dori, F.; Miniati, R.; Gentili, G.B. An rFId Smart container to perform drugs administration reducing adverse drug events. IFMBE Proc. 2011, 37, 679–682. [Google Scholar]
© 2016 by the authors; licensee MDPI, Basel, Switzerland. This article is an open access article distributed under the terms and conditions of the Creative Commons Attribution (CC-BY) license (http://creativecommons.org/licenses/by/4.0/).


