1. Introduction
Weather generators are statistical models, which are useful for generating synthetic weather sequences or weather realizations [
1]. They are essential for crop yield predictions and risk assessment because of their ability to simulate seasonal climate in advance of the growing season. Sub-seasonal to seasonal (S2S) forecast, from two weeks to seasonal time scales, are now being developed by World Meteorological Organization (WMO) [
2], which can be complemented by weather generators. In crop growth models, weather generators are an integral part for simulating crop growth and distributions of expected yields [
3]. Together with crop models, they are used for implementing decision support systems for agricultural risk management related to climate and weather uncertainties. The results of crop models can provide expected yield distributions to farmers, e.g., the ones provided by Tomorrow’s Crop framework [
4]. The resulting yield distributions represent not only the average value but crop yield’s stability and associated risks, which are more useful information for decision making. Daily weather realizations from weather generators have been used not only in agriculture but also in various fields, such as water engineering design, ecosystem and climate change simulations, because observed meteorological data are often inadequate in terms of their temporal and spatial coverages [
3]. They have been utilized to fill up missing historical data, assess the impact of climate change such as droughts, rainfall pattern change and extreme temperature [
3].
Most of the weather generators have been developed as stand-alone programs using programming languages suitable for scientific computations, such as Fortran and Pascal. However, stand-alone programs developed in these programming languages cannot readily serve clients over the Internet as a service, and cannot be linked with other web services, e.g., web-based simulations. In this regard, the usability of weather generators is limited. Similarly, weather generators’ output formats can vary and metadata are not included resulting in their lack of portability and interoperability. Nowadays, some climatological data are available online, e.g., IRI/LDEO Climate Data Library [
5], daily Agro-meteorological Grid Square Data System [
6], among others, that can be retrieved and transferred over the Internet, however, their data formats and Application Program Interface (API) are oftentimes different. Weather generators have been developed as standalone applications, while decision support systems (DSS) for farm management are now being developed as web applications. Processing and providing climate and weather data for DSS web applications, however, is still a bottleneck.
We encountered these gaps when we integrated a weather generator with a crop model for simulating crop yields in Tomorrow’s Rice web-based framework [
4]. We needed to work on developing iterative data processing, starting from querying data from climatological data sources, followed by data quality control since weather generator could not process incomplete data series (contained missing data), and lastly formatting the data to make them compatible as input to the weather generator model. Moreover, legacy weather generators, written in different programming languages such as Delphi and Pascal, are not really portable, hence a significant effort has to be spent on compiling them and keeping them up-to-date for different Operating Systems (OS). Intergovernmental Panel on Climate Change (IPCC) reported that environment and climate scientists had to spend huge time and effort in data handling [
7]. These processes are time-consuming and require meteorological knowledge and programming skills. For pre-processing data such as filling missing data and data formatting, most of agronomists who run crop simulations do it manually or develop individual programs as they need. These bottlenecks must be addressed in order to increase efficiency of research and development in agriculture.
Interoperability on data and web service is the key to addressing these issues. Here, we proposed a web service framework for making weather generations available on the web for scientists and application developers. Climatological data sources required for identifying statistical characteristics of the weather were seamlessly connected with the weather generators by Sensor Observation Service (SOS) API. SOS API is one of the well-known standards that are defined by Open-Geospatial Consortium (OGC). It defines data format and protocol for finding, describing and transmitting sensor and sensor data in the Internet, which brings in the interoperability of data access to climatological data. Users call a generation service endpoint, then the service obtains historical data sources via SOS, performs necessary format conversion, and then invokes a weather generator. When users need to translate probabilistic seasonal climate forecasts to weather realizations, we encode the weather realizations using International Consortium for Agricultural Systems Applications (ICASA) standard, for agricultural simulations. For the purpose of publishing and sharing weather realizations on a broader scale (i.e., other domains), we provide an SOS access to the weather realizations for higher levels of interoperability. SOS publishes data in Observation and Measurement (O & M) form, which is a standard of OGC, as well as ISO. By this way, it is convenient to convert initial weather data to other formats used in applications with other domains. This enables people to share the same set of weather realizations that has been produced through the stochastic models. With this scheme, the time for manual data preparation can be dramatically reduced. Consequently, connecting data sources and running weather generators can be automated on the web. This web service framework was implemented in order to provide weather generators as public services.
2. Addressing Bottlenecks of Legacy Weather Generators for Service
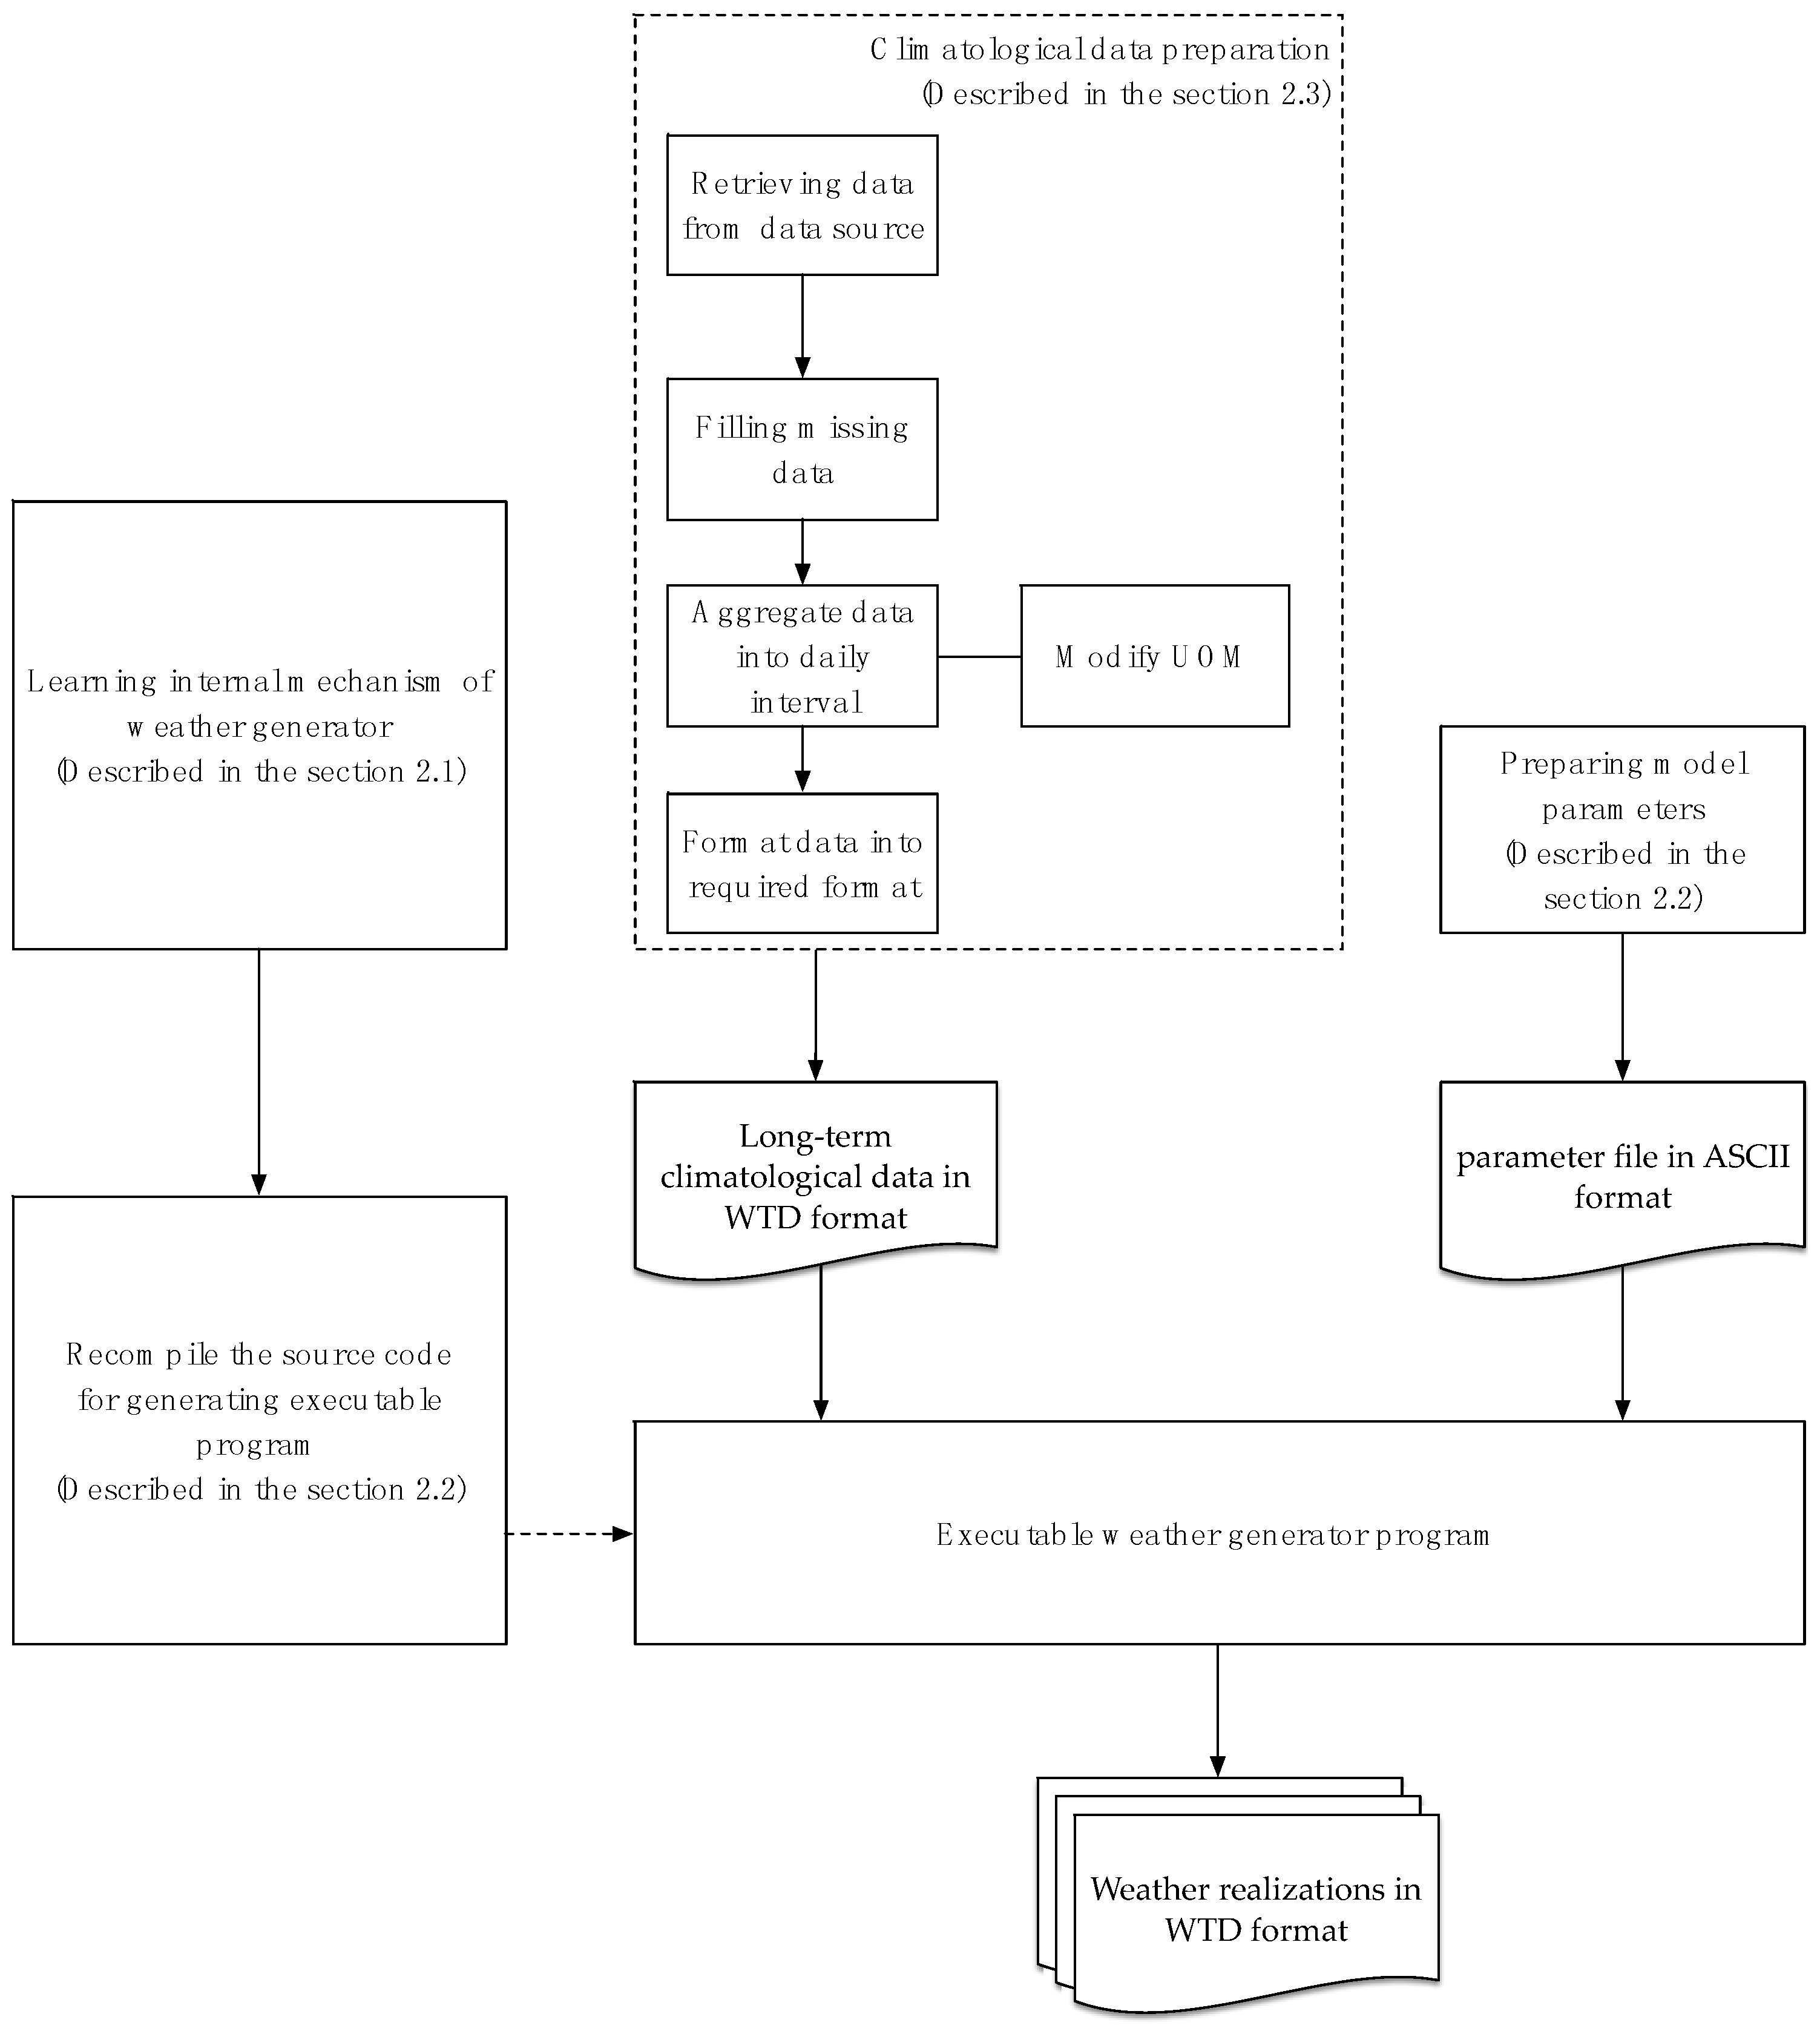
Figure 1 shows the procedure of running a weather generator. In the following sections, we describe basic principles of stochastic weather generators (
Section 2.1), model operations (
Section 2.2) and data preparation (
Section 2.3). Understanding model structure, parameters, programming interfaces and inputs/outputs is important for designing and implementing the weather generators as web services.
2.1. Fundamental Principle of Stochastic Weather Generators
Weather generators are models that use stochastic method for generating synthetic daily weather data (realizations). Long-term climate data are used to calibrate the stochastic model. Weather generators are often used to generate weather realization as input to crop models in order to study the impacts of climate variability to crop production [
1]. Here, two stochastic weather generators were implemented as web services. The first model is used for stochastic disaggregation (temporal downscaling), called, DisAg [
1]. The second model is a parametric downscaling method for probabilistic seasonal climate forecasts (SCF), called, predictWTD [
8]. The predictWTD embeds the DisAg program inside of its algorithm which expands the capability of DisAg to downscale the full distribution of SCF. The details of the stochastic weather generators included in this paper are described in [
1]. Some basic concepts are described here, in order to understand better the data requirement and data flow, which are important for designing and implementing them as web services.
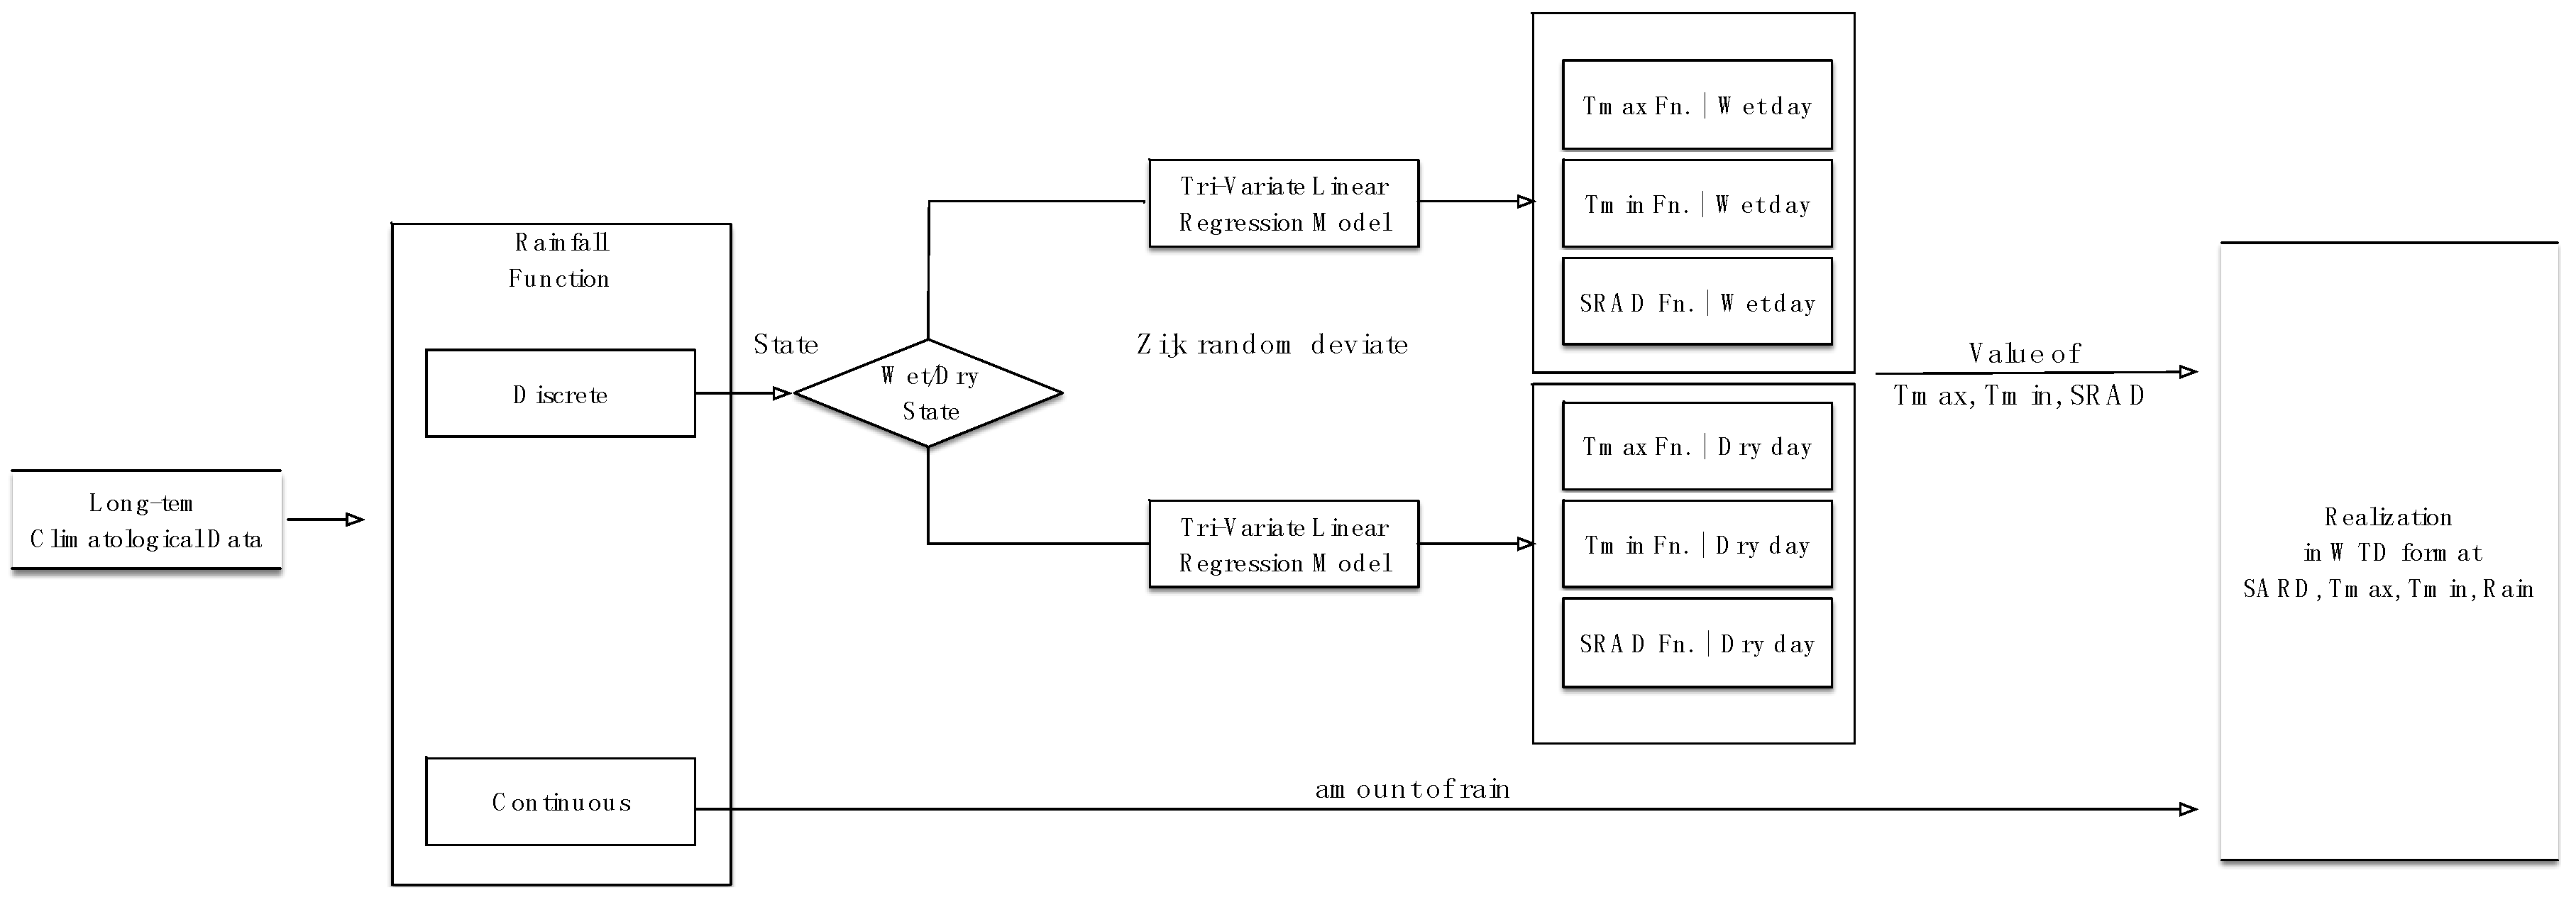
Figure 2 presents the schematic for DisAg. Long-term climate data that consist of solar exposure (SRAD), maximum temperature (TMAX), minimum temperature (TMIN), and rainfall (RAIN) are required for calibrating the stochastic models.
The rainfall model in DisAg is a stochastic model with discrete (rainfall occurrence) and continuous (rainfall intensity) processes, as shown in Equation (1).
where
R is rainfall function
f is an operator that maps discrete and continuous model parameters with rainfall;; and
.
The discrete model is a rainfall occurrence model that decides the state of wetness or dryness on a day, based on a two-state Markov chain model. DisAg uses a hybrid two-state Markov model by which, if yesterday was wet, the probability that today is wet is based on 1st order Markov model, while if yesterday was dry, it uses a 2nd order Markov model. The continuous model in Equation (1) is a function for rainfall intensity, a hyper-exponential distribution, as used by DisAg.
SRAD, TMAX and TMIN are generated based on a tri-variate normal model conditioned on rainfall [
9].
The predictWTD enhances DisAg’s capability by downscaling the full distribution of seasonal climate forecast. Seasonal climate forecasts are usually issued in tercile probabilities, which are probability of below-normal (BN), near-normal (NN), and above-normal (AN) [
10]. Climate forecasting can facilitate risk assessment, preparation and adaptation for global decision-making and planning in various sectors such as energy, water and food security [
11].
2.2. Legacy Procedures for Operating Weather Generators
This section describes the operation of weather generators. DisAg was implemented in Delphi, and predictWTD was written in Fortran. These programming languages are strong for scientific computations, however, they lack good support for cross-platform and cross-languages portability. Before running the weather generators, the programs must be recompiled to create executable programs so that they can be compatible with users’ working environment. If the working environment changes, the programs will need to be recompiled. It is not however an easy task for users to find compilers suitable for their OS (e.g., mac OS and Linux) to re-compile and re-create executable programs for their needs.
To operate the weather generators, two main input files are required as shown in
Figure 1. One is a long-term historical weather data file in WTD format, which is used for calibrating the stochastic models. The other one is a parameter file (ASCII) named param_WTD.txt that provides the conditions for running the weather generator. The parameter file includes a weather station name that becomes the name of the generated weather file (WTD format), simulation period, number of realizations to be generated and SCF.
The format of param_WTD.txt file is somewhat strict. If the file is not in the right structure, the process will not work. Users need to understand every parameter for operating the model. This is a barrier for new comers who wanted to utilize weather generators as a product. The file needs to be in the same directory with the executable program. Operating conditions for running a weather generator using a plain text format is not convenient and can easily lead to errors, e.g., file formatting mismatch. If we can bundle the weather generator operation including data input preparations as a web service, generating weather scenarios will be more convenient.
2.3. Climatological Data Preparation
Climate variability impacts crop growth. Climate data are used for simulating crop growth, planning agricultural management and farm decisions [
12]. Crop models use daily meteorological data as inputs for simulating crop growth [
13]. The key variables that impact crop growth are temperature, solar exposure and precipitation [
14]. Temperature substantially affects crop growth and phenological development, while solar exposure significantly affects crop photosynthesis [
15]. Precipitation represents water availability in an area. These variables are often generated in a weather generator.
In this section, we describe the general procedures in preparing climate data for running legacy weather generators. These steps must be performed often manually, as illustrated in
Figure 1 in the part of climatological data preparation. From the retrieval of data (from a data source), one needs to learn the data accessing protocol and format. After retrieving the data, all missing data need to be filled, as weather generators cannot process a dataset with missing data above a threshold volume. A weather station captures weather data at various time-intervals. In the case of public weather station networks, they usually publish their daily data, but some stations capture data at every 5- or 10-min intervals and publish those data as they are. In such cases, the data must be aggregated at daily interval and their unit of measurement (UOM) must be changed accordingly. Matching the UOM of each climate variable is very important; otherwise, there could be some hidden errors in the final dataset. Lastly, the aggregated daily data must be transformed in formats compatible with weather generators.
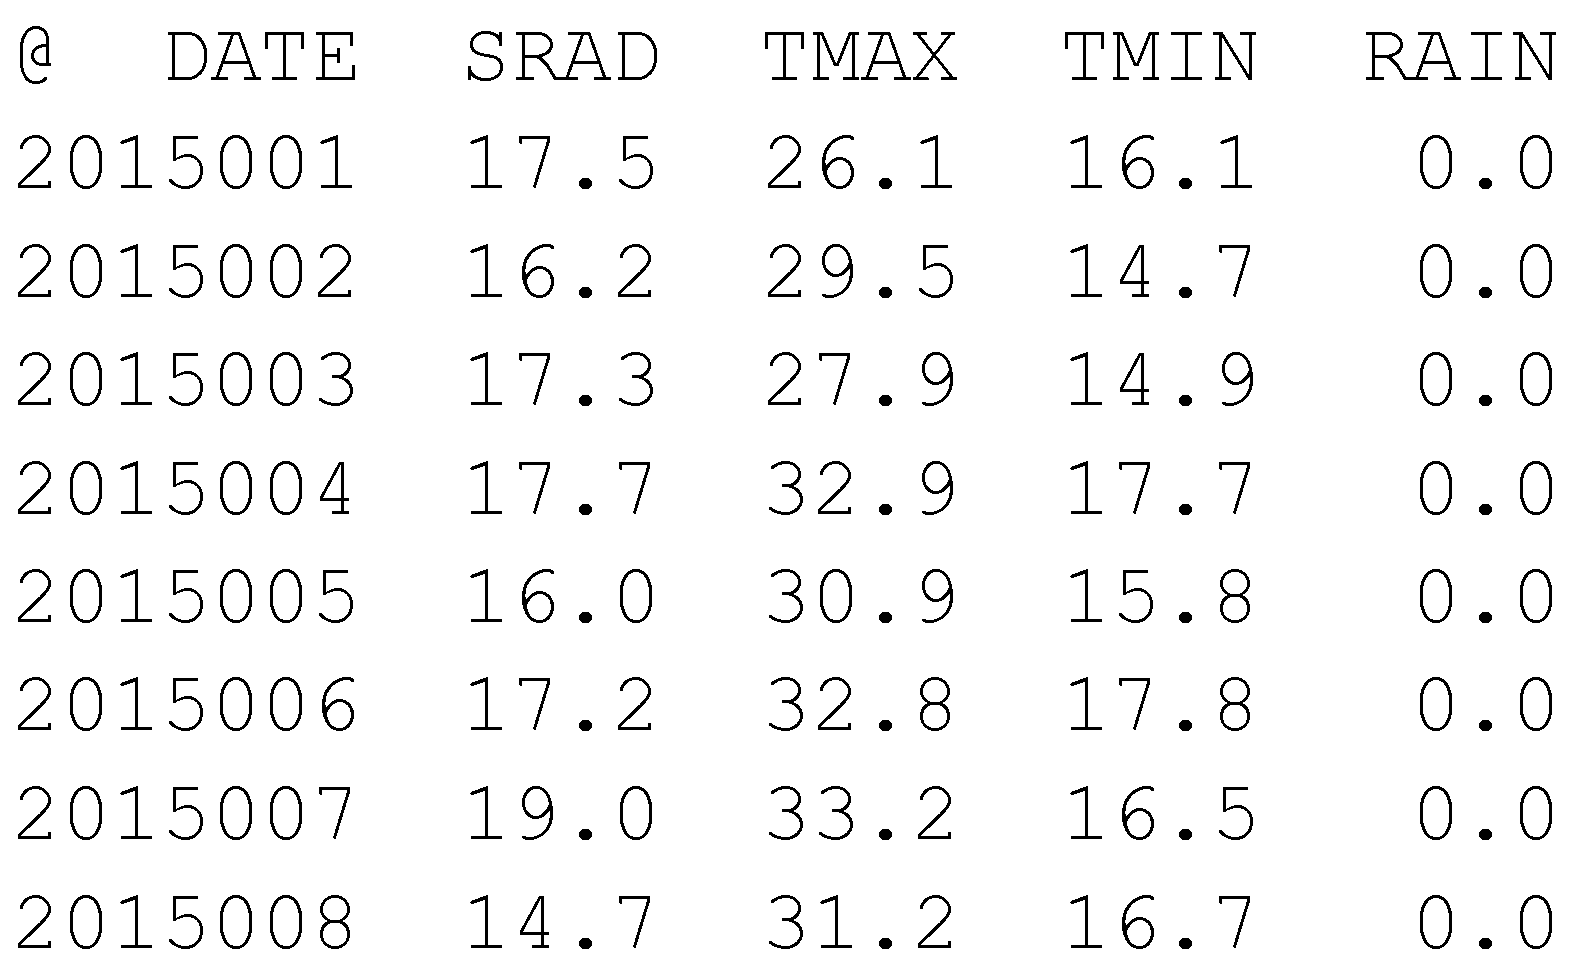
Most weather generators and crop models require daily weather data as inputs. ICASA standard format provides a basis for writing daily weather data (WTH) [
16]. WTH format is written in plain text, with special syntax and formatting rules (
Figure 3). The weather generators used here accept daily weather data in the same format as WTH file (yearly), and longer-term (multiple years) weather files (WTD or WTDE file). Weather file in WTH format is used in Decision Support System for Agro-technology Transfer (DSSAT), one of the most popular crop simulation platforms used today.
2.4. Weather Realizations as Output from the Generator
In this paper, weather realizations are generated and written in WTD or WTDE format. One WTD file represents one weather realization in the specified time span (as defined in the parameter file). The number of WTD files, which represents to total number of realizations, is controlled by the parameter file.
2.5. Addressing Issue on Standarization of Climatological Data and Weather Realization
Many organizations have been working on monitoring and recording weather conditions and then providing those data on the Internet. For the convenience of users, some organizations operate climate data portals while serving data from other organizations. Each data source provides data in their own formats with different protocols. Weather realizations, which are generated from weather generators are in WTD or WTDE format. This growing number of data formats and protocols causes a problem for data exchange and application development. To enable information interoperability from observed and generated data by models, open standard web API can play an important role.
Here, we worked on observed climate and model generated synthetic weather data. To ensure effective and interoperable access to data and services, outputs should be standardized.
International Benchmark Sites Network for Agrotechnology Transfer (IBSNAT) project [
17] developed ICASA standards. ICASA defined standard data formats for documenting experiments and modeling crop growth and development [
16]. The ICASA standards are implemented in plain text in a hierarchical arrangement with major separations among descriptions of management practices or treatments, environmental conditions (soil and weather data), and measurements of crop responses. The goal of the ICASA standards is to provide a reliable and flexible structure for documenting experiment, detailed information is required on weather, soil, crop cultivars, weeds, diseases, pests, and crop management, along with measurements of crop growth and of dynamic soil characteristic.
WTD file is one of ICASA standards, but it is not well-known in other application fields. Moreover, in WTD file, UOM is not shown which can lead to errors in the final result from using mismatched UOM. UOMs of these climate variables, known internally that UOM of SRAD, must be MJ per m2-day. UOM of TMAX and TMIN is degree Celsius and UOM of RAIN must be mm per day. These rules are not known in application fields except agriculture.
2.6. Standard Web Service for Climatic Data
World Wide Web Consortium (W3C) generally defined that web service is “a software system designed to support interoperable machine-to-machine interaction over a network” [
18]. Web services are dynamic applications that can be described, published, located, or invoked over the Internet. Web services use standardized messaging and protocols for exchanging data and communication between applications or systems over the Internet [
18]. Open Geospatial Consortium (OGC) is an international consortium of over 300 industries, governments, and academic institutions established in 1994. OGC has been aiming to develop open specifications for geospatial interoperability including sensor interoperability. According to growing demand on information interoperability in sensor systems, OGC developed Sensor Web Enablement (SWE) for enabling sensors, transducers and sensor data repositories to be discoverable and accessible via web [
19]. SWE framework includes Sensor Model Language (SensorML), O & M and web service named as SOS.
SOS defines a standard protocol and web service interface for discovery and retrieval of real time or archived data produced by sensors or simulation [
20]. Official OGC implementation specification version 2.0 is available on OGC website [
21]. SOS assures interoperability of sensor data in time series format. Sensor data can be referred as observed data from physical sensor or simulated data from a model [
20]. The main objectives of SOS are providing a standard accessing API to observed data by acting as a mediator of data exchange while hiding heterogeneous structure of sensor data formats and protocols. System and system can exchange data without perceiving complicated structure of each site. Effort on data formatting can be dramatically reduced.
Three core operations are required for SOS:
GetCapabilities: This operation allows client to access metadata and list of available operation on SOS server. The metadata is description of sensor data such as location and observed property. The request and response format is defined in XML document as getCapabilities request and getCapabilities response. The full specification is available on SOS 2.0 specification document.
DescribeSensor: This is the operation for retrieving metadata of physical sensors. The metadata is encoded in Sensor Model Language (SensorML).
GetObservation: This operation is for accessing sensor data by allowing spatial, temporal and thematic filtering. The data are returned in Observations and Measurements (O & M) document approved as an OGC standard, which is XML format [
22]. The O & M document is comprised of timestamp, observed property, value, UOM and feature of interest.
As mentioned in earlier section, climatological data published on the Internet are often in arbitrary format as well as arbitrary API to retrieve data. The interface defined in SOS can smoothly serve all features of climatological data. 52North GmbH, which is one of the affiliations of OGC, has been implementing a broad range of services using SOS standardized interfaces. 52North also provides SOS source code packages for constructing SOS services [
23]. Recently, SOS has started to be applied in agricultural applications, such as agricultural decision support application [
24], and crop yield simulation on web application [
24]. They retrieve weather data from various kinds of sensors from various sources through SOS. There are several examples of applications and services, which manage weather data and metadata, using SOS API such as agriculture service application [
24], and crop simulation application [
25]. These applications have been providing information to farmers in Japan, which demonstrates efficiency of SOS in retrieving climatological data that accesses several different sensor systems. National Oceanic and Atmospheric Administration (NOAA) has been utilizing SOS API for providing weather data such as on [
26]. Ministry of Internal Affairs and Communications in Japan accepts SOS as one of the standard APIs for managing agro-environmental sensor data in agriculture [
27].
SOS API is suitable as an intermediate layer for providing weather data to applications. A system can request metadata and data without knowing how the data is stored in the database, but just following the API specification. Applications do not need to prepare data accessing routines for each data source, which reduce the time and cost of programming.
The historical climatological data as input to the weather generators can be directly transformed to O & M format and be served via SOS API. Users can obtain historical climatological data through getObservation request. The response is historical weather data and metadata encoded in a standard O & M document, which secure the interoperability on data.
Weather realizations have a unique characteristic. They have multiple values at the same location, same phenomena and same time. For example, maximum temperature on 2016, DOY = 1 take different values in 100 scenarios. Due to this uniqueness, we cannot simply transform them to SOS mechanism. In order to standardize weather realizations and make them available online, we need to develop a method to describe these conditions.
3. Design and Implementation
The earlier sections described characteristics of weather generation models, business process of the models, user experiences and related technologies. In order to design efficient web services for serving user requirement, understanding of the business process and the behavior of the models is essential [
28]. Thereafter, we designed system requirements and implement web service architecture in order to facilitate weather generators’ accessibility as well as mechanism to share identical weather realizations without repeating stochastic generation process.
The design constraints of weather generator web service are global accessibility through resource identification, standardize interface and service interoperability.
Global accessibility through resource identification: All resources, historical climatological data, weather realization, weather generator models and data transformation in the system should be defined in unique form in order to enable interaction over network.
Interface Standardization: Climatic service interoperability is an essential requirement of this development. Interfaces of retrieving historical climatological data and weather realizations should be in standard format in order that users need not spend time on learning various interfaces. Historical weather data are provided in compliance with SOS interface. Weather realizations are provided in compliance with both ICASA standards and O & M format.
Program interoperability: Weather generator programs that are written in diffirent programing languages should be able to register to the web service.
Classification of user role: Currently, the role of users are blended together. It means that users who want to aquire weather realization also need to manage the weather generator program. Classification of user role will separate users from service providers and from weather generator programmers.
We developed a web service framework for providing weather generator models based on Representational state transfer (RESTful) principle [
29] by utilizing Jersey libraries toolkit [
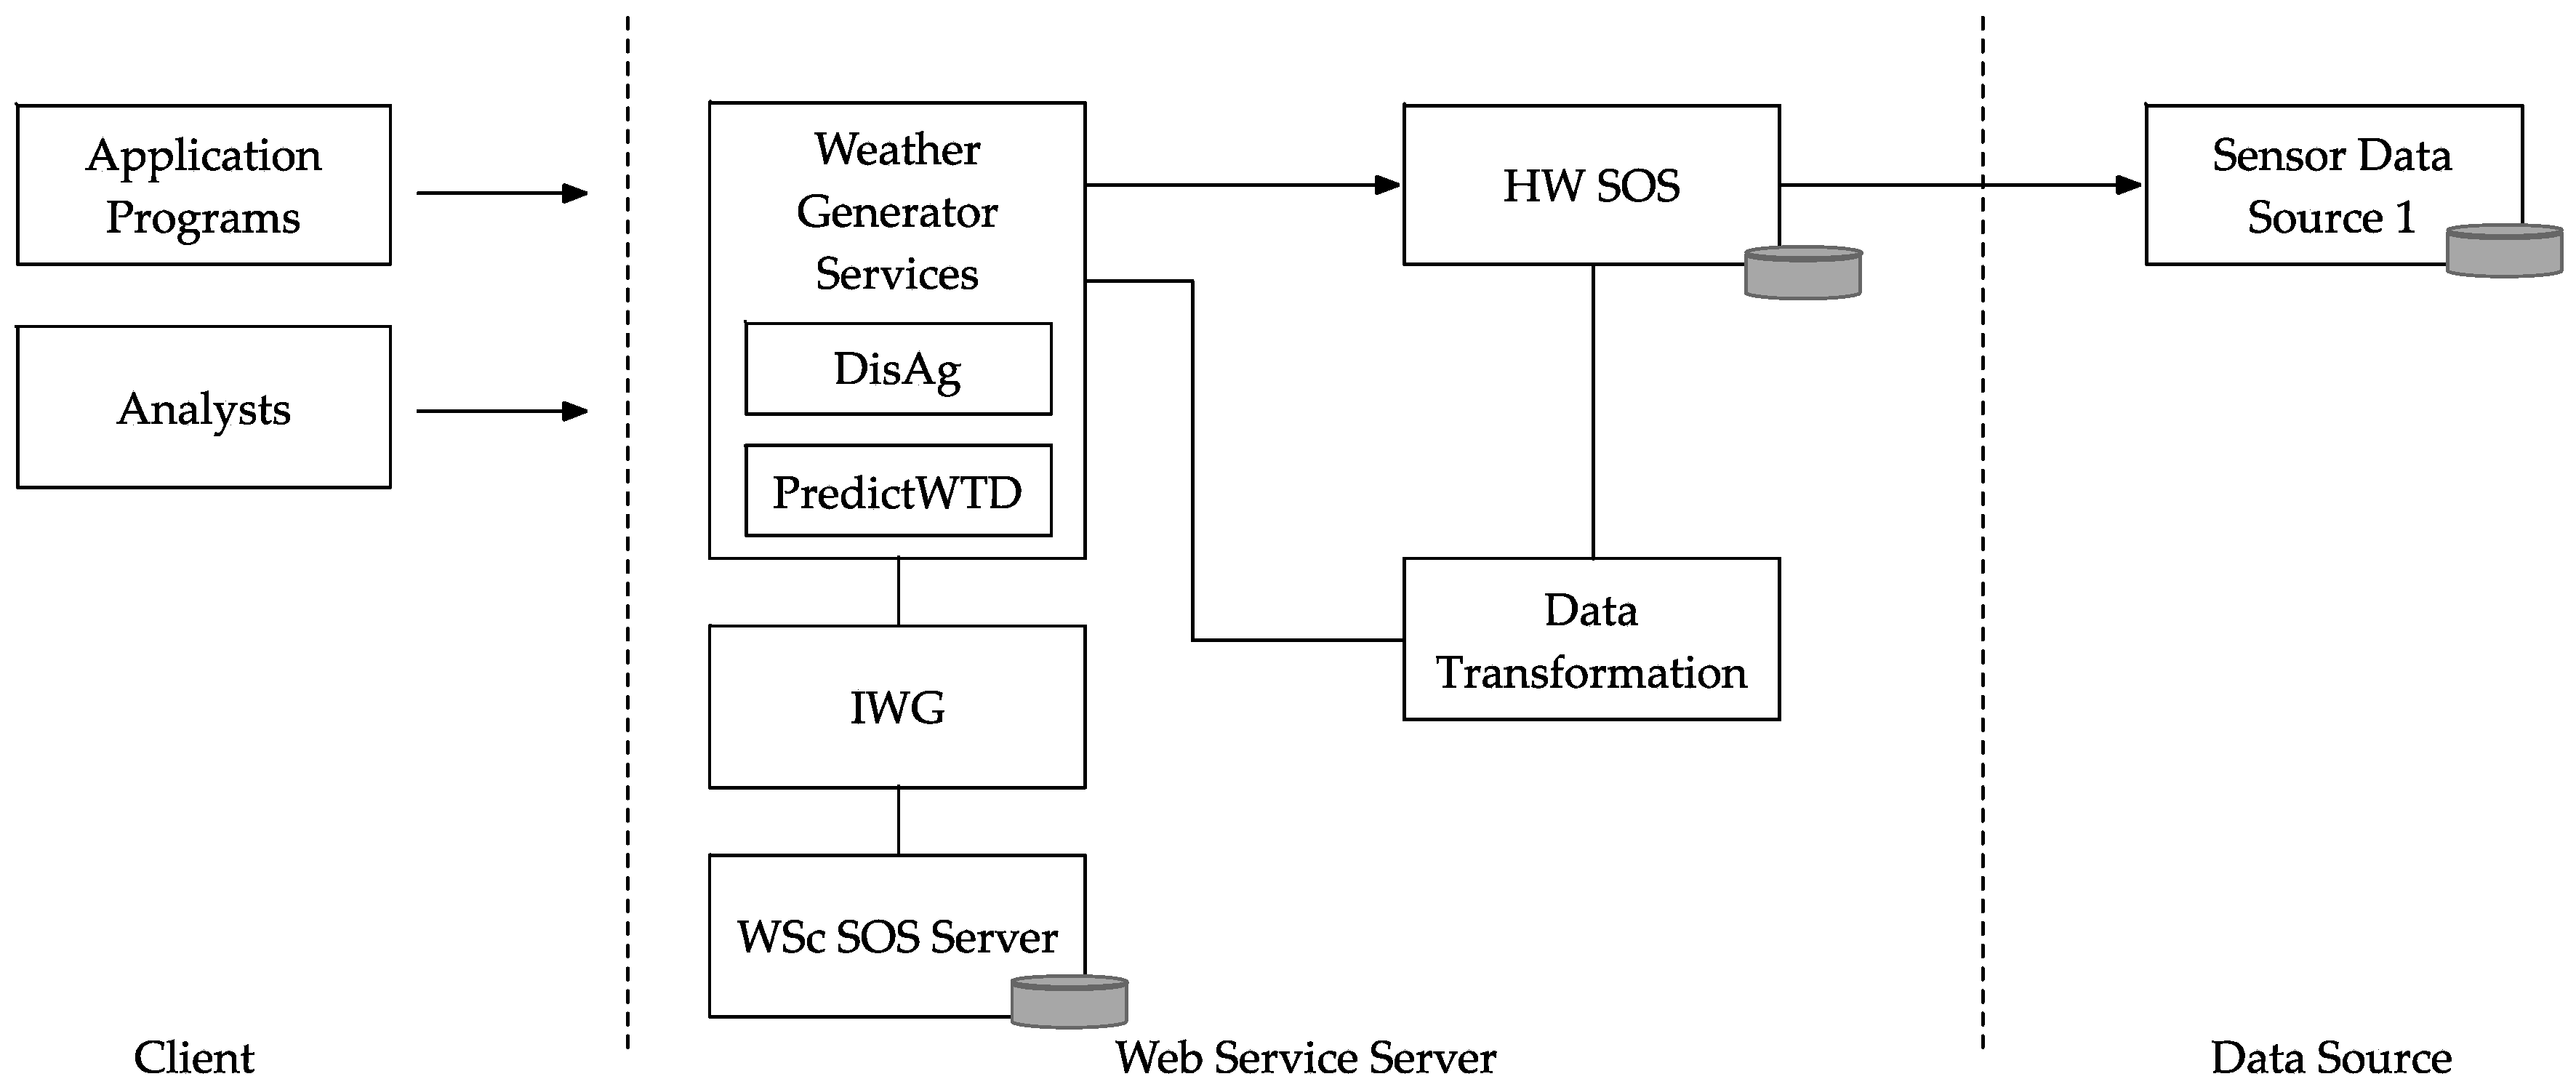
30]. The architecture consists of several components, as shown in
Figure 4. Each component is wired to one another to provide sufficient and interoperable services. The architecture diagram is divided into three main parts: Client, Web Service Server and Data source. The main development in this research is Web Service Server part. Details of each part and component are described as follows. The system has been deployed on Amazon Web Service (AWS), a cloud computing service [
31], for scalability and future migration purposes.
3.1. Client
In this system, clients can be either application programs, such as agricultural web applications and decision support system application, or human analysts. Clients can call directly all services provided in Web Service Server. Clients only need to know interfaces for acquiring data. Based on this design and implementation, ordinary users, model developers and service providers are separated. Clients need not manage the weather generation models by themselves.
3.2. Data Source
Data sources that can be connected to this system must provide climate data in a web-accessible way. In this research, we focus on data sources that comply with SOS. This research is a part of an agricultural project that uses a SOS platform named cloudSense [
32]. cloudSense is a sensor cloud service platform that is acquiring sensor data from various sources then providing SOS API to serve climatological data to applications. The data sources include MeteoCrop DB [
33], which generates agro-weather data using national weather station network of Japan Meteorological Agency (JMA) and other local weather stations in Japan [
34]. We used data from Gamagoori node of MeteoCrop DB for demonstration purposes. Various weather variables are available on cloudSense though we only focus on the four variables required as input to weather generators.
3.3. Web Service Server
This part is a main development in this research. It is a service provider and internal wiring management. There are four inter-connected components in this part. These service components can also be viewed as resources upon which HTTP methods can be invoked.
3.3.1. Historical Weather Service
Based on 52°North’s SOS package [
35], we developed historical weather service, hereinafter referred to as HW SOS, to provide weather sensor observations via standard SOS operations and data format. HW SOS acquires possibly incomplete climatological data from external sources through cloudSense [
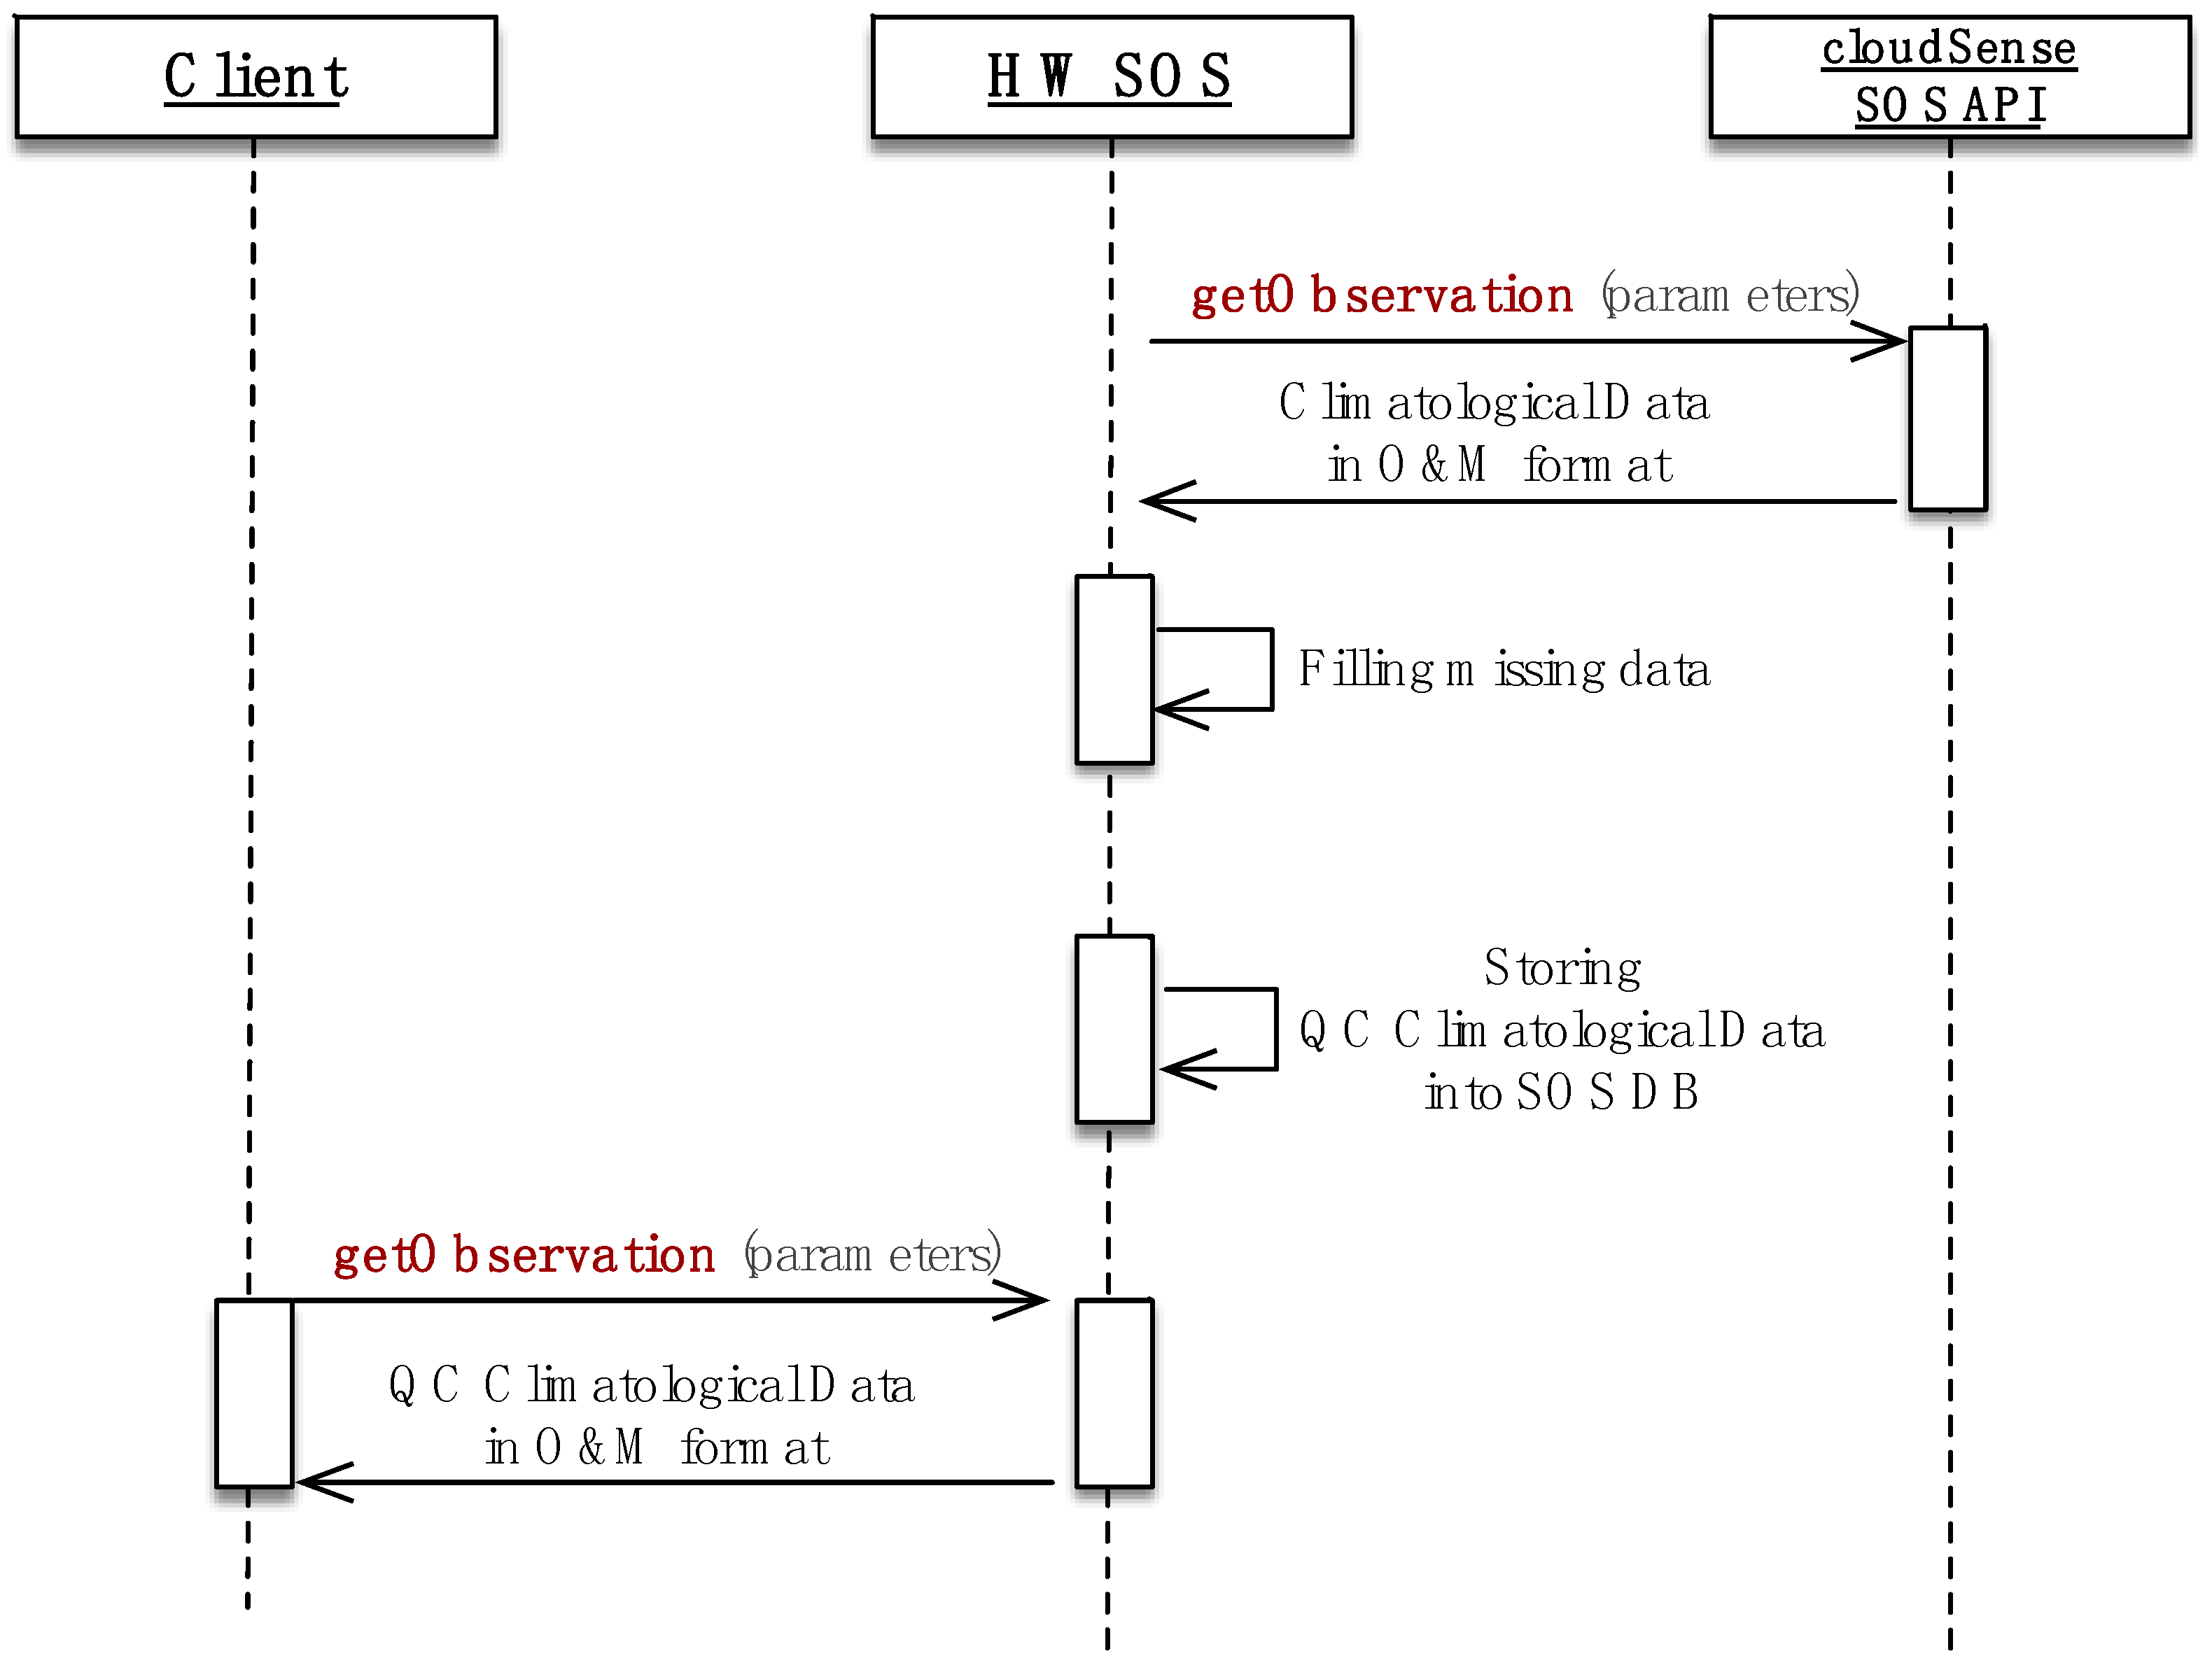
32], and then fills missing data so that weather generators can obtain complete datasets. In the case of missing data, a component for filling missing data is implemented internally in the HW SOS. It searches for a date with missing data and fills it with nearest data available of the same DOY. Standard methods for filling missing data include nearest neighbor (as implemented in this service) and geospatial interpolation, among others. This service provides data for both internal use and external use. Internal use means it supplies long-term climatological data to weather generator in order to generate weather realization. For external use, users can directly call this service for receiving historical weather data or climatological data through SOS API. Moreover, HW SOS can also serve external SOS users via standard and public SOS API. When someone wants to connect a data source to the framework, a new HW SOS Server component will be generated. The component initially connects to the data source at design time, then specific data, in this case, location and time span, have to be identified at runtime.
We implemented the test bed service for HW SOS as described in
Figure 5. HW SOS has data feeder internally for connecting to and acquiring climatological data from data source, cloudSense. HW SOS initiates connection with cloudSense and retrieves long-term climatological data using GetObservation operation. After receiving the data, HW SOS fills missing data and then stores complete set of climatological data, called quality controlled climatological data (QC climatological data), into SOS database (SOS DB). HW SOS has its own service endpoint for serving data to clients as well as providing QC climatological data to weather generators. The service endpoint of HW SOS is publicly available on [
36]. Clients can test SOS API on a Java Script SOS client on [
37]. Visualization of HW SOS on web map is also available on [
38]. SOS API document is also available on [
39].
Two main operations of SOS API, GetCapabilities and GetObservation, are described here.
GetCapabilities
Users can ask for available resources of HW SOS by issuing GetCapabilities request to service endpoint. Service endpoint and parameters of GetCapabilities are demonstrated in
Table 1.
The response is encoded in XML. The “Value” tag lists available locations that provide climatological data. The important part of the response is visualized as follows.
<ows:Parameter name="procedure">
<ows:AllowedValues>
<ows:Value>http://www.hondalab.net/weatherhistories/weatherhistory_urn:IBUNYA:AMeDAS-NIAES:GAMAGOORI-51281</ows:Value>
<ows:Value>http://www.hondalab.net/weatherhistories/weatherhistory_urn:IBUNYA:AMeDAS-NIAES:KATSUNUMA-49151</ows:Value>
<ows:Value>http://www.hondalab.net/weatherhistories/weatherhistory_urn:IBUNYA:AMeDAS-NIAES:KOFU-49142</ows:Value>
<ows:Value>http://www.hondalab.net/weatherhistories/weatherhistory_urn:IBUNYA:AMeDAS-NIAES:KOSHINO-57051</ows:Value>
<ows:Value>http://www.hondalab.net/weatherhistories/weatherhistory_urn:IBUNYA:AMeDAS-NIAES:MIKUNI-57001</ows:Value>
<ows:Value>http://www.hondalab.net/weatherhistories/weatherhistory_urn:IBUNYA:AMeDAS-NIAES:MINAMICHITA-51311</ows:Value>
<ows:Value>http://www.hondalab.net/weatherhistories/weatherhistory_urn:IBUNYA:AMeDAS-NIAES:NAGOYA-51106</ows:Value>
…
</ows:AllowedValues>
</ows:Parameter>
This response also describes available observed property and their time ranges on this HW SOS. The value in each “Value” tag can be used in GetObservation for acquiring climatological data.
GetObservation
For retrieving climatological data, clients issue GetObservation request to the service endpoint and identify location using offering parameter as described in
Table 2.
The response is an O & M document that contains climatological data with four climate variables.
3.3.2. Core Weather Generator Service
This component is to provide weather generator as services to clients. Legacy weather generator programs DisAg and predictWTD are wrapped into web service framework. This component initially wires to HW SOS Servers for retrieving long-term climatological data to be an input to the weather generator programs. Each weather generator web service has its own service endpoint for users to invoke. The complicated structure of legacy weather generator models is hidden behind the web service framework. The essential parameters described in
Figure 5 (e.g., param_WTD.txt) for running the model are translated into service parameters. Concatenation of service endpoint and URL parsing technique is applied for inputting climatological data into the models. Weather realizations as output from these weather generator services are in WTD or WTDE format.
We exposed two testbed services for DisAg service and predictWTD. Each service and its parameters are described in
Table 3.
- (1)
DisAg weather generator web service (DISAGWS)
This is a web service, which wraps DisAg weather generator program into the framework. The complicated structure of legacy DisAg program is hidden behind. We simplified the service by allowing users to invokes the program using HTTP GET. The service parameters are minimized and described in
Table 3.
Example request for requesting 10 scenarios of weather realization from weatherhistory_urn:IBUNYA:AMeDAS-NIAES:GAMAGOORI-51281 is as follows.
<weatherScenarios>
     <wgmodel>
         <name>DISAGWS + MonthlyTrendAdjustment</name>
         <calibration-parameter         href="http://weatherscenarios.s3-website-ap-northeast-1.amazonaws.com/zmguaajsnlzjazkfmhhp/COMM.PRM"/>
     </wgmodel>
     <from>2016,1</from>
     <to>2017,1</to>
     <historicalWeather                 href="http://weatherscenarios.s3-website-ap-northeast-1.amazonaws.com/ofubqbkjfumhrsrthkrp/COMM.WTD"/>
     <scenario                          href="http://weatherscenarios.s3-website-ap-northeast-1.amazonaws.com/kllakumanzivatjxemwk/COMM0001.WTD"/>
<scenario href="http://weatherscenarios.s3-website-ap-northeast-1.amazonaws.com/kllakumanzivatjxemwk/COMM0002.WTD"/>- (2)
predictWTD weather generator web service (PDISAGWS)
This is a web service that wraps predictWTD weather generator model into itself. Wrapping mechanism is as same as DisAg service. predictWTD accepts climate forecast represented by probability of BN, NN and AN. Users can invoke the service using HTTP GET and parsing parameters as described in
Table 4.
Example request for requesting 10 scenarios of weather realization from weatherhistory_urn:IBUNYA:AMeDAS-NIAES:GAMAGOORI-51281 is as follows.
HTTP GET Request
Result: XML document that contains the list of URLs to weather realization in WTD format, model name, climatological data and stochastic model parameters file is returned. The structure of XML document is same as the response from DisAg service.
3.3.3. Weather Realization Sharing Service
The core weather generation service described in the previous section responds to user’s individual requests. The weather realizations generated differ each time even the requesting parameters are the same as it uses a stochastic method. When several applications are serving to multiple users in common regions, they need to use same weather realizations. Thus we implemented a novel mechanism which multiple users can share the same set of weather realizations. The mechanism provides weather realizations under normal forecast condition as the seasonal forecast scenarios vary according to individual user’s needs. In order to give maximum interoperability, the weather realizations are encoded to O & M documents. Weather realization scenarios by SOS (WSc SOS) and Intermediate Weather Generator (IWG) are stacked to serve sharing of weather realizations. WSc SOS is for caching weather realizations and providing them through SOS. Based on specific location of user request, IWG searches for weather realizations that has been archived in WSc SOS Server. If none of weather realization in WSc SOS matches the request, weather generation service will be called for generating the weather realizations. The generated weather realization will be stored into WSc SOS and returned to the user in in O & M documents.
The detail of two services are described as following.
WSc SOS Server archives weather realizations and publish them as SOS. WSc The weather realizations generated by IWG are encoded in O & M document are stored in WSc SOS server. WSc SOS itself is an independent service, thus it is possible for clients to call WSc SOS service as well.
The challenge of sharing weather realization on SOS is a unique characteristic of weather realization. Weather realizations have multiple values at a same location, same phenomena and same time, i.e., maximum temperature on 2016, DOY = 1 may have different values in a different realization. Due to this uniqueness, we cannot simply transform them to comply with SOS standard. In order to standardize weather realizations under SOS and make them available online, we introduced a naming rule for describing each scenario of weather realization in order that we can refer to it.
We utilize URN concept for referring to each weather realization. Furthermore, we use this URN as a filter parameter for offering tag in the getObservation request. The URN of weather realizations needs the format as follows.
where
scenario is a constant word;
n is a scenario number of weather realization;
generator is a constant word; and
G is name of weather generator which is used for generating weather realization.
    In this research, DISAG refers to DisAg weather generator and PDISAG refers to PredictWTD weather generator.
Climate forecast is constant
C refers to seasonal climate forecast scenario.
In this research, we only provide normal forecast, which is BN = 33, NN = 34, and AN = 33. The keyword to refer to is “NORMAL”.
foi is the abbreviation for feature of interest. It is used to refer to a specific location, which is a physical weather station name in source SOS.
The URN of the first weather realization generated from historical weather data; foi = urn:IBUNYA:AMeDAS-NIAES:GAMAGOORI-51281 is generated by DISAG weather generator as scenario_1_generator_DISAG_climateforecast_NORMAL_foi_urn:IBUNYA:AMeDAS-NIAES:GAMAGOORI-51281
IWG is developed for improving efficiency of weather generator web service and promoting caching and sharing for weather realizations. IWG allows client to request weather realizations by specifying location in latitude and longitude with acceptable distance to weather station. Service endpoint of IWG and parameters are shown in
Table 5.
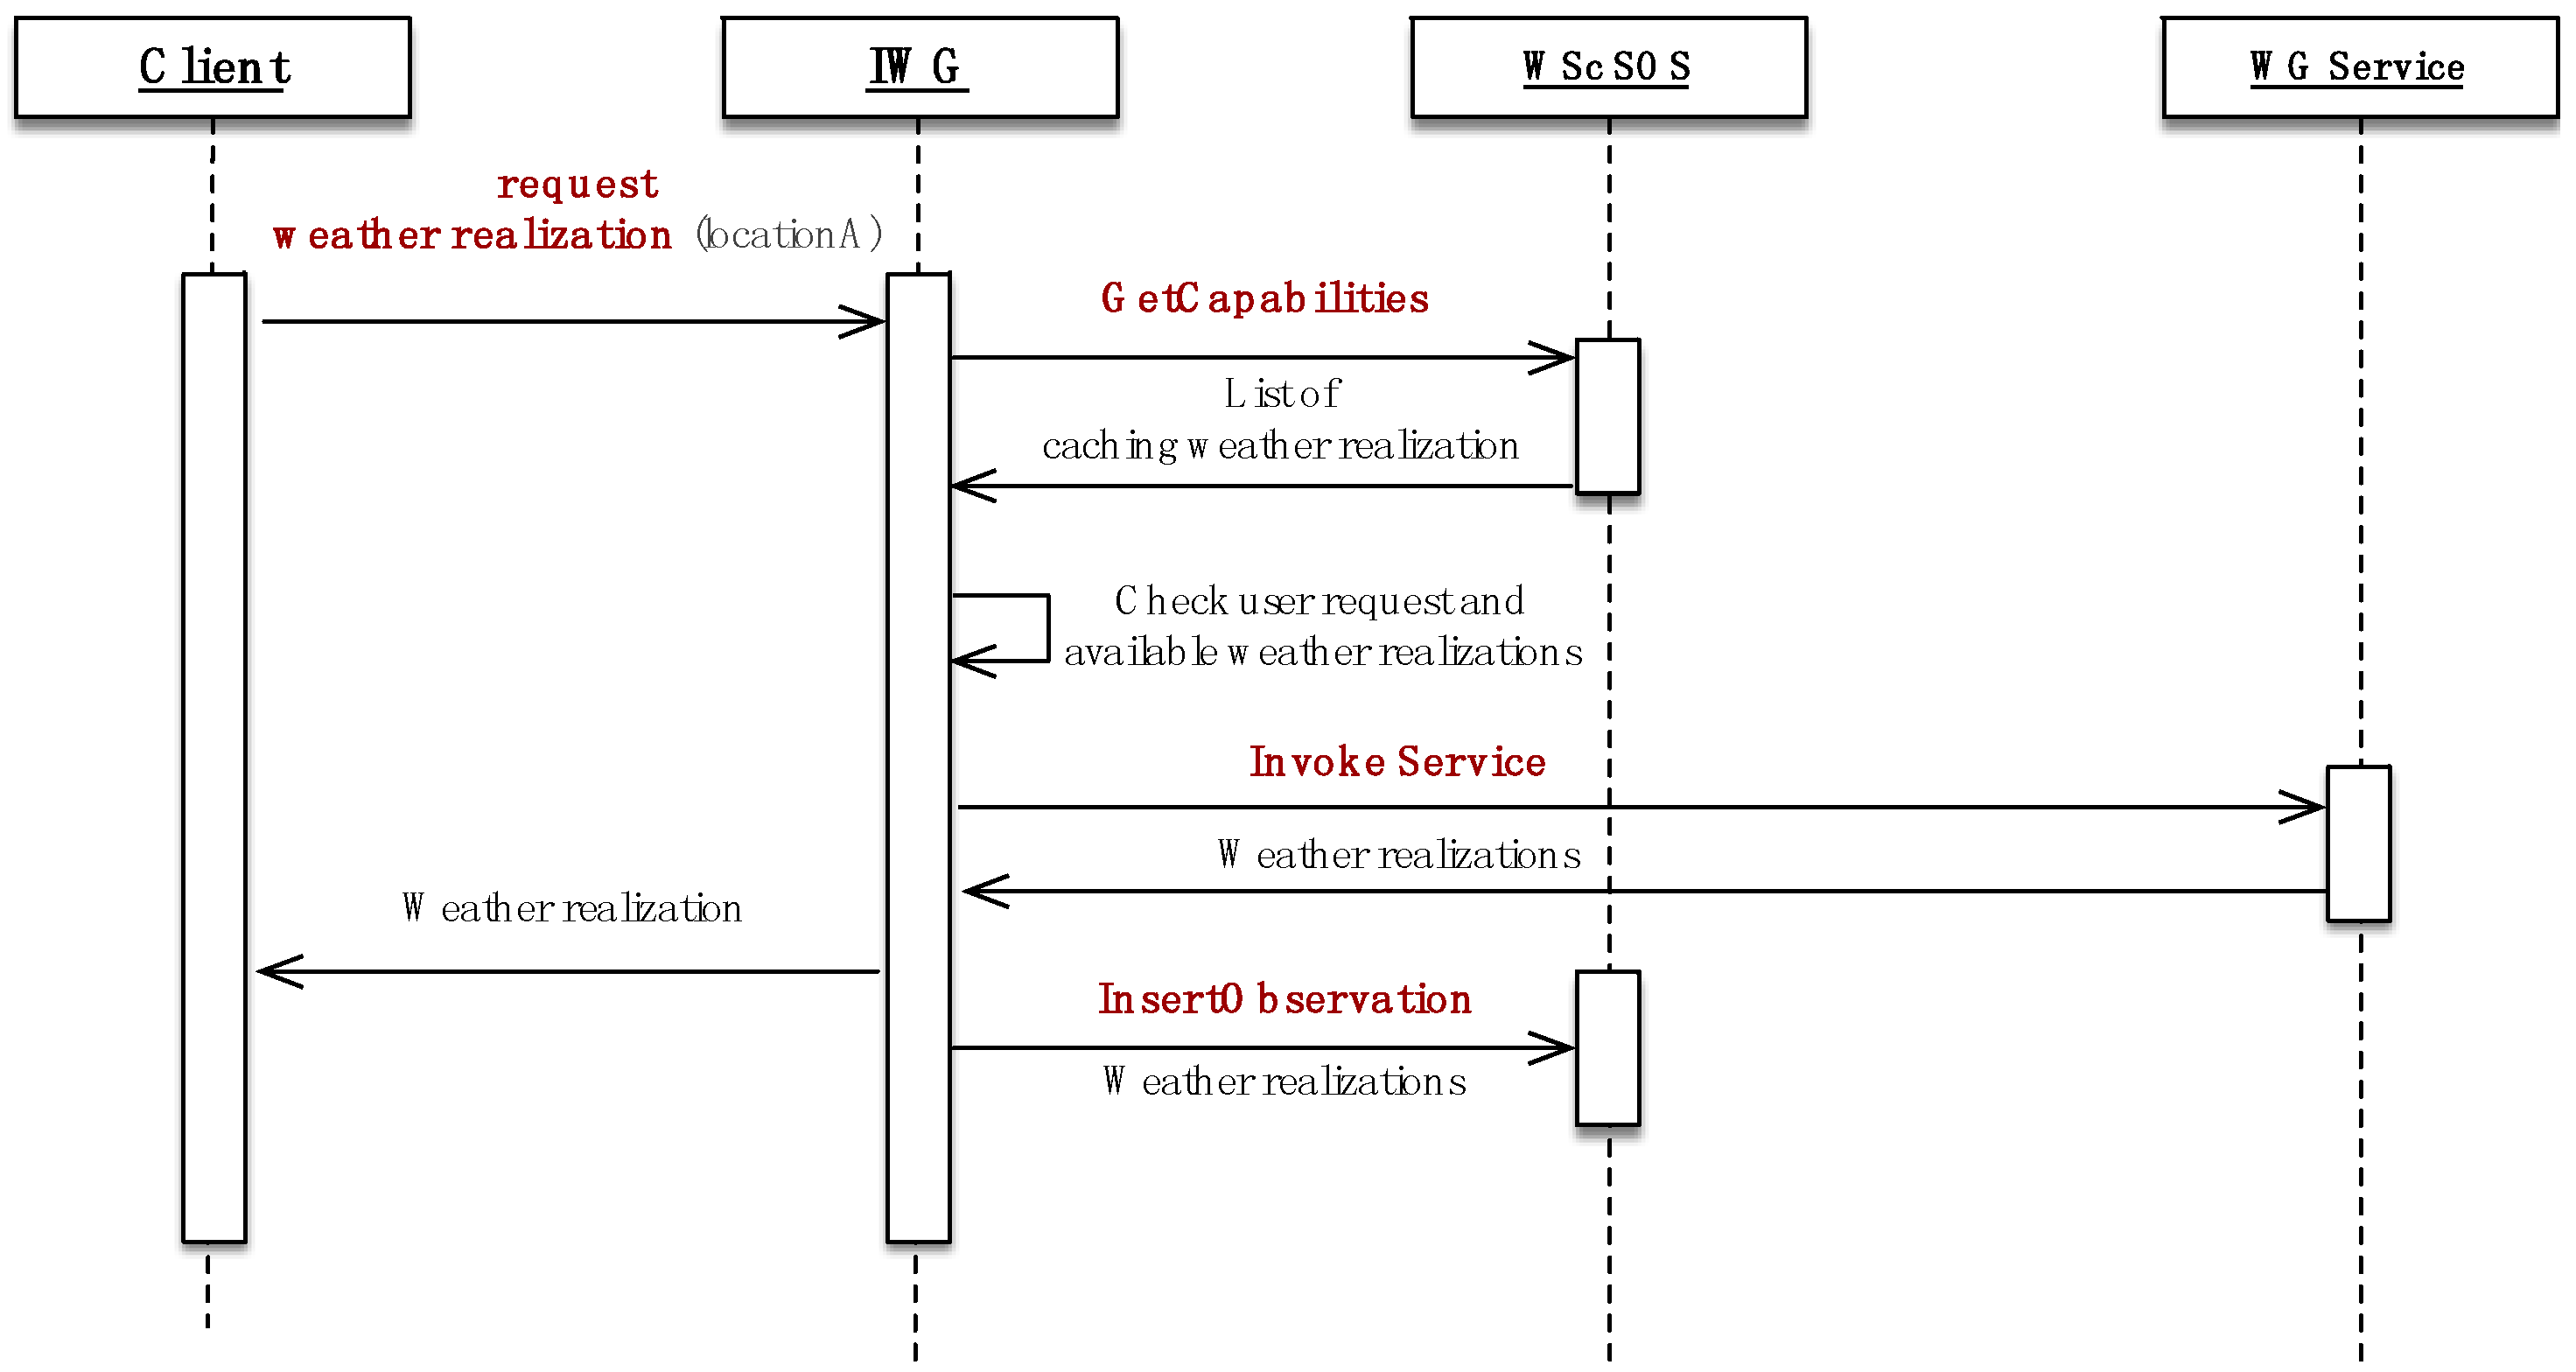
Figure 6 demonstrates the workflow for sharing weather realizations using IWG service and WSc SOS. When a user invokes service of IWG, IWG will first search for caching weather realizations on WSc SOS by issuing GetCapabilites request. If the list of available weather realizations matches user’s request, the weather realizations are returned to user. If not, IWG invokes weather generator (WG) service for generating weather realizations and returns them to user. At the same time, the generated weather realizations are cached to WSc SOS using InsertObservation operation. An operator of this framework may use IWG to prepare weather realizations for all available historical weather data in order to give fast response to clients for a better service in a region.
The weather realizations generated are stored in WCs SOS. User can invoke the service through SOS API. Service endpoint and parameters are explained in
Table 6.
3.3.4. Data Transformation Service
This service is for data formatting purpose. It is designed for switching data format to match user requirement and model requirement. In this system, transformation of O & M format to WTD is implemented. If output of one component cannot be directly used as input of the next component, data transformation service will be called. We designed this service by allowing parsing the link of data to service endpoint using concatenating method.
Table 7 provides information and parameters of this service.
Example request for transforming O & M to WTD is as follows.
4. Case Study
Several studies utilized DisAg and PredictWTD model for generating weather realizations in order to predict yield by crop modeling for example [
9] and [
40]. This section demonstrates two case studies in which weather generator web services are used for preparing weather realizations. The generated weather realizations are in WTD format following ICASA standard as for the input to DSSAT crop model.
The study area for both cases is in Gamagoori City, Aichi Prefecture. Gamagoori is nationally recognized for horticulture crops especially for mandarin oranges. Small rice fields are also spread around the city. Climatological data (1979–2016; 37 years) were derived from MeteoCrop DB [
33]. The station’s name is urn:IBUNYA:AMeDAS-NIAES:GAMAGOORI-51281. This station is located at 34.845 degrees latitude and 137.217 degrees longitude.
Table 8 shows monthly average of daily SRAD, TMIN, TMAX and monthly precipitation total of climatological data in the location. In Japan, during early summer (June to July) is called “baiu”. Baiu is a cloudy and rainy period. SRAD in period is lesser, even if the sun elevation is high compared with non-Baiu period.
Weather realizations were generated from March to December to cover the rice season, which is around April to October for the center of Japan.
4.1. Case Study 1: This Case Used DISAG Web Service for Generating Weather Realizations That Follows Climatology. The Sample of HTTP GET Request and Parameters are Described in Table 9
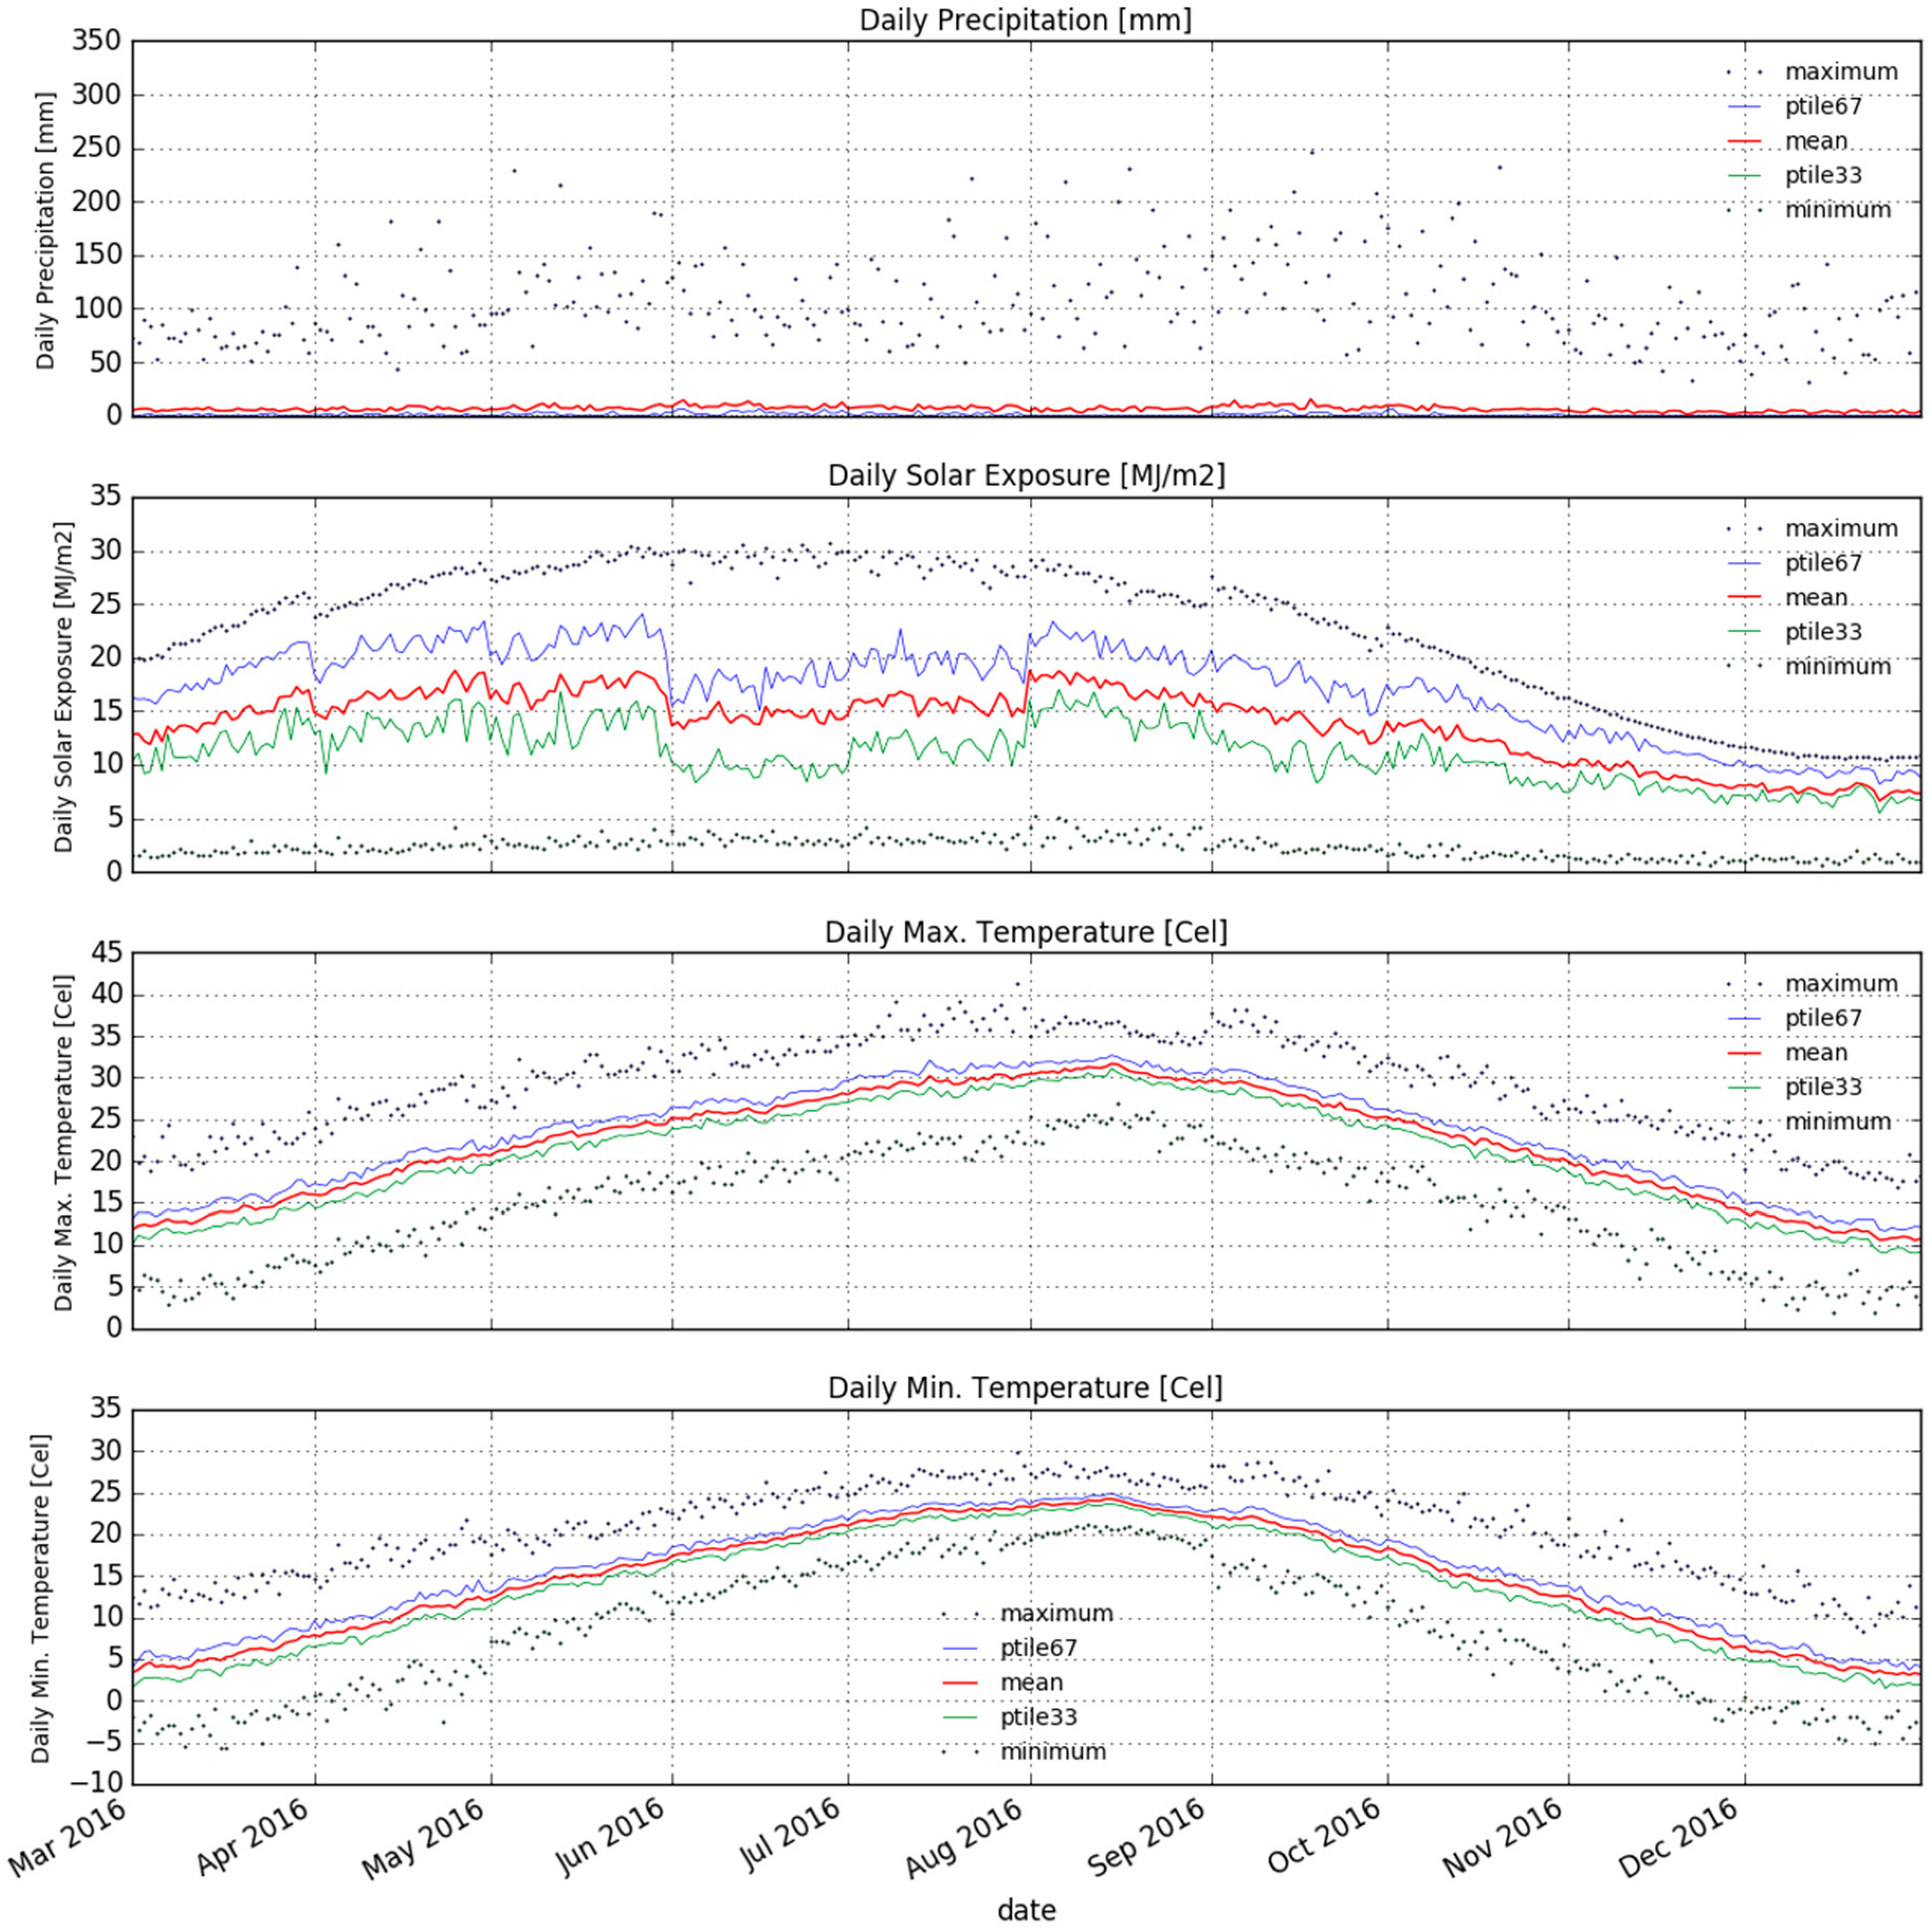
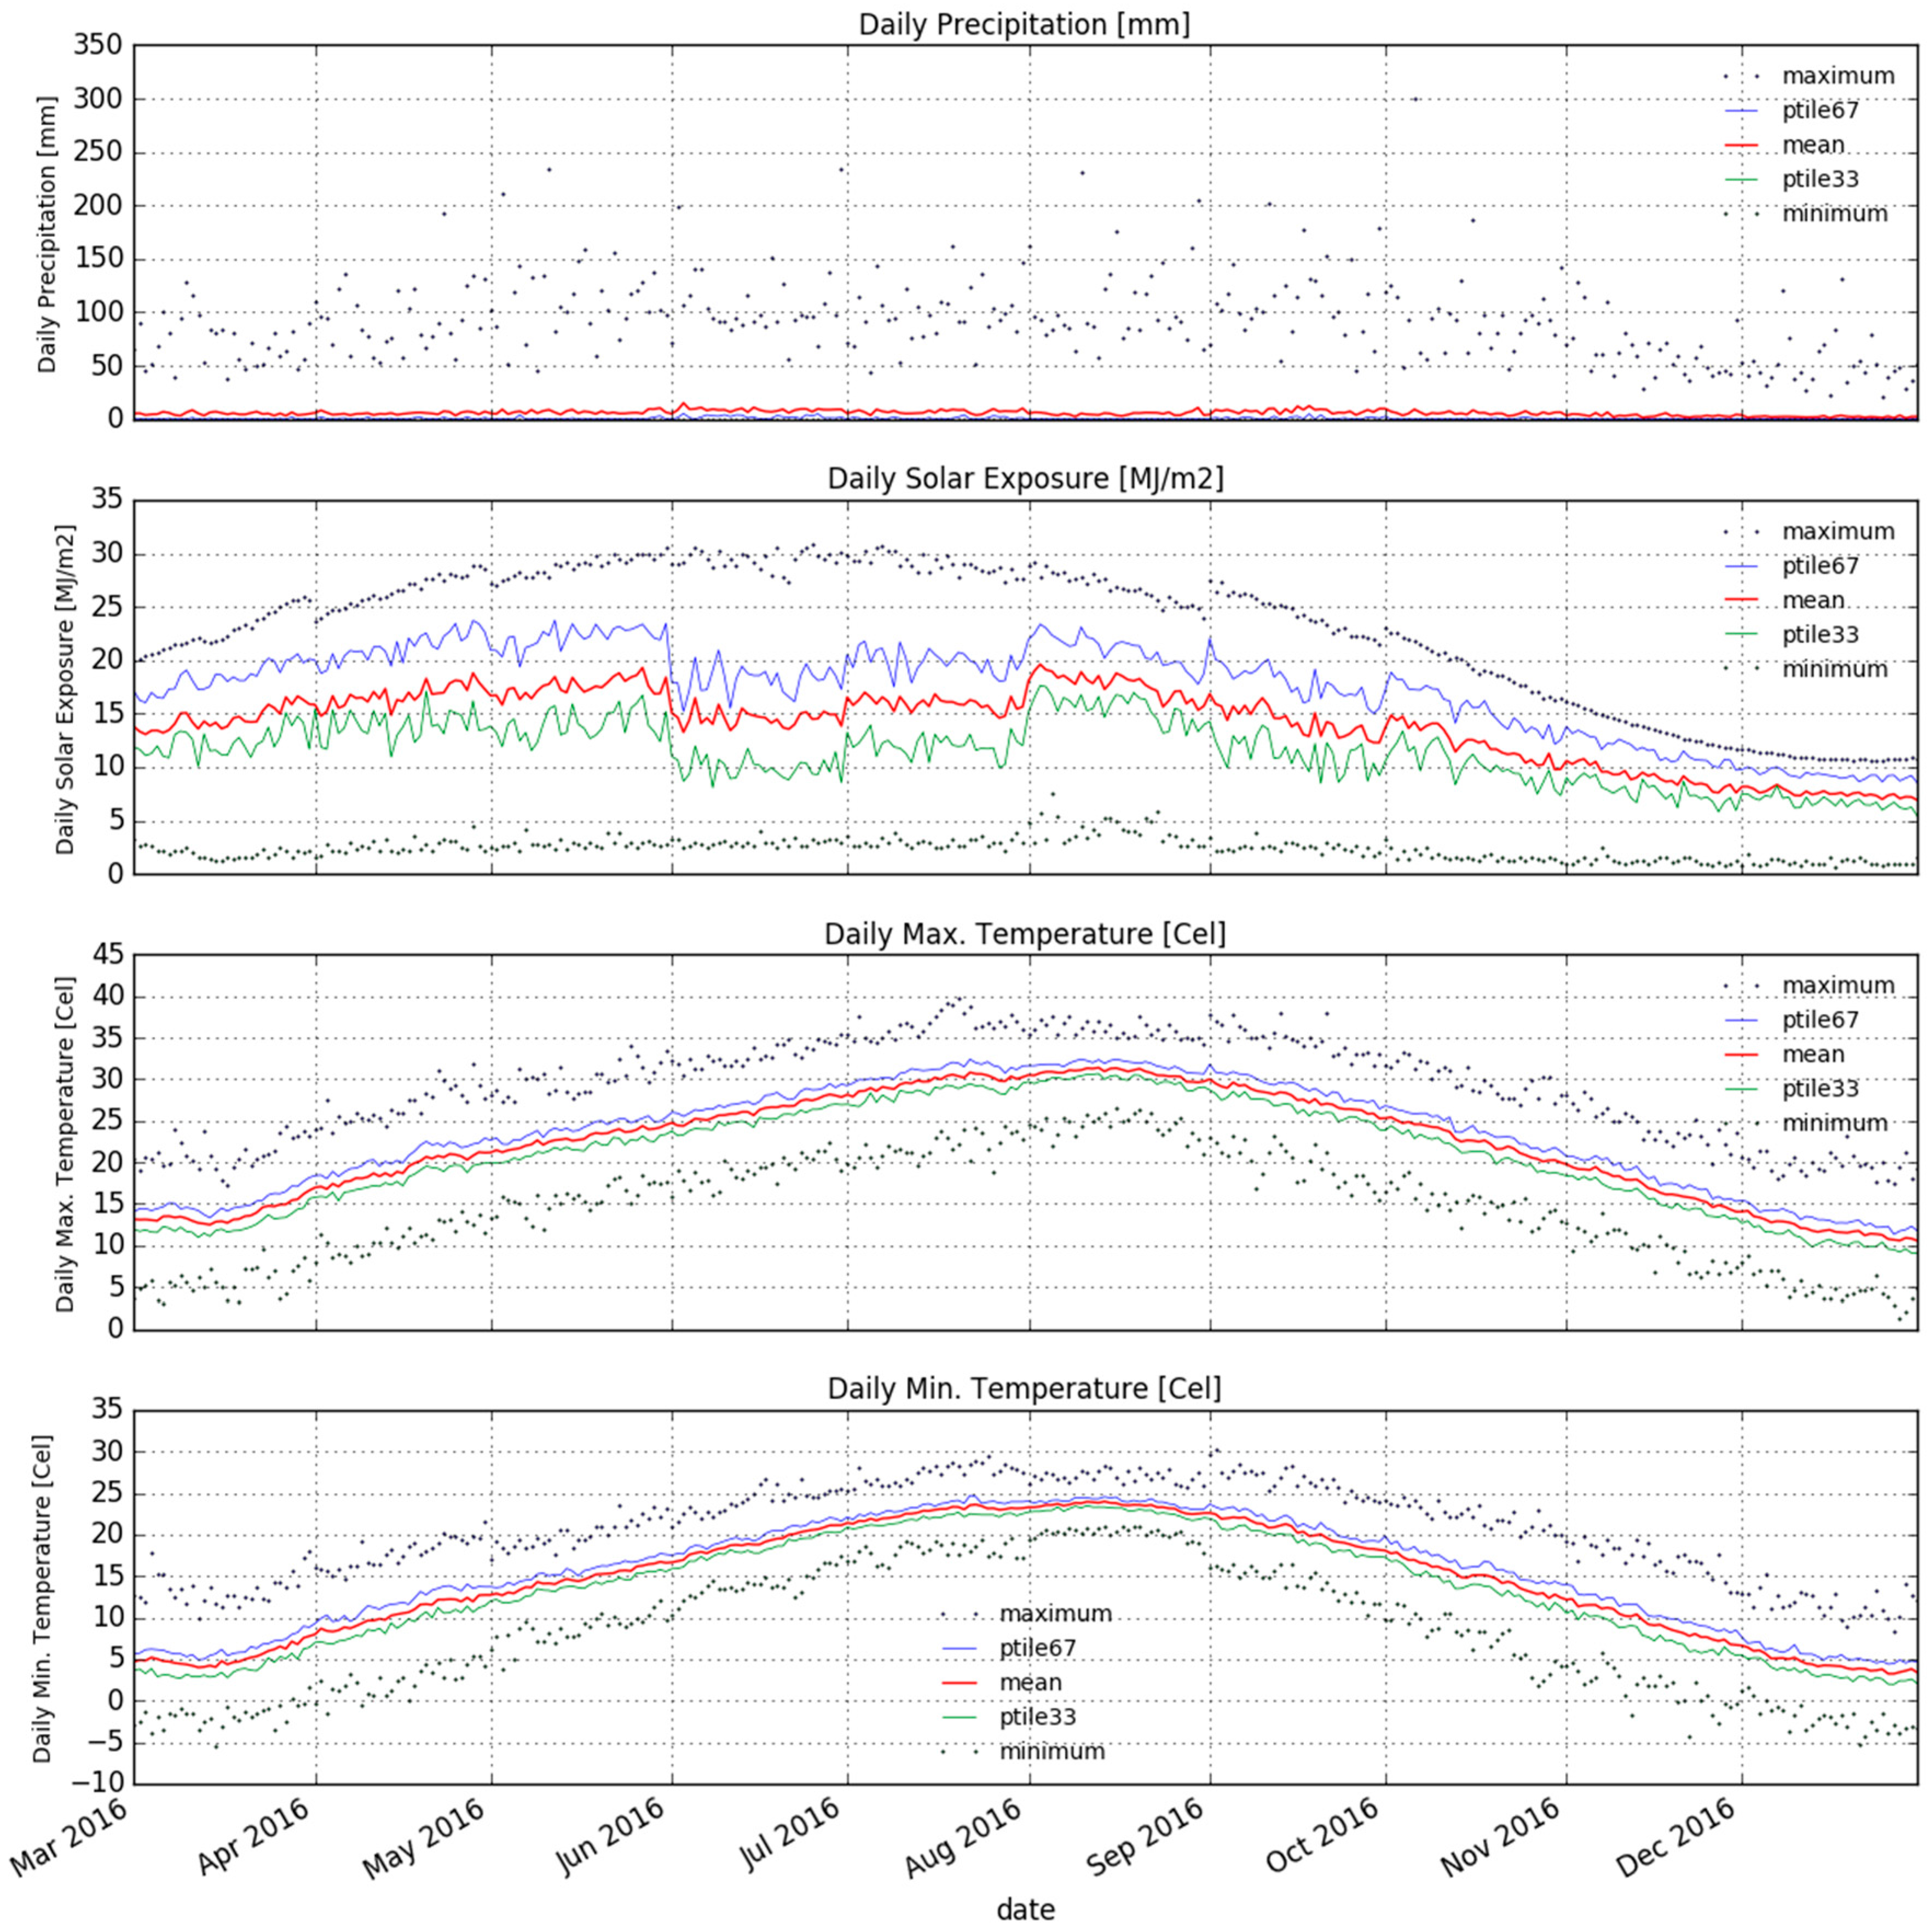
One hundred weather realizations were generated. The return from the service is the list of URL of the weather realizations encoded in XML document. The graph of hundred weather realizations is visualized in
Figure 7. Each weather realization contains daily maximum temperature, daily minimum temperature, daily solar exposure and daily precipitation from 1 March to the end of December, which covers one rice season. The graph shows mean, minimum, maximum, 33rd percentile and 67th percentile of each climate variable. Discontinuity in solar exposure, as seen at the beginning of June and the end of July (rainy period), occurs because the weather generator simulated SRAD conditioned on rainfall, i.e., when it is a wet day, SRAD is generated from a wet-day model, and vice versa. Since June and July is the Baiu period, the drop in simulated SRAD was expected.
4.2. Case Study 2: Generating a Hundred Weather Realizations Using PDISAG Web Service by Considering Seasonal Forecast Scenarios. HTTP GET Request and Parameters Are in Table 10. The Climatological Input to the Service is Same as the Case Study 1
We assume that climate forecast scenarios are BN = 15, NN = 32 and AN = 53. For probability of precipitation, 15%, 32% and 53% are considered below average, near average and above average, respectively.
Figure 8 shows a graph of mean, minimum, maximum, 33rd percentile and 67th percentile of each weather variable. As we assumed a higher probability of AN to precipitation, the monthly precipitation total in case study 2 is about 13% higher than case study 1.
4.3. Performance Testing
The average of response time to obtain the URL list of the realizations in both case studies is 46.2 s, which is efficient for practical applications. The response time depends on data preparation processes. A larger file of long-term climatological data needs more time to parse than the smaller one before the weather generator services.
5. Summary and Discussion
The web service framework proposed in this research is novel as it extends usability of weather generators to researchers over the Internet. The responses of the services also provide certain level of traceability information and how the weather realizations were generated. Researchers from a small team without capacity to operate their own weather generator model can utilize these services and focus on their business logic for solving specific problems.
The framework ensures interoperability of the service and data using SOS and O & M documents as well as proposing sharing mechanism for identical weather realizations. Legacy weather generator programs are wrapped into RESTful web service. The complicated structure of weather generator model is hidden behind the framework. The procedure for running weather generators becomes simpler by HTTP. Users do not need to handle complicated structure of input file format. Users only need to know the service endpoint and parameters to generate weather realizations. Users’ role is clearly separated between model providers, service providers, and general users who only want to get the result from the model. The time for manual data preparation can be dramatically reduced by utilizing the data preparation service. Climatological data source, HW SOS, data transformation service and weather generator model are seamlessly wired. Long-term climatological data, the essential input of weather generator, is passed to the models using concatenation mechanism. It is convenient for users to pass data to the model without downloading and uploading data back and forth across server and a local machine.
Gridded climatological data become increasingly available at various scales. Connecting gridded climatological data to weather generator web service can contribute for analyzing the impact of climate changes or risk assessment on every area such as remote farmland in rural areas without weather stations. Weather generator services are implemented in compliance with SOS standard. Any climatological data sources which provide data in SOS format can be directly connected for generating weather realizations [
6] implemented SOS API for acquiring gridded climatological data from National Agriculture and Food Research Organization (NARO) which provides gridded climatological data for the whole of Japan [
41]. The weather generator services can directly accept response of getObservation from the data source, which is long-term climatological data, as input for generating weather realizations. Even at global scale, climatological data can be connected to the web service framework. For instance, global climatological data from aWhere Inc. [
42] in Broomfield, CO, USA, which provides weather over a billion points across the globe, can be a good alternative weather data for data scarce areas such as Africa. The mechanism for connecting to data sources that provide proprietary output can be implemented without effect to the framework.
The WSc SOS and IWG are designed for sharing purposes wherein weather realizations are encoded in SOS format. In the current development, we provided these sharing services only for weather realizations generated from normal seasonal forecast (33, 34, 33) because it is fixed; for other forecast probabilities, there are infinite possible combinations of BN-NN-AN, so the weather realizations are provided upon service.
Performance of SOS database and InsertObservation operation can an issue in handling numerous weather realizations. For instance, inserting a hundred of weather realizations to SOS database using InsertObservation operation requires about 20 min in our system. Our system is designed to return the result without waiting for the completion of insertObservation, however, it may become a problem when operator frequently updates the cached data or handles huge number of historical weather data. A mechanism for storing and sharing weather realizations from various seasonal forecast scenarios needs to be investigated.
Admittedly, in the current form, it is best seen as a proof of concept. To hit the market, a number of issues need to be addressed, including issues about the deployment environment (e.g., data storage, and computational performance of hosting services), issues relating to data formats (we have used O & M and WTD to structure weather realizations, but certainly they are not the only applicable formats), and issues relating to user side (for example, to run weather generators, users just need to issue HTTP GET requests, but when requests take long time to finish, users should be able to monitor request status). The URLs that must be passed from one service to the next service are still lengthy. When a program performs the process, it is not an issue, but for scientists who may call the service manually from their browsers, the long URL may cause errors or confusion. Mechanism of passing required input to the model needs to be improved further. The weather generators we implemented as a web service were fully validated in several previous studies [
1,
9,
40,
43] though. Information regarding the verified reliability of the generated weather realizations will be provided in the future version.


