Network Intrusion Detection through Discriminative Feature Selection by Using Sparse Logistic Regression

1
Institute of Artificial Intelligence, College of Computer Science, Zhejiang University, Hangzhou 310027, China
2
State Key Laboratory of ICT, College of Control Science and Engineering, Zhejiang University, Hangzhou 310027, China
3
COMSATS Institute of Information Technology, Lahore 54500, Pakistan
4
Department of Computer System engineering, The Islamia University of Bahawalpur, Bahawalpur 63100, Pakistan
*
Author to whom correspondence should be addressed.
Future Internet 2017, 9(4), 81; https://doi.org/10.3390/fi9040081
Submission received: 18 October 2017
/
Revised: 1 November 2017
/
Accepted: 6 November 2017
/
Published: 10 November 2017
(This article belongs to the Collection Information Systems Security)
Abstract
:Intrusion detection system (IDS) is a well-known and effective component of network security that provides transactions upon the network systems with security and safety. Most of earlier research has addressed difficulties such as overfitting, feature redundancy, high-dimensional features and a limited number of training samples but feature selection. We approach the problem of feature selection via sparse logistic regression (SPLR). In this paper, we propose a discriminative feature selection and intrusion classification based on SPLR for IDS. The SPLR is a recently developed technique for data analysis and processing via sparse regularized optimization that selects a small subset from the original feature variables to model the data for the purpose of classification. A linear SPLR model aims to select the discriminative features from the repository of datasets and learns the coefficients of the linear classifier. Compared with the feature selection approaches, like filter (ranking) and wrapper methods that separate the feature selection and classification problems, SPLR can combine feature selection and classification into a unified framework. The experiments in this correspondence demonstrate that the proposed method has better performance than most of the well-known techniques used for intrusion detection.
1. Introduction
As the proliferating growth of computer network activities and sensitive information on network systems increases, more and more organizations are becoming susceptible to a wider variety of attacks. The question of how to protect network systems from intrusion, disruption, and other anomalous activities from unwanted attackers becomes paramount [1]. The conventional intrusion prevention systems such as firewalls, access control, and secure network protocols (SNP) and encryption techniques cannot always protect network systems because the possibility of malicious traffic being injected into the system. The intrusion detection system (IDS) [2] is an essential element of security infrastructure that is useful in detecting and identifying the threats as well as tracking the intruders. In 2016 and mid-2017, a joint report was published by Internet Organized Crime Threat Assessment (IOCTA), the fourth annual presentation of the cybercrime threat landscape by Europol’s European Cybercrime Center (EC3). It is mentioned that how cybercrime proceeds to grow and emerge, taking new trends and directions, as shown in some of the attacks of the unprecedented scale of late 2016 and mid-2017 [3].
The trend is now moving towards the use of a combination of several separate attacks to create a sophisticated and more effective attack. Therefore, many researchers have been focusing on the solution of the IDS challenge that can be used to develop detection models to reduce the number of false alarm rates and recognize new attacks. IDS can be described as a security system that automatically monitors the network activities and analyzes the network events so that the unauthorized attempts to access/manipulate the system resource can be identified. Furthermore, if examining of connections/events are considered, there are two kinds of IDS encounters: misuse detection system and anomaly detection system [4].
1. Misuse detection system (MDS): MDS can be identified as signature-based or knowledge-based intrusion detection system. It is based on loading all features of known attacks in the repository. However, the signature of attacks are known and defined priori and IDS attempts to identify the behavior as either normal or abnormal via analyzing the network connection sample to known intrusion pattern recognized by human specialists. The MDS has very low false positive rate and high classification accuracy. On the other hand, MDS cannot detect new or unknown attacks [5].
2. Anomaly detection system (ADS): ADS can identify an attack based on significant deviation from normal activity of network system. Suppose that an intrusion could be identified by analyzing deviation from a normal or suspicious behavior(s) of a monitored object. However, it is very important to identify the entity’s normal behavior correctly. Therefore, different data samples analyzed via processes on the same network. Different features would be selected from analyzed data samples. The selected features may represent one of the prominent factors. Although input features have sufficient knowledge about the normal and abnormal users; despite the fact that usually ADS detects novel or unknown attacks for the system but usually it has high false positive rates [6].
Recently, several IDSs have been recommended that mainly target rule-based systems, because their performance depends on the rules identified by the security experts [7]. However, the volume of network traffic is extensive therefore the process of encoding rules is mostly inadequate as well as slow. Hence, security experts need to modify the rules or implement new rules by a specific rule-driven language. Nowadays, one serious challenge for IDS is feature selection (FS) from network traffic data and researchers employed feature selection techniques for the classification problems [8]. However, several algorithms are sensitive to feature selection because the raw data format of network not being suitable for detection. Therefore, feature selection is a significant method of improving classification accuracy, reduce the unnecessary or redundant input features and contributing a better understanding of important features and the underlying process that generated the datasets.
It can be said that there is a need to overcome the other problems such as feature redundancy, high-dimensional features, and overfitting. Moreover, another problem for IDS is dealing with imbalanced datasets, such as the majority of the samples belong to Probe and denial of service (DoS) attacks, while very few samples belong to user-to-root (U2R) or remote-to-user (R2L) attacks due to this problem, often the classifier obtains the redundant and biased samples, while in real world the minority attacks are usually more dangerous than majority attacks. Furthermore, a single IDS can examine enormous amounts of information containing redundant and erroneous features, while at this stage, IDS encounters some difficulties such as noise and increased classifier time to tackle aforementioned problems. An effective IDS is needed to reduce false alarm rates and at the same time, it is also required to be effective in identifying the attacks as well as manage high detection rates and reduce the time.
In order to overcome aforementioned problems, we employ a feature selection algorithm that can give an estimate about discriminative features for the IDS classification. In this paper, we are proposing a data mining algorithm called (SPLR) with ℓ1-Regularization for misuse intrusion detection system problem. The SPLR is a recently developed technique used for classification; the SPLR has been widely employed in several applications such as computer vision, pattern recognition problem, signal processing [9] and now in the intrusion detection system.
The major contributions of this work are summarized as,
- (1)
- We employ a unique framework, the sparse logistic regression (SPLR) for an intrusion detection system (IDS). The SPLR has not been applied by any other researcher in the domain of IDS, as per our knowledge.
- (2)
- The SPLR reduces the cost function for IDS classification with a sparsity constraint.
- (3)
- Regularization through SPLR, feature selection has been mapped into penalty term of sparsity optimization in order to select more effective and interpretable features for IDS classification.
- (4)
- The SPLR has shown different characteristics that are exceptionally suitable for IDS such as high classification accuracy (detection rate [DR]) and training time to build a model and average training time per sample etc.
2. Related Work
In an effort to arm on the threat of future unknown cyber-attacks, considerable work has gone into investigating and growing intrusion detection systems to help filter out associated malware, exploits, and vulnerabilities. Since the early 2000s, there have been many successful applications that incorporated data mining (DM) and machine learning (ML) methods for the IDS. Since then, many ML and DM algorithms were specifically designed for the purpose. DM algorithms examine the valuable information within large volume of data by analytically discovering underlying major trends, patterns, and associations from the data as reported in [10,11]. Therefore, an artificial neural network (ANN) can be used to solve multiclass problems for the IDS using a classic multilayer feed-forward NN trained with a back-propagation algorithm to predict intrusions [12]. Many other (ML) methods have been used in IDS domains, such as Decision Trees, SVM and Random Forests [13]. The algorithms have estimated the performance of a set of pattern recognition, however the performance shows that certain classification algorithms are specifically efficient for a given attacks category while others lag behind. Moreover, they have also suggested a multiclassifier model for IDS [14] employed by the Random Forests technique in NIDSs (network intrusion detection systems). Furthermore, Farid et al. [15] conducted an empirical investigation on independent hybrid data mining algorithms to improve the classification accuracy of Decision Tree and Naïve Bayes for multiclass problems. Koc and Sarkani [16] proposed a framework of a network intrusion detection system based on data mining algorithm via the KDD’99 dataset; the research study claim that hidden naïve Bayes (HNB) model can be applied to IDS that involves a variety of issues such as correlated features and high data stream volume.
Nowadays, in the domain of network security (IDS), machine learning (ML), data mining (DM), and feature selection (FS) performs significant roles because many researchers are working on that domain to improve the performance of learning algorithms before applying in the different fields such as text mining, computer vision, and image processing etc. [17]. Feature selection is usually used for many reasons such as increased efficiency of the learning algorithm, achieving a high accuracy rate and getting easiness for classification problems [18]. Moreover, FS determines appropriate subset from the original dataset in order to minimize the impact of irrelevant and redundant features without greatly decreasing the accuracy of the classifier. However, several issues that remain to be addressed in feature selection; first, redundancy in datasets and combination process for FS techniques through any learning algorithm; second, an isolation and redundant feature selection as well as ineffective features selection from datasets—these problems lead to difficult stages for any learning algorithm. Furthermore, the Very Fast Decision Tree (VFDT) based on Hoeffing tree [19], uses information gain or gaini index for feature selection; it includes many refinement processes while training the model. The VFDT separates the features that are not promising before training the model. Though the accuracy of VFDT is low, the computational cost is high as well as error rate is high due to the complexity of tree.
The most notable feature selection techniques such as, filter: applied as a ranker to rank all features without any classifier and wrapper: that uses a classifier to examine the features first [20]. The wrapper contributes good performance in small sets and the filter technique less expensive from a computational point of view [21]. Although, the association between feature selection and algorithm is not yet well managed, there is a need to be filled. Therefore, the regularized learning algorithms such as SVM [22], boosting [23], and sparse logistic regression (SPLR) have had a powerful impact in the domain of feature selection and classification problems. Figure 1 displays a network architecture scenario for the IDS to protect the server machines such as file server, web server, and file transfer protocol (FTP) server as well as proxy server from internal and external intrusions. Here, two IDSs are installed; the first one is internal intrusion detection system (IIDS) and second is external intrusion detection system (EIDS).
3. Sparse Logistic Regression (SPLR)
The goal of the sparse modeling is to select discriminative features for the IDS classification problem, while reducing the redundant and irrelevant features in order to obtain the high accuracy for the system. Suppose a prediction problem with samples and is outcomes. The features , where and is the input number of variable, let represent the input matrix and represent the output matrix.
When the values y class labels with (+1) corresponding to normal and (−1) corresponding to attack (abnormal). Logistic regression (LR) is a probability conditional model and can be defined as,
For the attack classification problem, the values of ) correspond to the probability. It means that the decision to assign the category would be based on the probability estimate with a threshold based on maximizing the expected effectiveness.
Maximum likelihood estimation of the parameter corresponds to minimization of the negative log-likelihood.
In many of the earlier works in the domain, the regularized logistic regression provides exceptional analytical performance across a range of fields such as text classification and image classification [24]. Different constraints on is extensively studied. In order to overcome this problem, we employ sparsity constraint. One of the prominent sparse regression models is the least absolute shrinkage and selection operator (LASSO) proposed by Tibshirani [25], which utilize ℓ1 regularizations; it can be defined as in (3).
It has been proved that ℓ1 regularization has the ability to estimate the feature selection into the loss function minimization [21]. The SPLR assume that the input features/variables are closely independent, meaning not highly correlated, which denotes the finest structure of input features. It can be said that a reasonable solution may be achieved in practice.
In this work, we employ ℓ1-regularized logistic regression for discriminative feature selection and intrusion classification for the IDS via a sparse model as in Equation (5). Accordingly, for the purpose of feature selection, we have added a sparse regularization for the minimization of,
Here, is the ℓ1-norm regularization and λ is a regularization parameter. As the direct approach to solving the logistic regression is ill-posed and may lead to overfitting in the classification results, a standard technique in avoiding overfitting is the sparse regularization/constraint which assumes λ > 0. The solution to the ℓ1 norm regularized logistic regression can be interpreted in a Bayesian framework as the maximum a posteriori probability estimate of . Figure 2 shows the taxonomy of discriminative feature selection and classification via SPLR.
Optimization of Algorithm Subsection
The objective Function (5) is a convex function. Solving the coefficient is a regularized convex optimization problem. The illustration for ℓ1-norm regularization is shown in Figure 3. Here, the elliptical contour of this method is shown through full curves and at the center ordinary logistic regression estimates. However, the constraints area is the rotated square. The ℓ1-norm regularization is the first place that the contour touches the square. In the last decade, regularized convex optimization has been intensely studied and led to many efficient results [26]. In short, these approaches can seem as a natural extension of the gradient technique. Here an objective function is to be minimized that leads to a non-smooth component. In this paper, the accelerated proximal gradient descent method is used, which reduces computational cost and leads to linear convergence [27]. Suppose a regularized convex optimization problem of (5), with a cost function and a regularization function , the accelerated proximal gradient method solve this iteratively and every iteration, indexed by , it comprises of two key stages.
Here, the first stage is a descent step for the function , in order to accelerate the convergence, we start the first step from search point, and then the adaptive backtracking line search scheme is used to determine the step size. This involves starting with a relatively large estimate of step size with respect to the search direction and repeatedly shrinkage in the step size (backtracking) until reduce of object function is achieved. Which is an affine combination of and .
Here, is a tuning parameter. The approximate solution will be measured as a gradient step. Now, adaptive backtracking line search [28] is used to select a proper step size .
The second stage is to project into regularized space while a proximal operator is applied, the proximal operator is defined as
For ℓ1-regularization, an analytical solution for every variable can be derived as,
Repeatedly applying the accelerated gradient method and proximal operator the convergence of the algorithm leads to the optimum results. This technique is effective corresponding to the accelerated gradient descent and analytical solution of the proximal operator. A detailed summary of SPLR algorithm shown in Algorithm 1.
| Algorithm 1. Pseudo code for SPLR (Lasso) Algorithm. |
| Input: Sparse function (.) and sparse regularization function with regularization parameter λ. Initialize: Step size and affine combination parameter Output: Optimum Result
|
4. Experimental Results and Discussion
Here in this section, the experimental results are presented and it is mentioned that how we evaluated the effectiveness of SPLR approach for this paper. Figure 4 shows a taxonomy of a novel framework technique about training and testing phases for discriminative feature selection and classification. In the first stage, have training sets with different λ values by an n-fold cross validation scheme and achieve a sparse vector that contains few nonzero coefficients with the sparse model. Then, go to the second phase of testing and intrusion classification.
4.1. KDD Cup 1999 Dataset
The third international KDD ’99 dataset has been used to build a network intrusion detector (IDS) in order to identify and distinguish between normal and abnormal events in the context of the network systems. It can be argued that the KDD ’99 dataset that we have used in our analysis may not be an ideal representative of the existing networks of contemporary world; however this is a sensible choice due to the lack of public intrusion detection datasets in the computer networking research community. We believe that the dataset can be applied as an effective benchmark dataset for the general problem of security analysis to help networking researchers to work with different ML techniques in order to perform intrusion detection. Moreover, the Defense Advanced Research Project Agency (DARPA) evaluated a program for the IDS that was set up for a network environment in 1998. Moreover, a TCP/IP dump packet for LAN (local area network) has been carried out by Massachusetts Institute of Technology (MIT’s) Lincoln lab to examine the performance of different IDS methods by using the dataset [29]. Therefore it can be said that the dataset has been used as a realistic type of network systems by many researchers in the field. Soon after that, many researchers paid significant attention towards the IDS domain. The KDD ’99 dataset contains five classes, one normal class, and rest of all are attacks such as DOS, Probe, U2R, and R2L. The number of attacks contained in the training datasets is 22 and 16; additional attacks are included into the test datasets. The probability of attacks in both (training & testing) is different. Therefore, it makes the most realistic environment for IDS experiments. The number of KDD ’99 samples are listed in Table 1 and list of 41 features in Table 2, while Table 3 shows attack categories.
4.2. Experiment Design
Table 1 shows the KDD ’99 data sets. For our experiment, we have selected a number of random samples from the original KDD ’99 dataset as used in [19]. An extracted 1,774,985 instances as a training set listed in Table 4 and 67,688 instances of the independent testing set. Table 4 also shows the percentage of each class. The most of the important parameter for the performance evaluation of IDS is detection rate (DR). This parameter measures the number of correctly detected attacks from a total number of attacks as defined in Equation (10). Then, the false alarm rate (FAR) measures the ratio between the numbers of normal connections that are incorrectly misclassified as attacks and a total number of normal connections defined in Equation (11).
Furthermore, it should be noted that the parameter λ in the SPLR determines the degree of sparsity. An increase in λ corresponds to a decrease in non-zero coefficients (selected feature variables) while the degree of sparsity can be measured by Equation (12).
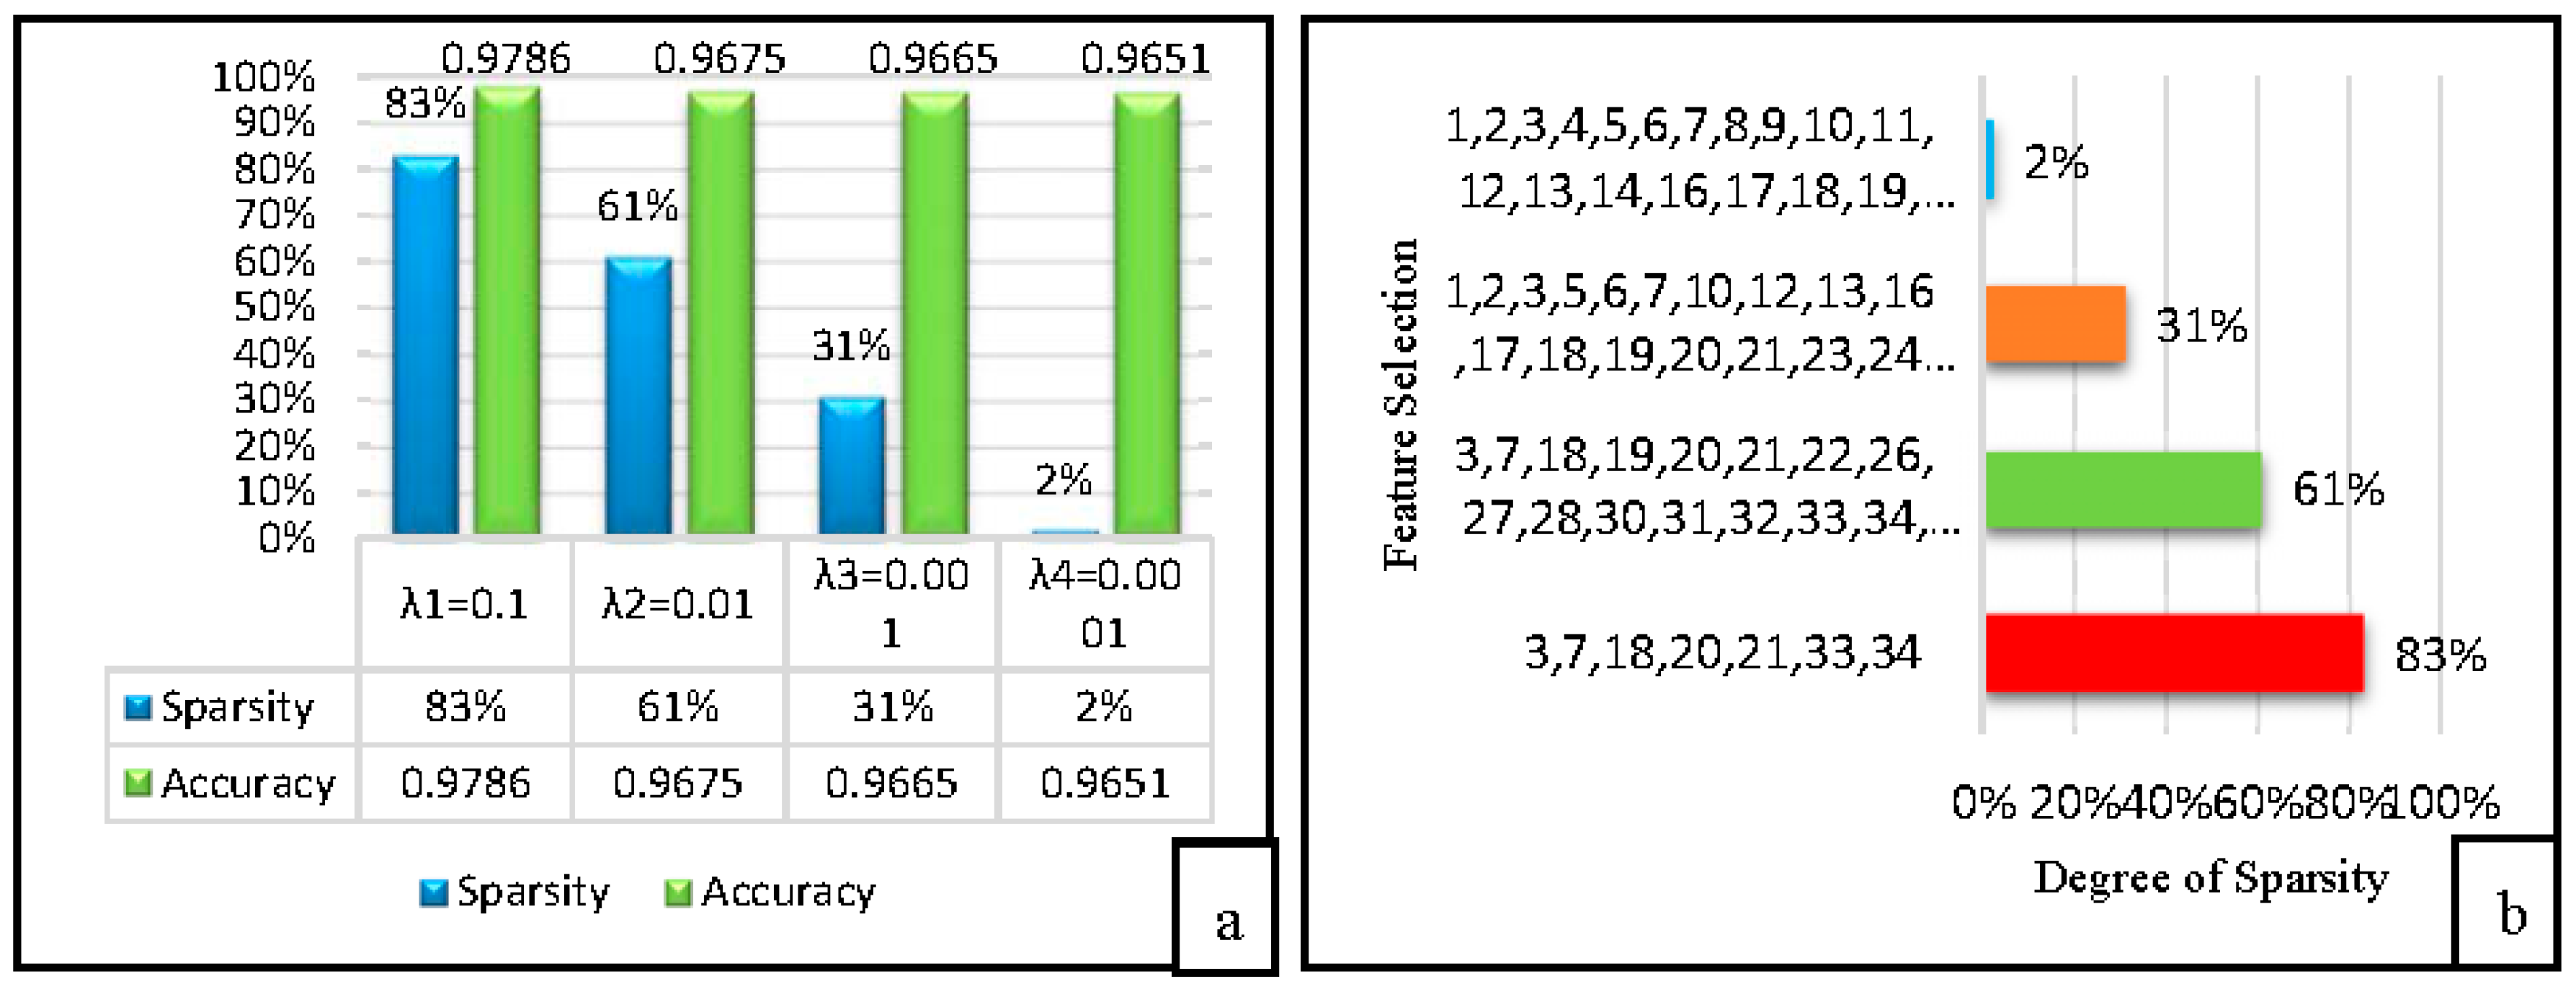
Here, the proposed technique (SPLR) is assessed with the similar training and testing datasets (1,074,985) as were used in [19,30,31]. The proposed SPLR feature selection technique is compared against the KDD ’99 in order to show the potential in classification with better performance than [19] as well as other classifier models. However in the experimental results, we provide the discriminative feature selection and classification accuracy by SPLR as shown in Figure 5a,b respectively. Furthermore, Figure 5a presented the OCA and along with degree of sparsity at various settings, if then the degree of sparsity is high (few features are selected as shown in Figure 5b, however at the same parameter values the detection accuracy by SPLR is high (0.9786).
4.3. Experimental Results
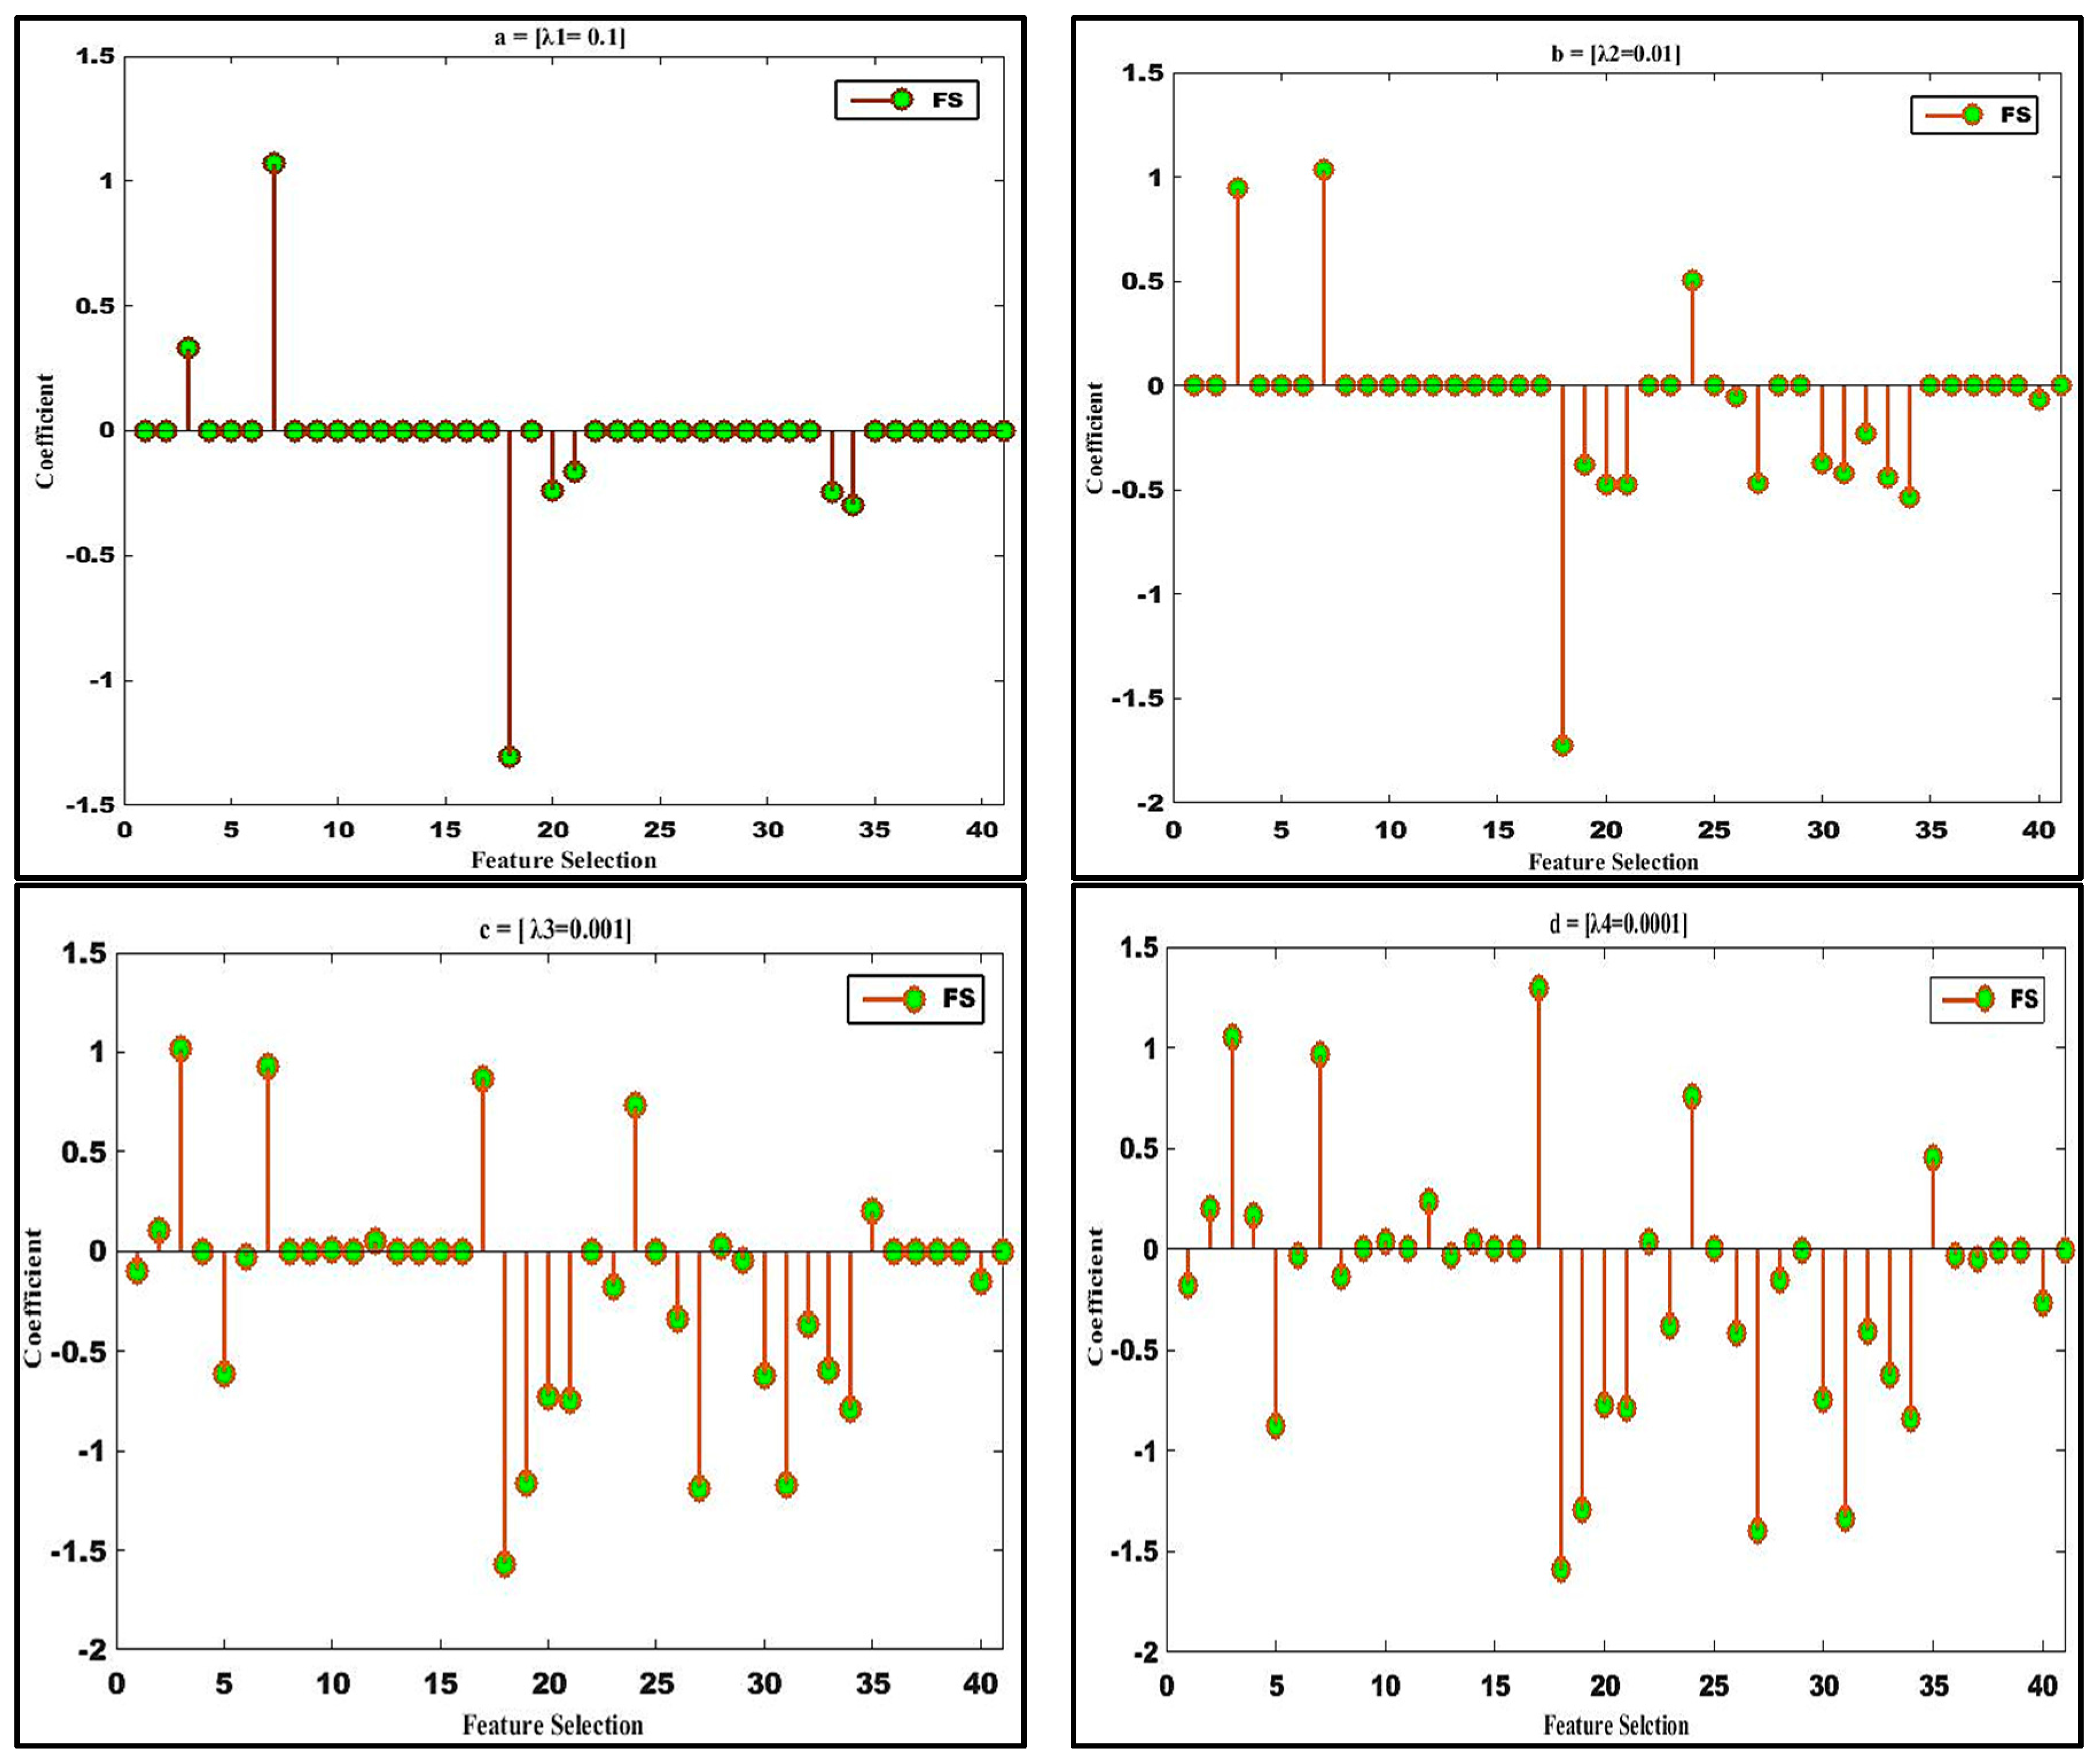
The SPLR-based FS performs better than VFDT [19] on the KDD ’99 dataset because the VFDT only considers the 20 selected feature sets for classification, while the proposed approach selects descriptive features and classification simultaneously. This specifies that SPLR has an exceptional capability to extract essential and rich information for the IDS. Moreover, we discuss the performance of feature selection via SPLR, Figure 6a–d, and contrast the plots of the resulting selected features against the variation of sparsity. When the value of the parameter λ declines, so does the degree of sparsity. The SPLR first increases and remains stable as is shown in Figure 6a–d. The nonzero, selected features identified by the model (SPLR) are: 3, 7, 18, 20, 21, 33, and 34; the rest are sparsity or discarded features as shown in Figure 6a. The selected features are: service, land, num_shells, num_outbound_cmds, is_hot_login, dst_host_srv_count, and dst_host_srv_rate. It may be possible that these features are not enough for the classifier to detect different attacks/intrusions. Hence, the features 18, 20, and 21 have less impact. Furthermore, we have selected the rest of the 38 features based on the values of λ; the most significant features for building the pattern for detecting intrusion into the system is feature 3 (service type such as http, ftp, and telnet). In other words, the intrusions are sensitive to the service type.
According to the domain knowledge, feature 7 is the most perceptive feature for land attacks, although land attacks belong to the category of DOS attacks. In Figure 6a–c, the features wrong_format (8) and same_serv_rate (29) are the most contributing features to detect the DOS attack. Moreover, Tcp fragmentation (teardrop attack) also belongs to the DOS attack as it prevents reassembly protocols from fixing together fragmented user define protocol (UDP) traffic packets that may be sent across the network to the assigned destination by rebooting the targeted host. DoS attacks send a lot of traffic to the same service in order to block the communication channel and therefore count, src bytes, flag etc. can be considered among the contributing features for such an attack. Features 20 (number of outbound commands in an FTP session) and 21 (hot login to indicate if it is a hot login) do not show any distinction for intrusion detection in the training sets. Additionally, if the same service sends an Internet control Message Protocol (ICMP) and echo replies to the same destination IP address then this may point to a smurf attack (count, srv count), i.e., a DoS where its effect is slowing down the network. If the source IP or destination IP address and port numbers are similar with TCP connection flags, then it should be considered as network intrusion type Neptune (DoS) and it slows down the server response. In order to detect the probe attacks des_host_srv_rate, srv_rerror_rate types of features required to detect probe attack and these features are easily selected by SPLR as shown in Figure 6. Probe attacks belong to scanning the open ports and running service upon a live host during an attack. Moreover, if there is an attempt to launch the probe attack and the duration of connection increase then it means that a normal connection and the amount of data bytes in one connection sent by the intruder will be large.
The R2L and U2R attacks have been investigated by content features. The content features that can be considered as a num_failed_login, su_attempt, is_guest_login. Similarly, the contributing features of R2L attack are service, is_guest_login, su_attempt. The guess_passwd attack belongs to R2l attack when an attacker trying to login to a machine, however, he/she is not allowed to access login information of a system. On the other hand, U2R attacks detect when an intruder logs in as a system administrator and generates quite a significant of files and a number of modifications to access control files. The num root is one of the most contributing features for the U2R intrusion. However, the results show that the proposed technique selects a discriminative feature potentially for the classifier. In the proposed scenario, for the KDD ’99 datasets, the classification accuracies either reach or come close to the greatest possible values when the sparsity is between 85% and 95% i.e., 5% to 20% of the features are selected as was shown previously in Figure 6, From these figures, one can make the interesting observation that the accuracy of the SPLR is higher when the degree of sparsity is high. It means, the SPLR can achieve a better result with limited features.
Moreover, the running time of proposed technique is 11.6 s and the average time per sample is 0.000001 (s). While the optimization technique for the sparse model is an iterative process, in every iteration the computational costs are , where the number of training samples and P is the number of feature variables. In this experiment, it is observed that the average training time of SPLR is better than VDFT. Once the sparse classifier is trained, then the testing step is very fast because only a single linear decision function is to be executed irrespective of the size of the training instances.
4.4. Classification Detection Rate
The performance comparison and experimental results are described in the Table 5 and Table 6. The results of the proposed method are compared with the experimental results of [19,29,30,31] in Table 5, whereas Table 6 presents the results of different classifiers. The comparison is performed based on three factors such as data sizes, detection rate and average training time per sample. It can be observed from the results that the SPLR model is much more effective due to the comparable classification accuracies. There are some other observations from the Table 5 that need to be highlighted. First, if the KDD’99 datasets are used, the SPLR has achieved better performance in detection rate (97.6%) and the FAR is 0.34%. However, it takes less training time (11.6 s) to build a model while the average training time per sample is (0.000001 s) than the VFDT method. Second, considering the fact that other classifiers such as genetic programming, multivariate adaptive regression splines, naïve Bayes and VFDT are good classifiers, the proposed (SPLR) classifier shows an impressive performance in terms of feature selection, improve classification accuracy, detection rate, training time and average training time per sample. Third, it needs to be emphasized that the SPLR’s model-based classifier can perform discriminative feature selection during the classifier training phase, which provides an interesting and integrated solution for IDS classification problems.
5. Conclusions and Future Work
In this work, we have applied the SPLR model to achieve discriminative feature selection and subsequently improve attack classification for intrusion detection system (IDS). The first and major contribution of this work is to address high-dimensional datasets. The proposed method controls overfitting and feature redundancy by simultaneously carrying out the feature selection and classification. This enables the investigation of detailed discriminative features. Secondly, the proposed classifier has been compared to state-of-the-art algorithms. The SPLR method shows some impressive characteristics and encouraging results. Our experimental results suggest that classification with the proposed feature selection method performs better than other classification models. The sparse model allows the combination of feature selection and classification into a unified framework by minimizing the combined empirical loss and penalization on the sparsity of feature variables. As a result, the running times of the SPLR method are linear with respect to the training samples and feature variables. The feature selection and prediction cost are also better than other methods suggested in the literature on the subject.
As a future work, we think that the promising results of our experiments encourage for carrying out further research into the effects of different classifiers as well as the exploration of recent developments in the IDS domain.
Author Contributions
Reehan Ali Shah instated the central idea of this research. However, an idea was completely described with Reehan Ali shah’s Ph.D. supervisor and project team. With the planning, dedicated research, and collaborative team work, Reehan and Dileep performed experiments under the supervision of Yuntao Qian. Reehan was also the in charge of data analyses and the first manuscript draft. Reehan, Munawar, and Muhammad Bux Alvi edited the manuscript and recommended various improvements ultimately leading to the final version.
Conflicts of Interest
The authors declare no conflicts of interest.
References
- Kevric, J.; Jukic, S.; Subasi, A. An effective combining classifier approach using tree algorithms for network intrusion detection. Neural Comput. Appl. 2016, 1–8. [Google Scholar] [CrossRef]
- Louvieris, P.; Clewley, N.; Liu, X. Effects-based feature identification for network intrusion detection. Neurocomputing 2013, 121, 265–273. [Google Scholar] [CrossRef]
- European Cybercrime Centre (EC3). 2017. Available online: https://www.europol.europa.eu/activities-services/main-reports/internet-organised-crime-threat-assessment-iocta-2017 (accessed on 10 October 2017).
- Singh, R.; Kumar, H.; Singla, R. An intrusion detection system using network traffic profiling and online sequential extreme learning machine. Expert Syst. Appl. 2015, 42, 8609–8624. [Google Scholar] [CrossRef]
- Natesan, P.; Rajesh, P. Cascaded classifier approach based on Adaboost to increase detection rate of rare network attack categories. In Proceedings of the IEEE International Conference on Recent Trends In Information Technology (ICRTIT), Chennai, India, 19–21 April 2012. [Google Scholar]
- Mohammadi, M.; Raahemi, B.; Akbari, A.; Nassersharif, B. Class dependent feature transformation for intrusion detection systems. In Proceedings of the 19th IEEE Iranian Conference on Electrical Engineering, Tehran, Iran, 17–19 May 2011. [Google Scholar]
- Snort Intrusion Detection System. 2006. Available online: http://www.snort.org (accessed on 10 October 2017).
- Li, Y.; Wang, J.-L.; Tian, Z.-H.; Lu, T.-B.; Chen, Y. Building lightweight intrusion detection system using wrapper-based feature selection mechanisms. Comput. Secur. 2009, 28, 466–475. [Google Scholar] [CrossRef]
- Wright, J.; Ma, Y.; Mairal, J.; Sapiro, G.; Huang, T.S.; Yan, S. Sparse representation for computer vision and pattern recognition. Proc. IEEE 2010, 98, 1031–1044. [Google Scholar] [CrossRef]
- Hodo, E.; Bellekens, X.; Hamilton, A.; Dubouilh, P.; Iorkyase, E.; Tachtatzis, C.; Atkinson, R. Threat analysis of iot networks using artificial neural network intrusion detection system. In Proceedings of the IEEE International Symposium on Networks, Computers and Communications (ISNCC), Yasmine Hammamet, Tunisia, 11–13 May 2016. [Google Scholar]
- Hodo, E.; Bellekens, X.; Hamilton, A.; Tachtatzis, C.; Atkinson, R. Shallow and Deep Networks Intrusion Detection System: A Taxonomy and Survey; Cornell University Library: Ithaca, NY, USA, 2017; arXiv preprint. [Google Scholar]
- Brifcani, A.; Issa, A. Intrusion detection and attack classifier based on three techniques: A comparative study. Eng. Technol. J. 2011, 29, 368–412. [Google Scholar]
- Roopadevi, E.; Bhuvaneswari, B.; Sahaana, B. Intrusion Detection using Support Vector Machine with Feature Reduction Techniques. Indian J. Sci. 2016, 23, 148–156. [Google Scholar]
- Zhang, J.; Zulkernine, M. A hybrid network intrusion detection technique using random forests. In Proceedings of the IEEE First International Conference on Availability Reliability and Security (ARES'06), Vienna, Austria, 20–22 April 2006. [Google Scholar]
- Farid, D.M.; Zhang, L.; Hossain, M.A.; Strachan, R. Hybrid decision tree and naïve Bayes classifiers for multi-class classification tasks. Expert Syst. Appl. 2014, 41, 1937–1946. [Google Scholar] [CrossRef]
- Koc, L.; Mazzuchi, T.A.; Sarkani, S. A network intrusion detection system based on a Hidden Naïve Bayes multiclass classifier. Expert Syst. Appl. 2012, 39, 13492–13500. [Google Scholar] [CrossRef]
- Farid, D.M.; Harbi, N.; Rahman, M.Z. Combining Naive Bayes and Decision Tree for Adaptive Intrusion Detection; Cornell University Library: Ithaca, NY, USA, 2010; arXiv preprint. [Google Scholar]
- Fahad, A.; Zahir, T.; Ibrahim, K.; Ibrahim, H.; Hussein, A. Toward an efficient and scalable feature selection approach for internet traffic classification. Comput. Netw. 2013, 57, 2040–2057. [Google Scholar] [CrossRef]
- Al-mamory, S.O.; Jassim, F.S. On the designing of two grains levels network intrusion detection system. Karbala Int. J. Mod. Sci. 2015, 1, 15–25. [Google Scholar] [CrossRef]
- Yang, J.; Olafsson, S. Optimization-based feature selection with adaptive instance sampling. Comput. Oper. Res. 2006, 33, 3088–3106. [Google Scholar] [CrossRef]
- Sánchez-Maroño, N.; Alonso-Betanzos, A.; Calvo-Estévez, R.M. A wrapper method for feature selection in multiple classes datasets. In International Work-Conference on Artificial Neural Networks; Springer: Berlin/Heidelberg, Germany, 2009. [Google Scholar]
- Sani, R.A.; Ghasemi, A. Learning a new distance metric to improve an svm-clustering based intrusion detection system. In Proceedings of the IEEE International Symposium on Artificial Intelligence and Signal Processing (AISP), Mashhad, Iran, 3–5 March 2015. [Google Scholar]
- Sarikaya, R.; Hinton, G.E.; Deoras, A. Application of deep belief networks for natural language understanding. IEEE/ACM Trans. Audio Speech Lang. Process. 2014, 22, 778–784. [Google Scholar] [CrossRef]
- Qian, Y.; Ye, M.; Zhou, J. Hyperspectral image classification based on structured sparse logistic regression and three-dimensional wavelet texture features. IEEE Trans. Geosci. Remote Sens. 2013, 51, 2276–2291. [Google Scholar] [CrossRef]
- Tibshirani, R. Regression shrinkage and selection via the lasso. J. R. Stat. Soc. 1996, 58, 267–288. [Google Scholar]
- Li, J.; Qian, Y. Regularized multinomial regression method for hyperspectral data classification via pathwise coordinate optimization. In Proceedings of the IEEE Digital Image Computing: Techniques and Applications, DICTA’09, Melbourne, Australia, 1–3 December 2009. [Google Scholar]
- Li, J.; Qian, Y. Dimension reduction of hyperspectral images with sparse linear discriminant analysis. In Proceedings of the IEEE International Geoscience and Remote Sensing Symposium (IGARSS), Vancouver, BC, Canada, 24–29 July 2011. [Google Scholar]
- Liu, J.; Chen, J.; Ye, J. Large-scale sparse logistic regression. In Proceedings of the 15th ACM SIGKDD International Conference on Knowledge Discovery and Data Mining, Paris, France, 28 June–1 July 2009. [Google Scholar]
- Tavallaee, M.; Bagheri, E.; Lu, W.; Ghorbani, A.A. A detailed analysis of the KDD CUP 99 data set. In Proceedings of the Second IEEE Symposium on Computational Intelligence for Security and Defence Applications, Ottawa, ON, Canada, 8–10 July 2009; pp. 53–58. [Google Scholar]
- Goel, R.; Sardana, A.; Joshi, R.C. Parallel Misuse and Anomaly Detection Model. Int. J. Netw. Secur. 2012, 14, 211–222. [Google Scholar]
- Shanmugavadivu, R.; Nagarajan, N. Network intrusion detection system using fuzzy logic. Indian J. Comput. Sci. Eng. 2011, 2, 101–111. [Google Scholar]
- Khan, L.; Awad, M.; Thuraisingham, B. A new intrusion detection system using support vector machines and hierarchical clustering. VLDB J. Int. J. Very Large Data Bases 2007, 16, 507–521. [Google Scholar] [CrossRef]
- Faraoun, K.M.; Boukelif, A. Securing network traffic using genetically evolved transformations. Malays. J. Comput. Sci. 2006, 19, 9. [Google Scholar]
- Mukkamala, S.; Sung, A.H.; Abraham, A. Intrusion detection systems using adaptive regression spines. In Enterprise Information Systems VI; Springer: Dordrecht, The Netherlands, 2006; pp. 211–218. [Google Scholar]
- Staniford, S.; Hoagland, J.A.; McAlerney, J.M. Practical automated detection of stealthy portscans. J. Comput. Secur. 2002, 10, 105–136. [Google Scholar] [CrossRef]
- Yu, W.-Y.; Lee, H.-M. An incremental-learning method for supervised anomaly detection by cascading service classifier and ITI decision tree methods. In Pacific-Asia Workshop on Intelligence and Security Informatics; Springer: Berlin/Heidelberg, Germany, 2009. [Google Scholar]
- Mazid, M.M.; Ali, A.S.; Tickle, K.S. A comparison between rule based and association rule mining algorithms. In Proceedings of the IEEE Third International Conference on Network and System Security, NSS’09, Gold Coast, Australia, 19–21 October 2009. [Google Scholar]
- Singh, S.P. Data Clustering Using K-Mean Algorithm for Network Intrusion Detection; Lovely Professional University: Jalandhar, India, 2010. [Google Scholar]
Figure 1.
Network Architecture for IDS.
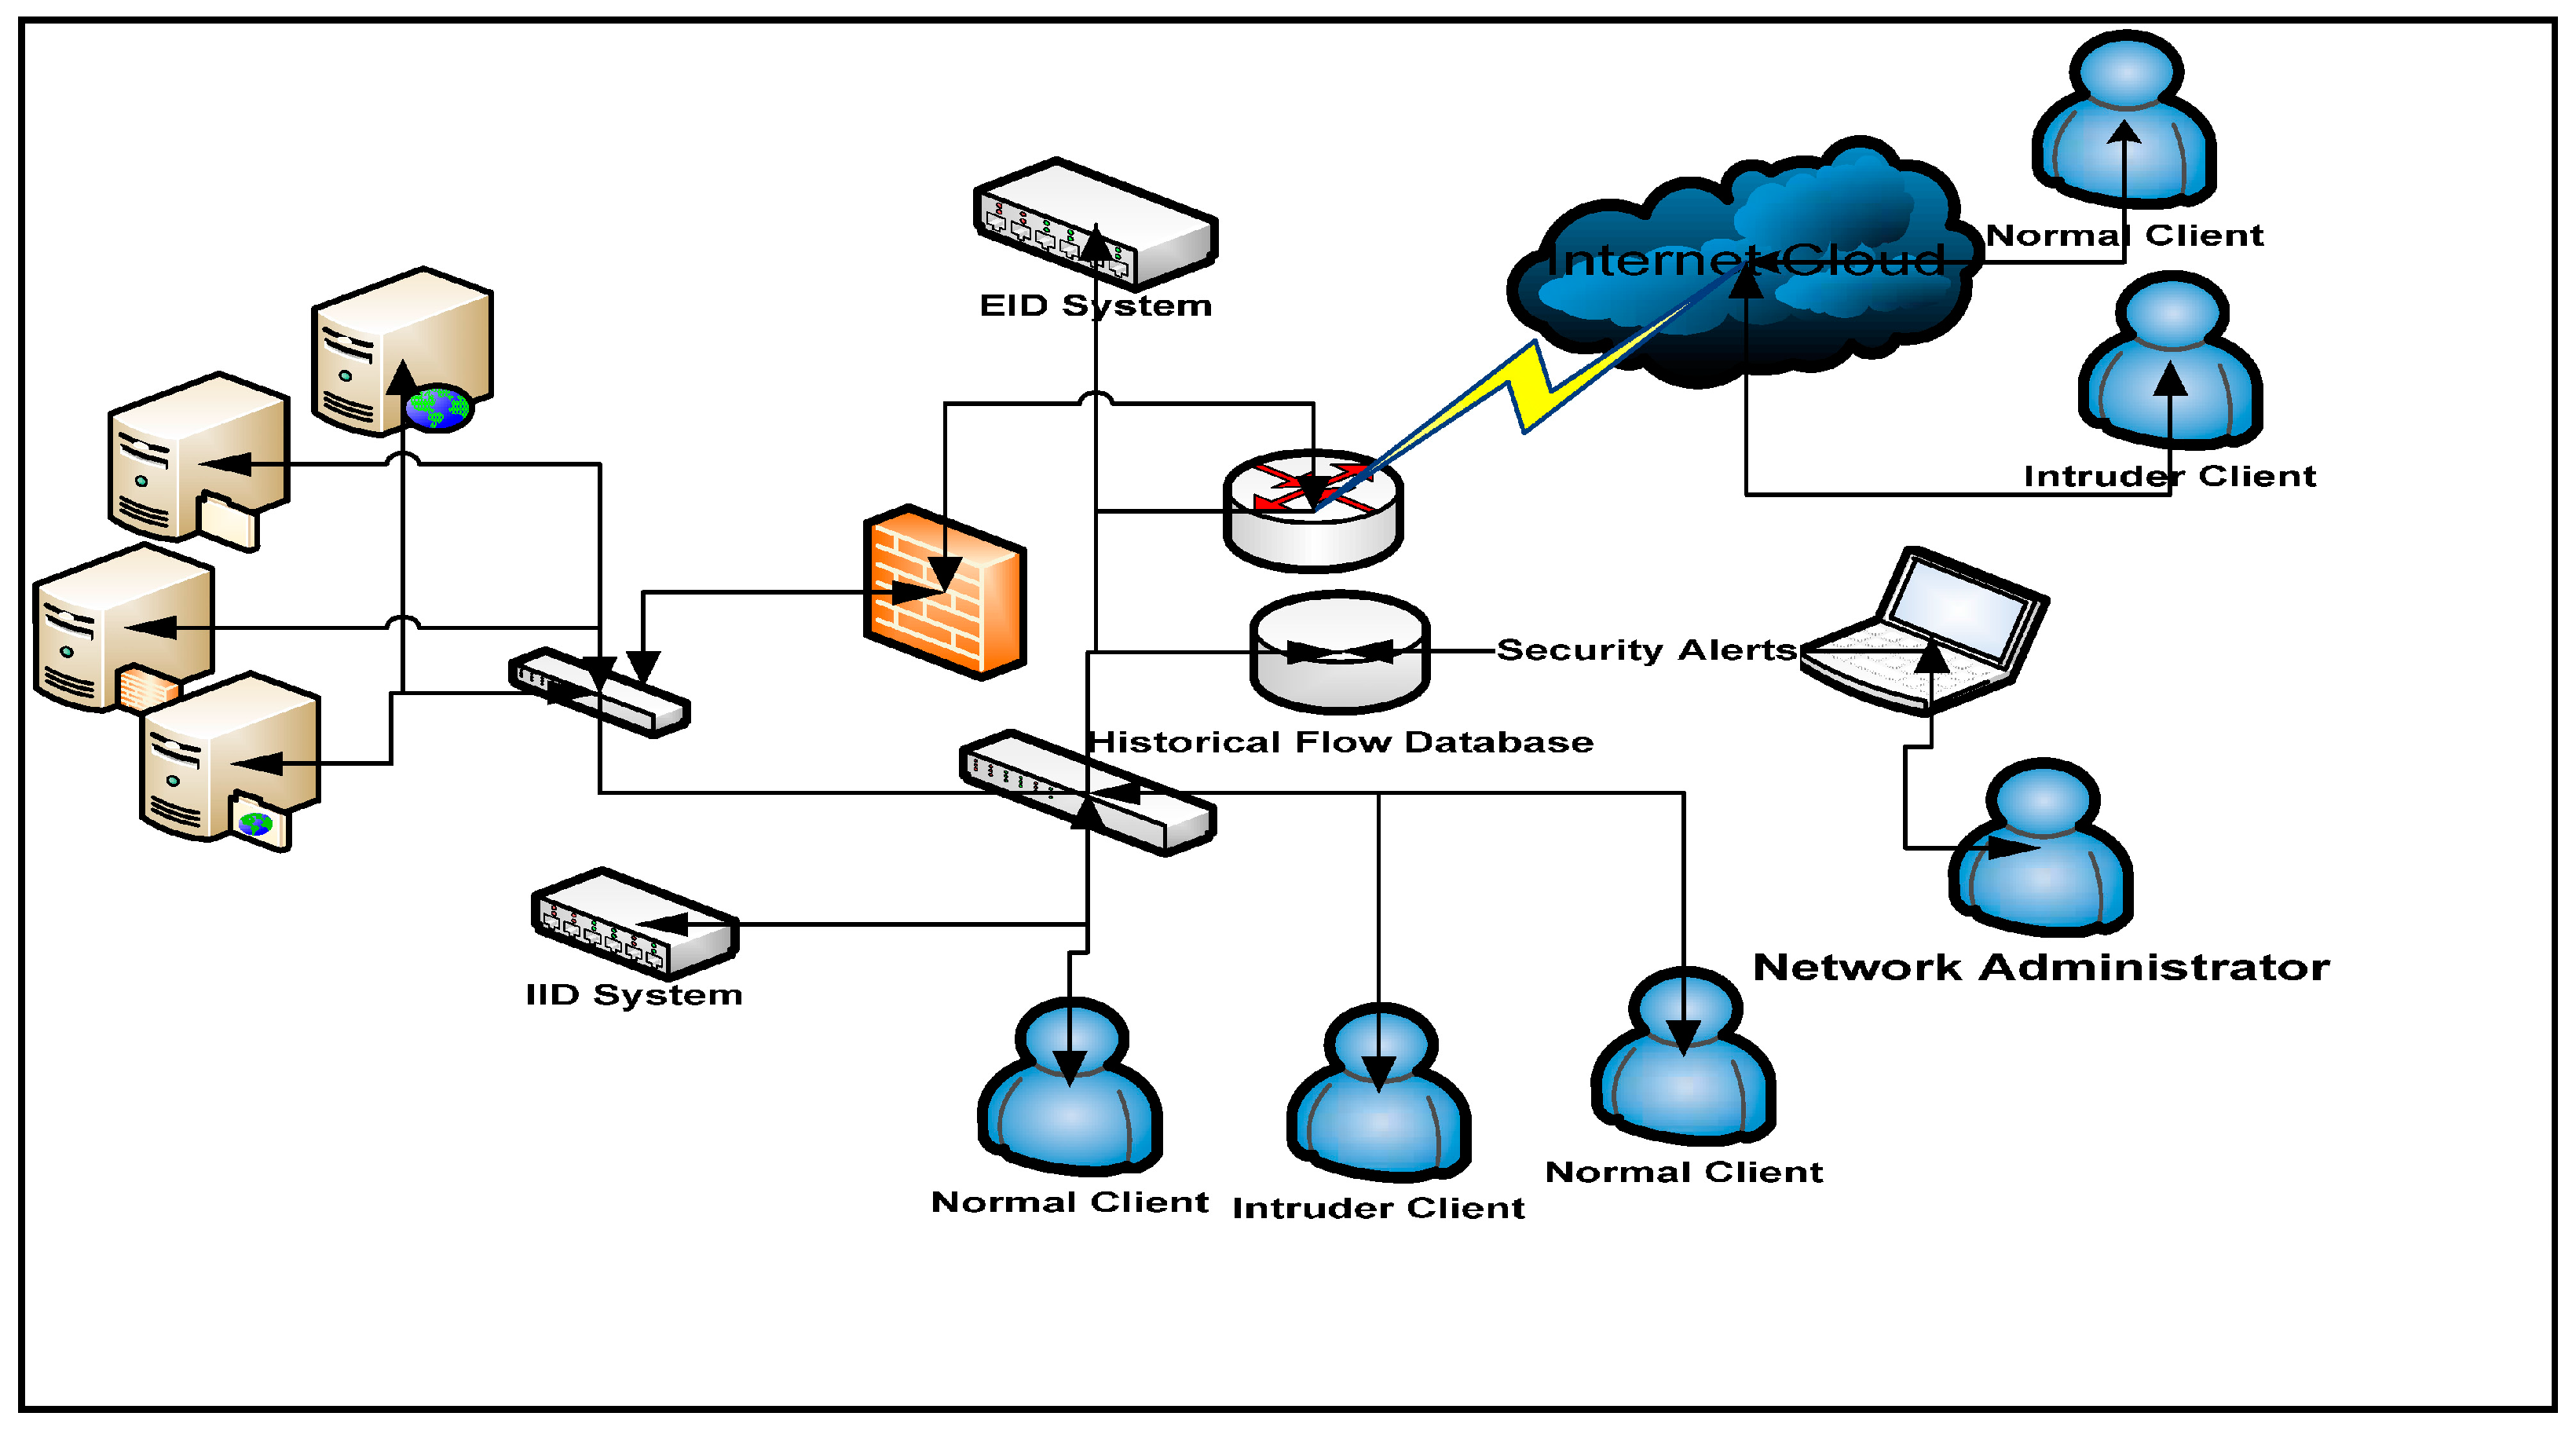
Figure 2.
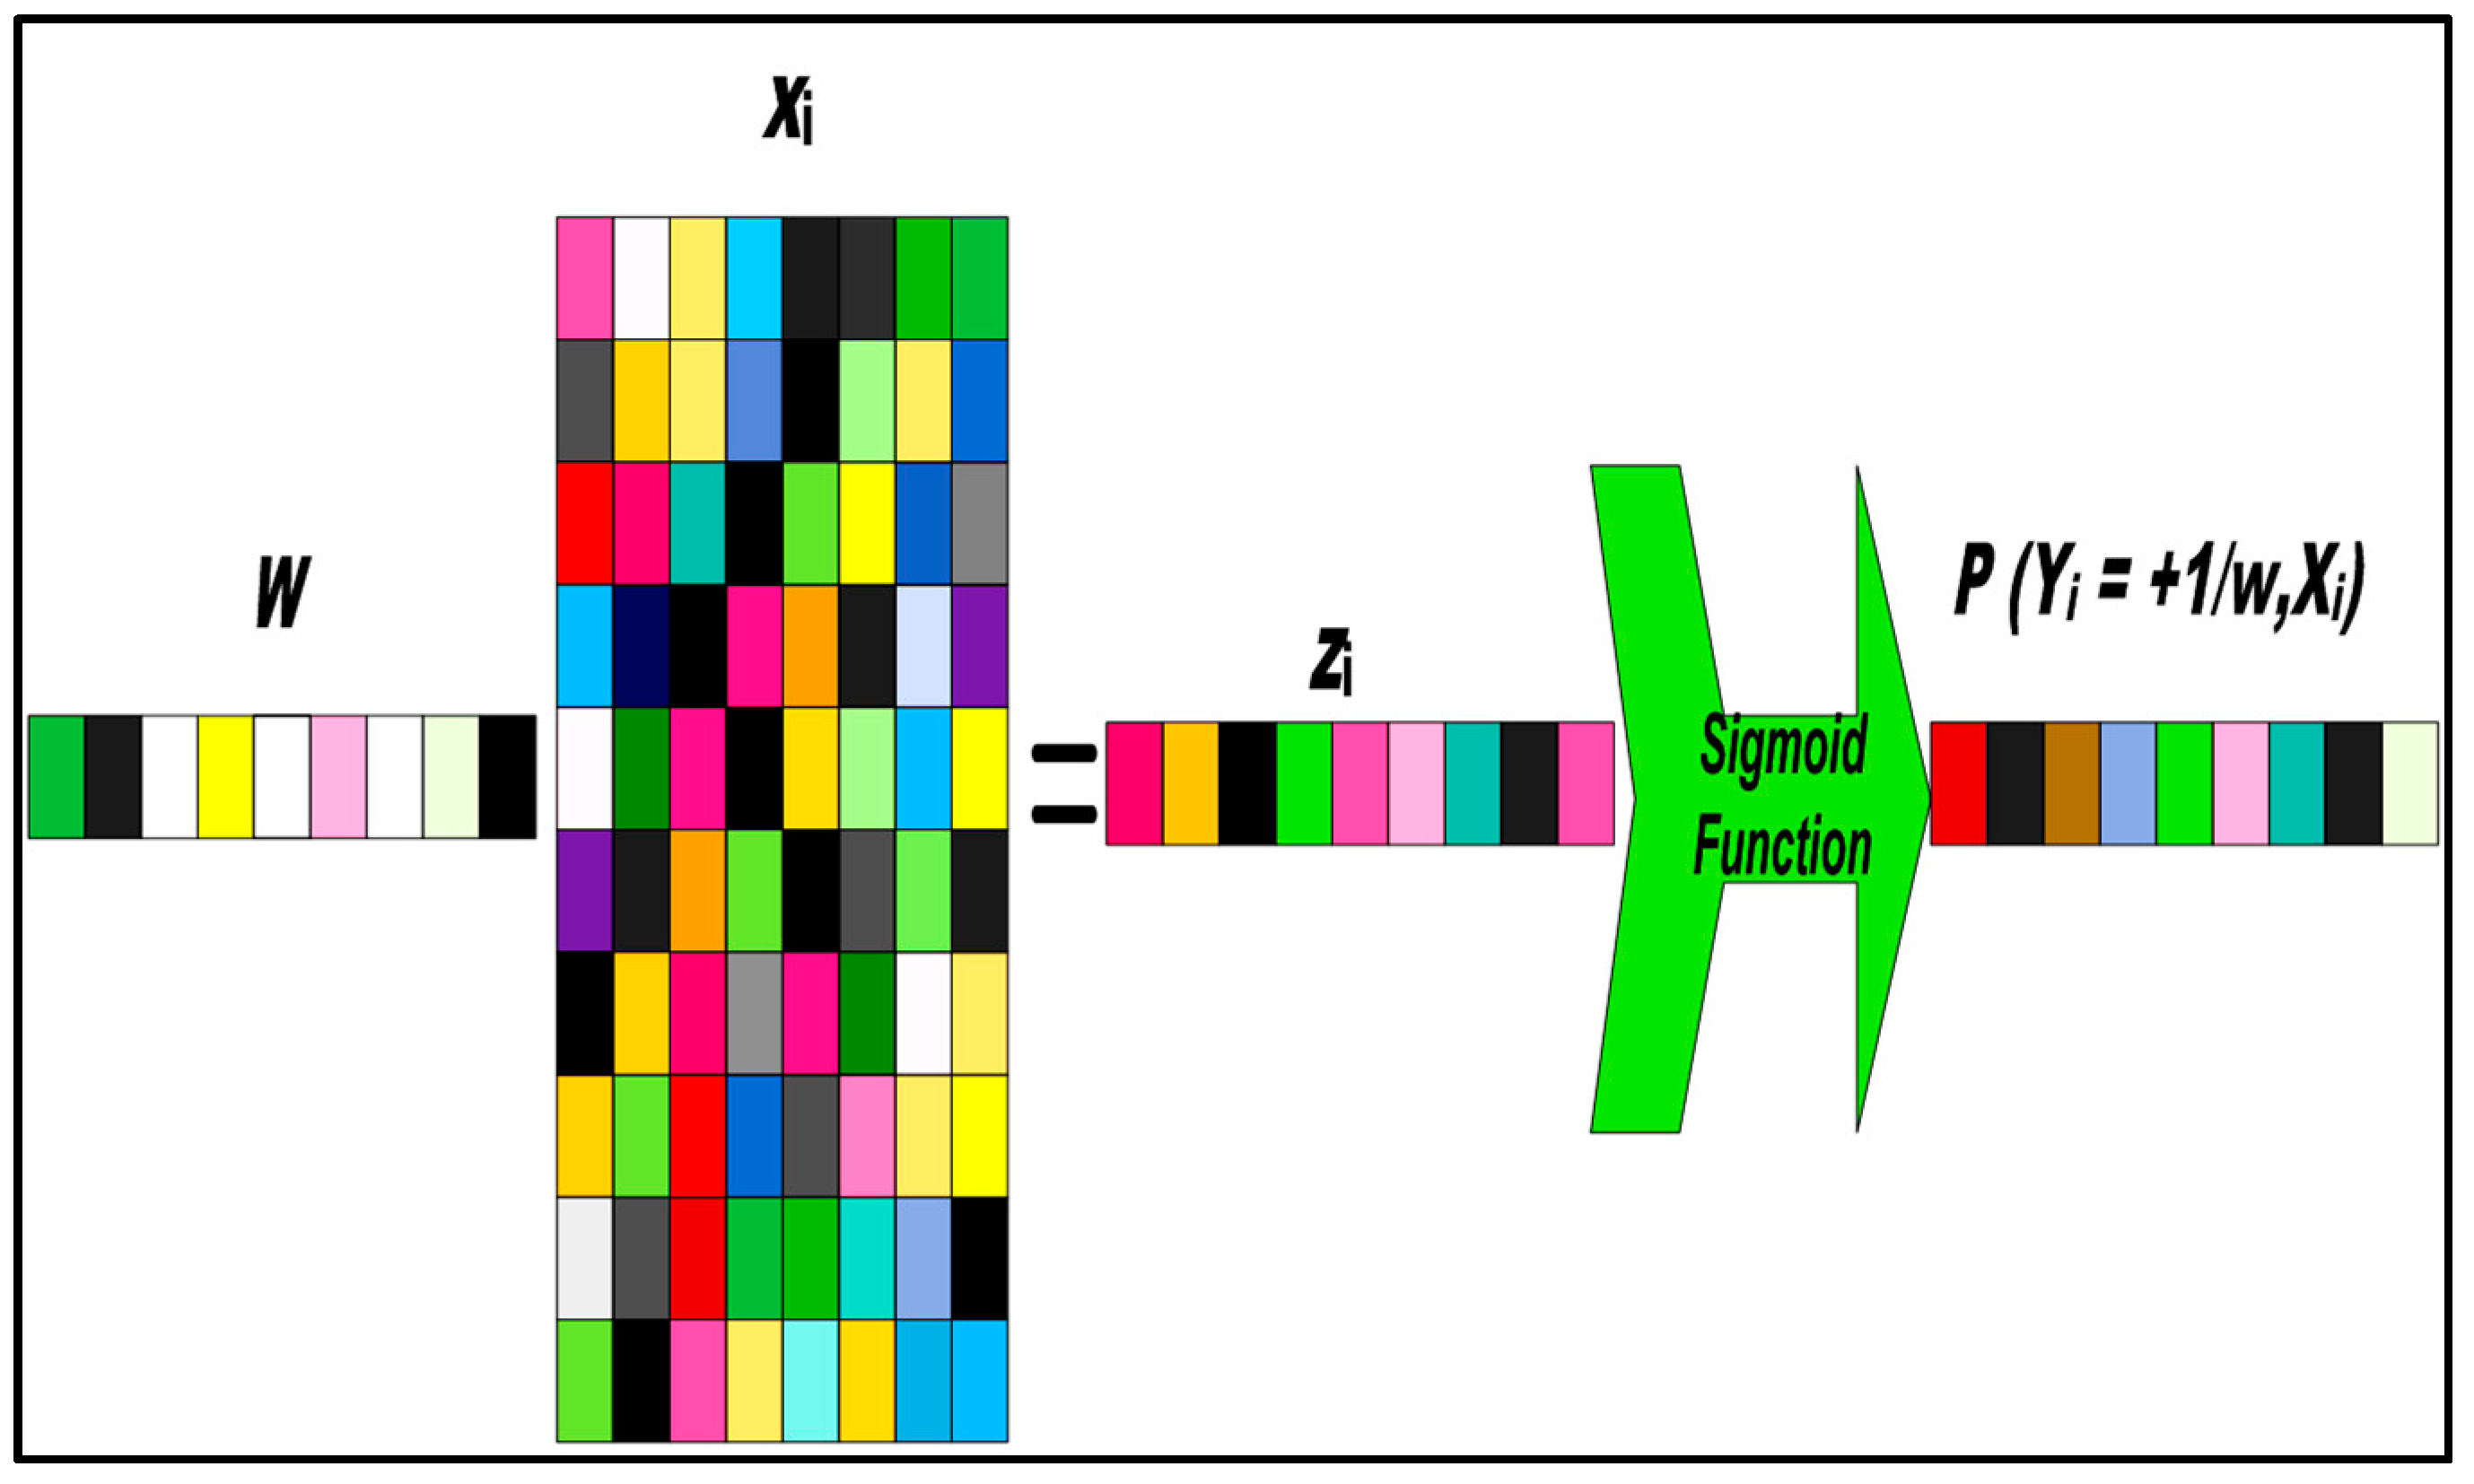
Sparse logistic regression (SPLR) (Lasso) feature selection. The are the feature sets. The is sparse coefficient vector and white element in the stand for zero elements (sparse data) and rest of all are selected feature.
Figure 2.
Sparse logistic regression (SPLR) (Lasso) feature selection. The are the feature sets. The is sparse coefficient vector and white element in the stand for zero elements (sparse data) and rest of all are selected feature.

Figure 3.
Estimation picture for the ℓ1-norm regularization (Lasso).
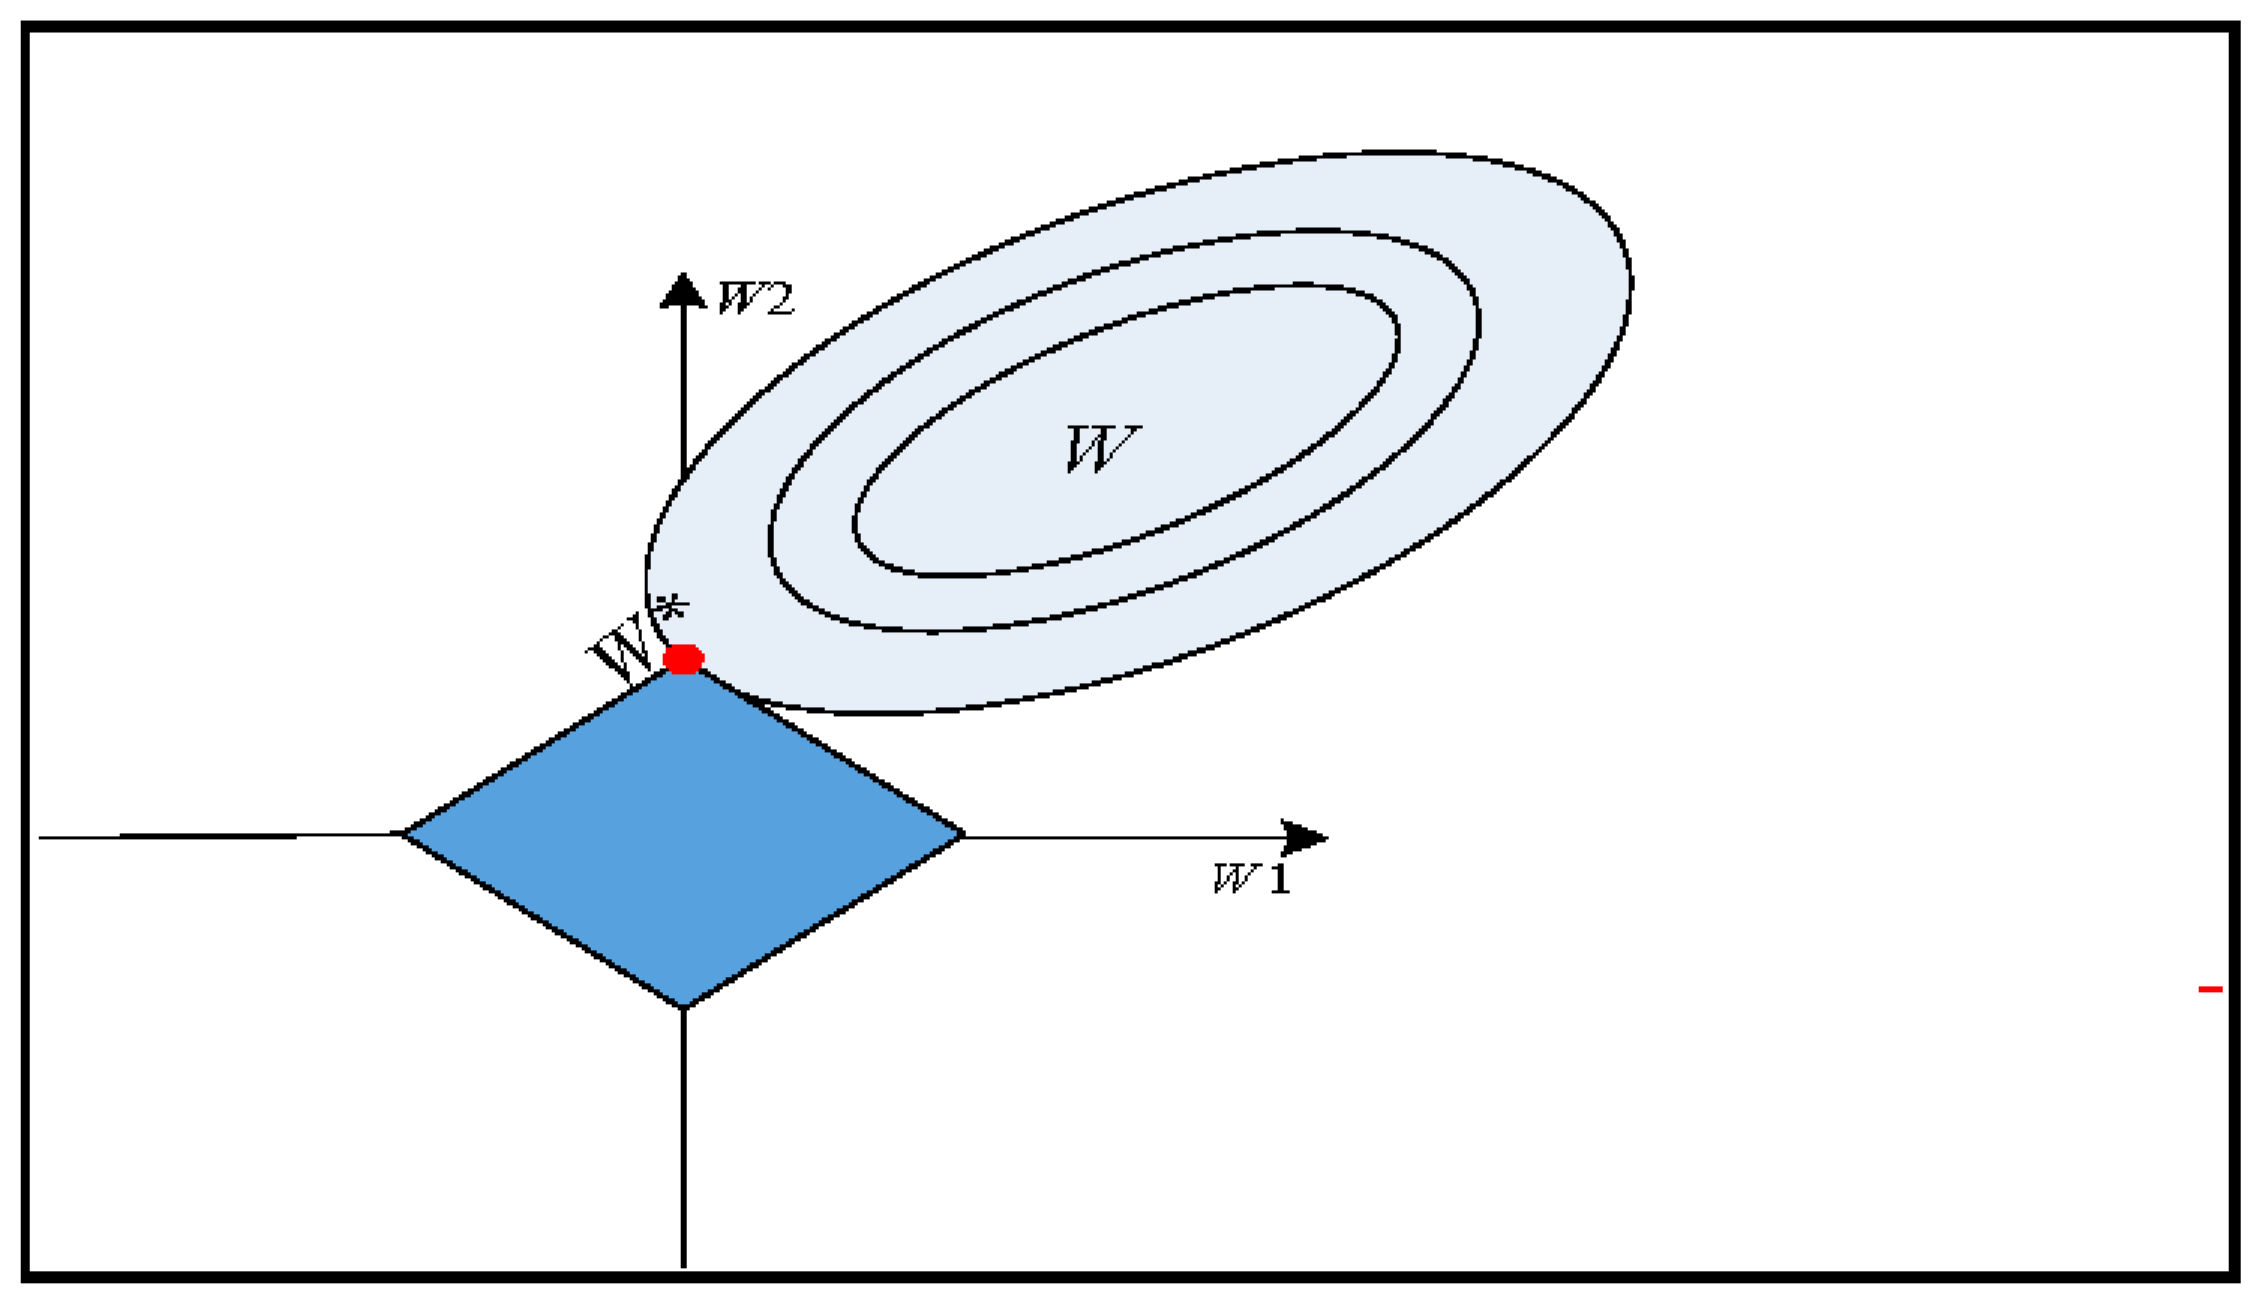
Figure 4.
A taxonomy of SPLR for the IDS.
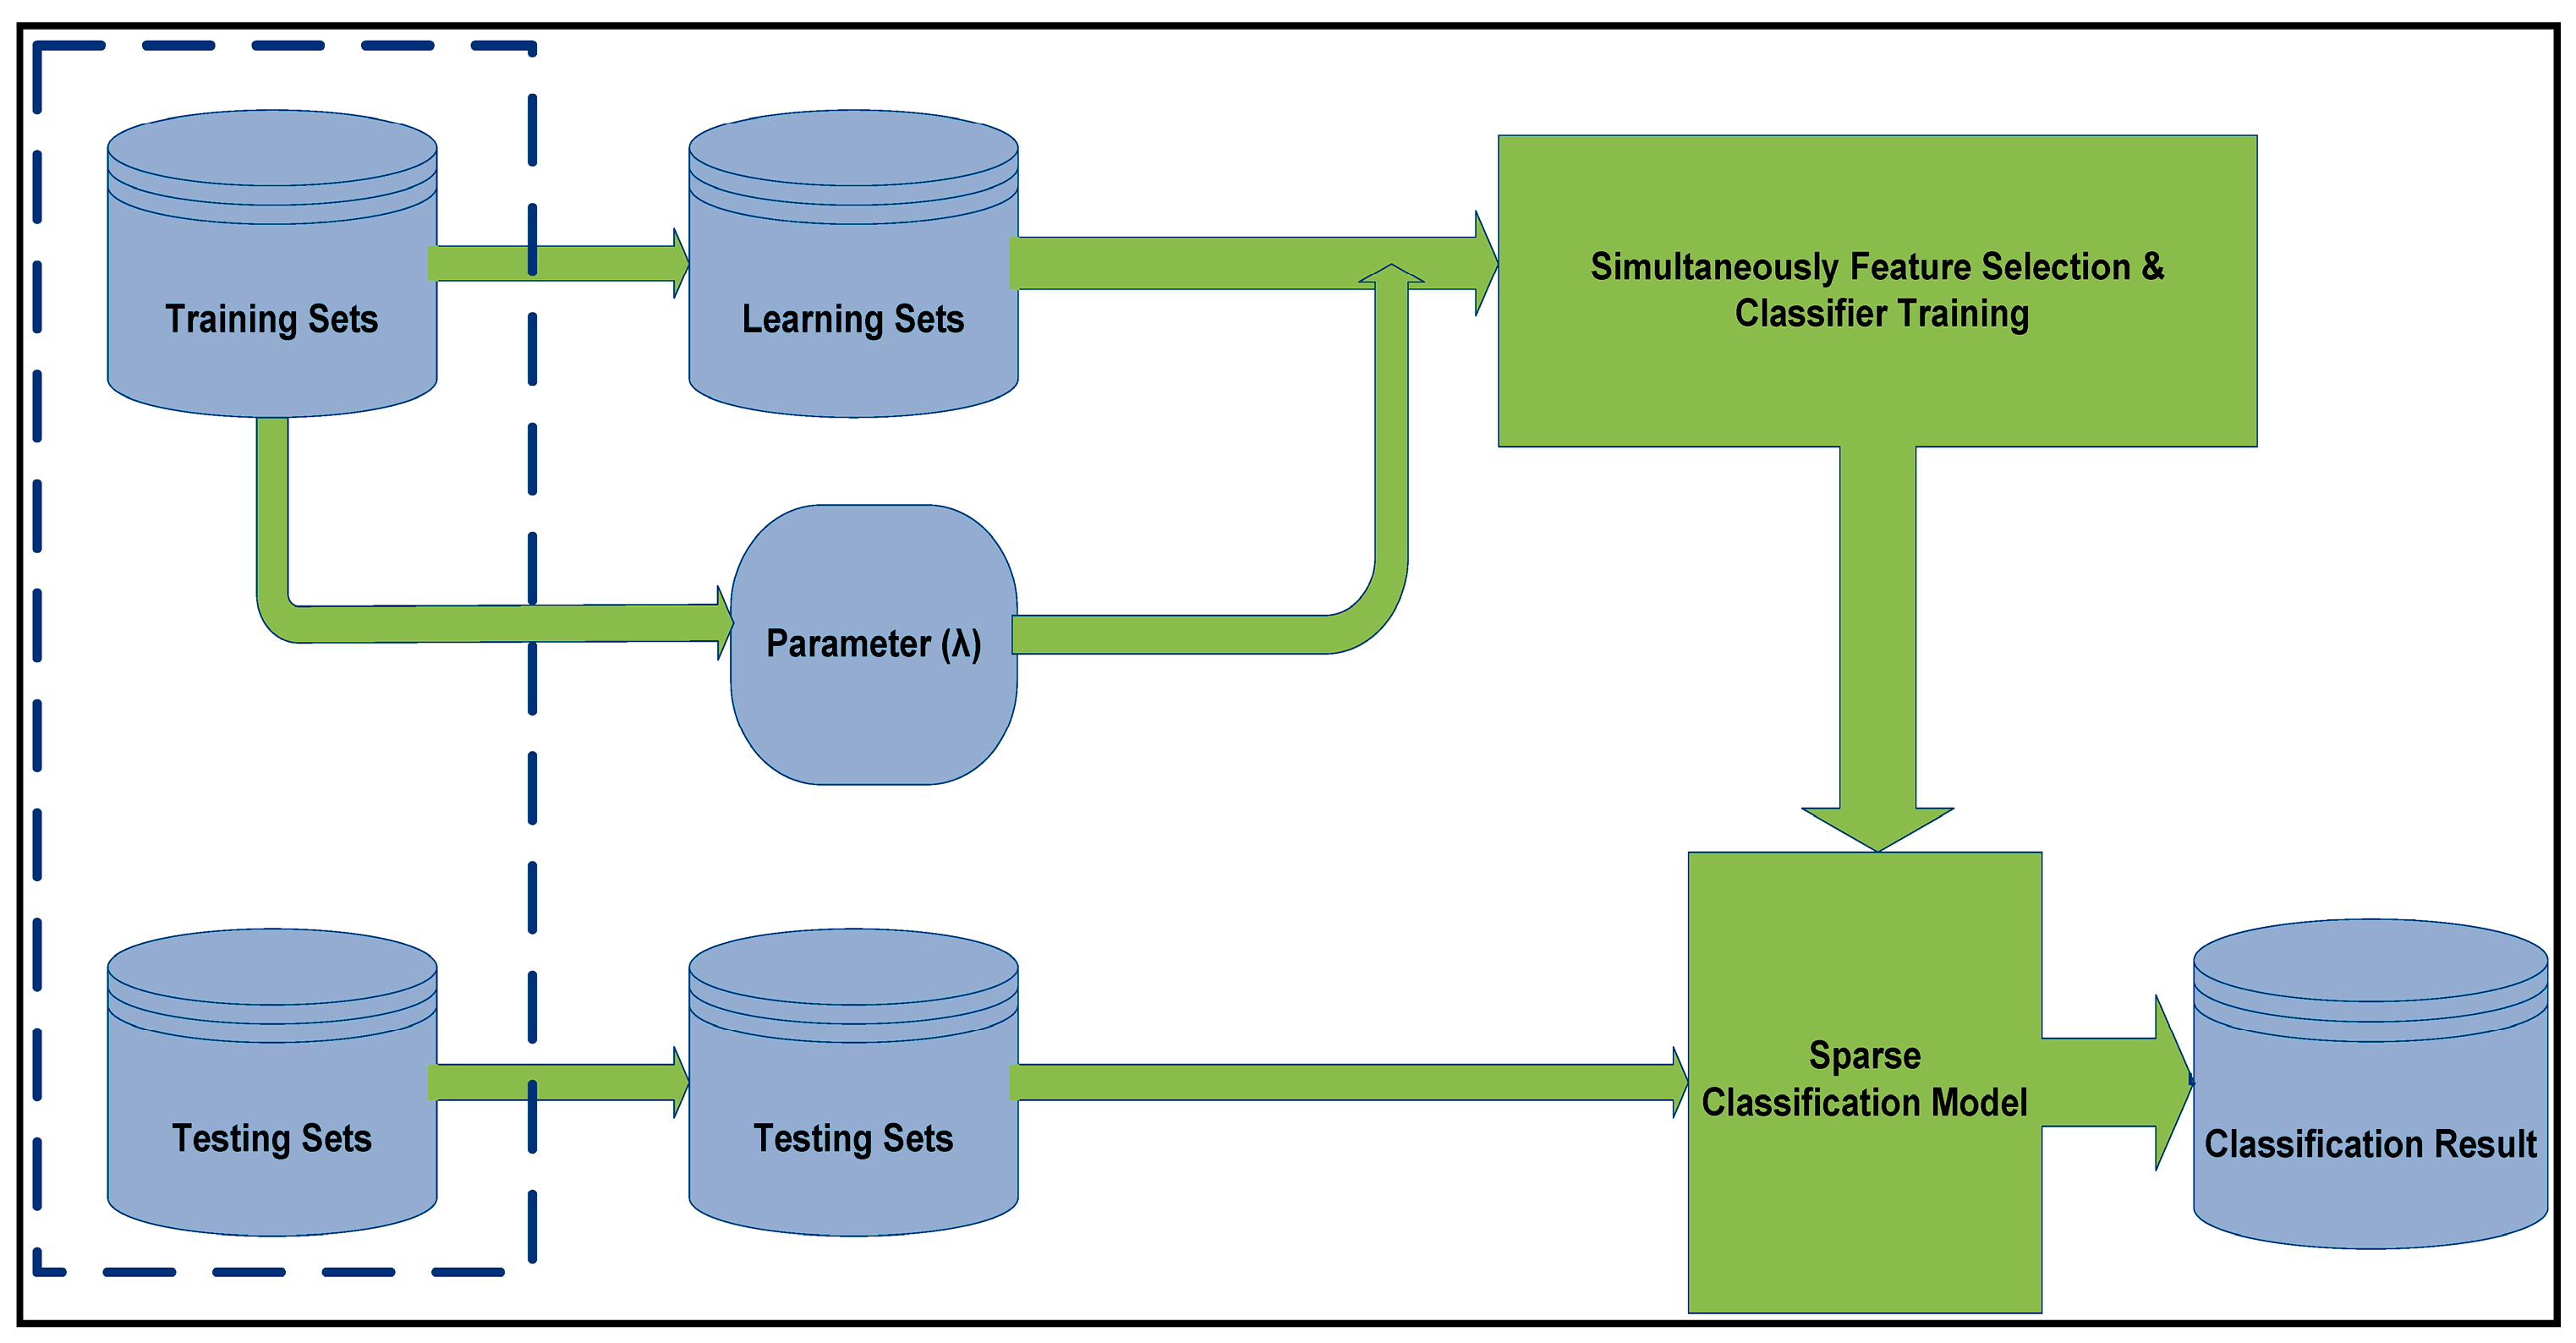
Figure 5.
(a,b) Overall Classification Accuracy (OCA) and Feature Selection (FS) along with degree of sparsity by SPLR on KDD ’99.
Figure 5.
(a,b) Overall Classification Accuracy (OCA) and Feature Selection (FS) along with degree of sparsity by SPLR on KDD ’99.

Figure 6.
(a–d) Feature selection and degree of sparsity via SPLR on KDD ’99 dataset.

Table 1.
KDD ’99 dataset descriptions.
| Class | Training Samples | Testing Sample |
|---|---|---|
| Normal | 972,780 | 60,592 |
| Denial of Service (DoS) | 3,883,370 | 237,594 |
| Probe | 41,102 | 2377 |
| Remote-to-Local (R2L) | 16,347 | 8606 |
| User-to Root-(U2R) | 52 | 70 |
| Total Samples | 4,898,430 | 311,028 |
Table 2.
Feature list of KDD ’99.
| S.No | Attributes | S.No | Attributes |
|---|---|---|---|
| 1 | Duration | 22 | is_guest_login |
| 2 | protocol_type | 23 | count |
| 3 | Service | 24 | srv_count |
| 4 | Flag | 25 | serror_rate |
| 5 | src_byte | 26 | srv_serror_rate |
| 6 | dst_bytes | 27 | rerror_rate |
| 7 | land | 28 | srv_error_rate |
| 8 | wrong_fragmnet | 29 | same_srv_rate |
| 9 | urgent | 30 | diff_srv_rate |
| 10 | Hot | 31 | srv_diff_host_rate |
| 11 | num_failed_logins | 32 | dst_host_count |
| 12 | logged_in | 33 | dst_host_srv_count |
| 13 | num_compromised | 34 | dst_host_srv_rate |
| 14 | root_shell | 35 | dst_host_diff_srv_rate |
| 15 | su_attempted | 36 | dst_host_same_src_port_rate |
| 16 | num_root | 37 | dst_host_srv_diff_host_rate |
| 17 | num_file_creations | 38 | dst_host_serror_rate |
| 18 | num_shells | 39 | dst_host_svr_serror_rate |
| 19 | num_access_files | 40 | dst_host_rerror_rate |
| 20 | num_outbound_cmds | 41 | dst_host_srv_rerror_rate |
| 21 | is_hot_login |
Table 3.
KDD ’99 attack descriptions.
| Attack Classes | Training Dataset Attacks (22) |
|---|---|
| Denial of Service (DOS) | Back, Land, neptune, pod, smurf, teardrop |
| Remote to Local (R2L) | ftp_write, guess_passwd, imap, multihop, phf, spy, warezclient, warezmaster |
| User To Root (U2R) | buffer_overflow, perl, loadmodule, rootkit |
| Probing | ipsweep, nmap, portsweep, satan |
Table 4.
Dataset descriptions.
| Class | Training Samples | % of Occurrence |
|---|---|---|
| Normal | 812,814 | 75.6 |
| Denial of Service | 947,267 | 22.9 |
| Probe | 13,853 | 1.29 |
| R2L | 997 | 0.089 |
| U2R | 54 | 0.0047 |
| Total Samples | 1,774,985 | 100 |
Table 5.
Experimental performance comparison of SPLR with other classifier models.
| Algorithms | Size of Training Dataset | Size of Testing Dataset | DR (%) | Train Time (s) | Average Training Time per Sample (s) |
|---|---|---|---|---|---|
| VFDT [19] | 1,074,985 | 67,688 | 93.83 | 39.88 | 0.000003 |
| SPLR | 1,074,985 | 67,688 | 97.65 | 11.6 | 0.000001 |
| Bayes Net [29] | 49,596 | 15,437 | 90.62 | 6.28 | 0.00001 |
| J48 [29] | 49,596 | 15,437 | 92.06 | 15.85 | 0.00003 |
| LBK [29] | 49,596 | 15,437 | 92.22 | 10.63 | 0.00002 |
| C4.5 [30] | 49,596 | 15,437 | 92.06 | 15.85 | 0.0003 |
| Fuzzy Logic [31] | 49,596 | 15,437 | 91.65 | 192.16 | 0.0038 |
| SPLR | 49,596 | 15,437 | 98.26 | 7.5 | 0.000001 |
Table 6.
Performance Comparison of SPLR with other classifier models.
| Algorithm | Size of Training Datasets | Size of Testing Datasets | DR (%) | Train Time (s) | Average Training Time per Sample (s) |
|---|---|---|---|---|---|
| SVM [32] | 1,132,365 | 73,247 | 57.6 | 62,424 | 18.14 |
| GP [33] | 24,780 | 311,028 | 96.7 | 6480 | 0.2615 |
| ANN [12] | 4947 | 3117 | 92.27 | 780 | 0.1576 |
| MARS [34] | 11,982 | 11,982 | 96.46 | 30.66 | 0.0025 |
| Naïve Bayes [35] | 65,525 | 65,525 | 95 | 1.89 | 0.0013 |
| I T I [36] | 169,000 | 311,029 | 92.38 | 18 | 0.00002 |
| PD Tree [37] | 444,458 | 49,384 | 46.67 | 48.8 | 0.00002 |
| K-Means [38] | 55,000 | 25,000 | 86 | 13 | 0.00002 |
| Apriori [35] | 444,458 | 49,384 | 87.5 | 18.94 | 0.000005 |
| SPLR | 1,074,985 | 67,688 | 97.65 | 11.6 | 0.000001 |
© 2017 by the authors. Licensee MDPI, Basel, Switzerland. This article is an open access article distributed under the terms and conditions of the Creative Commons Attribution (CC BY) license (http://creativecommons.org/licenses/by/4.0/).
Share and Cite
MDPI and ACS Style
Shah, R.A.; Qian, Y.; Kumar, D.; Ali, M.; Alvi, M.B. Network Intrusion Detection through Discriminative Feature Selection by Using Sparse Logistic Regression. Future Internet 2017, 9, 81. https://doi.org/10.3390/fi9040081
AMA Style
Shah RA, Qian Y, Kumar D, Ali M, Alvi MB. Network Intrusion Detection through Discriminative Feature Selection by Using Sparse Logistic Regression. Future Internet. 2017; 9(4):81. https://doi.org/10.3390/fi9040081
Chicago/Turabian StyleShah, Reehan Ali, Yuntao Qian, Dileep Kumar, Munwar Ali, and Muhammad Bux Alvi. 2017. "Network Intrusion Detection through Discriminative Feature Selection by Using Sparse Logistic Regression" Future Internet 9, no. 4: 81. https://doi.org/10.3390/fi9040081
Note that from the first issue of 2016, this journal uses article numbers instead of page numbers. See further details here.