Article

Cost Forecasting of Substation Projects Based on Cuckoo Search Algorithm and Support Vector Machines

School of Economics and Management, North China Electric Power University, Beijing 102206, China
*
Author to whom correspondence should be addressed.
Sustainability 2018, 10(1), 118; https://doi.org/10.3390/su10010118
Submission received: 4 December 2017 / Revised: 30 December 2017 / Accepted: 31 December 2017 / Published: 5 January 2018
(This article belongs to the Special Issue Circular Economy, Ethical Funds, and Engineering Projects)

Abstract

:
Accurate prediction of substation project cost is helpful to improve the investment management and sustainability. It is also directly related to the economy of substation project. Ensemble Empirical Mode Decomposition (EEMD) can decompose variables with non-stationary sequence signals into significant regularity and periodicity, which is helpful in improving the accuracy of prediction model. Adding the Gauss perturbation to the traditional Cuckoo Search (CS) algorithm can improve the searching vigor and precision of CS algorithm. Thus, the parameters and kernel functions of Support Vector Machines (SVM) model are optimized. By comparing the prediction results with other models, this model has higher prediction accuracy.

1. Introduction

The prediction of the cost level of the power grid project is an important part of the economic evaluation of the power system. Grid projects are often capital-intensive and have high technical requirements [1]. It is of great significance to predict the cost level of grid projects effectively for improving the investment efficiency and sustainability. Grid projects mainly include transmission projects and substation projects, and these two types of projects are directly related to the safety production, normal operation, and economic benefits of the power grid. At present, there are many researches on the cost prediction of transmission project [2,3]. Whereas, few scholars have studied the cost prediction of the substation project [4,5]. In the construction of substation projects, a reasonable cost prediction can provide decision support and reference for the power grid companies, which is also helpful to promote the sustainable development of the investment in substation projects [6]. However, due to the impact of regional economic development, the surrounding natural environment and project management level, the cost of substation projects often tends to be non-linear, irregular, and difficult to predict [7].
Scholars around the world have conducted in-depth studies on the cost of transmission and substation projects. The researches mainly include the construction and prediction of transmission project cost index [8,9], the analysis of transmission and substation project cost affecting factors [10,11,12], and the prediction of substation project cost [13], etc. In terms of constructing the cost index, Liu et al. [8] built the cost index of power grid projects by considering different technologies and voltage classes, and obtained the total project cost index by weighting the typical program, in which the weight could be determined by the Paasche index analysis method or Laspeyres index analysis method. Tao et al. [3] selected more than 300 cost indicators of transmission projects from 2002 to 2010, and pointed out that changes of transmission project cost were affected by the previous period. The Markov chain prediction model was applied to describe the changes of each period. In addition, the total investment of transmission project was composed of the construction cost, the installation cost, the equipment cost, and other expenses. From the four parts, nine key indicators were selected as the comprehensive cost index to be predicted. Hua et al. [9] constructed cost index analysis and prediction model based on Autoregressive Integrated Moving Average Model (ARIMA) and exponential smoothing models, and then, realized the process of modeling and obtained forecast results through SPSS software, which have some references meaning for the application of prediction method.
In terms of the analysis of affecting factors of project cost, Wang et al. [12] set up the evaluation system of cost index of 500 kV transmission project according to the samples of transmission project cost. Activity Based Classification (ABC) analysis, key parameter simplification, and principal component analysis were applied to deal with the samples. Three level indexes and their calculation formulas were obtained through calculation. Furthermore, the Least Squares Support Vector Machine (LSSVM) based on particle swarm optimization was used to calculate and verify the evaluation index system; the results proved that the proposed model has high prediction accuracy. The influence of various factors on the cost of substation engineering was studied from the aspects of technology, organization, external environment, and cost parameters in [13].
In the prediction of project cost, the prediction methods mainly include time series method, multiple regression model, and intelligent prediction method, and the selection of prediction methods could affect the accuracy of prediction results directly. Xu et al. [14] pointed out that the building cost index had been widely used to measure the cost level of the construction industry. However, to improve the accuracy of measurement, the interaction between the cost indices and other variables (such as consumer price index) should be considered. Therefore, the cointegration theory and Vector Auto Regression (VAR) model was proposed for predicting the changes of construction cost, which could assess the risk and uncertainty of rising costs. Zhu et al. [15] took the situation of the region, transaction date, transaction conditions, and individual factors into account firstly to construct a hierarchical structure system of real estate price factors. Then, the 1–9 scale was used to build the comparison judgment matrix and the ranking weight of case level relative to price could be calculated layer by layer. Moreover, the stochastic fuzzy regression analysis method was introduced to predict the cost of residential buildings accurately. Shahandashti et al. [16] pointed that the cost of highway construction could vary greatly over time, which was directly related to the income of highway contractors. Therefore, the research selected sixteen indices from the National Highway Construction Cost Index (NHCCI) as candidate indices through the literature research. Based on the results of the co-integration test, a Vector Error Correction (VEC) model was established to predict the construction cost index of national highway and the results showed that the multivariate time series model was more accurate than the single variable model.
In the field of intelligent prediction model, scholars had explored a series of high-precision intelligent prediction methods. Qin et al. [17] considered qualitative and quantitative cost index as an input set and a single cost as an output set of indicators. The correlation of housing project cost input indicators could be eliminated by means of principal component analysis. Support Vector Machines (SVM) and LSSVM were applied, respectively, to predict the cost of 25 residential projects in Hangzhou, in which the prediction error was within 7%. Zhou et al. [18] predicted the cigarette sales based on LSSVM and optimized the LSSVM parameters on the basis of the improved Cuckoo Search (CS) algorithm. The introduction of inertia weights in the path and location updates of the cuckoo nest helped to avoid falling into local optimum. When considering the after-effectiveness of cigarette sales, the best time delay was determined by comparing the prediction accuracy under different delay numbers, and the cigarette sales at the current time and five time periods ahead was proved to be corresponding by calculating the actual data. Besides, this article made multi-step prediction through the iterative method and predicted the sales volume of cigarettes in different periods in the future, which improved the dynamics of the prediction. Shao et al. [19] proposed that it was of great practical significance to explain the dependence between medium-term demand and external variables scientifically. He solved the problem of nonlinear power demand prediction by combining Ensemble Empirical Mode Decomposition (EEMD) method with semi-parametric model. The model could capture the potential important features, including the climate and economic development from the original electricity demand data. Reliable confidence interval of longer term fluctuation trend was obtained by means of predicting the actual monthly electricity demand data from Suzhou and Guangzhou.
However, the accuracy of the existing prediction methods cannot meet the requirements of the modern management of power grid projects. In view of the above problems based on the traditional prediction methods, this paper proposes an optimized SVM model based on the improved CS algorithm that decomposed by EEMD to predict the substation projects’ cost.

2. Basic Theory

2.1. EEMD

Empirical Mode Decomposition (EMD) method can decompose the irregular signal into a number of well-characterized Intrinsic Mode Function (IMF) components, and EMD algorithm is essentially a stationary signal process [20,21,22,23,24]. However, due to the existence of modal aliasing in the EMD algorithm, the precision and breadth of the EMD algorithm are restricted. In this paper, it is chosen to add the uniformly distributed Gaussian white noise signal to the EMD to decompose the signal, in order to avoid the EMD algorithm modal aliasing influences. This decomposition method is the EEMD algorithm, and the steps of the algorithm are as follows [25,26,27,28]:
  • Determine the number of decomposed IMFs and the number of decompositions
  • Add Gaussian white noise sequence to the input signals
  • Normalize the signals after adding the white noise sequence
  • Decompose the normalized signals to obtain multiple IMF components and one surplus variable:
    X ( t ) = i = 1 N j = 1 M c j , i ( t ) ,   i = 1 N ,   j = 1 M
    x ( t ) = 1 N i = 1 N j = 1 M c j , i ( t ) = i = 1 N 1 σ i ( t ) + r ( t ) ,   i = 1 N ,   j = 1 M
Among them r ( t ) is the remainder. The method is applied to predict the cost level of substation project. The original irregular cost data can be decomposed into a number of stationary IMF components through the EEMD processing, which are then input into the SVR model for prediction. Finally, the predictive value of substation project cost level can be obtained by adding the total amount.

2.2. SVM

SVM was proposed by Cortes and Vapnik in 1995 [29,30,31], which can solve the small sample and complex nonlinear regression problems effectively. It maps the data X i into high-dimensional space F by nonlinear mapping ϕ , and performs linear regression in high-dimensional space. The mapped linear function is f ( x ) = ω ϕ + b , which is used to solve the optimal function Equation (1) by finding the weight ω and threshold b in the linear function, according to the SVM criterion [32,33,34,35].
min 1 2 ω 2 + C i = 1 l ξ i
s . t . { y i ( ω ϕ + b ) 1 ξ i ξ i 0 C > 0
The above problem can be transformed into a dual problem by introducing Lagrange multiplier α i 0 , β i 0 , thus the classification decision function of SVM becomes:
f ( x ) = sgn ( i = 1 l y i α i K ( x i , x j ) + b )
K ( x i , x j ) in the formula is a kernel function. This paper selects radial basis function (RBF) as a kernel function.
K ( x i , x j ) = exp ( x i x j 2 2 σ 2 )
where σ is the width of the kernel function.
The key to the accuracy of SVM regression model is the penalty factor C and the width of kernel function σ [36]. Therefore, this paper chooses the improved CS algorithm to optimize C and σ in order to improve the generalization ability of SVM.

2.3. Optimized CS Algorithm

The CS algorithm can search the optimization much faster and more accurately by simulating the random walking process of cuckoo in the search for the suitable egg laying hosts [37,38,39]. According to existing research, the CS algorithm has the following three rules [40,41]:
  • The number of eggs produced by a cuckoo per time is 1.
  • The host bird’s nest where high-quality eggs are located is the optimal solution and will be retained for the next generation.
  • The number of host nests is certain, and the probability that cuckoo eggs are found by nest owners is P a [ 0 , 1 ] .
During the search, cuckoo’s flight search path follows the Lévy distribution, namely:
x i ( t + 1 ) = x i ( t ) + α L ( λ )   i = 1 , 2 , , n
where x i ( t + 1 ) and x i ( t ) are the bird’s nest positions of the (t + 1)th and the tth generation, n is the number of cuckoo, is the point to point multiplication, and L ( λ ) is the Lévy flight path. The relationship between searching path and time is as follows:
L ( λ ) u = t λ ( 1 < λ 3 )
In the traditional CS algorithm, the probability of finding cuckoo eggs and the step size α of position updating are fixed values, which leads to the problems of the weak global searching ability, slow convergence speed, and low precision. Therefore, an improved cuckoo algorithm is proposed in this paper to update the values of P a and α dynamically, as follows [42,43]:
P a ( t ) = P a max t ( P a max P a min ) N
α ( t ) = α max e ln ( α max α min ) × t N
where t and N are the number of current iterations and the total number of iterations, P a max and P a min are the maximum and minimum values of the detection probability, α max and α min are the maximum and minimum step coefficients.
However, CS algorithm has defects of lacking of search vitality and slow speed of. The optimization ability of CS algorithm can be improved effectively by adding Gauss perturbation [44]. Assuming that the optimal location of the nest x i ( i ) , ( i = 1 , 2 , , n ), is obtained after the calculation of t times CS iterations. In order to prevent the next iteration of x i ( i ) and maintain the Gaussian disturbance, the next phase of x i ( i ) is searched. Suppose that the matrix p t = [ x 1 ( t ) , x 2 ( t ) , , x n ( t ) ] r is made up of the better position x i ( i ) of the bird’s nest, x i ( i ) is a d-dimensional vector, and the dimension of p t is d × n . Matrix p t combined with Gaussian perturbation is the basic step of GCS algorithm, namely:
p t = p t + a ε
where ε is a random matrix with the same order of p t , which follows N(0,1) distribution, and a is constant. In the search for a better nest position vitality at the same time, the position of the bird’s nest can be overextended easily because of the large random range of ε . Therefore, the selection of suitable a is particularly important. After obtaining a reasonable set of p t and comparing it with each nest in p t , only a better nest position is reserved to obtain a better set of nest positions p t [45].

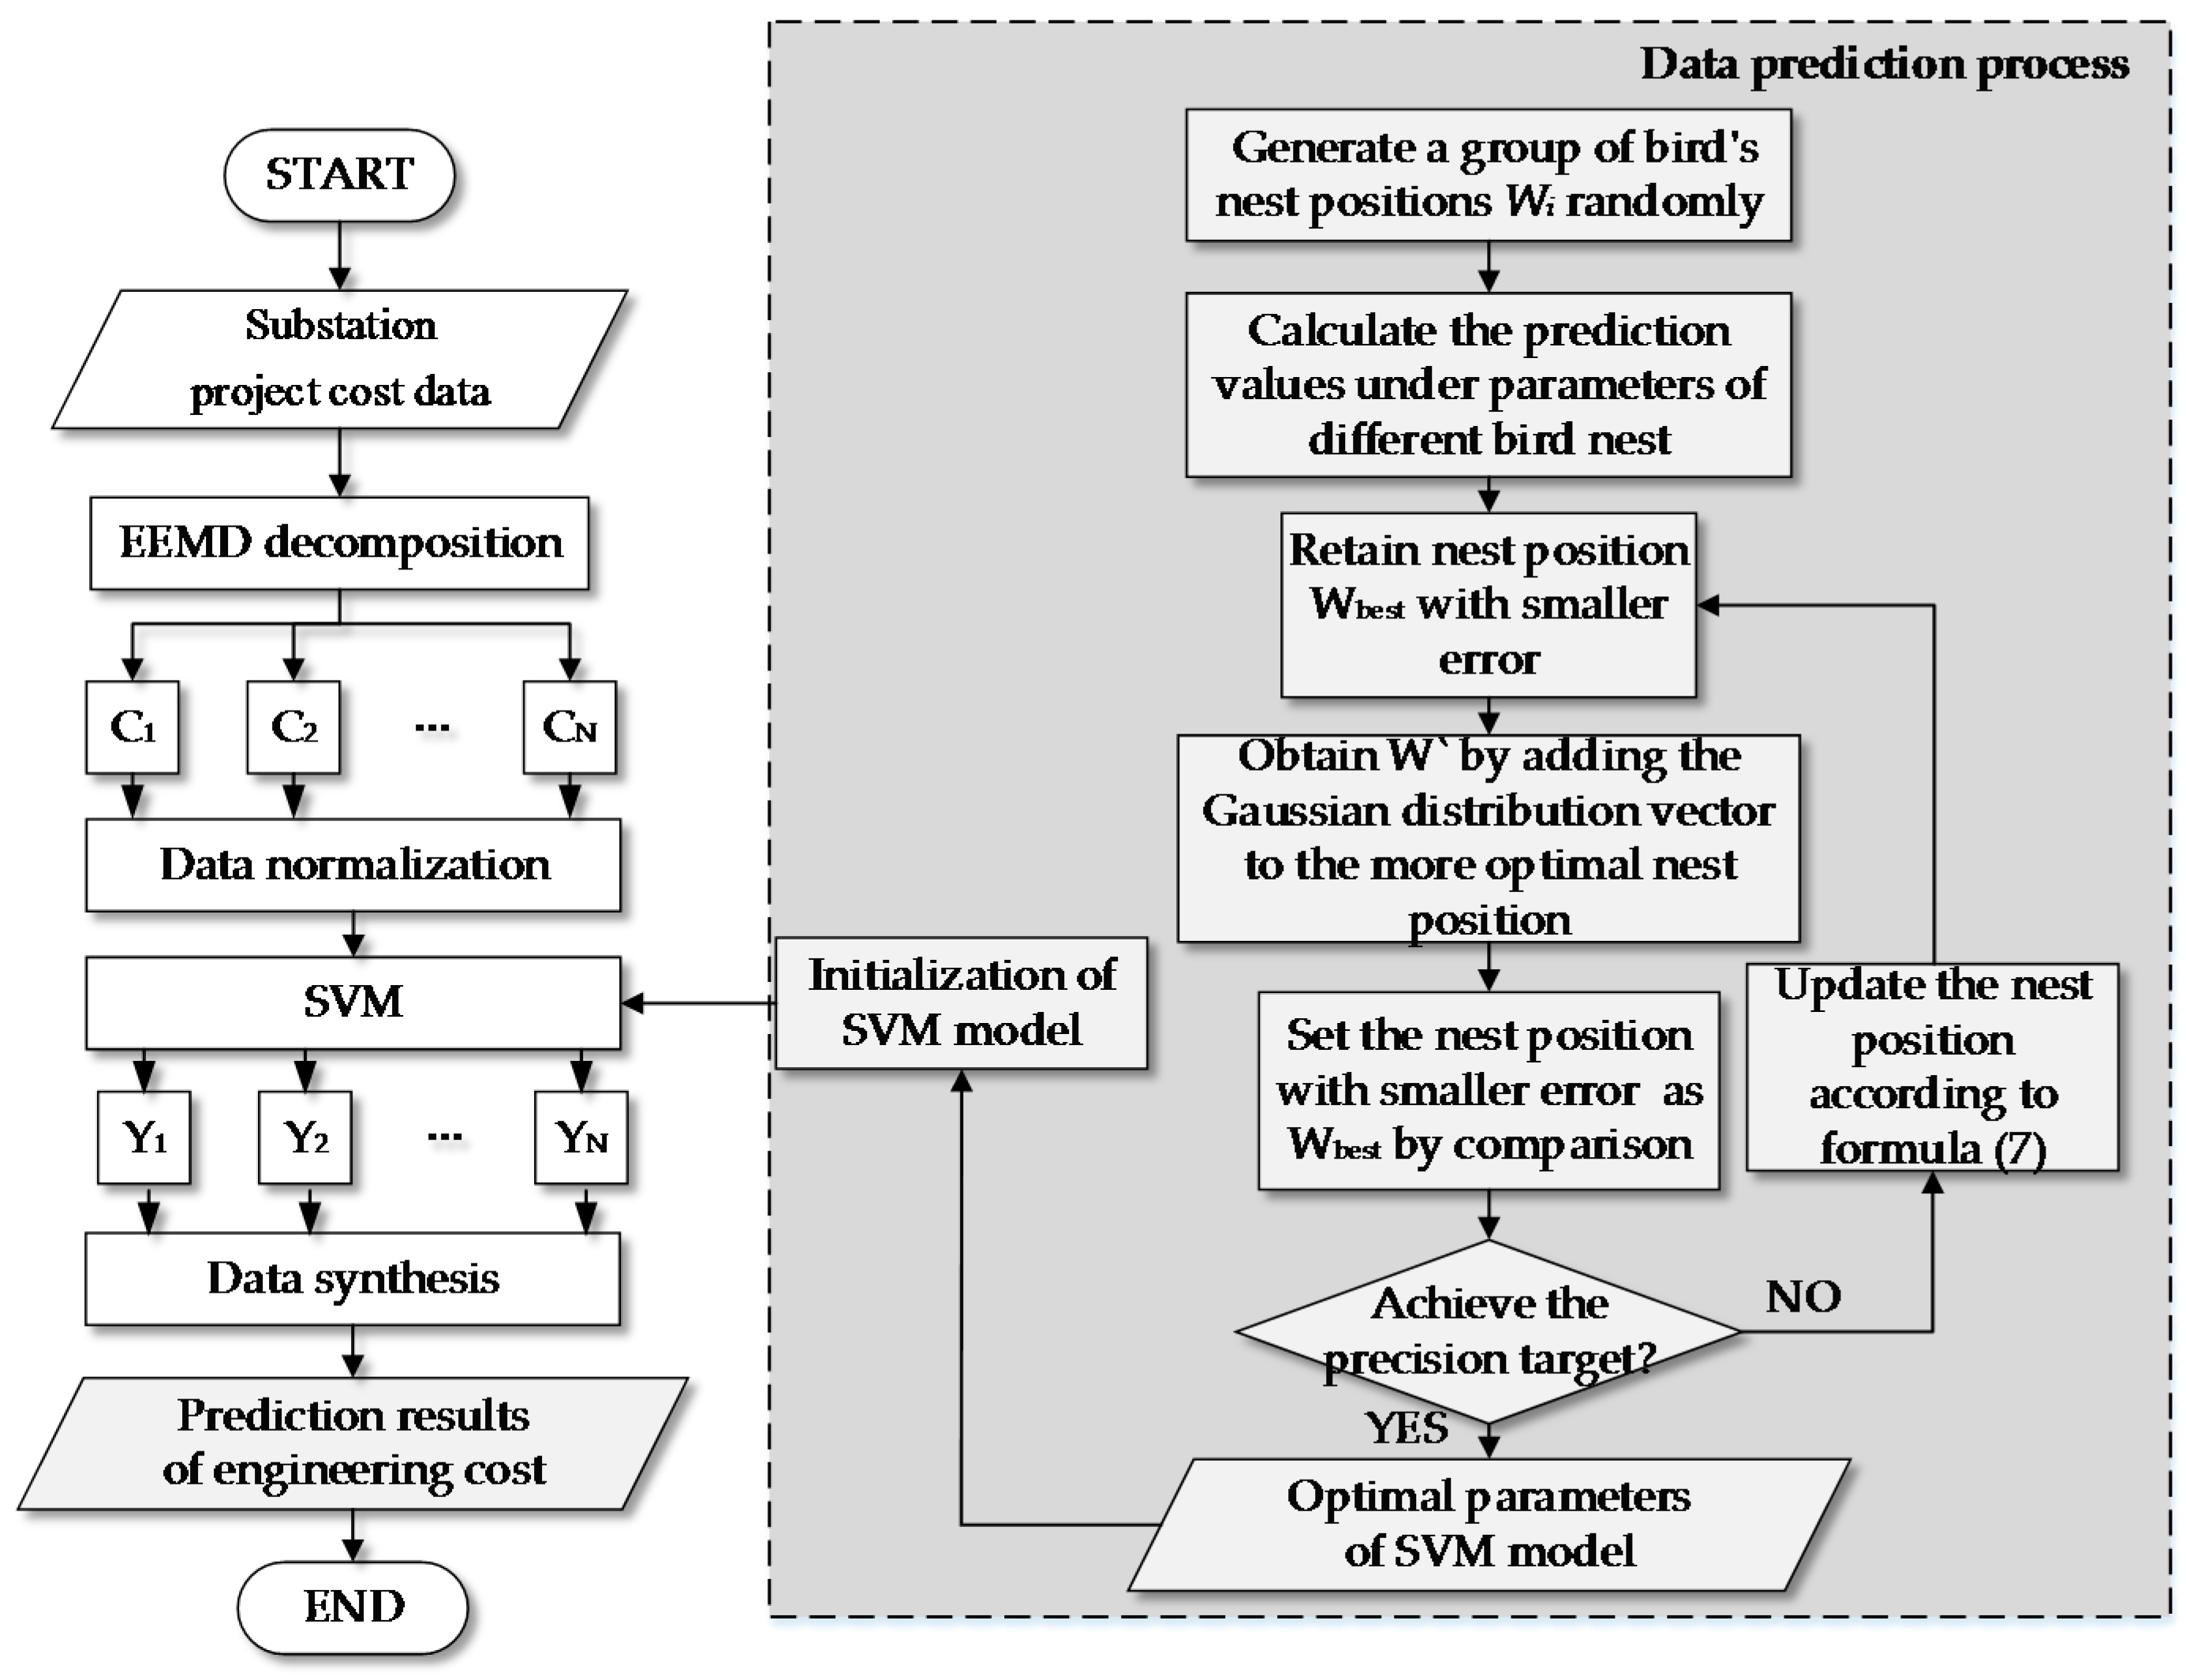
3. Substation Project Cost Prediction Model Based on EEMD-GCS-SVM

The cost prediction of substation project is affected by many factors, and the cost level is non-stationary and irregular. The specific process of substation project cost prediction model based on EEMD-GCS-SVM is shown in the Figure 1. Specific steps are:
  • Decompose the substation cost data to obtain the IMF components and surplus variables through the EEMD method, and normalize the data.
  • Initialize the parameters and kernel functions of SVM model, input the normalized decomposed variables into SVM model, and find and determine the optimal parameters and kernel function of SVM model by using GCS algorithm. In order to search for the best parameters of the prediction model faster, the range of c, ε are set as [0.01, 100], [0.01, 100], respectively. Then, train the prediction model by plugging the historical data into the model and search the best parameter by using the GCS Algorithm. Firstly, set the Nnest (number of birds’ nest) as 20, while Pa (probability of bird’s eggs by bird’s nest owner) is 0.45, and N (number of iterations) is 200. After that, randomly generate Nnest bird nest location W = (W1, W2, ..., Nnest)T. Each bird nest Wi has s parameters (s = the number of weights between input layer and hidden layer + the number of weights between hidden layer and output layer + the number of translation factors + the number of expansion factors). The predicted values of each bird’s nest were calculated, and the nest which has the smallest error in the 20 nests is found, marked as Wbest. Then Wbest retain to the next generation.
  • Train the SVM model by using the training set, and then input the test set data to obtain the predictive value of the cost data.

4. Example Analysis

4.1. Basic Data

There are a lot of voltage levels in the substation projects. 220 kV is a widely used voltage level of substation projects, and its cost data is more easily obtained at the same time. Thus, take the cost level data of 220 kV new outdoor substation projects at certain place in 2014–2016 (as shown in Table 1) as an example to validate the model. The cost level of substation projects is represented by the cost per kVA as the research data sample. Starting from the data of the first sample project, taking approximately equal time as the interval between the selected samples, we get the cost data of 72 samples, and sort them according to the completion time of the projects.
First of all, decompose the cost level data by EEMD into five IMF components, and the decomposition results are shown in Figure 2.
From the decomposition results, each IMF component obtained after the EEMD algorithm shows obvious regularity and periodicity, the algorithm helps to improve the prediction accuracy of subsequent SVM model. Then, the first 54 sets of cost data are taken as training group, the decomposed IMF components and the surplus components are input into the GCS-SVM prediction model, respectively, for training. The total cost of each component is reduced to the predictive value after the prediction results of each component are obtained. The latter 18 sets of cost data are used as test group to verify the prediction effect of the model.

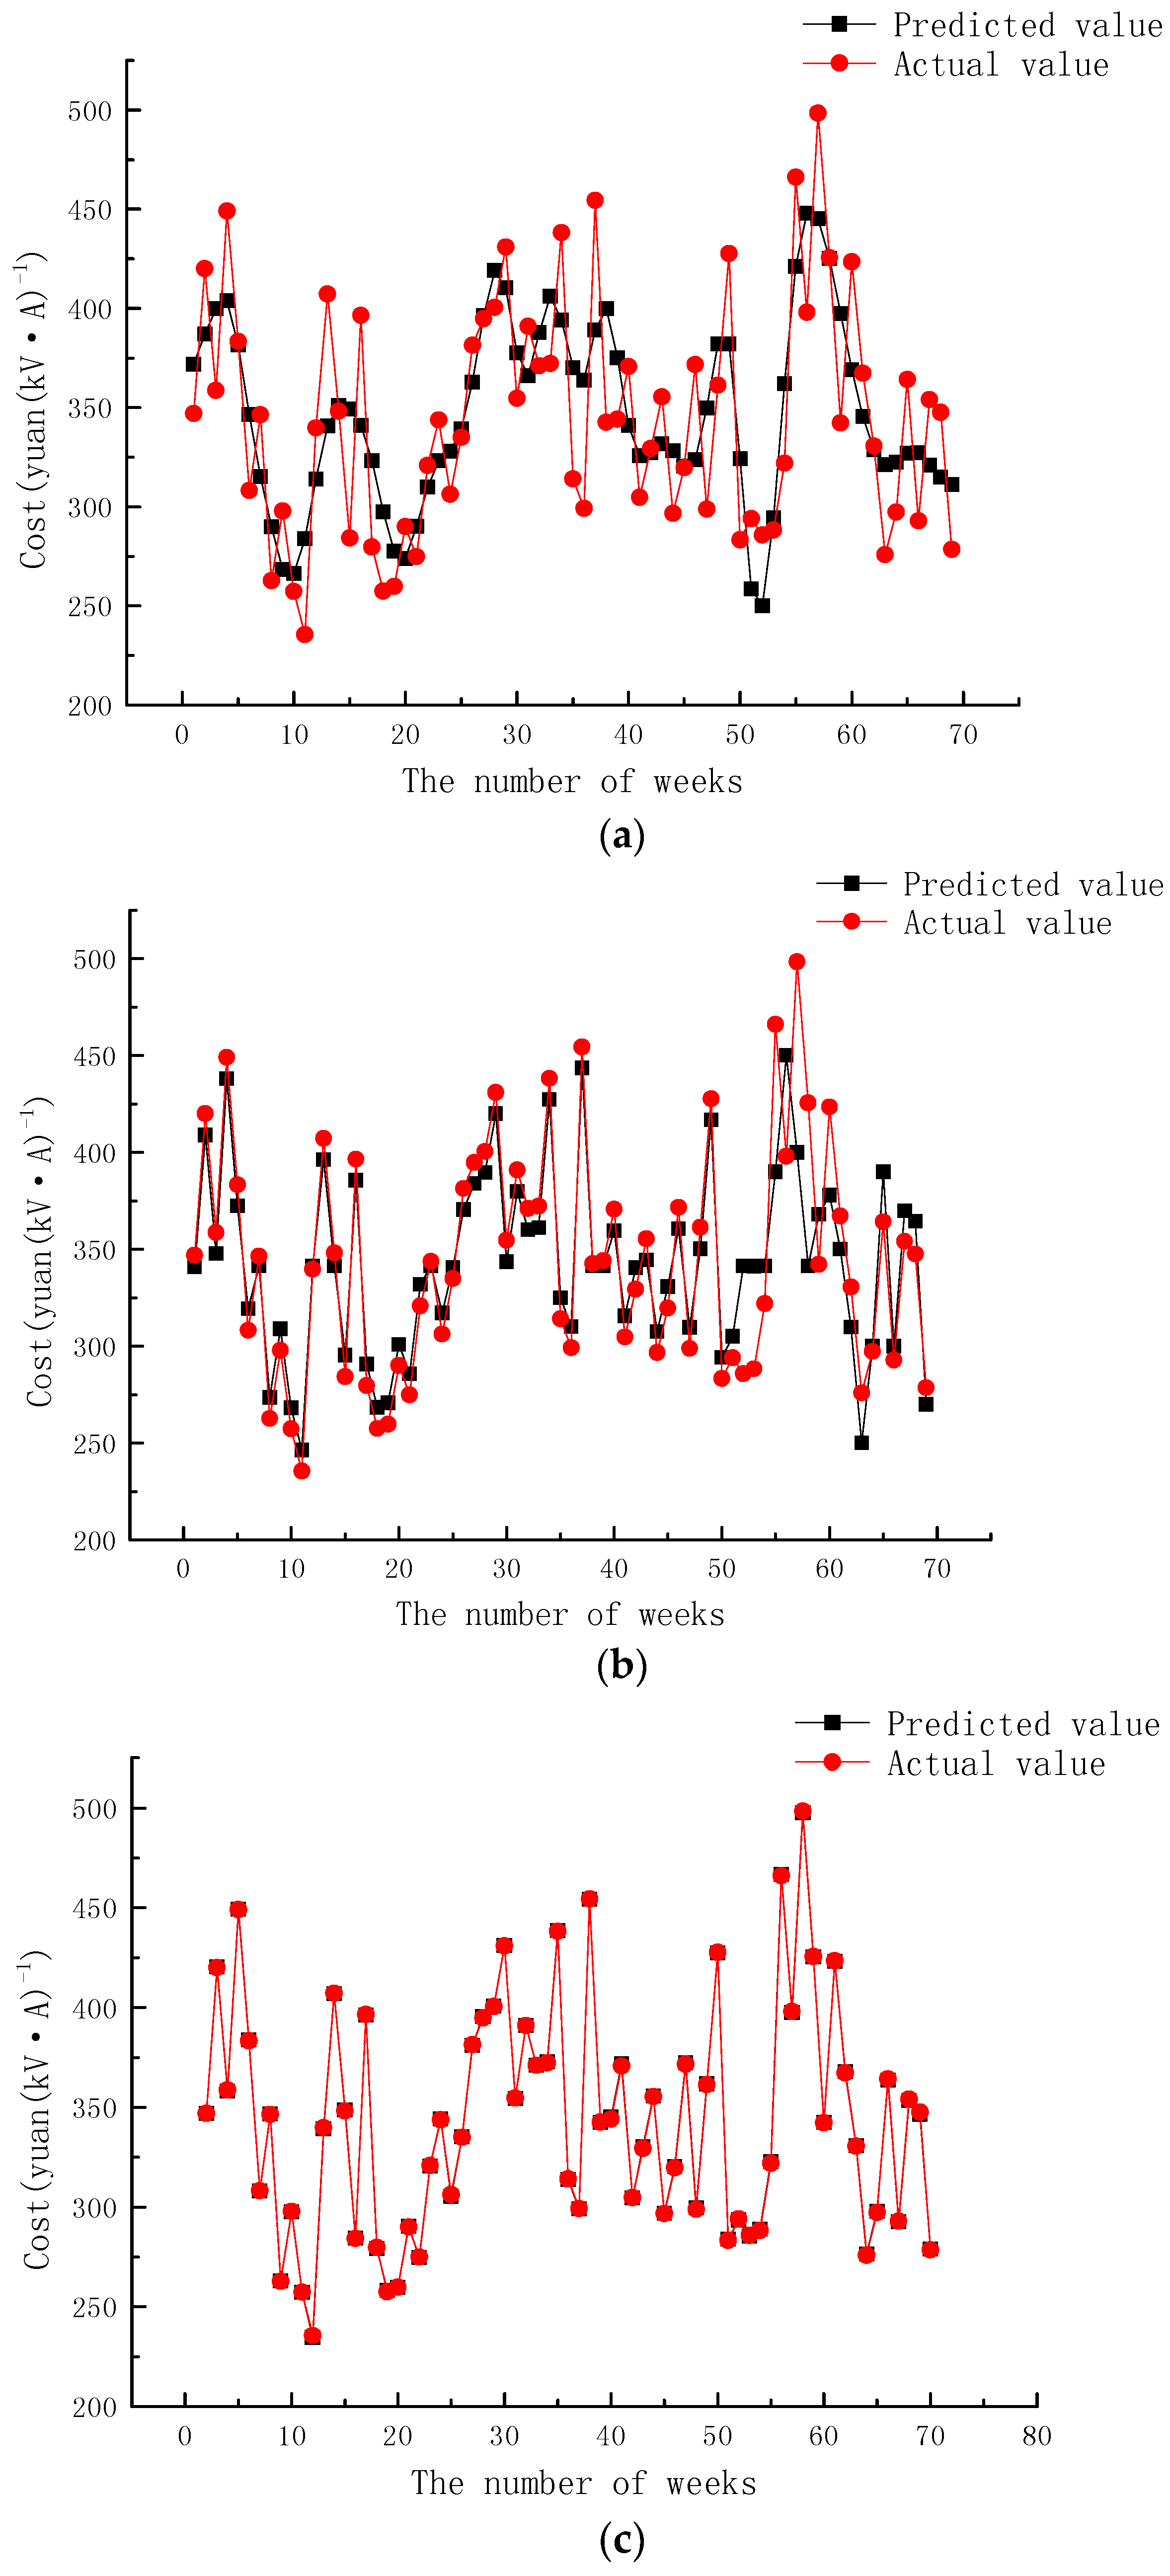
4.2. Results Analysis and Comparison

After training the forecasting model, the best value of c and ε are 29.8425 and 0.4871, respectively. In order to verify the accuracy of the model, the GCS-SVM model without EEMD algorithm, the EEMD-CS-SVM model with the non-optimized CS algorithm, and the EEMD-GCS-SVM model are used to predict the samples in this paper. The results are shown in Figure 3a–c.
It can be seen from Figure 3a–c that the prediction result by EEMD-GCS-SVM model, which has been decomposed by EEMD and optimized by GCS algorithm, has the highest fitting and prediction accuracy. The results indicate that the EEMD and GCS algorithm is helpful to improve the accuracy of the model.
In addition, BP neural network model, SVM model, GCS-SVM model, EEMD-CS-SVM model, and EEMD-GCS-SVM model are, respectively, used to predict the data of the test set in this paper, and the error comparison results are shown in Table 2 and Figure 4.
According to the above table, the RMSE of the EEMD-GCS-SVM model is 0.51, MAE is 0.43, and MAPE is 0.13%, which indicates that the prediction accuracy is higher than EEMD-CS-SMV and GCS-SVM, and is significantly better than the BP neural network model and the SVM model.
The boxplot can directly reflect the accuracy of each model. It can be seen from the boxplot that the prediction error of EEMD-GCS-SVM is smaller. It means that this model is more accurate than other models, and is more suitable for the prediction of the cost level of 220 kV substation project.

5. Conclusions

With the development of power system reform, it is urgent to improve the cost management level of power grid project. Thus, it is of great significance to control the cost level of grid projects effectively for improving the investment efficiency and sustainability. However, the prediction of substation project cost level is difficult, and the prediction accuracy of the traditional method is insufficient.
(1)
The EEMD-GCS-SVM model established in this paper can effectively improve the prediction accuracy of substation project cost with a MAPE value of only 0.13%, which is much better than that of the un-optimized and EEMD models.
(2)
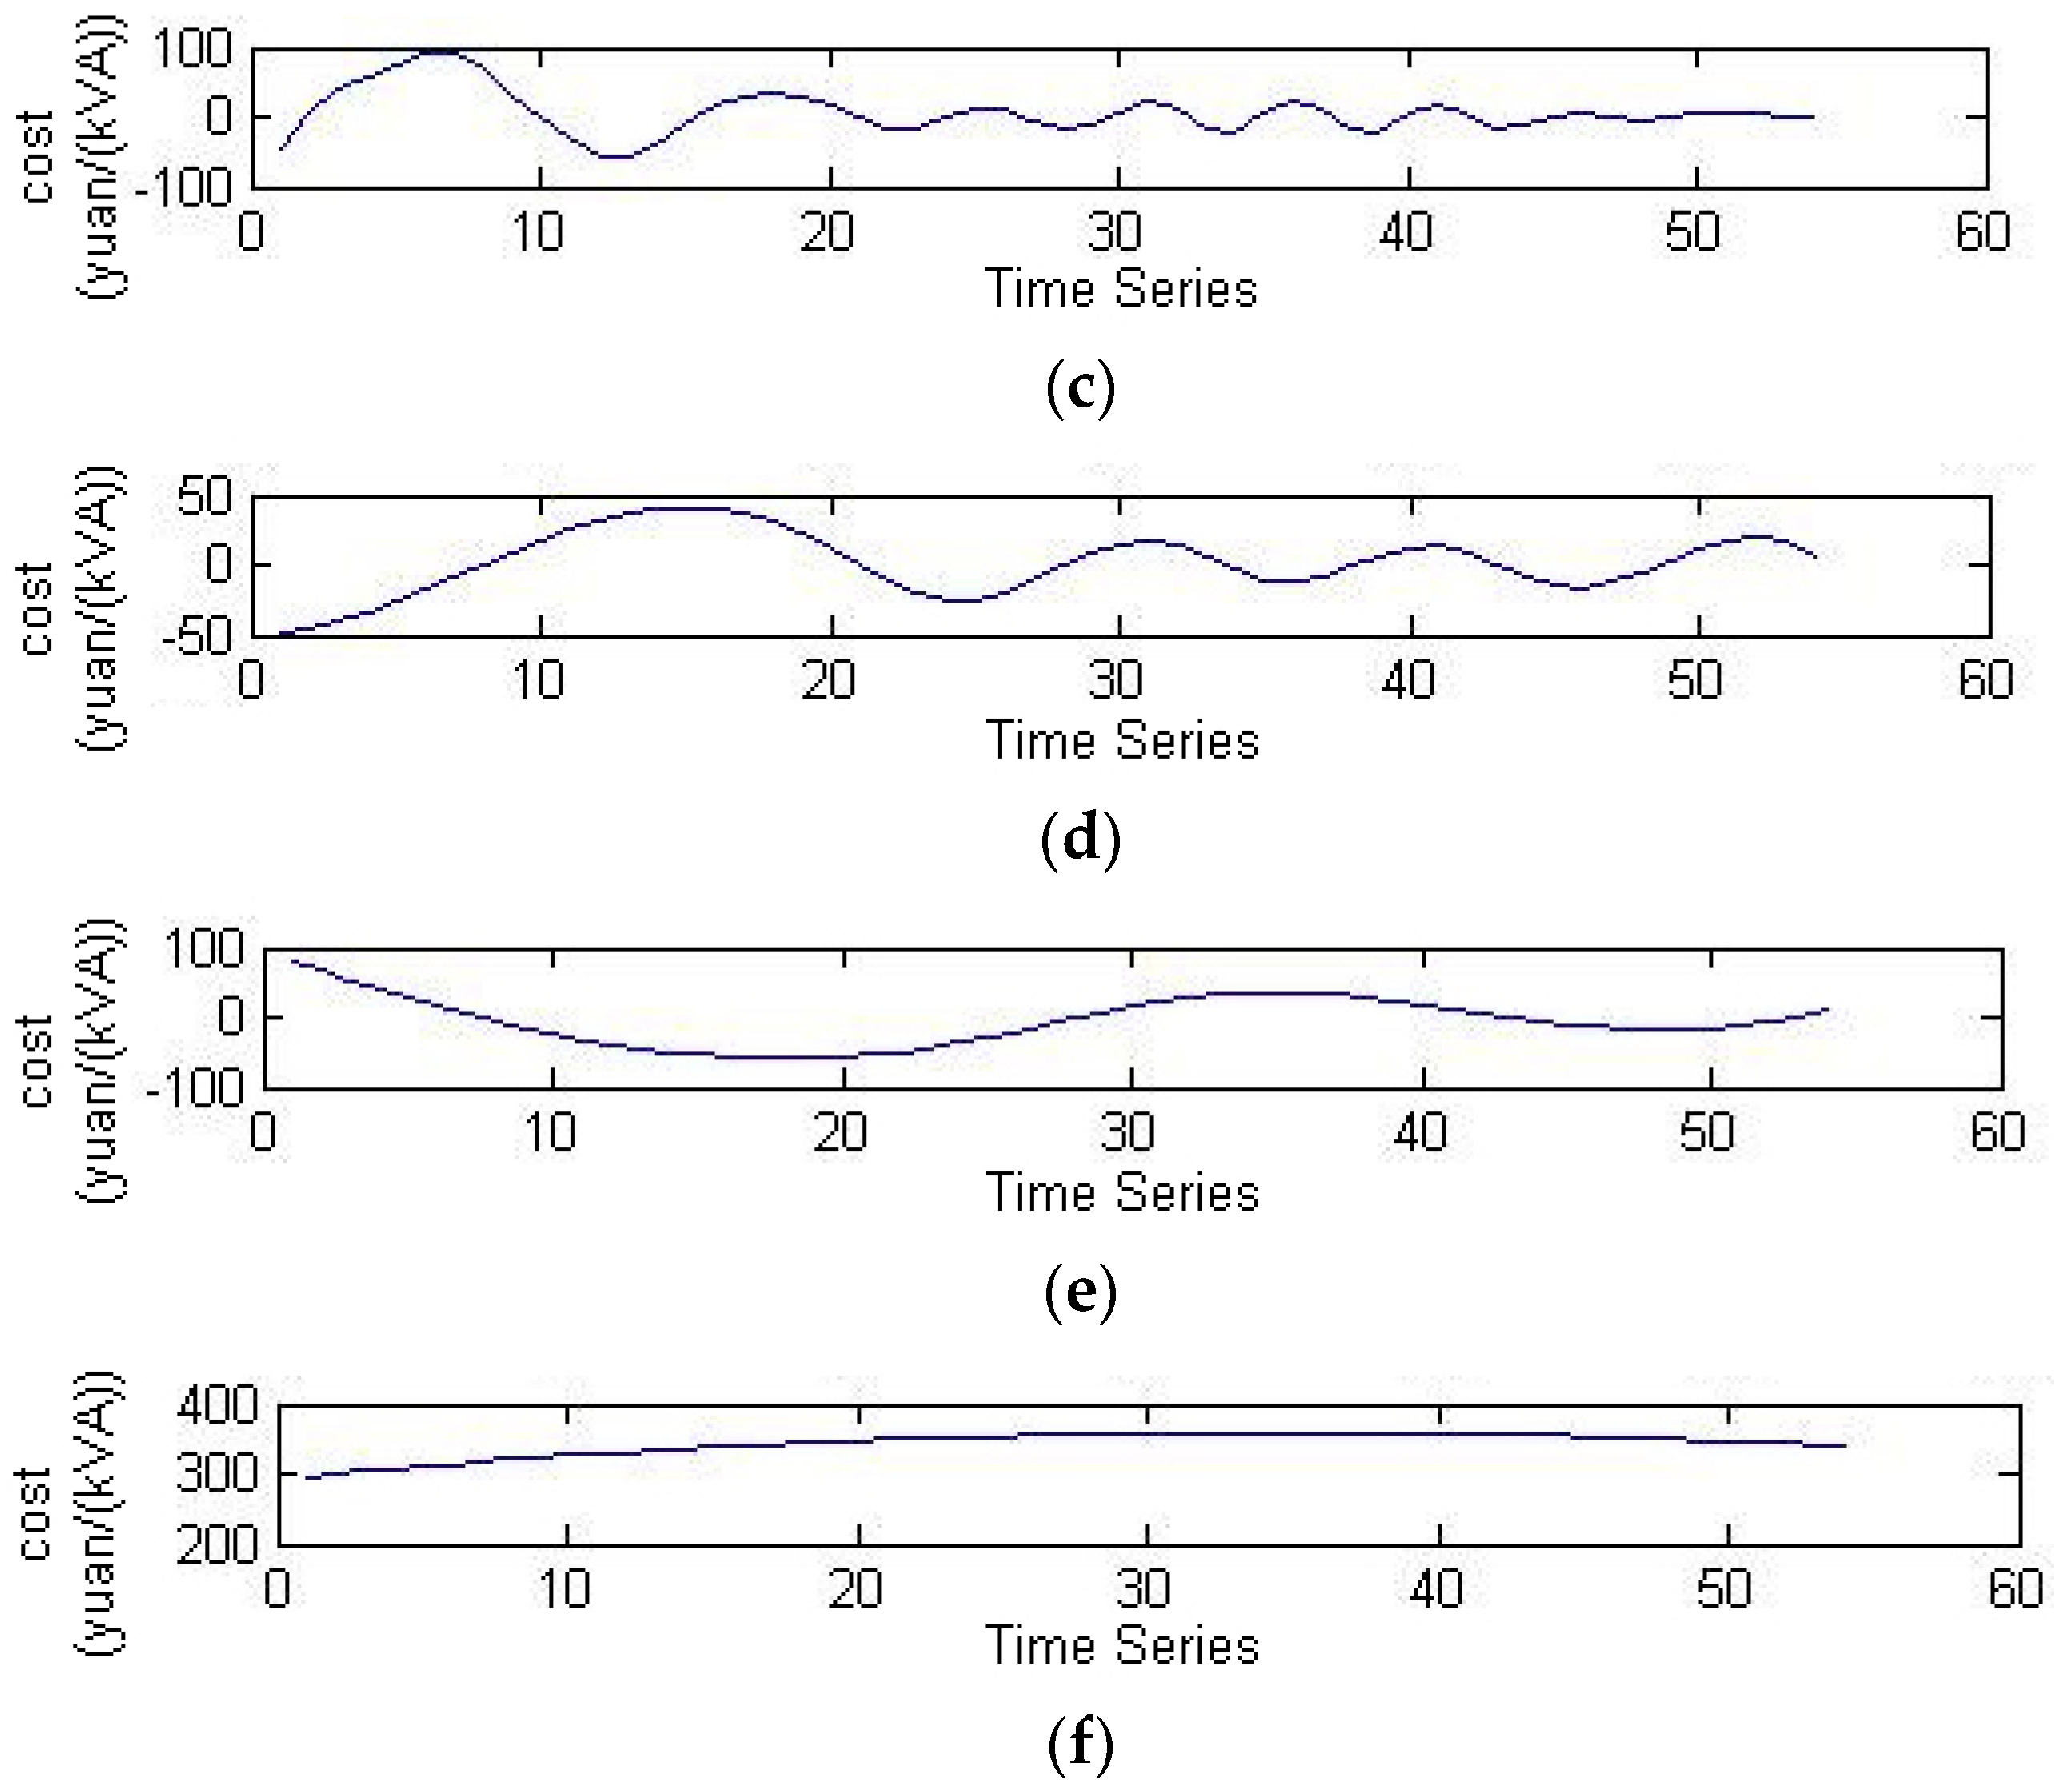
EEMD method can decompose irregular and non-stationary sequence signals into multiple IMF components and surplus components. The decomposed signals show regularity and periodicity obviously, which improves the prediction accuracy of the model.
(3)
On the basis of CS optimized SVM parameters and kernel function, adding Gauss perturbation can effectively improve the search vitality and range of CS algorithm. The optimal SVM parameters are obtained, the calculation of kernel function is faster, and the computational efficiency and prediction accuracy is improved in the model.
However, the research only analyzed the cost prediction of the 220 kV substation due to the limited availability of data. Besides, there is no verification and analysis of more regions. Thus, more types of data should be widely used to verify the ability of the modified model in the further study. In future research, we will continue to apply the model to more prediction fields and explore more scientific and accurate prediction methods.

Acknowledgments

This research was supported by the National Natural Science Fund (71471059).

Author Contributions

All authors designed the research, established the forecasting model, completed the data arrangement and calculation, created the tables and figures, and finished the writing of the paper. All authors read and approved the final manuscript.

Conflicts of Interest

The authors declare no conflict of interest.

References

  1. Rao, R.; Zhang, X.; Shi, Z.; Luo, K.; Tan, Z.; Feng, Y. A Systematical Framework of Schedule Risk Management for Power Grid Engineering Projects’ Sustainable Development. Sustainability 2014, 6, 6872–6901. [Google Scholar] [CrossRef]
  2. Zhao, H.; Li, N. Risk Evaluation of a UHV Power Transmission Construction Project Based on a Cloud Model and FCE Method for Sustainability. Sustainability 2015, 7, 2885–2914. [Google Scholar] [CrossRef]
  3. Tao, Y.; Cui, S.; Ke, X. Forecasting Tendency of the Transmission Line Project Cost Index Using Markov Chain. Open Electr. Electron. Eng. J. 2014, 8, 56–63. [Google Scholar] [CrossRef]
  4. Zhu, J.; Yao, X.; Zhao, Z. Empirical Research on Cost Prediction Model of Technical Renovation for Electric Power Substation Project. Eng. Econ. 2017, 3, 5–9. [Google Scholar]
  5. Pei, Q.F.; Zhang, H.M.; Yang, Y.K. Study on the Management of Construction Cost in Substation Project. Adv. Mater. Res. 2014, 1030–1032, 2639–2642. [Google Scholar] [CrossRef]
  6. Jaleel, J.A.; Sadina, M.F. Reliability Evaluation of 220 kV Substation Using Fault Tree Method and Its Prediction Using Neural Networks. Environ. Manag. 2013, 54, 951–970. [Google Scholar]
  7. Ling, Y.; Yan, P.; Han, C.; Yang, C. Prediction model of transmission line engineering cost based on BP neural network. China Power 2012, 45, 95–99. [Google Scholar]
  8. Liu, W.; Shi, H.; Lu, Y.; Hua, F.; Qiu, J. Study on Grid Engineering Cost Index Forecasting Based on ARIMA-ES Hybrid Model. Manag. Rev. 2016, 28, 45–53. [Google Scholar]
  9. Niu, D.X.; Hua, F.Y. Research on Prediction of Transmission and Transformation Project Cost Index Based on ARIMA and Exponential Smoothing Models. In Proceedings of the 22nd International Conference on Industrial Engineering and Engineering Management 2015; Atlantis Press: Paris, France, 2016; pp. 771–779. [Google Scholar]
  10. Zhou, M.; Zhao, S.; Zhu, J. Index Evaluation System of Power Transmission Project Cost Based on Support Vector Machine Method. Electr. Power Constr. 2014, 35, 102–106. [Google Scholar]
  11. Huang, J. Substation project cost management and control measures. Sci. Res. 2016, 15, 00102–00103. [Google Scholar]
  12. Wang, N.N.; Wang, F.; Yin, Y.T.; Li, H.; Hou, Y. Research on Cost Predicting of Power Transformation Projects Based on SVM. Const. Econ. 2016, 37, 48–52. [Google Scholar]
  13. Song, Z.; Niu, D.; Xiao, X.; Zhu, L. Substation Engineering Cost Forecasting Method Based on Modified Firefly Algorithm and Support Vector Machine. Electr. Power 2017, 50, 168–173. [Google Scholar]
  14. Xu, J.W.; Moon, S. Stochastic Forecast of Construction Cost Index Using a Cointegrated Vector Autoregression Model. J. Manag. Eng. 2013, 29, 10–18. [Google Scholar] [CrossRef]
  15. Zhu, X.W.; Li, W.J. Prediction Model of Urban Real Estate Project Cost. Stats. Decis. 2010, 14, 47–49. [Google Scholar]
  16. Shahandashti, S.M.; Ashuri, B. Highway Construction Cost Forecasting Using Vector Error Correction Models. J. Manag. Eng. 2016, 32. [Google Scholar] [CrossRef]
  17. Qin, Z.F.; Lei, X.L.; Zhai, D.; Jin, L.Z. Forecasting the Costs of Residential Construction Based on Support Vector Machine and Least Squares-Support Vector Machine. J. Zhejiang Univ. Sci. A 2016, 43, 357–363. [Google Scholar]
  18. Zhou, J.Y.; Zhang, K.W. Cigarette Sales Forecasting Based on Hybrid Kernels Least Square Support Vector Machine Optimized by Modified Cuckoo Search Algorithm. Comput. Eng. Appl. 2015, 51, 250–254. [Google Scholar]
  19. Shao, Z.; Gao, F.; Yang, S.L.; Yu, B. A new semiparametric and EEMD based framework for mid-term electricity demand forecasting in China: Hidden characteristic extraction and probability density prediction. Renew. Sustain. Energy Rev. 2015, 52, 876–889. [Google Scholar] [CrossRef]
  20. Huang, Y.; Wu, D.; Zhang, Z.; Chen, H.; Chen, S. EMD-based pulsed TIG welding process porosity defect detection and defect diagnosis using GA-SVM. J. Mater. Process. Technol. 2017, 239, 92–102. [Google Scholar] [CrossRef]
  21. He, K.; Wang, H.; Du, J.; Zou, Y. Forecasting Electricity Market Risk Using Empirical Mode Decomposition (EMD)—Based Multiscale Methodology. Energies 2016, 9, 931. [Google Scholar] [CrossRef]
  22. Amjady, N.; Abedinia, O. Short Term Wind Power Prediction Based on Improved Kriging Interpolation, Empirical Mode Decomposition, and Closed-Loop Forecasting Engine. Sustainability 2017, 9, 2104. [Google Scholar] [CrossRef]
  23. Malik, H.; Sharma, R. EMD and ANN based intelligent fault diagnosis model for transmission line. J. Intell. Fuzzy Syst. 2017, 32, 3043–3050. [Google Scholar] [CrossRef]
  24. Acharya, U.R.; Fujita, H.; Sudarshan, V.K.; Oh, S.L.; Muhammad, A.; Koh, J.E.W.; Tan, J.H.; Chua, C.K.; Chua, K.P.; Tan, R.S. Application of empirical mode decomposition (EMD) for automated identification of congestive heart failure using heart rate signals. Neural Comput. Appl. 2016, 28, 3073–3094. [Google Scholar] [CrossRef]
  25. Helske, J.; Luukko, P. Ensemble Empirical Mode Decomposition (EEMD) and Its Complete Variant (CEEMDAN). Int. J. Public Health 2016, 60, 1–9. [Google Scholar]
  26. Lee, D.H.; Ahn, J.H.; Koh, B.H. Fault Detection of Bearing Systems through EEMD and Optimization Algorithm. Sensors 2017, 17, 2477. [Google Scholar] [CrossRef] [PubMed]
  27. Montalvo, C.; Gavilán-Moreno, C.J.; García-Berrocal, A. Cofrentes nuclear power plant instability analysis using ensemble empirical mode decomposition (EEMD). Ann. Nucl. Energy 2017, 101, 390–396. [Google Scholar] [CrossRef]
  28. Li, W.; Yang, X.; Li, H.; Su, L. Hybrid Forecasting Approach Based on GRNN Neural Network and SVR Machine for Electricity Demand Forecasting. Energies 2017, 10, 44. [Google Scholar] [CrossRef]
  29. Cortes, C.; Vapnik, V. Support-vector networks. Mach. Learn. 1995, 20, 273–297. [Google Scholar] [CrossRef]
  30. Arabloo, M.; Ziaee, H.; Lee, M.; Bahadori, A. Prediction of the properties of brines using least squares support vector machine (LS-SVM) computational strategy. J. Taiwan Inst. Chem. Eng. 2015, 50, 123–130. [Google Scholar] [CrossRef]
  31. Fan, J.; Wu, J.; Kong, W.; Zhang, M.H. Predicting Bio-indicators of Aquatic Ecosystems Using the Support Vector Machine Model in the Taizi River, China. Sustainability 2017, 9, 892. [Google Scholar] [CrossRef]
  32. Liang, Y.; Niu, D.; Ye, M.; Hong, W.-C. Short-Term Load Forecasting Based on Wavelet Transform and Least Squares Support Vector Machine Optimized by Improved Cuckoo Search. Energies 2016, 9, 827. [Google Scholar] [CrossRef]
  33. Liu, J.-P.; Li, C.-L. The Short-Term Power Load Forecasting Based on Sperm Whale Algorithm and Wavelet Least Square Support Vector Machine with DWT-IR for Feature Selection. Sustainability 2017, 9, 1188. [Google Scholar] [CrossRef]
  34. Kachoosangi, F.T. How Reliable Are ANN, ANFIS, and SVM Techniques for Predicting Longitudinal Dispersion Coefficient in Natural Rivers? J. Hydraul. Eng. 2016, 142. [Google Scholar] [CrossRef]
  35. Giorgi, M.G.D.; Ficarella, A.; Lay-Ekuakille, A. Cavitation Regime Detection by LS-SVM and ANN with Wavelet Decomposition Based on Pressure Sensor Signals. IEEE Sens. 2015, 15, 5701–5708. [Google Scholar] [CrossRef]
  36. Tian, J.; Li, C.; Liu, J.; Yu, F.L.; Cheng, S.H.; Zhao, N.; Jaafar, W.Z.W. Groundwater Depth Prediction Using Data-Driven Models with the Assistance of Gamma Test. Sustainability 2016, 8, 1076. [Google Scholar] [CrossRef]
  37. Sun, W.; Sun, J. Daily PM2.5 concentration prediction based on principal component analysis and LSSVM optimized by cuckoo search algorithm. J. Environ. Manag. 2017, 188, 144–152. [Google Scholar] [CrossRef] [PubMed]
  38. Xiao, L.; Shao, W.; Yu, M.; Ma, J.; Jin, C. Research and application of a hybrid wavelet neural network model with the improved cuckoo search algorithm for electrical power system forecasting. Appl. Energy 2017, 198, 203–222. [Google Scholar] [CrossRef]
  39. Mellal, M.A.; Williams, E.J. Cuckoo optimization algorithm with penalty function for combined heat and power economic dispatch problem. Energy 2015, 93, 1711–1718. [Google Scholar] [CrossRef]
  40. Kaboli, S.H.A.; Selvaraj, J.; Rahim, N.A. Long-term electric energy consumption forecasting via artificial cooperative search algorithm. Energy 2016, 115, 857–871. [Google Scholar] [CrossRef]
  41. Makhloufi, S.; Mekhaldi, A.; Teguar, M. Three powerful nature-inspired algorithms to optimize power flow in Algeria’s Adrar power system. Energy 2016, 116, 1117–1130. [Google Scholar] [CrossRef]
  42. Wang, Z.; Wang, C.; Wu, J. Wind Energy Potential Assessment and Forecasting Research Based on the Data Pre-Processing Technique and Swarm Intelligent Optimization Algorithms. Sustainability 2016, 8, 1191. [Google Scholar] [CrossRef]
  43. Cai, X.; Nan, X.; Gao, B. Application of SVM Optimized ICS in Fault Diagnosis of Analog Circuit. Bull. Sci. Technol. 2017, 33, 79–82. [Google Scholar]
  44. Zheng, H.; Zhou, Y. A novel Cuckoo Search optimization algorithm base on gauss distribution. J. Comput. Inf. Syst. 2012, 8, 4193–4200. [Google Scholar]
  45. Lai, J.; Liang, S.; Center, C. Application of GCS-SVM model in network traffic prediction. Comput. Eng. Appl. 2013, 49, 75–78. [Google Scholar]
Figure 1. Flow chart of the Ensemble Empirical Mode Decomposition (EEMD)-GCS- Support Vector Machines (SVM) prediction model.
Sustainability 10 00118 g001
Figure 2. The result of the EEMD. (a) Original data; (b) IMF1; (c) IMF2; (d) IMF3; (e) IMF4; and (f) IMF5.
Sustainability 10 00118 g002aSustainability 10 00118 g002b
Figure 3. Prediction results. (a) The prediction result by EEMD-CS-SVM; (b) The prediction result by GCS-SVM; and (c) The prediction result by EEMD-GCS-SVM.
Sustainability 10 00118 g003
Figure 4. Comparison of the model errors.
Sustainability 10 00118 g004
Table 1. The cost level of 220 kV new outdoor substation project at a certain place.
Serial NumberCost (Yuan/kV·A)Serial NumberCost (Yuan/kV·A)Serial NumberCost (Yuan/kV·A)Serial NumberCost (Yuan/kV·A)
1284.2219396.6237438.2655285.86
2337.4420279.7838314.1556288.38
3369.3221257.5339299.1457321.98
4347.0322259.840454.5358466.19
5419.9923290.0741342.5459398.09
6358.642427542344.1260498.41
7449.0225320.9143370.6561425.52
8383.3526343.7744304.7362342.21
9308.327306.2345329.563423.47
10346.532833546355.3764367.21
11262.6429381.547296.7365330.49
12297.9730394.8548319.7466275.96
13257.3531400.649371.667297.36
14235.5132430.950298.8368364.17
15339.8333354.6351361.2969292.85
16407.2434390.9152427.7770354.06
17348.2535371.0853283.3871347.54
18284.3536372.254294.1572278.54
Table 2. Comparison of the model errors.
ModelBPSVMGCS-SVMEEMD-CS-SVMEEMD-GCS-SVM
RMSE (yuan/kV·A)78.4753.4524.7636.020.51
MAE (yuan/kV·A)57.8542.1016.7131.380.43
MAPE16.42%12.36%4.72%9.28%0.13%

