Article

Simulating the Impact of Carbon Taxes on Greenhouse Gas Emission and Nutrition in the UK

1
Land Economy Environment and Society, SRUC, West Mains Road, Edinburgh EH9 3JG, UK
2
Rowett Institute of Nutrition and Health, University of Aberdeen, Foresterhill, Aberdeen AB24 2ZD, UK
*
Author to whom correspondence should be addressed.
Sustainability 2018, 10(1), 134; https://doi.org/10.3390/su10010134
Submission received: 27 October 2017 / Revised: 30 December 2017 / Accepted: 30 December 2017 / Published: 8 January 2018
(This article belongs to the Special Issue Carbon Footprint: As an Environmental Sustainability Indicator)

Abstract

:
Greenhouse gas (GHG) emissions associated with food consumption have become particularly pertinent issues given recent warnings that the planet recently has experienced its hottest year. One way proposed to reduce those emissions is through a carbon consumption taxes. This study uses consumption, nutrient and GHG emission data to estimate the impact of two ad-valorem taxes: one applied by food category and another by the carbon emission of the products. The results suggest that the carbon consumption tax scenarios would reduce GHG emissions by a greater quantity relative to the ad-valorem tax scenario; however, the intake of important nutrients will also decrease in these scenarios. Therefore, creating an environmentally sustainable and nutritious diet through taxation is challenging and requires compromise between the nutrition and environmental sustainability.

1. Introduction

Reducing Greenhouse gas (GHG) emissions associated with food consumption is a particularly important issue considering recent World Meteorological Organization [1] findings of 2016 being possibly the hottest year since records began. The Intergovernmental Panel on Climate Change [2] details the relationship between GHG emissions and climate change. The emissions associated with British food consumption represent approximately 20 to 30 percent (including land use change) of the UK’s total consumption emissions [3].
However, the Western world also faces the current issues of households consuming food products which contribute to poor health largely because of high consumption of products such as meat and fat [4] and [5]. Consumption taxes related to the carbon emissions of the products (i.e., carbon taxes) are a potential instrument to partially mitigate carbon emissions by changing consumer demand. As duties to consumption goods are often discussed as a potential policy response to fight global warming it is important to assess their impact; moreover, normally note that normally their impact on nutritional quality is not considered.
The purpose of this paper is to model the effects of carbon taxes on UK households to assess the potential impact on: food choices, GHG emissions and the nutritional quality of the diets. With this the paper contributes to the literature on the impact of fiscal policies on food demand, which is limited and incomplete.
This will provide an alternative estimation to existing estimations for the UK [6] using unconditional elasticities instead of food conditional elasticities (i.e., elasticities that relate to the total household budget and not just the food expenditure) and also alternative data in terms of nutrients and GHG emissions.
The structure of the paper is as follows: it starts with a literature review and then it describes the data used in the analysis. It is followed by a presentation of the methodology, which is based on the idea that understanding the potential impact of fiscal policies on food diets implies knowing the structure of consumer preferences and the role of demand drivers (e.g., it is important to understand not only own-price responses but also cross-price responses and the related substitution effects). Next, results from the simulations are discussed and conclusions presented.

2. Literature Review

The use of carbon consumption tax is not the only instrument available for influencing the demand side of food consumption (i.e., purchases of food products). Other instruments are command and control with regards to banning high carbon footprint (i.e., GHG emissions) food products such as butter [7]. Other instrument of information provision whereby Mazzocchi et al. [8] surveyed respondents from five different EU countries (Belgium, Denmark Italy Poland and the UK) and found that support from the UK respondents for information campaigns was low relative to the other countries. Therefore, with regards to the UK it seems that information provision may not be the most effective instrument for influencing consumer behaviour.
The use of taxation for discouraging overconsumption of certain products is not a new concept given the use of consumption taxes and duties with regards to tobacco and alcohol consumption [9]. More recently countries such as Hungary and Denmark (have since repealed their fat tax) have applied taxes to food products based on fat content. However, no country has yet applied a carbon consumption tax. It also should be highlighted that carbon consumption taxes are unlikely to result in an optimum outcome in terms of carbon emission reductions. This is because sourcing a price on carbon emissions which reflects the true cost to society is difficult. According to Baumol [10] if such a tax does not produce optimal reallocation (due to the “complexities” of reality) then it can still be useful to have a tax which “controls” externalities. The author explains that taxes can still form an acceptable reduction in certain externalities without being a Pigouvian tax [10].
A carbon consumption tax being applied to all the major food produces has been modelled for Denmark [11], Spain [12] and the UK [5]. A recent paper by Caillavet et al. [11] studied the effect of applying a 20 percent tax to food products with the highest carbon footprint such as meat and cheese (while other food products with lower carbon footprints are exempt from the tax). The paper’s environmental scenario found that when all animal based food products are taxed, the net reduction in carbon emissions is 7.5 percent. They also studied the effects of tax on the nutrient intake of four different French socioeconomic groups and other demographic groups such as age. The environment scenario finds a decrease in nutrient intake for average households for the following nutrients which are of interest to this study: sugar (−3.24 percent) and energy (−8.09 percent). They also provided the different socioeconomic income groups and age groups while this paper is only interested in only the socioeconomic groups.
Edjabou and Smed [11] found that GHG emissions could be reduced by between 4 to 19.4 percent (two different carbon prices used and range also reflects the different purchasing data used) for Danish household in the uncompensated tax scenarios. García-Muros et al. [12] used three scenarios of a high tax rate, high tax rate with exemptions on certain products and a low tax rate and found a reduction in emissions for Spanish households of 7.6 percent (their highest carbon tax rate) and 3.8 percent (their lowest tax rate). The paper also studied the effects of the scenarios on nutrient consumption with all three scenarios showing a reduction in fats and sugars. For the UK, under an uncompensated tax scenario, Briggs et al. [6] found that GHG emissions could be reduced by 7.5 percent (based on the inclusion of land use change) for the UK population. Both Edjabou and Smed [11] and Briggs et al. [6] modelled the effects of the taxes on nutrient intake but did not account for the different socioeconomic groups.

3. Data Used in the Analysis

3.1. Food Expenditure and Nutritional Data

Due to availability, this study used the 2012 Kantar Worldpanel database for Scotland to compute the UK elasticities. Comparison with data from “Family Food Module of the Living Costs and Food Survey (LCF)” [13] indicated that Scottish data was a good approximation of UK purchases. An advantage of the dataset in comparison with the dataset used by Briggs et al. [6] is that households’ purchases are collected during the entire year, instead of for two weeks as in the Living Costs and Food survey. The number of households in the sample was 1518.
The categories of food products were aggregated into 20 food groups consumed in the home. Table A1 in the annex presents the 20 food groups and their composition using the categories of the Living Costs and Food Survey.
Data on UK nutrient consumption were obtained from the European Food Safety Authority (EFSA) which were in turn supplied by the National Diet and Nutrition Survey (NDNS) years 1 to 3 (2008–2011) [14]. These NDNS data contain 3073 individuals and their mean intake of nutrients associated with the food groups [15].

3.2. Carbon Emissions Data

The carbon content of the food products is measured in terms of kilogram of carbon dioxide equivalent (Kg CO2e) through the use of Life Cycle Assessments (i.e., carbon footprints) and this information was provided by the SUSDIET project [16].
The price of releasing carbon emissions into the atmosphere was obtained from three sources in order to create the three carbon consumption tax rates. The first carbon price was estimated using the European Commission’s mean social cost of carbon which equates to 0.0427 £/kg (price 1). The second price used the recent European Emissions Trading Scheme (ETS) value of 0.0128 £/kg (price 2). The final value is based on the long-term EU projection of carbon price of 0.1709 £/kg (price 3).

4. Methodology

Overall the methodology consisted of using an estimated matrix of price and expenditure elasticities to simulate how the carbon consumption tax changed GHG emissions and nutrients consumed as a result of the induced changed in demand for the food groups. This section details the estimation of demand systems, the application of the carbon consumption taxes and the simulated scenarios.

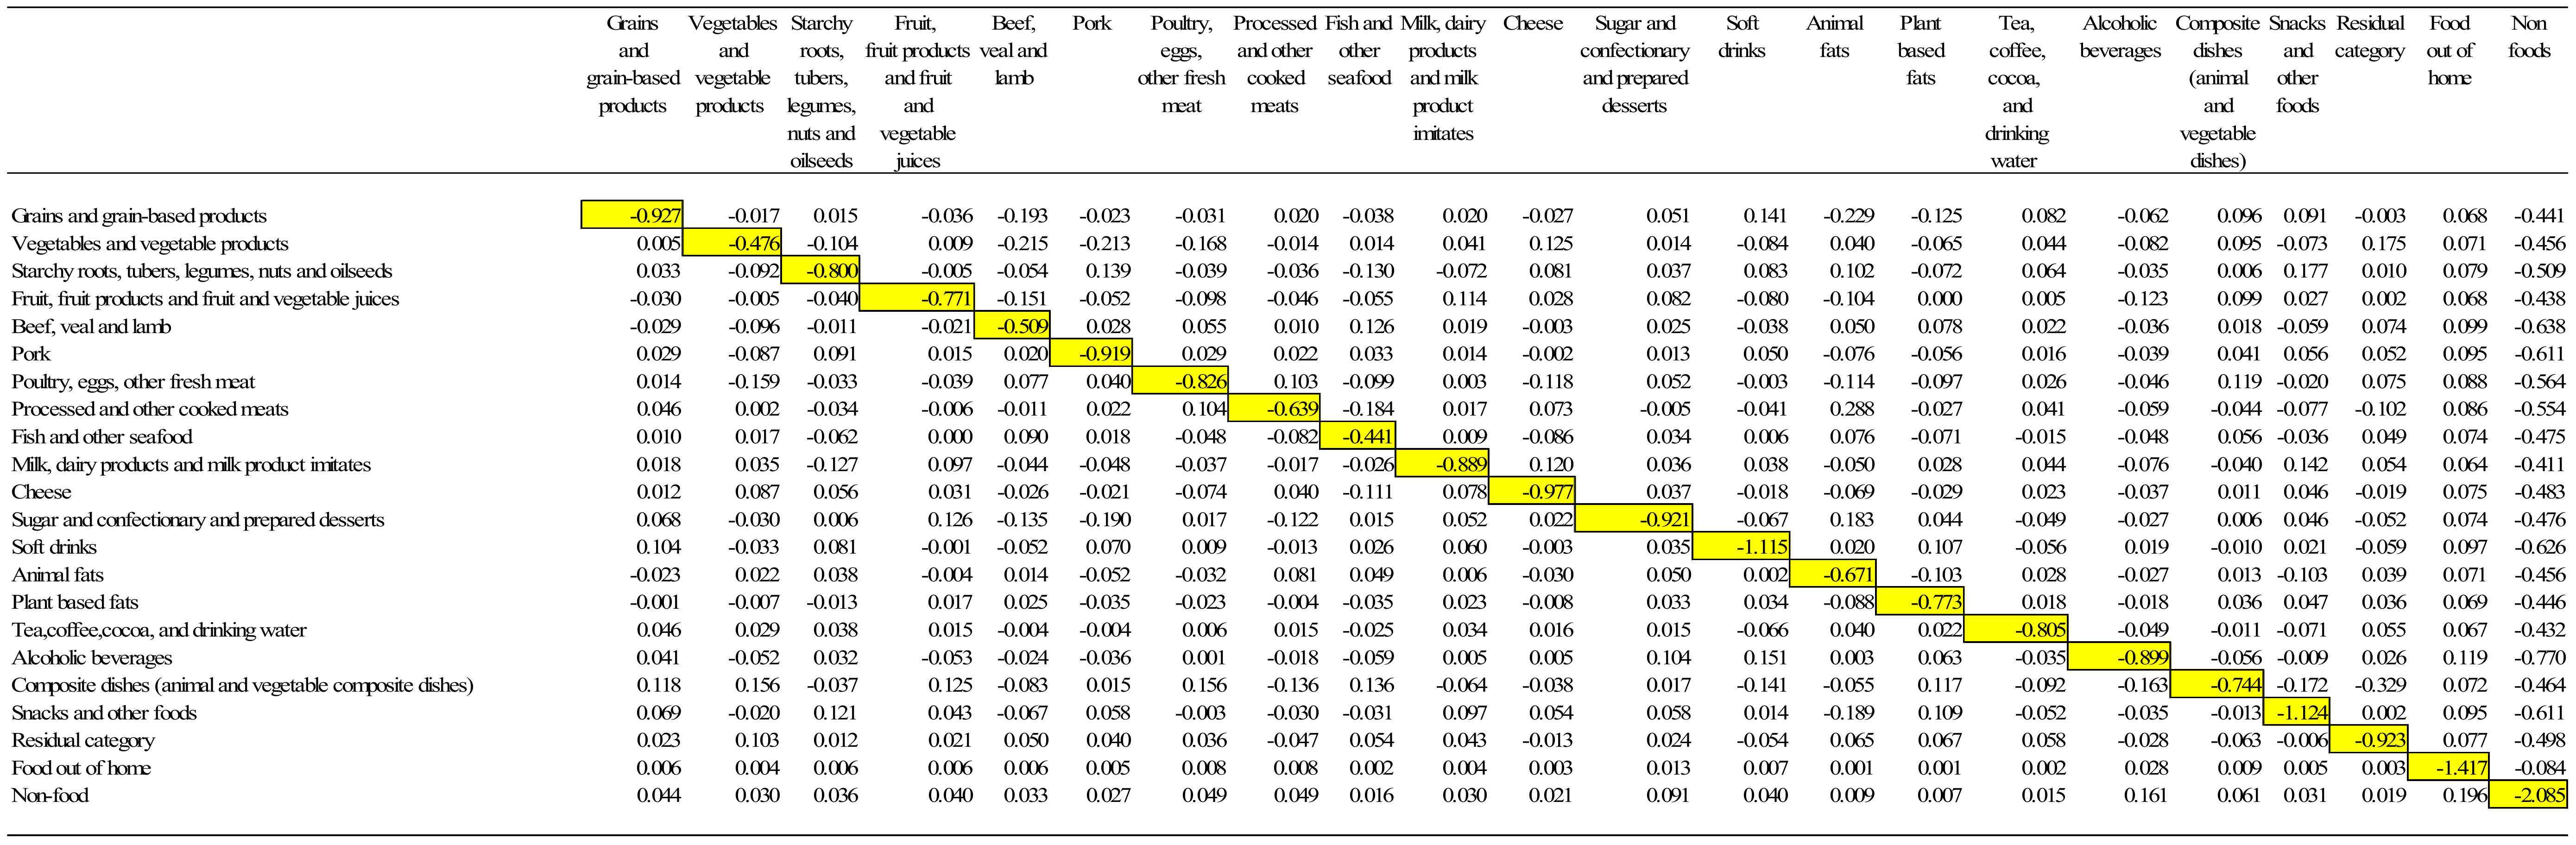
4.1. Estimation of the Demand Elasticities

The elasticities used were estimated using the Exact Affine Stone Index (EASI) implicit Marshallian demand system developed by Lewbel and Pendakur [17]. This system addressed two limitations observed of the Almost Ideal Demand System (AIDS) model [18], which is the most popular demand model in the economic literature. The two limitations of the AIDS model are: first, it only allows income to influence demand in a linear or log-linear form, despite the possibility that Engel’s curves may be non-linear and vary in shapes across goods and second, the AIDS model does not allow for preferences heterogeneity, which has been recognised as a fundamental feature of consumer microdata.
The approach by Lewbel and Pendakur addresses the issues the two above issues while maintaining the simplicity of the AIDS model. Their model considers a consumer with demographic (and other observable preference related) characteristics z and log nominal total expenditures x who faces a J-vector of log prices p. It assumes that she chooses a bundle of goods, described by the J-vector of budget shares w, to maximize utility given her linear budget constraint.
Hicksian demand functions associated with the consumer utility function, which express ω (i.e., Hicksian cost shares) as a function of p, z and an attained utility level u, can easily be specified to have many desirable theoretical properties. Lewbel and Pendakur show that, under some conditions that permit both random utility parameters and arbitrarily complicated Engel curves, utility u can be expressed as a simple function of the observed variables x, w (observed budget or Marshallian shares), p and z. This function, which it is denoted y, can often be interpreted as a measure of log real expenditures. They use these results to directly specify and estimate what we call implicit Marshallian demands, which are Hicksian demands after replacing u with the implicit utility measure y.
However, estimation of the model is complicated by endogeneity and non-linearity issues, which means that iterative Generalised Method of Moments (GMM) or three-stage least squares procedures are called for. However, it is possible to estimate a simplified—or approximate—version of the EASI model. Support for this simplification comes from Lewbel and Pendakur [17], who provide evidence that both linearity and endogeneity are only relatively small issues in practice. In particular, those authors find that the linearized version of the model estimated by OLS performs almost as well as fully-efficient endogeneity-corrected nonlinear estimation [19].
Derivation of the EASI demand system starts from a dual representation of preferences in the form of a minimum cost function in log form ( ln C ( ) ):
lnC ( p , u , z , ε )   =   u   +   j = 1 J m j ( u , z ) lnp j   +   0 . 5 j = 1 J k = 1 J α jk lnp j lnp k   +   j = 1 J ε j lnp j
where p is a J vector of good prices, u is the utility, z is a vector of socioeconomic characteristics (e.g., education), ε is J vector of unobserved heterogeneity parameters, m j ( ) denotes an unrestricted function that depends on the utility and the observed socioeconomic characteristics.
By differentiated with respect to the log of prices (Shephard’s lemma), J Hicksian cost share functions ( ω j ) are obtained:
ln C ( p , u , z , ε ) ln p j = ω j ( p , u , z , ε ) = m j ( u , z ) + k = 1 J α j k ln p k + ε j
The implicit utility or real income y is equal to (This result comes from expressing the utility from the Hicksian cost shares equations. See Lewbel and Pendakur [17] page 830):
y   =   u   =   ln ( x ) j = 1 J ω j lnp j   +   0 . 5 j = 1 J k = 1 J α jk lnp j lnp k
The implicit Marshallian budget shares ( w j ) then follow by substituting y, as expressed in Equation (3), for u in the Hicksian budget shares (2).
w j ( p , u , z , ε )   =   m j ( y , z )   +   k = 1 J α jk lnp k   +   ε j
The model is further simplified by assuming that the functions m j ( y , z ) are additively separable in y and z, linear in z and polynomial of degree r in y such as in (5):
m j ( y , z )   =   r = 1 R β jr ( y ) r   +   t = 0 T γ jt z t
Replacing (5) into (4) the Marshallian budget share equations become:
w j ( p , u , z , ε )   =   r = 1 R β jr ( y ) r   +   t = 0 T γ jt z t   +   k = 1 J α jk lnp k   +   ε j
Note that a constant is introduced as the first z variable, so that there are only T real socio-demographic characteristics in the model. More importantly, real income y is itself a function of the parameters α j k and the Hicksian cost shares ω through Equation (3). This implies that model (6) is non-linear in parameters. This first issue is addressed by approximating implicit utility (3) by the value of expenditure deflated by a Stone price index (in logs):
y   =   ln ( x ) j = 1 J w j lnp j
However, the above simplification does not address the endogeneity issue, since the right hand-side of Equation (7) remains a function of vector w (i.e., the expenditure shares). To circumvent that problem, the observation-specific shares (note that Equation (7) is for each household) are replaced with sample averages, denoted with a bar:
y ^   =   ln ( x ) j = 1 J w ¯ j lnp j
The system of Equations (6), using (8) to approximate y, defines the unrestricted demand system, to which it is needed to impose the properties derived from microeconomic theory. As in the case of the AIDS model, one advantages of the EASI specification is that those theoretical constraints are linear in parameters.
  • Homogeneity restriction implies J constraints: j = 1 J α j k = 0 , j = 1 , , J . Thus, in each share equation, the price coefficients sum to zero.
  • Symmetry restriction implies α j k = α k j Hence, with J share equations (i.e., goods), there are J(J − 1)/2 such restrictions (i.e., the number of non-diagonal elements of a J × J matrix divided by 2).
  • Adding-up restrictions imply that the sum of the J coefficients associated with the constant of each share equation (denoted z 0 ) is equal to unity; and the sum of the J coefficients associated with any other variable (i.e., price, socio-demographic, or expenditure) is equal to zero:
    k = 1 J α j k = 0 , j = 1 , , J ; k = 1 J β j r = 0 , r = 1 , , R ; j = 1 J γ j t = 0 , t = 1 , , T .
The expenditure elasticities are given by (9):
ln q i ln x = ( r = 1 R β i r r ( y ^ ) r 1 ) 1 w i + 1
The Marshallian price elasticities are given by (10):
ln q i ln p j = α i j w i + w ¯ j δ i j w j [ ( r = 1 R β i r r ( y ^ ) r 1 ) 1 w i + 1 ]
The elasticities were estimated at the means of the variables.
In contrast with Briggs et al. [6], who uses elasticities conditional to the food expenditure, the elasticities in this study were transformed into unconditional elasticities by considering a first stage that comprised the expenditure groups: food and drink, food and out of home and non-food. Once the elasticities for these groups were computed the unconditional elasticities were computed using the formulas from [20]. The socioeconomic variables used in the estimation were: age of the head of the household, gender of the head of household and dummy variables for the quintiles of the Scottish Index of Multiple Deprivation [21]. Table A2 and Table A3, in the Appendix A, present the unconditional Marshallian and expenditure elasticities.

4.2. Ad Valorem and Carbon Consumption Taxes

Two sets of taxes were considered for the analysis: (i) ad-valorem taxes set according to the degree of GHG emission of the group and (ii) carbon consumption tax rates estimated from the various carbon prices. Note that in their application both types of taxes are ad-valorem taxes. Four scenarios based on different group of products.
(1) Beef and veal, other meats, not preserved; (2) all meat; (3) all animal-based products; and (4) all products (tax rate proportional to emissions per Kg of product, with varying rates). The taxes used are presented in Table 1.
The ad-valorem tax was set at 20 percent or differentiated by carbon emission (ranging from 5 to 30 percent) as shown in Table 1 using the aforementioned three carbon prices. These rates were chose based on those used on the literature ([9] and [22]). The three different carbon tax rates were applied in the following way where t i is the tax rate of each food group i and which is equal to the carbon footprint of the food group E i multiplied by the price of emissions p e (see Table 1), i.e.,
t i =   E i ×   p e
The tax rates were applied to the baseline prices and through the price elasticities and the effect on nutrition and greenhouse gases was computed. In addition to the application of the tax, where the Government collected the taxes (uncompensated case), a “neutral tax” (compensated case) where the total revenue received from the tax was redistributed back amongst products. This approach used an iterative process for estimating the tax adjustments.
The tax compensation case was as in Edjabou and Smed [11] and is shown in Equation (14) whereby the terms of the original price ( p 0 ) multiplied by the revenue neutral term ( x ). This revenue neutral term equates the total revenue post tax change to the total revenue pre-tax change [9].
t i =   E i × p e p 0 × x

4.3. Simulations of the Tax on Household Carbon Footprint and Nutrient Intake

Carbon elasticities allow for estimating how the carbon emissions associated with the change in food consumption affect the emissions consumed (based on Huang, [23]). Equation (13) shows that the carbon/nutrient elasticities ( N ) are equal to the carbon/nutrient food share ( S ) multiplied by the price elasticities of demand ( E ). Equation (13) shows how a one percent increase in price would affect the carbon/nutrients consumed. The tax rate estimate from the previous equations allows for inference on the effect of the tax in the different simulations.
N   =   S   ×   E
Equation (13) enables the absolute values of nutrients and carbon emissions to be estimated through applying these estimated relative changes to the mean intakes.
This study also estimated the Mean Adequacy Ratio (MAR) and Mean Excess Ratio (MER). MAR estimates the percentage of mean daily intake of 20 beneficial nutrients with 100 percent representing a diet which would conform to all of these nutritional requirements [24]. MAR estimates the percentage of mean daily intake of 20 beneficial nutrients (i.e., proteins, fibre, retinol equivalents, thiamine, riboflavin, niacin, vitamin B-6, folates, vitamin B-12, ascorbic acid, vitamin E, vitamin D, calcium, potassium, iron, magnesium and zinc) with a value of 100 percent representing a diet which would conform to all of these nutritional requirements. Note that the components of the MAR are truncated to 100 therefore excesses of one of the nutrients cannot compensate the lack of another nutrient. The formula of the MAR is given by (14), where c i is the intake of nutrient i, R i is the recommended intake of nutrient i.
MAR   = 1 17   ×   i = 1 17 c i R i   ×   100
MER was developed as an indicator of bad nutritional quality. The MER is calculated as the mean daily percentage of maximum recommended values ( M R i ) for 3 harmful nutrients, namely saturated fatty acids, sodium and free sugars, with a low percentage indicating a healthier diet [23]. MER is given by Equation (15)
MER   =   1 3 × ( i = 1 3 c i MR i × 100 ) 100
Each ratio comprising the MER that was below 100 (i.e., below the maximum recommended value) was set as 100 in order to avoid one ratio to compensate the excesses of another. Therefore, MER values above 100 indicate a diet with excess in one or more of harmful nutrients.

5. Results and Discussion

In this section, the results on the simulations of the carbon taxes are presented: it starts with the changes in nutrients, followed by the change in GHG emissions to end with the trade-off between nutrition and GHG emissions. The changes in quantities with respect to the baseline are presented in Table A4 and Table A5 in the Appendix A.

5.1. Impact of Taxes on GHG Emissions

The changes in GHG emissions with respect to the baseline for each tax scenario due are presented in Figure 1.
The largest reduction in GHG emissions (relative to the baseline of 4.02 KgCO2e/g) arises from the uncompensated simulation which ranges from 1 percent (3.98 KgCO2e/g) in the scenario when only beef and veal and other not preserve meets are taxed (i.e., first scenario) to 18.7 percent (i.e., 3.98 KgCO2e/g) for the fourth scenario (all the products are taxed).
The situation is different for the compensated scenario where the largest reduction in GHG emissions of 15.7 percent (i.e., 3.39 KgCO2e/g) is for carbon tax price 3 in the third simulation (when all the animal based products are being taxed), whilst the smallest reduction of 0.6 percent (i.e., 3.99 KgCO2e/g) is for carbon tax price 2 in the fourth simulation.
The above results are largely consistent with the result of Edjabou and Smed [11] in the sense that higher consumer prices will prevail in the uncompensated scenario, thus the reduction in demand is expected to greater.
The food group associated with largest GHG emissions are the meat groups with beef being one of the highest emitters. It is therefore, of little surprise that this food group experiences a decrease in consumption for all the different tax scenarios. The largest reductions are for the carbon price 3 for the third simulation (irrespective of compensated or uncompensated scenario) show little difference in reduction of this food group (ranges from 39.9 percent to 44.4 percent).
It is important to note that from a GHG emission it the most efficient policy, given the aforementioned emissions, is to only tax beef, veal and not preserve meats groups, since they reach 13 percent decrease in GHG (for a carbon price of 0.1709 £/kg and the highest tax) in contrast with the 18 percent when all the products are taxed (scenario 4). This is similar to the compensated scenario where the only meats scenario (for the same carbon price case and the highest tax) reaches a decrease of 12.5 percent in comparison with 16.7 percent on the scenario when all the animal products are considered. This provides the basis for the analysis of trade-offs between nutrition and GHG emission in the context of carbon taxes, which is done on the next section.

5.2. Impact of Taxes on Nutrition

Figure 2 presents the changes on nutrients with respect to the baseline due to the application of the taxes. It considers the changes in energy, proteins, fibre, carbohydrates, sugar, saturates, mono-unsaturates and poly-unsaturates, which are the nutrients normally shown in products.
As shown in Figure 2, uncompensated scenario, the higher the carbon tax, the higher the decrease in nutrients. The fourth scenario (i.e., when all the products are taxed) is the one showing the greatest decreases. In the case of the compensated case, the pattern is very similar for most of the nutrients, except in the case of fats (all of them) on the fourth scenario, which shows percentage reduction that is lower in absolute value than the third scenario (i.e., when all animals are based).
Whilst the scenarios show substantial reduction in sugars and saturated fats in both the uncompensated and compensated cases which improves the diet, it also brings down the intake of fibres, which is negative. Sugars are an area of particular interest given recent concerns expressed by Lustig et al. [25] over potential to cause obesity.
It is important to note that increases in prices due to the taxation have effects on the entire diet, not just only on the consumption of the products that have been taxed. This is due to the presence of substitution effects but also due to income effects. Thus, even if fruits and vegetables are not directly taxed in the first three scenarios, they are negatively affected particularly under the second scenario (i.e., all meats and eggs are taxed) and a carbon price of 0.1709 £/kg (i.e., 25.1 percent for vegetables and 16.1 percent for fruits in the uncompensated case and 24.4 and 14 percent on the compensated case, respectively). These decreases in the purchases of fruits and vegetables could be considered a harmful effect of the application of a carbon tax because it is detrimental to the Government’s campaign of five fruit or vegetables a day.
The values of the MAR and the MER were estimated at the baseline to be equal to 84.5 percent and 107.2 percent. They indicate that the UK diet does not satisfy the nutritional requirements and it exceeds recommendations in terms of harmful components. Although not shown here, none of the tax scenarios manage to fully improve the adequacy of the diet in nutritional terms.

5.3. Trade-Off between Nutrition and Environment under Different Taxes

The trade-off between nutrition and GHG emissions are shown in Figure 3. Nutrition was summarised by the MAR and MER indicators. The left panels represent the relationship between the MAR and the GHG emissions whilst the right ones portray the MER and the GHG emissions. The arrows indicate the direction of improvement in terms of the MAR, MER and GHG emissions.
The MAR indicated that for every tax scenario there will be a decrease in this ratio which suggests that the scenarios will result in fewer intakes of beneficial nutrients. The reduction is relatively small considering that the baseline is 84.5 percent and the lowest value is 74.9 percent for carbon tax rate 3, uncompensated case considering taxation of all the products (fourth scenario) and the highest value is 84.2 percent for carbon tax price 2, compensated case with taxing only beef veal and unprocessed meats.
The MER indicated a small decrease for all scenarios relative to the baseline of 107.2 percent, which indicates an improvement of the diet. The lowest MER is experienced for carbon price 3, uncompensated case for the scenario where all the products are taxed with a value of 100.13 percent, whilst the highest MER is attributed to carbon price 2, compensated case for taxation only beef veal and unprocessed meats with 106.9 percent. Note, however, that on the compensated case, the results of carbon price 2 and 3 are the best compromise between nutrition and environment because whilst carbon price 2 produces the best result in terms of carbon reduction, carbon price 3 does it in terms of nutrition.
Therefore, note that the overall the effect of the carbon taxes is to slightly reduce intakes of important nutrients (i.e., no carbon tax scenario improves the value shown in the baseline) while also slightly decreasing intake of harmful nutrients.
An interesting point is whether it would be possible to find a combination that improves nutrition (specifically the MAR) whilst still reducing the GHG emissions. Given that the MAR at the baseline has a value equal to 84.47%, any tax (even those focused on one category as meat) will make the situation worse off. Additional simulations indicated that in order to improvements the MAR’s results would require subsidizing significantly (above 50 percent) categories such as vegetables, fruits and cereals.

6. Conclusions

The purpose of this paper has been to estimate the potential effect that a tax on the carbon footprint on food products may have UK households as regards the GHG emissions and the nutritional quality of the diets. This type of taxes is one of the ways to encourage consumers to improve the environmental sustainability of their food choices. This is important because in the context of the discussion of sustainable diets, duties to consumption goods are often discussed as a potential policy response to fight global warming. However, normally nutritional quality is not considered.
The results of the papers show that taxing high carbon food products has the potential to reduce both GHG emissions and to some extent improve nutrient intake by reducing the quantities of harmful nutrients.
The effectiveness of this outcome is dependent upon the type of tax used. Whilst the Ad-Valorem tax would likely be the simplest to administer, it would not be as effective as an actual carbon consumption tax in terms of GHG emission reductions. The carbon consumption tax of the uncompensated scenario (price 3, considering the taxation of all the products) which used the long-term EU projection of carbon price would likely result in the largest reduction of GHG emissions by 18.7 percent relative to the baseline.
Whilst the primary purpose of a carbon consumption tax is reducing GHG emissions, the effect that they may have on nutrition is also important. Both the mean adequacy ratio (MAR) and mean excess ratio (MER), which are coefficients aiming to summarise the nutritional situation of food choices, show small change in nutrient intake. All the scenarios show a deterioration of the MAR indicating worsening of the diets in terms of recommended nutrient intake. As regards the MER it shows a small decrease in excessively consumed nutrients such as sugars. This is reflected by the decrease in the consumption of free sugars in all the tax scenarios.
The study suggests in the context of the inadequacy of the UK diet, the importance to take into consideration not just GHG emissions when considering public policy measures towards environmental sustainability that may affect consumers’ food choices since these may have effects on nutrition.
In terms of future work, it is important to note that this paper has focused on taxes that are available in the literature; however, an extension of the work would be solve the public finance problem of finding an optimal carbon tax that reduces emission to some point, something similar to the analysis of a Laffer curve and compare the optimal tax with what is available in the literature and its implications on nutrition.

Acknowledgments

The material behind this paper derives from work funded by the Scottish Government’s Rural and Environment Science and Analytical Services Division (RESAS) as part of the Strategic Research Programme 2016–2020, Theme 3 (Food, Health and Wellbeing) and the UK Department of Food Environment of Rural Affairs (Defra) as part of the ERANET project “Implementing Sustainable Diets in Europe” (SUSDIET). The authors would like to thank the SUSDIET partners for discussions on the topic, in particular Professors Xavier Irz and Paolo Sckokai. All remaining errors are our own.

Author Contributions

Cesar Revoredo-Giha produced the simulation spreadsheet in Visual Basic, performed the simulations and re-wrote the final version of the paper, Neil Chalmers wrote the first version of the paper and provided information, and Faical Akaichi estimated the parameters used in the simulation.

Conflicts of Interest

The authors declare no conflict of interest.

Appendix A

Table A1. Food categories used in the analysis.
GroupCategoriesProducts inside the Categories
1Grains and grain-based productsWhite bread, standard, sliced and unsliced; White bread, soft grain, sliced and unsliced; Brown bread, sliced and unsliced; Wholemeal and granary bread, sliced and unsliced; Rolls—white, brown or wholemeal; Malt bread and fruit loaves; Other breads; Flour; Crispbread; Oatmeal and oat products; Sweetened breakfast cereals; Other breakfast; Dried rice cereals; Cooked rice; Canned pasta; Dried and fresh pasta; Other cereal foods, frozen and not frozen.
2Vegetables and vegetable productsFresh cabbages; Fresh Brussels sprouts; Fresh cauliflower; Lettuce and leafy salads; Prepared lettuce salads; Other fresh green vegetables; Fresh carrots; Fresh turnips and swede; Other fresh root vegetables; Fresh onions, leeks and shallots; Fresh cucumbers; Fresh mushrooms; Fresh tomatoes; Fresh stem vegetables; Fresh marrow, courgettes, aubergine, pumpkin and other vegetables; Fresh herbs; Tomatoes, canned or bottled; Other canned beans and pulses; Other canned vegetables; Tomato puree and vegetable purees; Other frozen vegetables.
3Starchy roots, tubers, legumes, nuts and oilseedsFresh new potatoes; Fresh baking potatoes; Other fresh potatoes; Chips—frozen or not frozen; Instant potato; Canned potatoes; Fresh peas; Fresh beans; Peas, canned; Baked beans in sauce; Peas, frozen; Beans, frozen; Nuts and edible seeds
4Fruit, fruit products and fruit and vegetable juicesFresh oranges; Other fresh citrus fruits; Fresh apples; Fresh pears; Fresh grapes; Other fresh soft fruit; Fresh bananas; Fresh melons; Other fresh fruit; Tinned peaches, pears and pineapples; All other tinned or bottled fruit; Dried fruit; Frozen strawberries, apple slices, peach halves, oranges and other frozen fruits; Pure fruit juices; Beef joints—boned and on the bone; Beef steak—less expensive; Beef steak—more expensive; Minced beef; All other beef and veal; Lamb joints; Lamb chops; All other lamb; All other liver; All offal other than liver.
5Beef, veal and lambBeef joints—boned and on the bone; Beef steak—less expensive; Beef steak—more expensive; Minced beef; All other beef and veal; Lamb joints; Lamb chops; All other lamb; All other liver; All offal other than liver
6PorkPork joints; Pork chops; Pork fillets and steaks; All other pork; Bacon and ham joints, uncooked; Bacon and ham rashers, uncooked
7Poultry, eggs, other fresh meatChicken and turkey, cooked; Chicken, uncooked—whole chicken or chicken pieces; Turkey, uncooked—whole turkey or turkey pieces; Poultry other than chicken or turkey, uncooked; Other fresh, chilled and frozen meat; Eggs
8Processed and other cooked meatsBacon and ham, cooked; Corned beef, canned or sliced; Other cooked meat; Other canned meat and canned meat products; Sausages, uncooked—pork; Meat pies, pasties and puddings, frozen or not frozen; Burgers, frozen or not frozen; Pate; Meat pastes and spreads
9Fish and other seafoodWhite fish, fresh or chilled; Herrings and other blue fish, fresh or chilled; Salmon, fresh or chilled; Shellfish, fresh or chilled; Salmon, tinned; Other tinned or bottled fish
10Milk, dairy products and milk product imitatesUHT milk; Sterilised; Pasteurised/homogenised; Fully skimmed milk; Semi-skimmed milk; Condensed or evaporated milk; Yoghurt; Fromage frais; Cottage cheese; Soft natural cheese; Dried milk products; Milk drinks and other milks; Non-dairy milk substitutes; Canned or fresh carton custard
11CheeseHard cheese—cheddar type; Hard cheese—other UK or foreign equivalent; Hard cheese—edam or other foreign; Processed cheese
12Sugar and confectionary and prepared dessertsSugar; Syrup, treacle; Honey; Cakes and pastries, not frozen; Buns, scones and teacakes; Chocolate biscuits; Sweet biscuits (not chocolate) and cereal bars; All canned milk puddings; Puddings; Cake, pudding and dessert mixes; Jelly squares or crystals; Ice cream tub or block; Ice cream cornets, choc-ices, lollies with ice cream; Ice lollies, sorbet, frozen mousse, frozen yoghurt; Jams and fruit curds; Marmalade; Artificial sweeteners; Chewing gum; Takeaway confectionery.
13Soft drinksSoft drinks, concentrated, not low calorie; Soft drinks, not concentrated, not low calorie; Soft drinks, not concentrated, low calorie
14Animal fatsCream; Butter; Lard, cooking fat; Suet and dripping
15Plant based fatsSoft margarine; Other margarine; Olive oil; Other vegetable and salad oils; Peanut butter; Low fat spreads
16Tea, coffee, cocoa and drinking waterTea; Coffee beans and ground coffee; Instant coffee; Coffee essences; Cocoa and chocolate drinks; Malt drinks and chocolate versions of malted drinks; Fruit teas, instant tea, herbal tea, rosehip tea; Mineral or spring waters
17Alcoholic beveragesBeers; Lagers and continental beers; Ciders and Perry; Champagne, sparkling wines and wine with mixer; Table wine; Fortified wines; Spirits; Liqueurs and cocktails
18Composite dishesComplete meat-based ready meals, frozen or not frozen; Ready meals and other fish products—frozen or not frozen; Ready meals and other vegetable products, frozen or not frozen; Quiches and flans, frozen and not frozen; Pizzas, frozen and not frozen; Meat pies, ready to eat; Sausage rolls, ready to eat; Other convenience meat products, frozen or not frozen; Soups—canned or cartons; Soups—dehydrated or powdered
19Snacks and other foodsCrisps and potato snacks; Takeaway crisps, savoury snacks, popcorn, poppadums, prawn crackers; Cream crackers and other unsweetened biscuits; Other takeaway food brought home
20Residual categoryInvalid foods, slimming foods and sports foods; Salad dressings; Pickles; Sauces; Takeaway sauces and mayonnaise; Stock cubes and meat and yeast extracts; Salt; Vinegar; Spices and dried herbs; Bisto, gravy granules, stuffing mix, baking powder, yeast.
Table A2. Unconditional Marshallian elasticities.
Sustainability 10 00134 i0a2
Table A3. Unconditional expenditure elasticities.
CategoriesElasticity
Grains and grain-based products0.2982
Vegetables and vegetable products0.3088
Starchy roots, tubers, legumes, nuts and oilseeds0.3447
Fruit, fruit products and fruit and vegetable juices0.2962
Beef, veal and lamb0.4320
Pork0.4138
Poultry, eggs, other fresh meat0.3820
Processed and other cooked meats0.3749
Fish and other seafood0.3214
Milk, dairy products and milk product imitates0.2781
Cheese0.3271
Sugar and confectionary and prepared desserts0.3219
Soft drinks0.4233
Animal fats0.3083
Plant based fats0.3018
Tea, coffee, cocoa and drinking water0.2921
Alcoholic beverages0.5208
Composite dishes0.3141
Snacks and other foods0.4137
Residual category0.3370
Food out of home1.1520
Non-food2.4040
Table A4. Changes in consumption, nutrients and GHG emissions with respect to the baseline due to carbon taxes (uncompensated scenario).
Sustainability 10 00134 i0a4
Table A5. Changes in consumption, nutrients and GHG emissions with respect to the baseline due to carbon taxes (compensated scenario).
Sustainability 10 00134 i0a5

References

  1. World Meteorological Organization. Provisional WMO Statement on the Status of the Global Climate. 2016. Available online: http://public.wmo.int/en/media/press-release/provisional-wmo-statement-status-of-global-climate-2016 (accessed on 15 December 2016).
  2. Intergovernmental Panel on Climate Change IPCC. Fifth Assessment Synthesis Report: Summary for Policymakers. 2014. Available online: https://www.ipcc.ch/pdf/assessment-report/ar5/syr/AR5_SYR_FINAL_SPM.pdf (accessed on 15 December 2016).
  3. Audsley, E.; Brander, M.; Chatterton, J.C.; Murphy-Bokern, D.; Webster, C.; Williams, A.G. How Low Can We Go? An Assessment of Greenhouse Gas Emissions from the UK Food System and the Scope to Reduce Them by 2050; WWF-UK: Gland, Switzerland, 2009. [Google Scholar]
  4. Bingzhen, D.; Zhen, L.; de Groot, R.; Long, X.; Xiaochang, C.; Ruizi, W.; Chuanzhun, S.; Chao, W. Changing food consumption patterns and impact on water resources in the fragile grassland of Northern China. Sustainability 2015, 7, 5628–5647. [Google Scholar]
  5. World Health Organization. Diet, Nutrition and the Prevention of Chronic Diseases. 2003. Available online: http://apps.who.int/iris/bitstream/10665/42665/1/WHO_TRS_916.pdf (accessed on 15 December 2016).
  6. Briggs, A.D.M.; Kehlbacher, A.; Tiffin, R.; Garnett, T.; Rayner, M.; Scarborough, P. Assessing the impact on chronic disease of incorporating the societal cost of greenhouse gases into the price of food: An econometric and comparative risk assessment modelling study. BMJ Open 2013, 3, 1–11. [Google Scholar] [CrossRef] [PubMed]
  7. Panzone, L.A.; Perino, G.S.; Swanson, T. Leung, D. Testing for the Best Instrument to Generate Sustainable Food Consumption. Int. J. Food Syst. Dyn. 2012, 2, 237–252. [Google Scholar]
  8. Mazzocchi, M.; Cagnone, S.; Bech-Larsen, T.; Niedźwiedzka, B.; Saba, A.; Shankar, B.; Verbeke, W.; Traill, W.B. What is the public appetite for healthy eating policies? Evidence from a cross-European survey. Health Econ. Policy Law 2015, 10, 267–292. [Google Scholar] [CrossRef] [PubMed]
  9. Mytton, O.T.; Clarke, D.; Rayner, M. Taxing unhealthy food and drinks to improve health. Br. Med. J. 2012, 15, 344–351. [Google Scholar] [CrossRef] [PubMed]
  10. Baumol, W.J. On taxation and the control of externalities. Am. Econ. Rev. 1972, 36, 307–322. [Google Scholar]
  11. Edjabou, L.; Smed, S. The effect of using consumption taxes on foods to promote climate friendly diets—The case of Denmark. Food Policy 2013, 39, 84–96. [Google Scholar] [CrossRef]
  12. García-Muros, X.; Markandya, A.; Romero-Jordán, D.; González-Eguino, M. The distributional effects of carbon-based food taxes. J. Clean. Prod. 2017, 140, 996–1006. [Google Scholar] [CrossRef]
  13. Defra. Family Food 2015. 2017. Available online: https://www.gov.uk/government/uploads/system/uploads/attachment_data/file/597667/Family_Food_2015-09mar17.pdf (accessed on 15 June 2017).
  14. EFSA Survey Details. MicroStrategy. 2017. Available online: https://dwh.efsa.europa.eu/bi/asp/Main.aspx?src=Main.aspx.2048001&evt=2048001&hiddensections=header%2Cpath%2CdockTop&documentID=D8333A2B48842E699881C7ABD939A1FB&currentViewMedia=8&visMode=0&Server=-Ua9CyBjZZt7uhDs5YGU9JVQclRg%3D&Port=-2GGlYxbTqwGp__US&Project=-ap8dUKIlSMMMc25PJi4N8wEJ7mb6UlCetqsSSLyLZxXLpEB-mAsG6wpKOqm-DnfT6uSh2NPk_gXXMo_Z&encryptedByRedir=true& (accessed on 15 June 2017).
  15. Public Health England. National Diet and Nutrition Survey. 2016. Available online: https://www.gov.uk/government/collections/national-diet-and-nutrition-survey (accessed on 15 June 2017).
  16. Hartikainen, H.; Pulkkinen, H. 2016 Summary of the chosen methodologies and practices to produce GHGE-estimates for an average European diet. In Natural Resources and Bioeconomy Studies 58/2016; Natural Resources Institute Finland: Helsinki, Finland, 2017. [Google Scholar]
  17. Lewbel, A.; Pendakur, K. Tricks with Hicks: The EASI demand system. Am. Econ. Rev. 2009, 99, 827–863. [Google Scholar] [CrossRef]
  18. Deaton, A.; Muellbauer, J. An Almost Ideal Demand System. Am. Econ. Rev. 1980, 70, 312–326. [Google Scholar]
  19. Pendakur, K. EASI Made Easier. In Quantifying Consumer Preferences (Contributions to Economic Analysis, Volume 288); Slottje, D.J., Ed.; Emerald Group Publishing Limited: Bingley, UK, 2009; Chapter 7; pp. 179–206. [Google Scholar]
  20. Carpentier, A.; Guyomard, H. Unconditional elasticities in two-stage demand systems: An approximate solution. Am. J. Agric. Econ. 2001, 83, 222–229. [Google Scholar] [CrossRef]
  21. The Scottish Index of Multiple Deprivation. Available online: http://www.gov.scot/Topics/Statistics/SIMD (accessed on 15 June 2017).
  22. Caillavet, F.; Fadhuile, A.; Nichelle, V. Taxing animal-based foods for sustainability: Environmental, nutritional and social perspectives in France. Eur. Rev. Agric. Econ. 2016, 43, 537–560. [Google Scholar] [CrossRef]
  23. Vieux, F.; Soler, L.; Touazi, D.; Darmon, N. High nutritional quality is not associated with low greenhouse gas emissions in self-selected diets of French adults. Am. J. Clin. Nutr. 2013, 97, 1–15. [Google Scholar] [CrossRef] [PubMed]
  24. Huang, K.S. Nutrient elasticities in a complete food demand system. Am. J. Agric. Econ. 1996, 78, 21–29. [Google Scholar] [CrossRef]
  25. Lustig, R.H.; Schmidt, L.A.; Brindis, C.D. Public health: The toxic truth about sugar. Nature 2012, 482, 27–29. [Google Scholar] [CrossRef] [PubMed]
Figure 1. Change in GHG emissions with respect to the baseline by tax scenario, uncompensated and compensated cases. Note: The initial number refers to the taxed group (i.e., 1, 2, 3 and 4), AdV refers to the Ad Valorem tax, the remaining are carbon taxes.
Sustainability 10 00134 g001
Figure 2. Change in nutritional results with respect to the baseline by tax scenario, uncompensated and compensated cases. Note: The initial number refers to the taxed group (i.e., 1, 2, 3 and 4), AdV refers to the Ad Valorem tax, the remaining are carbon taxes.
Sustainability 10 00134 g002
Figure 3. MAR and MER and GHG emissions by tax scenario, uncompensated and compensated cases.
Sustainability 10 00134 g003
Table 1. Simulated carbon taxes.
ScenariosTax 1Tax 2
Ad Valoremper KgCO2 eq
(%)(per kg Product) 1/
1. Beef and veal, other meats, not preserved
 1.1 Beef and veal, other meats, not preserved20Price(i) × 40
2. All meat and eggs (by KgCO2 eq per kg product)
 2.1 Beef and veal, other meats, not preserved20Price(i) × 40
 2.2 Pork20Price(i) ×7.1
 2.3 Processed and other cooked meats20Price(i) × 7.1
 2.4 Poultry, eggs, other fresh meat20Price(i) × 4.3
3. All animal-based products (by KgCO2 eq per kg product)
 3.1 Beef and veal, other meats, not preserved20Price(i) × 40
 3.2 Animal fats20Price(i) × 8.3
 3.3 Cheese20Price(i) × 8.3
 3.4 Pork20Price(i) × 7.1
 3.5 Processed and other cooked meats20Price(i) × 7.1
 3.6 Fish, seafood and their products20Price(i) × 5
 3.7 Poultry, eggs, other fresh meat20Price(i) × 4.3
 3.8 Milk, milk products20Price(i) × 2.3
4. All products (tax rate proportional to emissions per Kg of product, with varying rates) 2/
 4.1 Beef and veal, other meats, not preserved30Price(i) × 40
 4.2 Animal fats20Price(i) × 8.3
 4.3 Cheese20Price(i) × 8.3
 4.4 Pork20Price(i) × 7.1
 4.5 Processed and other cooked meats20Price(i) × 7.1
 4.6 Fish, seafood and their products20Price(i) × 5
 4.7 Poultry, eggs, other fresh meat10Price(i) × 4.3
 4.8 Plant based fats10Price(i) × 3.38
 4.9 Milk, milk products10Price(i) × 2.3
 4.10 Vegetables, fresh and processed10Price(i) × 2
 4.11 Sweet products and substitutes10Price(i) × 1.6
 4.12 Alcoholic beverages10Price(i) × 1.43
 4.13 Cereals, cereal products and substitutes5Price(i) × 0.98
 4.14 Potatoes, tubers, nuts, legumes and their products5Price(i) × 0.86
 4.15 Fruit, fresh and processed5Price(i) × 0.71
 4.16 Tea, coffee, cocoa, drinking water5Price(i) * 0.26
Note: 1/ Price 1: 0.0128 £/kg (current average Emission Trading System (ETS) price); Price 2: 0.0427 £/kg (mean social cost of carbon; EC medium term projection of carbon price); Price 3: 0.1709 £/kg (long term EU projection of carbon price); 2/ Rates: 30%, for products with ≥10 KgCO2 eq emissions (per kg product); 20%, for products with 5–9.9 KgCO2 eq emissions (per kg product); 10%, for products with 1–4.9 KgCO2 eq emissions (per kg product); 5%, for products with 0–0.9 KgCO2 eq emissions (per kg product).

