Article

A Framework of Payment for Ecosystem Services to Protect Cropland: A Case Study of the Yangtze River Delta in China

1
College of Land Management, Nanjing Agricultural University, Nanjing 210095, China
2
National & Local Joint Engineering, Research Center for Rural Land Resources Use and Consolidation, Nanjing 210095, China
3
School of Geography, Geomatics, and Planning, Jiangsu Normal University, Xuzhou 221116, China
4
College of Architecture and Environment, Sichuan University, Chengdu 610065, China
*
Authors to whom correspondence should be addressed.
Sustainability 2018, 10(1), 178; https://doi.org/10.3390/su10010178
Submission received: 5 December 2017 / Revised: 3 January 2018 / Accepted: 8 January 2018 / Published: 12 January 2018

Abstract

:
Due to large land demand and insufficient economic incentives, stakeholders have little motivation to protect cropland during rapid urbanization. The considerable loss of cropland poses a serious threat to food security and ecological sustainability. This research proposes a framework of payment for ecosystem services (PES) to reconcile the large land demand and the need for cropland protection during economic development by identifying whom to compensate, what to pay, how much to pay, the mechanisms for payment, and verification of service delivery. Using the Yangtze River Delta as an example, the features of the PES based on supply-demand analysis, compensation quality and value standards, and payment regulation are demonstrated. The results show the effectiveness of this PES framework for handling the externality of environmental protection compared to traditional regulatory approaches. The framework will also aid in the protection of cropland by coordinating the benefits of stakeholders.

1. Introduction

Over the past 30 years, China has experienced tremendously rapid economic growth, with unprecedented industrialization and urbanization [1,2]. Most of the urban expansion has occurred in the coastal areas of eastern China [3], such as the Yangtze River Delta and Pearl River Delta. As a result, an excessive loss of arable land has occurred, from a total of 1,282,431 km2 in 2000 to 1,217,333 km2 in 2010 [4]. Furthermore, the loss of arable land is expected to accelerate in future decades [5,6,7]. In addition, the quality of the cropland has degraded due to occupation during urban expansion [8]. It is critically important for policy makers to protect the limited cropland in China.
Human well-being is linked with the ecosystem (i.e., cropland ecosystem) [9,10]. Cropland, one of the most important resources for human beings, is declining in most countries [11]. It not only provides market value for stakeholders, such as food provision, but also yields other direct benefits for society and the environment that are not captured by markets, such as the regulation of water and climate systems, esthetic and cultural services, and enhanced supporting services (i.e., ecosystem services) [12,13]. Despite being infrequently included in market values, non-market values, such as social and environmental benefits from cropland, are more important and often benefit human life [14,15,16,17,18]. Particularly, quantity loss and quality degradation of cropland are serious threats to various ecosystem services and will eventually affect human well-being [19,20].
Ecosystem services include the benefits provided by a functioning ecosystem and contributions to human wellbeing [21,22,23]. These cropland-based ecosystem services degrade continuously. There are several critical reasons, including the nature of these services as public goods and a lack of ecological knowledge to quantify ecosystem services [24,25,26]. Furthermore, many ecosystem services derived from cropland, including regulating services and cultural services, are considered public goods that are not conducive to establishing market exchanges [27]. To solve such a problem and make the external costs internalized, an economic incentive program for the payment of ecosystem services should be established from the perspective of a market-based policy to prompt cropland protection [28,29]. On the one hand, policy makers need to understand the full benefits of cropland protection. On the other hand, it is a challenge to identify the suppliers and beneficiaries of cropland protection and to quantify the total benefits associated with this protection. In order to reconcile the conflict between economic development and cropland protection, the Chinese government had declared to establish diversified market-based mechanisms for ecological compensation, so that the cropland protection policy could be more feasible with the economic stimulation. A regional payment for ecosystem services (PES) framework for cropland protection is needed for two purposes: (1) to balance the responsibilities and rights of the stakeholders associated with cropland protection and (2) to develop a regional compensation strategy that is consistent with the supply and demand of cropland.
Cropland protection has a positive externality, which is a benefit enjoyed by other regions as a result of the intra-regional conservation of cropland. Here, a positive externality refers to a benefit that is enjoyed by a ‘third party’ (regions with less cropland compared with their demand) as a result of an economic transaction (cropland protection). However, regions with more cropland protection will lose more development opportunities. Therefore, the regions enjoying the benefit of cropland protection should make payment to the regions that take on more cropland protection. Despite the importance of PES for cropland protection, the previous literature has primarily focused on environmental compensation for resource conservation. Most studies have focused on the benefits of environmental conservation and payment [29,30,31,32,33,34], such as China’s Grain for Green program [35] and the Costa Rica program [36,37], whereas a regional economic compensation mechanism for cropland protection has rarely been discussed. The mechanism of payment for ecosystem services associated with cropland protection remains uncertain.
The aims of this article are to propose a PES framework to protect cropland and to apply this framework in the Yangtze River Delta, one of the most developed regions in China. From both social and economic perspectives, five components are essential to PES: identifying whom to compensate, what to pay (e.g., money or other forms of incentives), how much to pay, mechanisms for payment, and verification of service delivery [38]. According to these principles, we first developed a conceptual framework for a regional compensation mechanism for cropland protection. Second, we delimited the compensation regions by conducting cropland supply-demand analyses. Third, based on the land quality and comprehensive value of cropland, we established the quality and value standards for regional compensation. Finally, we established a regulatory regime for PES implementation and supervision.

2. PES Framework for Cropland Protection

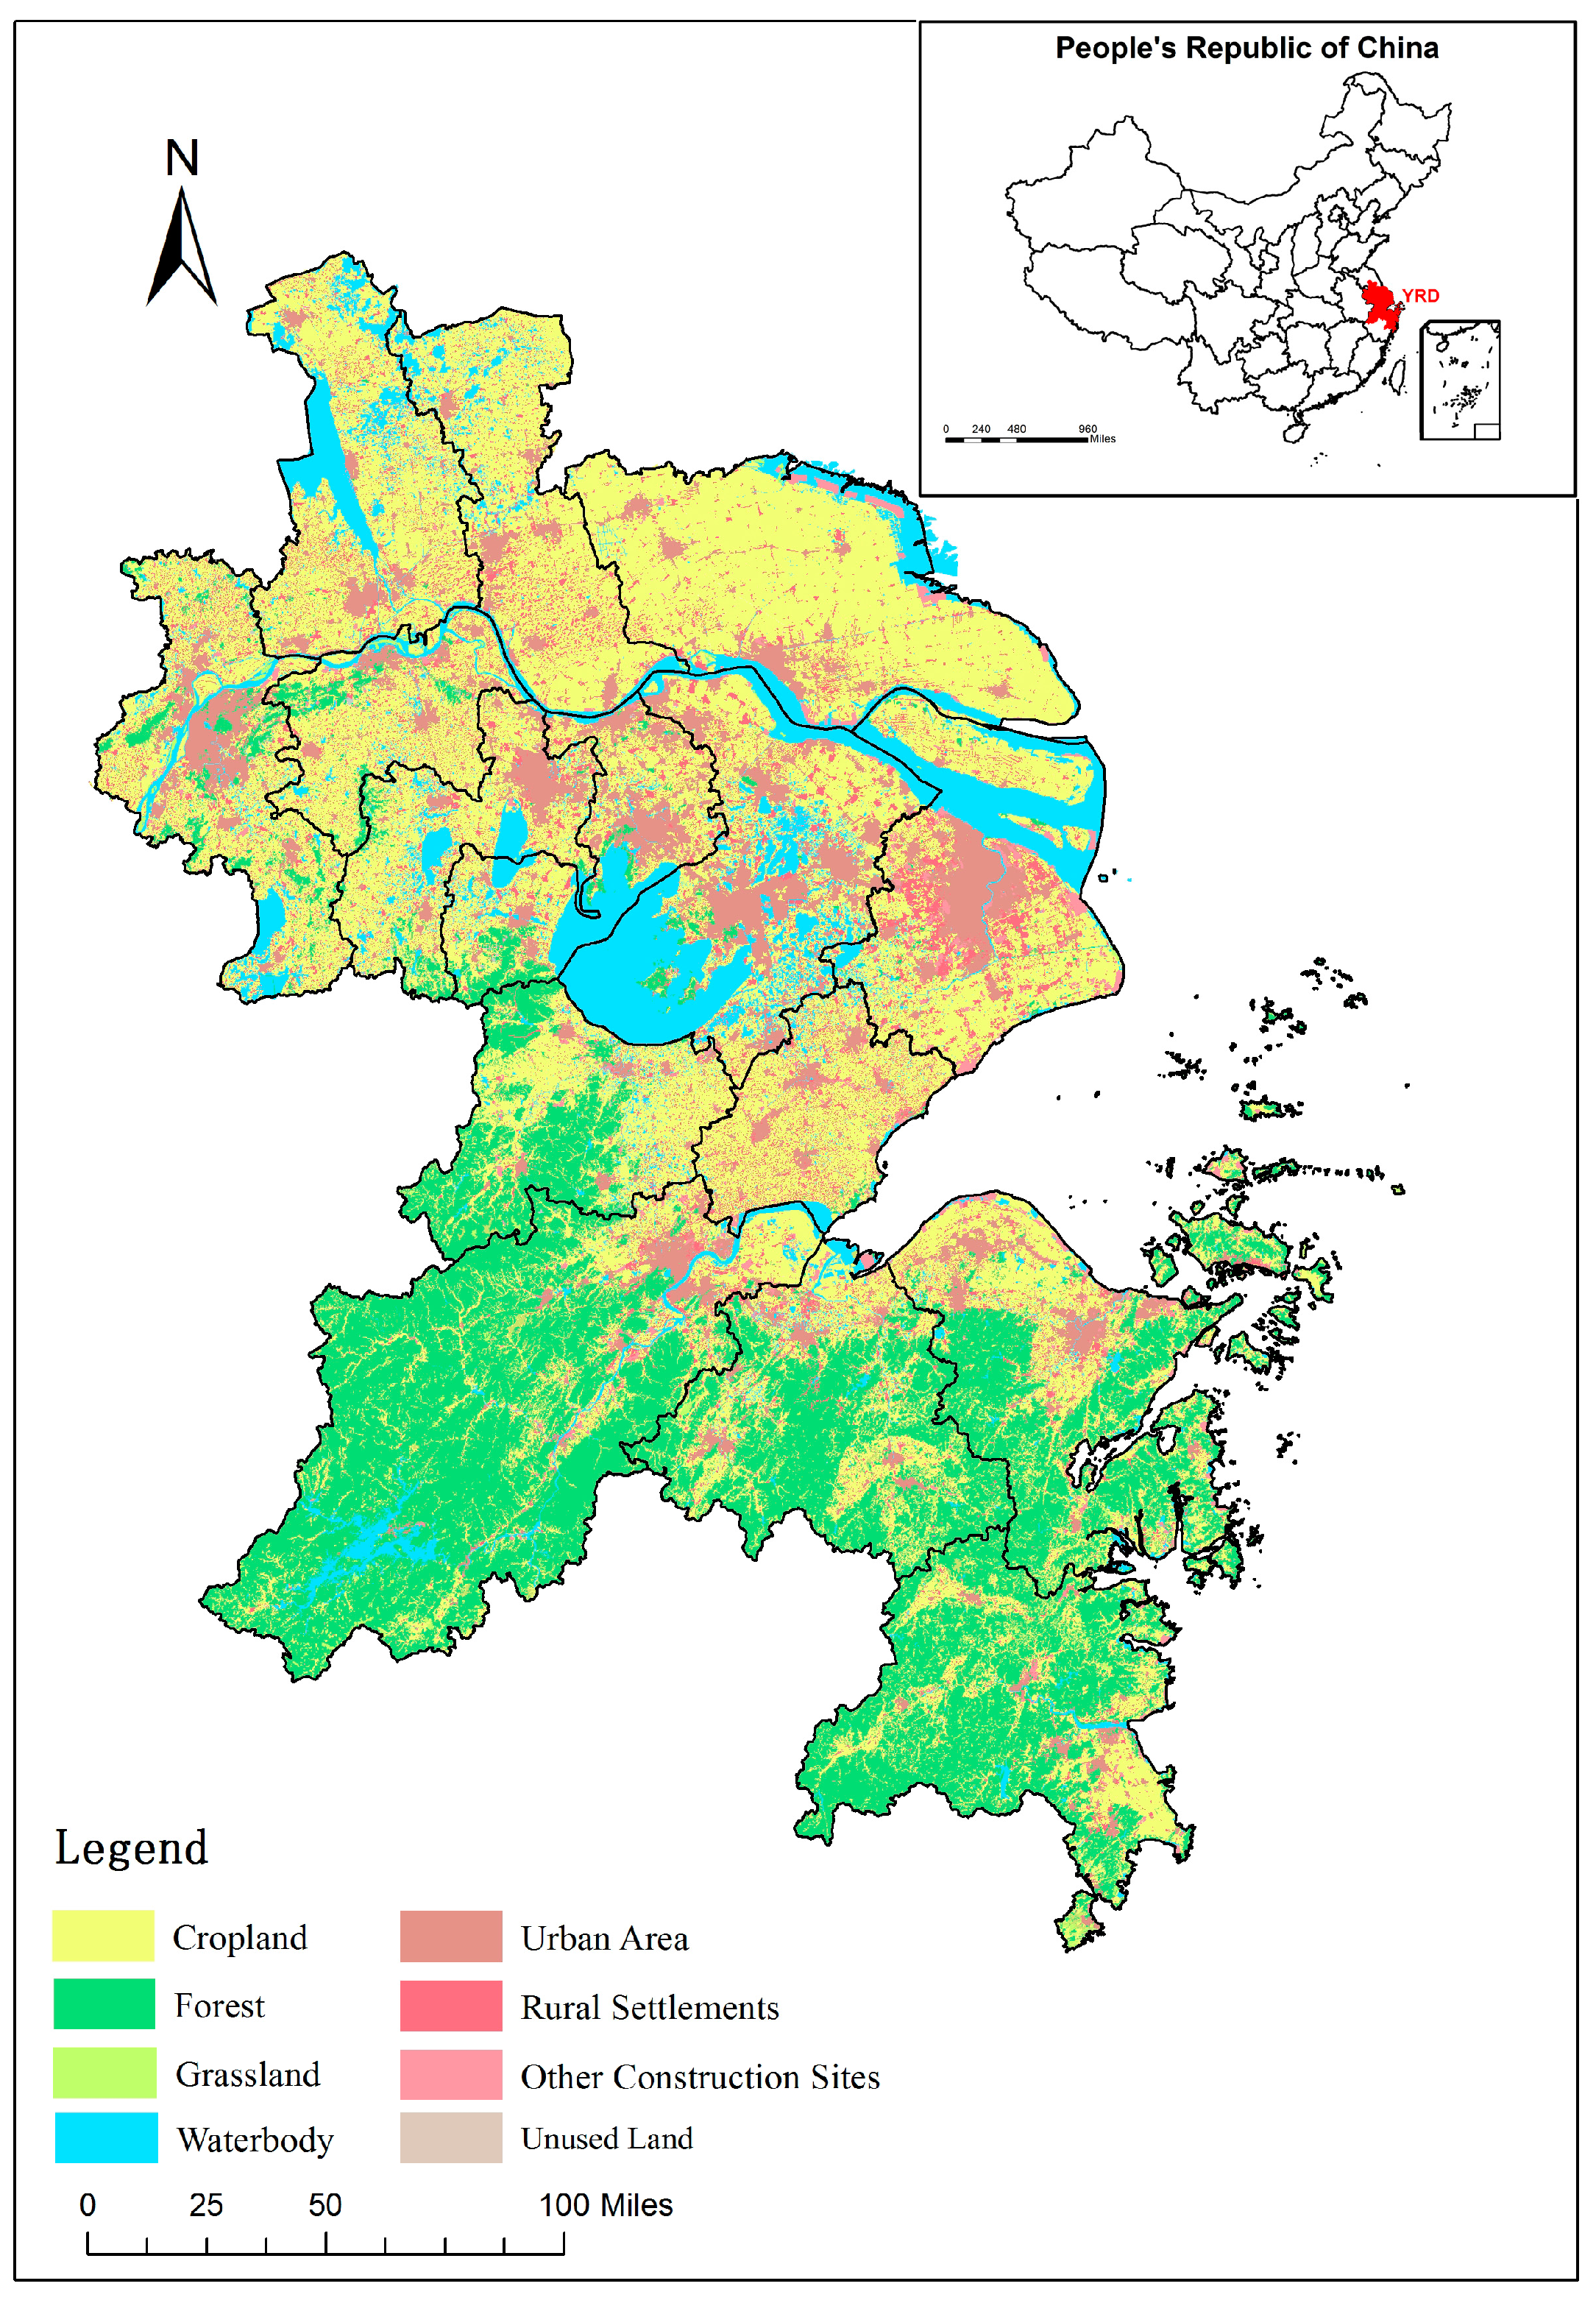
2.1. Study Area and Data

2.1.1. Study Area

The Yangtze River Delta (YRD) is one of the most developed regions in China, accounting for 1.00% of China’s total land area, supporting 7.60% of the nation’s 1.34 billion residents and producing 17.60% of the national gross domestic product (GDP) in 2010 [39,40]. The core region of the YRD comprises 16 cities (79 counties) (Figure 1). The cropland area of the YRD decreased from 5.76 × 10⁶ ha in 1996 to 4.98 × 10⁶ ha in 2010, which still accounts for 47.3% of the total area. According to the land use data, the built-up area grew substantially from 1985 to 2010 (approximately 2.5 times larger than the 1985 level), resulting in the occupation of large cropland areas. The decrease rate of cropland in the YRD was twice as high as the national average (6.39%). Consequently, conflict occurred between the rapid economic development and the need for cropland protection. On the one hand, urban expansion caused cropland occupation. The regulation policies of urban land expansion were insufficient with respect to land use planning, which led to a dramatic decline in the quantity and quality of cropland. On the other hand, stakeholders did not receive adequate economic incentives due to the absence of PES for cropland protection. In addition, different regions have distinct economic development rates and cropland supply and demand in the YRD. Therefore, it is important to establish a compensation mechanism (i.e., PES) to reconcile economic development and cropland protection for different regions in the YRD.

2.1.2. Data Sources and Processing

The main data in this study include land use data, soil data, and social-economic data. The land use data were obtained from land use cover vector data at 1:100,000 scale which were derived from the Chinese Academy of Science (http://www.geodata.cn/). The land use database was constructed from Landsat TM/ETM+ (NASA, Washington DC, USA) with a spatial resolution of 30 × 30 m. The cropland supply in 2010 for different regions was obtained from this dataset.
Soil data (including soil quality indicators) were obtained from the Harmonized World Soil Database (HWSD) [41]. Seven key soil quality indicators for crop production were derived as status indicators [42] (Table 1). The other land quality indicators were calculated according to social-economic data. Re-scaling method was employed for indicators’ normalization [43,44]. Then the cropland quality index was calculated using GIS by calculating the weighted average value (equal weighting and additive aggregation) of those indicators’ standardized value at the city level.
Social-economic data (e.g., population, GDP, fertilizer use, and effective irrigation area) were derived from the Statistical Yearbooks of Shanghai, Jiangsu, and Zhejiang or their cities (http://www.stats-sh.gov.cn/; http://www.jssb.gov.cn/; http://tjj.zj.gov.cn/).

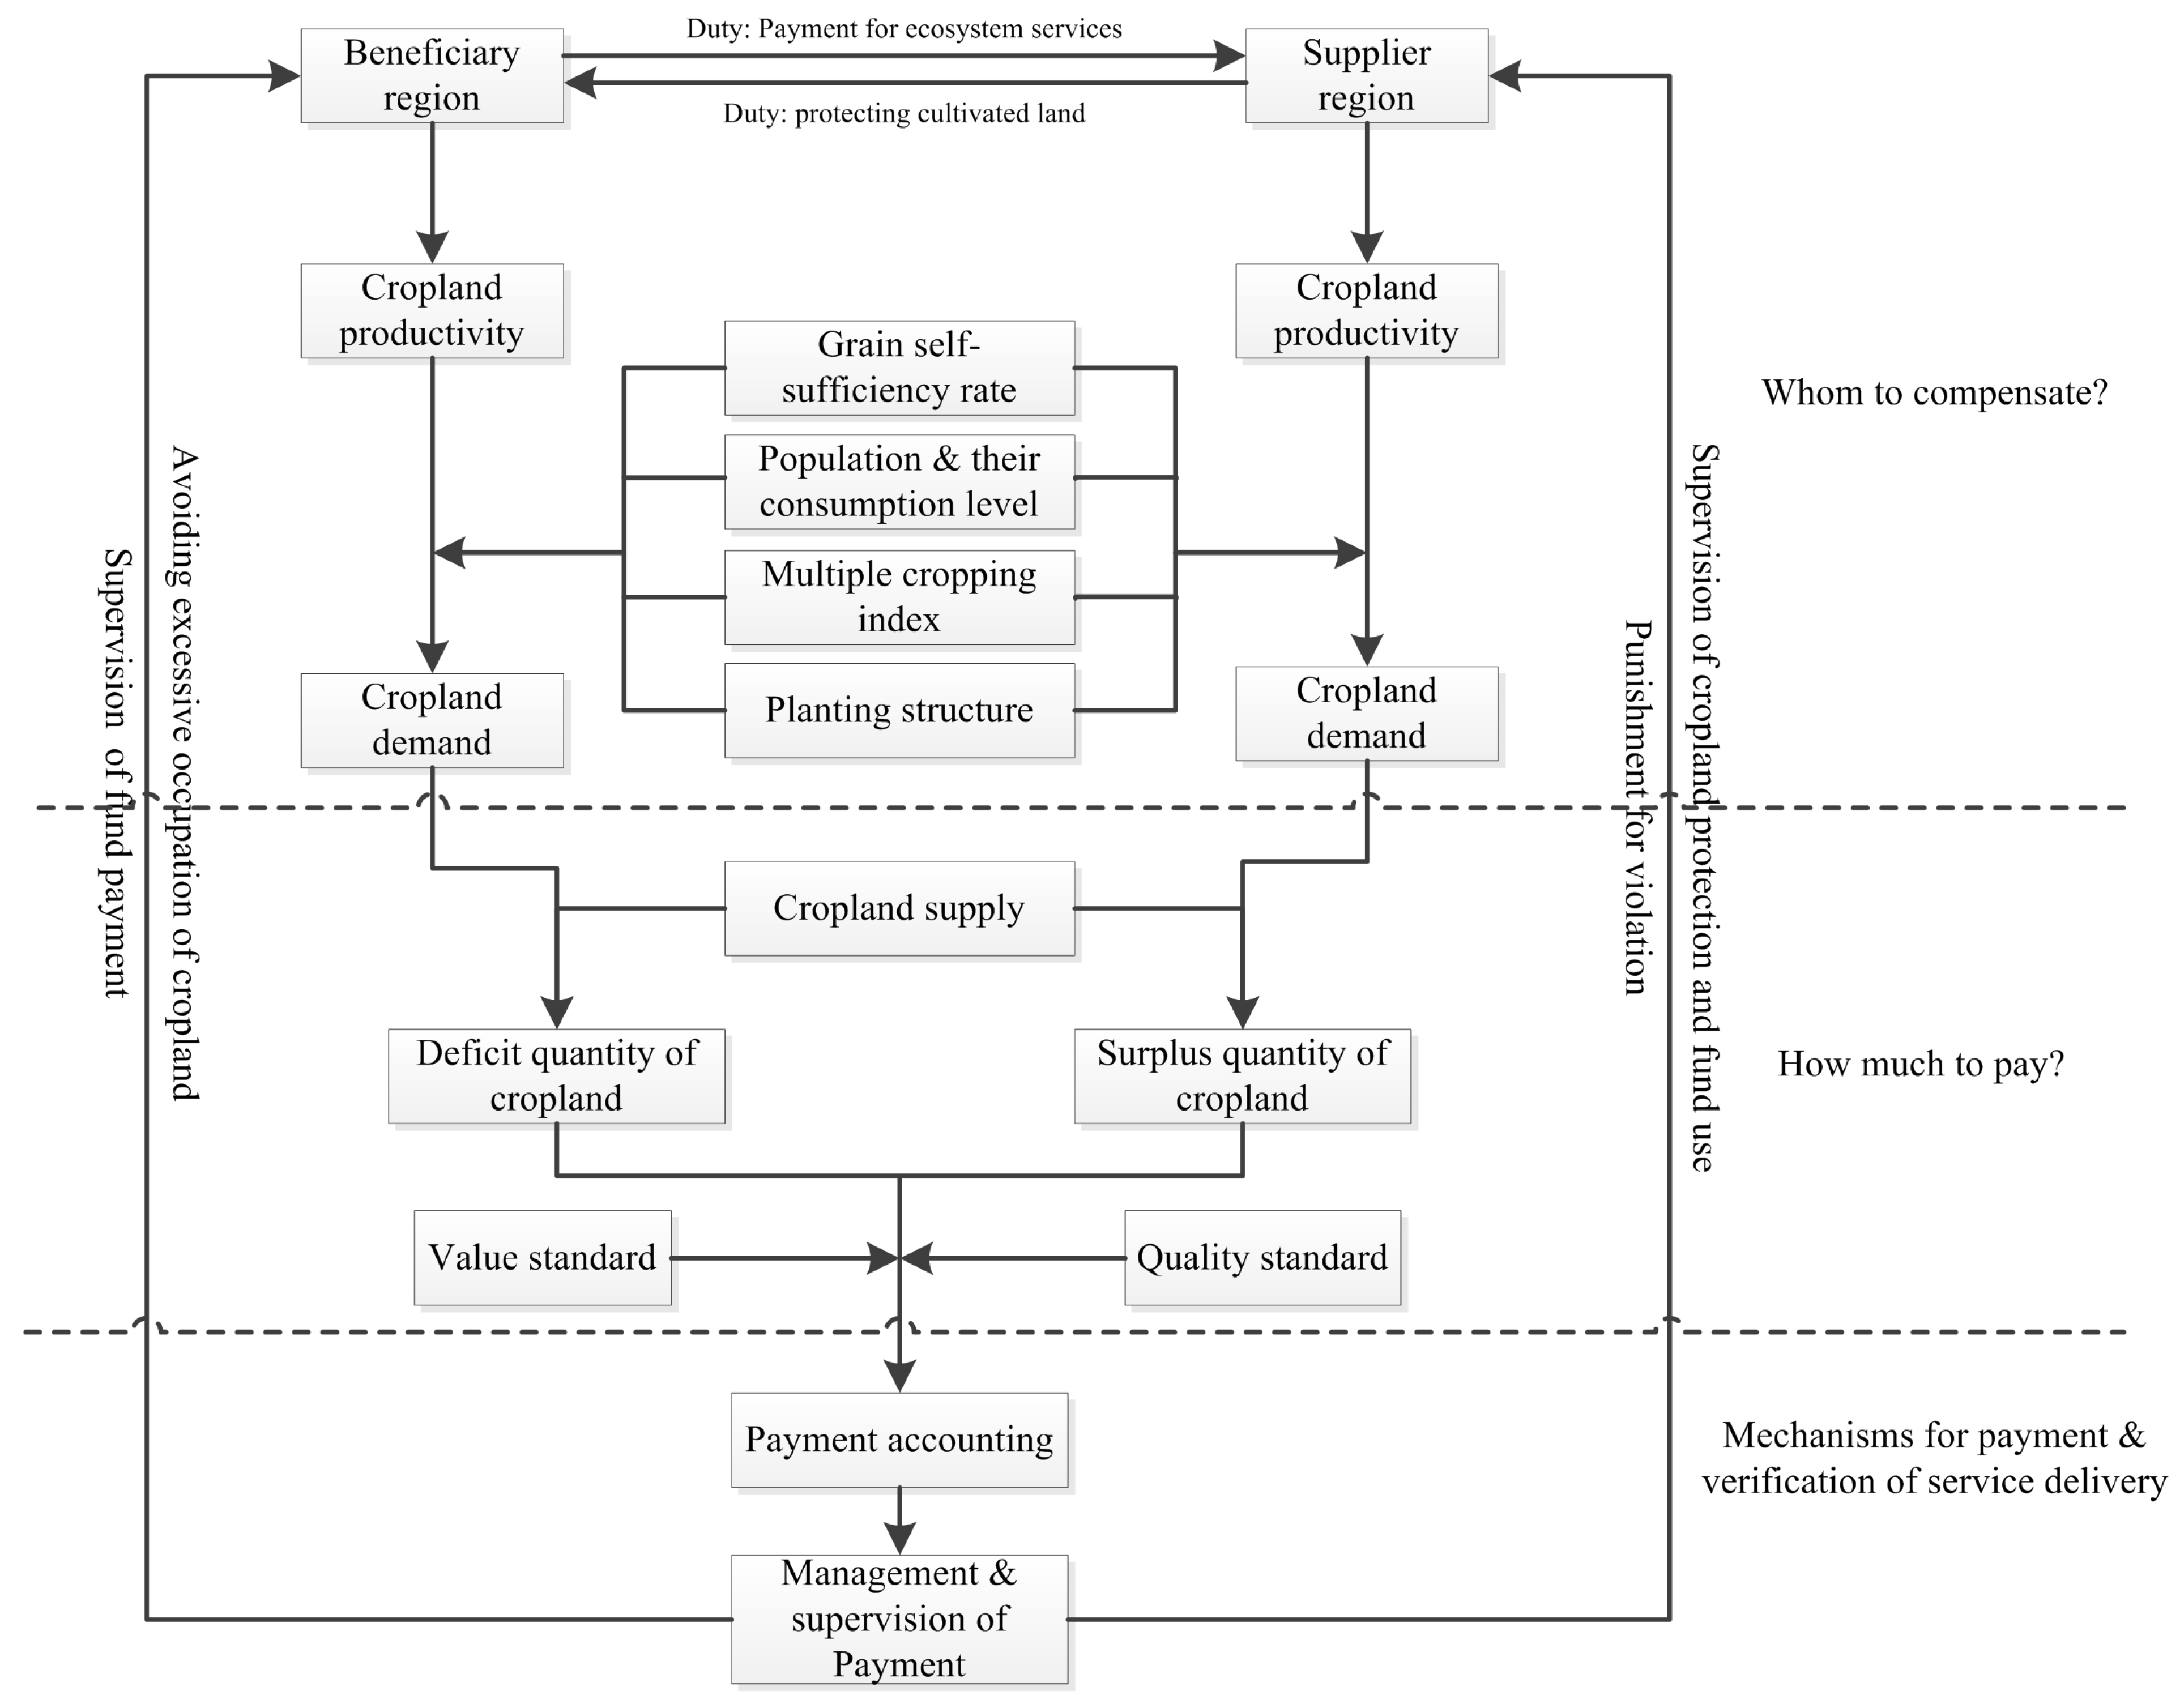
2.2. The PES Framework

PES schemes are increasingly used for securing and supporting enhanced ecosystem services. Via these schemes, external costs can be internalized (i.e., the beneficiaries have to pay for their enjoyment of these services). Deficit regions (where the cropland supply is less than the demand) are the beneficiaries of ecosystem services supplied by cropland. As a mean of compensation, these regions should make payment to cropland surplus regions (the suppliers of ecosystem services). This can facilitate the relationship between different regions with respect to the obligations of cropland protection and the rights of economic development. Consequently, multiple objectives, including economic development, social stability, and ecological security, can be achieved with limited cropland resources.
To propose a conceptual PES framework for cropland protection, we extended the idea presented by Naeem [38]. A regional compensation mechanism for cropland protection consists of three aspects: (1) Determine whom to compensate. In this respect, we determined supplier regions and beneficiary regions based on a supply-demand analysis of cropland; (2) Determine how much to pay. To calculate the quantity of compensation funds, we established reasonable regional compensation standards for cropland protection. The compensation standards were divided into two categories, quality standard and value standard. We calculated the compensation fund using the standardized compensation area combined with the value standard; (3) Explore the regulatory mechanism for payment and verification of service delivery such that the regional compensation system was implemented effectively (Figure 2).

2.2.1. Who to Compensate: A Supply-Demand Analysis of Cropland

First, we determined the suppliers and beneficiaries of cropland protection according to a supply-demand analysis of cropland. Regional cropland demand was calculated based on national grain self-sufficiency rate scenarios using the regional population, grain consumption level, cropland productivity of grain, multiple cropping index, and planting structure. Furthermore, the regional supply–demand status of cropland was confirmed through comparison with cropland supply. We identified (i) surplus regions as suppliers of ecosystem services that should receive corresponding compensation for cropland protection, which will subsequently strengthen regional ecosystem functions and services and (ii) deficit regions as beneficiaries of ecosystem services that should make payment.

2.2.2. How Much to Pay: Payment Accounting Using Compensation Quality Standard and Value Standard

Compensation standards can be divided into two categories: quality standard and value standard. Quality standard is the national average quality of cropland. Due to differences in cropland quality among different regions, we identified the conversion coefficients for various regions by comparing their cropland quality index (CQI) with the quality standard. The value standard is the comprehensive cropland value per unit area that should be confirmed according to the ecosystem service value of cropland. In combination with the cropland supply–demand status and compensation standards, the compensation amount was confirmed using the standardized compensation area multiplied by the value standard.

2.2.3. Mechanisms for Payment: Regulatory Regime of PES

The regulatory regime is the critical element of efficient implementation of PES for cropland protection. Thus, it is important to establish regulatory mechanisms for payment inspection and service delivery verification. A specific department, such as a compensation fund committee (CFC), should be established to formulate regulatory policies. The CFC should make the rules for regional PES, including fund accounting, inspection, and regulation. Based on compensation standards and the regional supply-demand status of cropland, the CFC should calculate the compensation amount for suppliers and beneficiaries. The CFC should also undertake inspection and supervision duties of compensation fund management, such as compensation fund collection, payment transferal, supervision, and punishment for non-compliance.

2.3. Supply-Demand Analysis of Cropland

The cropland supply was obtained from land use data, and cropland demand was estimated using the food demand method [45]. Cropland demand is determined by several factors, including population and grain consumption levels, grain self-sufficiency rate, grain cropland productivity, multiple crop index, and planting structure. We estimated the regional cropland demand assuming a grain self-sufficiency rate. The cropland demand equation is as follows:
Q d = r × C × P P r × S × M
where Q d represents cropland demand; r represents the grain self-sufficiency rate; C represents the grain consumption level; P represents the total population; P r represents grain cropland productivity; S represents the planting structure, i.e., the ratio of grain in the crop; and M represents the multiple crop index.
The regional surplus-deficit status of cropland was then determined by calculating the difference between the cropland demand ( Q d ) and supply ( Q s ). The equation used to calculate the cropland deficit or surplus is as follows:
R deficit/surplus = Q s Q d Q s

2.4. Determination of Quality and Value Standards for Compensation

2.4.1. Quality Standard for Cropland Compensation: Quality Assessment

To confirm the quality standard of cropland compensation, regional cropland quality needs to be assessed. Land quality refers to the state or condition of land, including the soil, water, and biological properties, relative to human needs [46]. Land quality needs to be assessed with respect to specific types of land use. Land quality indicators are critical for monitoring and evaluating land quality with respect to its potential for production and environmental management.
When monitoring land quality, several indicators should be selected when assessing cropland quality. The pressure-state-response (PSR) framework is one of the most popular indicator frameworks for sustainability appraisal [47]. Based on the PSR framework, the indicators used to appraise cropland quality can be categorized distinctly. The major land issues and the most important policy-related dimensions must be addressed with respect to land quality. Identification of the key land issues is the key step to establish cropland quality indicators.
With China’s rapid economic growth, the main problems in cropland use and protection include inappropriate land use patterns, increasing land degradation, and inadequacies related to policy and institutions. The detailed indicators are described below.
Pressure (cropland use system): Urban land expansion has occurred at an unprecedented rate in China as a result of population growth and industrialization and urbanization processes. This expansion (e.g., population density and GDP per capita) imposes considerable pressure on cropland use and protection. Cropland occupation and shortage lead to the migration of agricultural land from prime to marginal land, which is unsuitable for crop cultivation.
Status (cropland degradation): Status describes the present state, and cropland degradation refers to a reduction or loss of the agricultural production capacity or cultural or ecological regulatory functions (e.g., excess salts and toxicity). The most widely used land degradation indicators are soil fertility decline and soil pollution [46].
Response (cropland protection policy): Response refers to the cropland protection policy that decision makers apply to anomalies of land conditions; this policy can contribute to an improvement in cropland quality. Appropriate land policy (e.g., fertilizers and mechanical use) can relieve cropland pressure and mitigate the impact of cropland degradation.
Based on the PSR framework, indicators of cropland quality assessment were selected (Table 1). The cropland quality index of the entire country is the cropland quality standard. By comparing the regional quality index of cropland with the quality standard, the conversion coefficient of cropland quality can be calculated for this region.
The regional CQI was obtained by calculating the selected indicators. Cropland quality was further assessed and compared for different regions.
Normalization: When the value of the indicators lies within a small range, a re-scaling method can be applied for data normalization. This explicitly increases the effect on the composite indicator. In this paper, we used a re-scaling method to normalize the indicators of cropland quality [48]. This procedure normalized the indicators to within an identical range from 0 to 1.
Weighting: Weights usually have an important impact on composite indicators and resultant ranking [48]. Different weight schemes provide distinct results even with the same index system. In many composite indicator studies, all sub-indicators are given the same weight when there is no statistical or empirical literature available that allows the choice of a different scheme. Therefore, the equal weighting method was used to weight the indicators of cropland quality assessment in this paper.
Aggregation: Cropland quality is a composite index used to express the sub-indicator aggregate level. The most widely used method for aggregation is the additive technique, which uses each sub-indicator directly to aggregate the weighted transformations of the original sub-indicator. The additive aggregation method was used in this paper.

2.4.2. Value Standard for Cropland Compensation: Ecosystem Services Assessment

Ecosystems provide a range of goods and services for maintaining human livelihood [49]. Ecosystem functions refer to the habitat, biological or system properties, and ecosystem processes. Both ecosystem goods (e.g., food) and services (e.g., entertainment) represent the benefits derived from ecosystem functions. The success of PES initiatives is reliant upon scientific understanding of the ecosystem services of interest [38]. The indirect economic value (e.g., regulating value and cultural value) of ecosystem services was reported to be 14.94 times higher than that of the direct economic value [14].
As one of the main components of agro-ecosystems, cropland provides provisioning, regulating, and cultural services for human welfare [14,38,49]. The ecosystem services of cropland have strong positive externalities. For example, regions with more cropland will benefit the adjacent regions with better air quality and food security. Obviously, these services supplied by specific regions are shared by other regions, resulting in asymmetry of costs (losing development opportunity with more cropland) and benefits (economic development as urbanization and industrialization). Hence, regional compensation mechanisms should be established to balance the cost and benefit of suppliers of cropland protection. Furthermore, we need to confirm the compensation value standard according to the ecosystem services derived from cropland, namely, the provisioning value, regulating value and cultural value of cropland.
Based on the analysis of ecosystem services supplied by cropland, the total cropland value ( V ) can be categorized as the provisioning value ( V p ), regulating value ( V r ), or cultural value ( V c ).
Provisioning value: Cropland areas produce necessary food and raw materials for human survival; these are the main sources of farmers’ income in China. 88% of human foods, including grain, oil, vegetables and other food products or by-products, are all provided by cropland. In addition, cropland is the main source of raw materials in the light industry. Thus, cropland possesses provisioning value due to the provisioning services of food and raw materials.
Regulating value: The regulating value refers to the value of regulating services derived from cropland. The regulating services of cropland generally include the generation and maintenance of ecological balance, biological diversity protection, climate regulation, nutrient storage, cycling, etc. [21].
Cultural value: The cultural value refers to the value of cultural services derived from cropland. Cropland ecosystems can be spiritual, recreational, educational, and scientific sites for humans. The most important cropland cultural service is the spiritual one that comprises food security on a national scale and social security at a household scale. On the one hand, cropland, providing the majority of food, is the foundation to ensure food security in China. On the other hand, it can accommodate a large amount of surplus labor in rural areas when people lose their jobs in the city due to the instability of non-farm employment. Cropland provides an escape and survival for migrant workers faced with job uncertainty and instability (Table 2).
Various methods have been developed to estimate the value of ecosystem services. In this article, we synthesized previous studies that have used a wide range of methods [14,25,45,50,51].
The provisioning value of cropland can be attained through the selling of products (e.g., grain and wheat). Thus, the provisioning value of cropland is compensated during the process of cropland utilization. Consequently, only the regulating value and cultural value should be considered for the compensation of cropland protection.

2.5. Accounting and Payment Regulation of Compensation Fund

While determining the regional surplus and deficit quantity of cropland, the standardized compensation area can be confirmed using the cropland quality standard:
A s = ( Q s Q d ) × CQI CQI s
where A s represents the standardized compensation area for cropland protection; CQI represents the cropland quality index; and CQI s represents the cropland quality standard.
In combination with the standardized compensation area of cropland protection and the value standard, the compensation funds for different regions can be calculated by multiplying the standardized compensation area with the value standard:
F deficit/surplus = A s × V s
where F deficit/surplus represents the compensation amount, and V s represents the cropland value standard.
Then, the regulatory regime for PES should be established to supervise the suppliers’ behavior pertaining to cropland protection and to regulate the payment collection and transfer.

3. Results

3.1. Gap between Cropland Supply and Demand

Cropland supply frequently varies among regions. However, due to differences in population, GDP, and cropland quality, cropland demands can differ among regions. When conducting a supply-demand analysis of cropland, the multi-scale analysis method should be employed to identify the differences among various scales [52].
At the regional scale, the YRD cannot feed itself from its own cropland (Table 3). When the parameters of grain self-sufficient rate, grain consumption level, total population, grain productivity, planting structure, and multiple crop index are all set according to the historic average in the YRD, cropland demand can be confirmed using Equation (1). The cropland supply can meet only 68% of the cropland demand in the YRD. To satisfy the regional need for crop production, the YRD depends on the croplands of other regions and needs to make payment to these regions for cropland protection.
At the city scale, the cropland supply-demand status varies among different cities. Specifically, supply-demand deficits occur in Shanghai, southern Jiangsu (including Nanjing, Wuxi, Suzhou, and Changzhou), and eastern Zhejiang (including Hangzhou, Ningbo, Shaoxing, Zhoushan, and Taizhou). The population density and economic development are high in these regions. Thus, urban expansion has occupied a large quantity of fertile cropland. Because of limited potentially reserved cropland, the cropland supply cannot meet the demand in these cities.
In contrast, there is a surplus of cropland in Middle Jiangsu (including Nantong, Yangzhou, and Taizhou) and western Zhejiang (including Jiaxing, and Huzhou) compared with cropland demand. In these cities, economic development and population density are relatively low. In addition, potentially reserved cropland is relatively high in these cities. Thus, cropland loss caused by industrialization and urbanization is not as profound as those cities in Shanghai, southern Jiangsu, and eastern Zhejiang. Because occupation of cropland by industrialization and urbanization is low, and supplementation of cropland by land consolidation is sufficient in these cities, there is a balance between cropland occupation and supplementation.
At the county scale, spatial heterogeneity of the supply-demand status is found in the YRD. In the core urban regions, including the municipal area of Shanghai, Suzhou, and Wuxi, the cropland deficit rate exceeds 2% (red areas in Figure 3). In the less developed regions adjacent to the urban core regions (yellow areas in Figure 3), including Kunshan, Wujiang, Changzhou, and Jiangyin, the cropland deficit rate decreases. In some parts of the YRD, where the conflict between economic development and cropland protection is low (light green areas in Figure 3), including Huzhou, Anji, and Jiande, cropland supply can generally meet demand. Moreover, in some regions with sufficient potential resources for cropland reclamation (green areas in Figure 3), including Yixing, Taichang, and Changxing, cropland supply exceeds demand. In these areas, more responsibilities should be scheduled to protect cropland. As the suppliers of ecosystem services, these counties deserve economic compensation for their relatively higher contribution to cropland protection and their consequent loss of development opportunities.

3.2. Quality and Value Standard for Compensation

3.2.1. Quality Standard for Compensation

Figure 4 presents the spatial pattern of several indicators concerning socioeconomic pressure (e.g., population density and GDP per capita), soil degradation properties (e.g., nutrient availability, nutrient retention capacity, and workability), and land use management responses (e.g., fertilizer use and effective irrigation fraction) in the YRD.
Figure 5 shows the spatial pattern of aggregated cropland quality.
The quality of cropland in Shanghai is lower than that in other cities (Table 4). This result is associated with cropland degradation due to the higher social-economic development rate and pressure without effective land management policies. The comprehensive CQI of China, which is cropland quality standard, was also analyzed. The results demonstrate that the national average CQI is 0.6353. By comparing the CQI of each city with that of the entire country (cropland quality standard), conversion coefficients of cropland quality for different regions can be obtained. The standardized compensation area of cropland protection can be calculated by multiplying the cropland quality conversion coefficient with the cropland deficit or surplus area using Equation (3).

3.2.2. Value Standard for Compensation

Because of the positive externality of cropland protection, regions as beneficiaries should make payments to those regions with greater cropland protection responsibilities. After confirming the standardized compensation area, another important issue is the determination of how much beneficiary regions should pay to supplier regions. Using the methods in Table 2, the cropland value standard for compensation, i.e., the payment per unit area made by the beneficiaries, can be confirmed (Table 5). The beneficiaries of cropland protection should pay $4228.88 per hectare to the suppliers.
After determining the value standard, the total payment for each region can be calculated as the product of the cropland value standard and the standardized compensation area (Equation (4)).

3.3. Regional Compensation Fund Accounting and Payment

Compensation for each region should be determined based on the standardized compensation area of cropland and the value standard.
Taking Shanghai and Yangzhou as examples, the standardized compensation area of Shanghai is 617,318 ha, while Yangzhou can receive payment for a standardized compensation area of 160,753 ha (Table 6). Thus, Shanghai should make payments because of their cropland deficit, and Yangzhou can obtain corresponding compensation due to its undertaking of greater cropland protection responsibilities. Specifically, assuming a compensation value standard of $4228.88 per hectare, Shanghai should make a payment of $2610.56 million. In contrast, Yangzhou should receive compensation of $679.80 million each year. Considering the regional financial expenditure capacity, the annual payment is a practical and rational compensation scheme.

3.4. Regulatory Regime for PES

After calculating the compensation funds, the regulatory regime for PES should be designed and implemented to ensure service delivery. The regulatory regime includes compensation fund management, inter-regional supervision, and punishment for non-compliance (Figure 6).

3.4.1. Compensation Fund Management

Collection of compensation funds: First, a compensation fund committee (CFC) should be established to collect and manage compensation funds. According to the accounting results, in this case study, Shanghai should make an annual payment of $2610.56 million to the CFC.
Management of compensation funds: In addition to the management of compensation funds, the CFC should also be responsible for the management of compensation funds. In the Shanghai-Yangzhou example, the CFC should transfer the payment ($679.80 million) to Yangzhou City. These compensation funds can be used for the construction of agricultural infrastructure, which will improve cropland quality and promote ecosystem services.

3.4.2. Compensation Supervision and Punishment

Supervision of regional compensation: The CFC should be responsible for monitoring the compensation fund. Additionally, the CFC should supervise the cropland protection behavior of the supplier regions. Furthermore, in addition to supervision by the CFC, a supervision system should be established between suppliers and beneficiaries. For example, the beneficiary regions can monitor the cropland quantity-quality protection of supply regions, while the supply regions can monitor the cropland occupation and payment of compensation funds in the beneficiary regions.
Punishment system for violation: To ensure the PES implementation and punish non-compliance behavior, penalties should be imposed for violations of the PES policy. With respect to the beneficiary regions, excessive occupation of cropland will result in a penalty that greatly exceeds the compensation fund. In addition, failure to accomplish cropland protection tasks and misuse of compensation funds in supply regions will lead to the return of compensation funds as well as extra penalties.

4. Conclusions

Using ecosystem services as an intermediary to make payments, we proposed a PES framework to provide a rational approach to establish an economic incentive method for cropland protection. The results showed that the framework is a more efficient alternative and complement to traditional regulatory approaches for handling the externality of environment protection. PES is also an effective method to balance the relationship between suppliers and beneficiaries [53,54,55]. By developing a formal, regional PES framework for cropland protection, we established an efficient method to protect cropland and to improve ecosystem services. Through this framework, beneficiaries can be charged for the regulating and cultural services that they enjoy. This PES framework will allow substantial progress in cropland protection, which will benefit both the quantity and quality of cropland protection.
The PES framework, which incorporates compensators, compensation standards, and a regulatory regime, provides a rational approach to establish an economic incentive method for cropland protection. Furthermore, the method can realize the internalization of externalities of cropland protection. By proposing a PES framework and applying this to the YRD, one of the most developed regions in China, this framework could identify whom to compensate, what to pay, how much to pay, the mechanisms for payment, and verification of service delivery for cropland protection. The details are as follows.
(1)
Cropland quality index in different regions are spatial heterogeneous. The national average CQI is 0.6353. In our case study, the quality of cropland in Shanghai is obviously lower than that in other cities in YZD.
(2)
The ecosystem services derived from cropland could be categorized into the provisioning services (agricultural products), regulating services (generation and maintenance of ecological balance, biological diversity protection, climate regulation, nutrient storage, cycling, etc.) and cultural services (food security and social security). The beneficiaries of cropland protection should pay $4228.88 per hectare standardized cropland to the suppliers.
(3)
With the implementation of regulatory regime for PES, service delivery can be ensured. Shanghai should make a payment of $2610.56 million. In contrast, Yangzhou could receive compensation of $679.80 million each year. By this means, different regions can achieve tradeoff between economic development and cropland protection.
This research examined the region-to-region payments by taking the YRD as a case study. However, PES at multiple scales should be analyzed in future studies (e.g., payments among stakeholders, such as local governments, collective economic organizations, and householders). Thus, further study should be conducted to discuss the distribution of compensation funds among stakeholders. To encourage the stakeholders to protect cropland, regional transferal payments should be fairly distributed. In addition, it is critical that an appraisal of the effects of payments is conducted by analyzing the measurable and verifiable outcomes that go beyond what would have occurred in the absence of the payment scheme. In brief, PES programs can achieve internalization of cropland protection externalities and trade-offs between conservation and development.

Acknowledgments

The authors are grateful for the assistance in data collection by the members of the China Center for Land Policy Research, Nanjing Agricultural University. The authors would like to thank American Journal Experts (AJE) for the English support during manuscript preparation. The authors acknowledge the support from the 111 project (B17024), the National Science Foundation of China (71303119, 71774085) and the Key Projects of Philosophy and Social Science Research, Ministry of Education of China (11JZD031). In addition, the support received from the Chinese Academy of Sciences for land use data assistance is acknowledged.

Author Contributions

In this paper, Jie Guo contributed to research design, data analysis, and writing of the article; Tianqi Zhu contributed to the assessment and assisted with the map processing; Minghao Ou contributed to the structure of the text; and Fengsong Pei, Xiaoyu Gan, Weixin Ou, and Yu Tao contributed to the manuscript revision.

Conflicts of Interest

The authors declare that no conflict of interest exists.

References

  1. Liu, J.Y.; Kuang, W.H.; Zhang, Z.X.; Xu, X.L.; Qin, Y.W.; Ning, J.; Zhou, W.C.; Zhang, S.W.; Li, R.D.; Yan, C.Z.; et al. Spatiotemporal characteristics, patterns, and causes of land-use changes in China since the late 1980s. J. Geogr. Sci. 2014, 24, 195–210. [Google Scholar] [CrossRef]
  2. Lichtenberg, E.; Ding, C. Local officials as land developers: Urban spatial expansion in China. J. Urban Econ. 2009, 66, 57–64. [Google Scholar] [CrossRef]
  3. Deng, X.; Huang, S.; Zhan, J.; Zhao, T. A Methodology Framework for Regional Land-use Change Studies based on Landsat TM images: A Case Study in Northeast China. Chin. J. Popul. Res. Environ. 2004, 2, 3–11. [Google Scholar]
  4. Ministry of Land and Resources of the People’s Republic of China. China Land & Resources Almanac; Editorial Department of China Land & Resources Almanac: Beijing, China, 2011.
  5. Bradbury, I.; Kirkby, R.; Shen, G. Development and environment: The case of rural industrialization and small-town growth in China. Ambio 1996, 25, 204–209. [Google Scholar]
  6. Ding, C. Policy and praxis of land acquisition in China. Land Use Policy 2007, 24, 1–13. [Google Scholar] [CrossRef]
  7. Angel, S.; Parent, J.; Civco, D.L.; Blei, A.; Potere, D. The dimensions of global urban expansion: Estimates and projections for all countries, 2000–2050. Prog. Plan. 2011, 75, 53–107. [Google Scholar] [CrossRef]
  8. D’Amour, C.B.; Reitsma, F.; Baiocchi, G.; Barthel, S.; Güneralp, B.; Erb, K.H.; Haberl, H.; Creutzig, F.; Seto, K.C. Future urban land expansion and implications for global croplands. Proc. Natl. Acad. Sci. USA 2017, 114, 8939–8944. [Google Scholar] [CrossRef] [PubMed]
  9. Cetin, M.; Adiguzel, F.; Kaya, O.; Sahap, A. Mapping of bioclimatic comfort for potential planning using GIS in Aydin. Environ. Dev. Sustain. 2016, 1–15. [Google Scholar] [CrossRef]
  10. Ceti̇n, M. Using GIS analysis to assess urban green space in terms of accessibility: Case study in Kutahya. Int. J. Sustain. Dev. World Ecol. 2015, 22, 420–424. [Google Scholar] [CrossRef]
  11. Kawasaki, K.; Uchida, S. Quality Matters more than quantity: Asymmetric temperature effects on crop yield and quality grade. Am. J. Agric. Econ. 2016, 98, 1195–1209. [Google Scholar] [CrossRef]
  12. Lynch, L.; Musser, W.N. A relative efficiency analysis of farmland preservation programs. Land Econ. 2001, 77, 577–594. [Google Scholar] [CrossRef]
  13. Lewis, D.J.; Barham, B.L.; Zimmerer, K.S. Spatial externalities in agriculture: Empirical analysis, statistical identification, and policy implications. World Dev. 2008, 36, 1813–1829. [Google Scholar] [CrossRef]
  14. Costanza, R.; d’Arge, R.; de Groot, R.; Farber, S.; Grasso, M.; Hannon, B.; Limburg, K.; Naeem, S.; O’Neill, R.V.; Paruelo, J.; et al. The value of the world’s ecosystem services and natural capital. Ecol. Econ. 1998, 25, 3–15. [Google Scholar] [CrossRef]
  15. Irwin, E.G.; Bockstael, N.E. Land use externalities, open space preservation, and urban sprawl. Reg. Sci. Urban Econ. 2004, 34, 705–725. [Google Scholar] [CrossRef]
  16. Ives, C.D.; Kendal, D. Values and attitudes of the urban public towards peri-urban agricultural land. Land Use Policy 2013, 34, 80–90. [Google Scholar] [CrossRef]
  17. Banerjee, S.; Cason, T.N.; de Vries, F.P.; Hanley, N. Transaction costs, communication and spatial coordination in Payment for Ecosystem Services Schemes. J. Environ. Econ. Manag. 2017, 83, 68–89. [Google Scholar] [CrossRef]
  18. Del Corso, J.-P.; Nguyen, T.D.P.G.; Kephaliacos, C. Acceptance of a payment for ecosystem services scheme: The decisive influence of collective action. Environ. Values 2017, 26, 177–202. [Google Scholar] [CrossRef]
  19. Wu, J. Landscape sustainability science: Ecosystem services and human well-being in changing landscapes. Landsc. Ecol. 2013, 28, 999–1023. [Google Scholar] [CrossRef]
  20. Villarroya, A.; Puig, J. Ecological compensation and environmental impact assessment in Spain. Environ. Impact Assess. Rev. 2010, 30, 357–362. [Google Scholar] [CrossRef]
  21. Hassan, R.M.; Scholes, R.; Ash, N. Ecosystems and Human Well-Being; Island Press: Washington, DC, USA, 2005. [Google Scholar]
  22. Sutton, P.C.; Anderson, S.J.; Costanza, R.; Kubiszewski, I. The ecological economics of land degradation: Impacts on ecosystem service values. Ecol. Econ. 2016, 129, 182–192. [Google Scholar] [CrossRef]
  23. Costanza, R.; Groot, R.D.; Braat, L.; Kubiszewski, I.; Fioramonti, L.; Sutton, P.; Farber, S.; Grasso, M. Twenty years of ecosystem services: How far have we come and how far do we still need to go? Ecosyst. Serv. 2017, 28, 1–16. [Google Scholar] [CrossRef]
  24. Kroeger, T.; Casey, F. An assessment of market-based approaches to providing ecosystem services on agricultural lands. Ecol. Econ. 2007, 64, 321–332. [Google Scholar] [CrossRef]
  25. Hein, L.; van Koppen, K.; de Groot, R.S.; van Ierland, E.C. Spatial scales, stakeholders and the valuation of ecosystem services. Ecol. Econ. 2006, 57, 209–228. [Google Scholar] [CrossRef]
  26. Norgaard, R.B. Ecosystem services: From eye-opening metaphor to complexity blinder. Ecol. Econ. 2010, 69, 1219–1227. [Google Scholar] [CrossRef]
  27. Brown, M.E.; Funk, C.C. Food security under climate change. Science 2008, 319, 580–581. [Google Scholar] [CrossRef] [PubMed]
  28. Reed, M.; Allen, K.; Attlee, A.; Dougill, A.; Evans, K.; Kenter, J.; Hoy, J.; McNab, D.; Stead, S.; Twyman, C. A place-based approach to payments for ecosystem services. Glob. Environ. Chang. 2017, 43, 92–106. [Google Scholar] [CrossRef]
  29. Rodríguez-Ortega, T.; Bernués, A.; Alfnes, F. Psychographic profile affects willingness to pay for ecosystem services provided by Mediterranean high nature value farmland. Ecol. Econ. 2016, 128, 232–245. [Google Scholar] [CrossRef]
  30. Dobbs, T.L.; Pretty, J. Case study of agri-environmental payments: The United Kingdom. Ecol. Econ. 2008, 65, 765–775. [Google Scholar] [CrossRef]
  31. Claassen, R.; Cattaneo, A.; Johansson, R. Cost-effective design of agri-environmental payment programs: US experience in theory and practice. Ecol. Econ. 2008, 65, 737–752. [Google Scholar] [CrossRef]
  32. Baylis, K.; Peplow, S.; Rausser, G.; Simon, L. Agri-environmental policies in the EU and United States: A comparison. Ecol. Econ. 2008, 65, 753–764. [Google Scholar] [CrossRef]
  33. Grima, N.; Singh, S.J.; Smetschka, B.; Ringhofer, L. Payment for Ecosystem Services (PES) in Latin America: Analysing the performance of 40 case studies. Ecosyst. Serv. 2016, 17, 24–32. [Google Scholar] [CrossRef]
  34. Bernués, A.; Tello-García, E.; Rodríguez-Ortega, T.; Ripoll-Bosch, R.; Casasús, I. Agricultural practices, ecosystem services and sustainability in High Nature Value farmland: Unraveling the perceptions of farmers and nonfarmers. Land Use Policy 2016, 59, 130–142. [Google Scholar] [CrossRef]
  35. Xu, Z.; Bennett, M.T.; Tao, R.; Xu, J. China’s Sloping Land Conversion Program four years on: Current situation and pending issues. Int. For. Rev. 2004, 6, 317–326. [Google Scholar] [CrossRef]
  36. Gauvin, C.; Uchida, E.; Rozelle, S.; Xu, J.; Zhan, J. Cost-effectiveness of payments for ecosystem services with dual goals of environment and poverty alleviation. Environ. Manag. 2010, 45, 488–501. [Google Scholar] [CrossRef] [PubMed]
  37. Pagiola, S. Payments for environmental services in Costa Rica. Ecol. Econ. 2008, 65, 712–724. [Google Scholar] [CrossRef] [Green Version]
  38. Naeem, S.; Ingram, J.C.; Varga, A.; Agardy, T.; Barten, P.; Bennett, G.; Bloomgarden, E.; Bremer, L.L.; Burkill, P.; Cattau, M.; et al. Get the science right when paying for nature’s services. Science 2015, 347, 1206–1207. [Google Scholar] [CrossRef] [PubMed]
  39. Xu, X.; Yang, G.; Tan, Y.; Tang, X.; Jiang, H.; Sun, X.; Zhuang, Q.; Li, H. Impacts of land use changes on net ecosystem production in the Taihu Lake Basin of China from 1985 to 2010. J. Geophys. Res. Biogeosci. 2017, 122, 690–707. [Google Scholar] [CrossRef]
  40. Gao, J.; Wei, Y.; Chen, W.; Yenneti, K. Urban land expansion and structural change in the Yangtze River Delta, China. Sustainability 2015, 7, 10281–10307. [Google Scholar] [CrossRef]
  41. Food and Agriculture Organization of the United Nations (FAO); International Institute for Applied Systems Analysis (IIASA); International Soil Reference and Information Centre (ISRIC); Institute of Soil Science, Chinese Academy of Sciences (ISSCAS). JRC, Harmonized World Soil Database (Version 1.2); FAO: Rome, Italy; IIASA: Laxenburg, Austria, 2012. [Google Scholar]
  42. International Institute for Applied Systems Analysis (IIASA); Food and Agriculture Organization of the United Nations (FAO). Global Agro-Ecological Zones (GAEZ v3.0); IIASA: Laxenburg, Austria; FAO: Rome, Italy, 2012. [Google Scholar]
  43. Nardo, M.; Saisana, M.; Saltelli, A.; Tarantola, S.; Hoffman, A.; Giovannini, E. Handbook on constructing composite indicators. Soc. Policies Data 2005. [Google Scholar] [CrossRef]
  44. Gan, X.; Fernandez, I.C.; Guo, J.; Wilson, M.; Zhao, Y.; Zhou, B.; Wu, J. When to use what: Methods for weighting and aggregating sustainability indicators. Ecol. Indic. 2017, 81, 491–502. [Google Scholar] [CrossRef]
  45. Cai, Y.; Huo, Y. Reevaluating Cultivated Land in China: Method and Case Studies. Acta Geogr. Sin. 2006, 10, 1084–1092. [Google Scholar]
  46. Pieri, C.J. Land Quality Indicators; World Bank Publications: Washington, DC, USA, 1995; Volume 315. [Google Scholar]
  47. Organisation for Economic Co-Operation and Development. OECD Core Set of Indicators for Environmental Performance Reviews; Organisation for Economic Co-Operation and Development: Paris, France, 1993; Volume 83. [Google Scholar]
  48. Nardo, M.; Saisana, M.; Saltelli, A.; Tarantola, S. Tools for Composite Indicators Building; Institute for the Protection and Security of the Citizen: Ispra, Italy, 2005. [Google Scholar]
  49. Butler, C.D.; Duraiappah, A.; Kumar, P.; John, M.M.A.; Niu, W.Y.; Chambers, R.; Chopra, K.; Dasgupta, P. Ecosystems and Human Well-Being; Island Press: Washington, DC, USA, 2003; pp. 71–84. [Google Scholar]
  50. Xie, G.; Li, W.; Xiao, Y.; Zhang, B.; Lu, C.; An, K.; Wang, J.; Xu, K.; Wang, J. Forest ecosystem services and their values in Beijing. Chin. Geogr. Sci. 2010, 20, 51–58. [Google Scholar] [CrossRef]
  51. Hein, L.; Miller, D.C.; de Groot, R. Payments for ecosystem services and the financing of global biodiversity conservation. Curr. Opin. Environ. Sustain. 2013, 5, 87–93. [Google Scholar] [CrossRef]
  52. Verburg, P.H.; Crossman, N.; Ellis, E.C.; Heinimann, A.; Hostert, P.; Mertz, O.; Nagendra, H.; Sikor, T.; Erb, K.-H.; Golubiewski, N.; et al. Land system science and sustainable development of the earth system: A global land project perspective. Anthropocene 2015, 12, 29–41. [Google Scholar] [CrossRef] [Green Version]
  53. Kinzig, A.P.; Perrings, F.S.C., III; Polasky, S.; Smith, V.K.; Tilman, D.; Turner, B.L., II. Paying for ecosystem services—Promise and peril. Science 2011, 334, 603–604. [Google Scholar] [CrossRef] [PubMed]
  54. Gómez-Baggethun, E.; de Groot, R.; Lomas, P.L.; Montes, C. The history of ecosystem services in economic theory and practice: From early notions to markets and payment schemes. Ecol. Econ. 2010, 69, 1209–1218. [Google Scholar] [CrossRef]
  55. Dougill, A.J.; Stringer, L.C.; Leventon, J.; Riddell, M.; Rueff, H.; Spracklen, D.V.; Butt, E. Lessons from community-based payment for ecosystem service schemes: From forests to rangelands. Philos. Trans. R. Soc. Lond B Biol. Sci. 2012, 367, 3178–3190. [Google Scholar] [CrossRef] [PubMed]
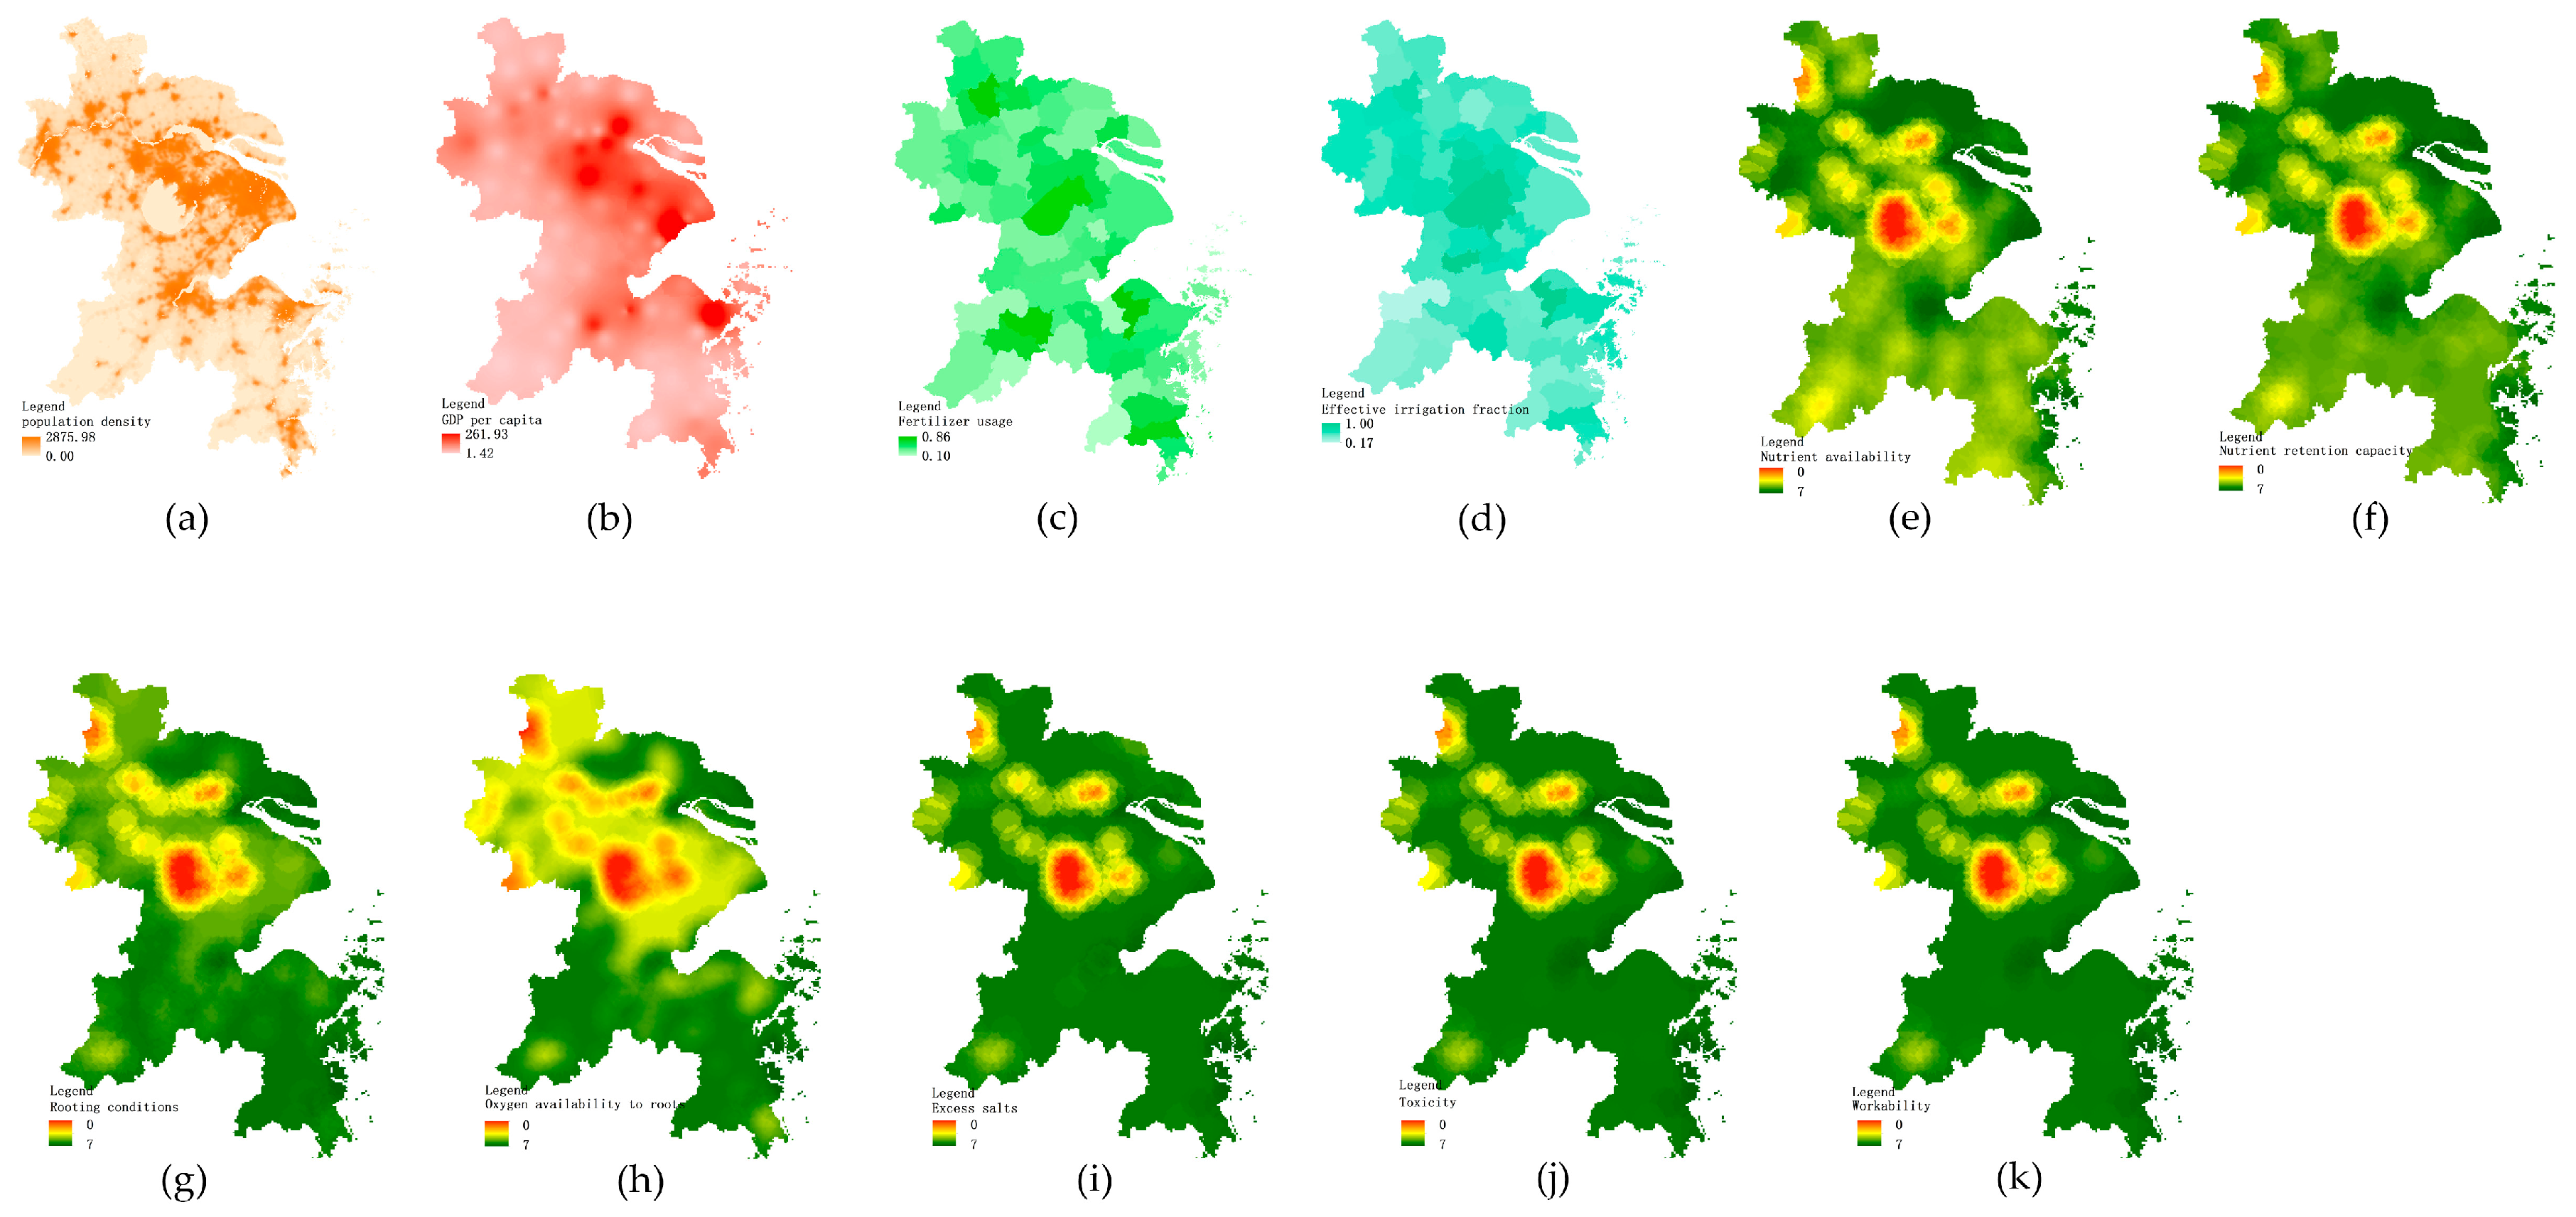
Figure 1. Study site map.
Sustainability 10 00178 g001
Figure 2. Framework of payment for ecosystem services (PES) for cropland protection.
Sustainability 10 00178 g002
Figure 3. Characteristics of cropland supply and demand in the Yangtze River Delta at the county scale.
Sustainability 10 00178 g003
Figure 4. Spatial patterns of cropland quality assessment indicators in the Yangtze River Delta. (a) population density; (b) GDP per capita; (c) fertilizer usage; (d) effective irrigation fraction; (e) nutrient availability; (f) nutrient retention capacity; (g) rooting conditions; (h) oxygen availability to roots; (i) excess salts; (j) toxicity; (k) workability.
Sustainability 10 00178 g004
Figure 5. Spatial pattern of aggregated cropland quality in the Yangtze River Delta.
Sustainability 10 00178 g005
Figure 6. Framework of the PES regulatory regime.
Sustainability 10 00178 g006
Table 1. Indicators of cropland quality assessment.
IndexDimensionIndicatorDefinitionPositive-Negative Correlation
Land quality indexPressurePopulation densityDenotes the level of population aggregation-
GDP per capitaIndicator to measure economic development level-
StatusNutrient availabilitySoil texture, soil organic carbon, soil pH, and total exchangeable bases+
Nutrient retention capacitySoil organic carbon, soil texture, base saturation, and cation exchange capacity of soil and clay fraction+
Rooting conditionsSoil texture, bulk density, coarse fragments, vertical soil properties, and soil phases affecting root penetration, and soil depth and soil volume+
Oxygen availability to rootsSoil drainage and soil phases affecting soil drainage+
Excess saltsSoil salinity, soil sodicity, and soil phases influencing salt conditions-
ToxicityCalcium carbonate and gypsum-
WorkabilitySoil texture, effective soil depth/volume, and soil phases constraining soil management+
ResponseFertilizer useApplication of chemical fertilizers per hectare+
Effective irrigation fractionProportion of effective irrigation area of cropland+
Table 2. Cropland value assessment according to its ecosystem services.
Value TypesEquationsDefinitions of Indicators
Total value V = V p + V r + V c V : Cropland total value
V p : Cropland provisioning value
V r : Cropland regulating value
V c : Cropland cultural value
Provisioning value V p = R m + R n R n : Net income of agricultural products
R m : Social average profit modification
Regulating value V r V r : Regulating value (Xie, 2010)
Cultural value of food security V cf = T + C p V cf : Value of national food security
T : Fees associated with cropland occupation
C p : Annual expenditure associated with cropland protection
Cultural value of social security V cs = Y a / A a
Y a = ( Y am × b + Y aw × c ) × M i / M 0
V cs : Value of social security
Y a : Pension insurance per capita
A a : Cropland area per capita
Y am : Premium insurance for male citizens
Y aw : Premium insurance for female citizens
b : Proportion of males in the total population
c : Proportion of females in the total population
M i : Monthly basic living expenses of farmers
M 0 : Monthly premium base
Table 3. Cropland supply-demand status at the city level in the Yangtze River Delta.
RegionCropland Supply (ha)DemandSupply-Demand Surplus or Deficit (ha)
Population (104 Persons)Grain Demand (kg Per Capita)Grain Yield Per Hectare (kg/ha)Multi-Cropping Index (%)Planting StructureSelf-Sufficiency Rate (%)Cropland Demand (ha)
Shanghai245,386.001412.32400.006607.141.630.4580.00936,658.26−691,272.26
Nanjing239,313.81632.42400.006867.571.400.4880.00437,721.04−198,407.23
Wuxi130,063.93466.56400.006774.771.390.6680.00241,412.39−111,348.46
Changzhou158,773.74360.80400.007131.371.460.7080.00159,185.58−411.83
Suzhou231,286.36637.66400.007075.641.170.6080.00412,438.81−181,152.45
Nantong448,602.99762.92400.006145.111.910.6280.00337,044.02111,558.97
Yangzhou309,899.47459.12400.006996.471.610.8280.00158,591.58151,307.89
Zhenjiang161,954.53270.71400.006744.011.470.7480.00117,344.5844,609.95
Taizhou311,328.57504.65400.007258.051.840.7680.00159,908.26151,420.31
Hangzhou222,113.61689.13400.005739.821.720.4680.00488,578.74−266,465.13
Ningbo204,437.07574.08400.005764.621.560.4780.00431,054.11−226,617.03
Jiaxing204,247.19341.60400.006720.071.670.5980.00166,077.6738,169.51
Huzhou138,101.43259.98400.006702.761.630.6080.00127,375.5010,725.93
Shaoxing187,685.53438.92400.006293.871.760.5680.00226,620.62−38,935.09
Zhoushan25,689.6396.77400.004730.710.940.4680.00151,905.75−126,216.13
Taizhou187,045.14583.15400.005431.491.420.5780.00421,780.65−234,735.50
Total3,405,929.018490.78400.006590.011.610.6180.004,973,697.56−1,567,768.56
Table 4. Cropland quality index at the city level in the Yangtze River Delta.
CityShanghaiNanjingWuxiChangzhouSuzhouNantongYangzhouZhenjiang
Quality0.56730.64510.63620.63730.60040.66320.67500.6363
CityTaizhouHangzhouNingboJiaxingHuzhouShaoxingZhoushanTaizhou
Quality0.66470.64100.69150.63740.66160.65900.67150.6697
Table 5. Cropland value standard for regional compensation.
Value typesComponentsValue ($/ha)
Provisioning valueAgricultural output value359.38
Regulating valueValue of regulating services2875.07
Cultural valueFood security value584.00
Social security value769.81
Total value——4588.27
Value standard——4228.88
Table 6. Compensation funds accounting for cropland protection in the Yangtze River Delta.
RegionCropland Surplus (ha)Cropland Quality IndexStandardized Compensation Area (ha)Compensation Fund (Million $)
Shanghai−691,272.260.57−617,317.55−2610.56
Nanjing−198,407.230.65−201,450.96−851.91
Wuxi−111,348.460.64−111,500.26−471.52
Changzhou−411.830.64−413.12−1.75
Suzhou−181,152.450.60−171,189.55−723.94
Nantong111,558.970.66116,462.23492.51
Yangzhou151,307.890.67160,752.86679.80
Zhenjiang44,609.950.6444,679.72188.95
Taizhou151,420.310.66158,423.30669.95
Hangzhou−266,465.130.64−268,856.62−1136.96
Ningbo−226,617.030.69−246,666.76−1043.12
Jiaxing38,169.510.6438,291.97161.93
Huzhou10,725.930.6611,169.0547.23
Shaoxing−38,935.090.66−40,388.46−170.80
Zhoushan−126,216.130.67−133,402.03−564.14
Taizhou−234,735.500.67−247,435.08−1046.37

