Quantifying Urban Land Sprawl and its Driving Forces in Northeast China from 1990 to 2015


1
Key Laboratory of Wetland Ecology and Environment, Northeast Institute of Geography and Agroecology, Chinese Academy of Sciences, Changchun 130102, China
2
University of Chinese Academy of Sciences, Beijing 100049, China
*
Author to whom correspondence should be addressed.
Sustainability 2018, 10(1), 188; https://doi.org/10.3390/su10010188
Submission received: 28 December 2017
/
Revised: 10 January 2018
/
Accepted: 12 January 2018
/
Published: 13 January 2018
Abstract
:Drastic urbanization has resulted in numerous problems worldwide, and many studies were devoted to individual cities. There is an urgent need to quantify urbanization patterns and illustrate their driving forces in the regional area on a large scale over a longer time period. This study produced a land cover dataset to characterize sequential urban land expansion in Northeast China from 1990 to 2015 using object-based backdating classification and calculating the expansion index. The drivers were investigated using Pearson correlation analysis and the multiple linear stepwise regression model. The results revealed that the total area of urban land increased by 43.15% from 1990 to 2015, mainly in the middle part of the study area, and especially in the coastal area of Liaoning. Liaoning had the fastest growth rate, while Heilongjiang showed a decrease in growth rate rankings. Urban land expanded northward and southward within Harbin City, towards the west and east within Changchun City, and relatively equally in all directions within Shenyang City. Expansion patterns changed from edge expansion (42%) to outlying expansion (47%). Urban land of Liaoning and the Eastern Inner Mongolia Autonomous region expanded with similar patterns as the entire area, but that of Heilongjiang grew in an opposite pattern, and Jilin maintained outlying major expansion. The influence of factors on urban land sprawl varied temporally. Tertiary industry product, gross domestic product, secondary industry product, total population and urban population were driving factors of urban land sprawl in Northeast China from 1990 to 2015. This research provides quantitative methods for better understanding urban land dynamics and devising feasible strategies for sustainable urban development.
1. Introduction
Humans have experienced dramatic urban sprawl [1]. Approximately 5% of global land has been converted to urban land, more than half of the world’s population lives in urban areas, and this number is expected to reach 66% by 2050 [2,3,4]. Notwithstanding the benefits of urbanization like economic growth, drastic urbanization has caused numerous environmental consequences including cropland occupation, urban heat island effects, and ecological degradation, and have jeopardized ecological and socioeconomic systems [5,6]. In other words, urban land cover information has become a useful indicator of the ecological environment and climatic effects over different spatiotemporal scales [7,8]. Therefore, characterizing urban land expansion pattern is a prerequisite for integrative urban planning and regional sustainability.
Remote sensing provides high-frequency earth observation data over spatiotemporal scales in a spatially explicit manner [9]. Combined with Geographical Information Systems (GIS), remote sensing has been widely adopted in the study of urbanization focusing on extracting urban land cover and quantifying their sprawl patterns [10]. Among the various remote sensing data, such as QuickBird [11], Synthetic Aperture Radar (SAR) [12,13], Moderate-resolution Imaging Spectroradiometer (MODIS) [14] and Defense Meteorological Satellite Program (DMSP) Operational Linescan System (OLS) nighttime light imagery [15,16], images with medium spatial resolution from Landsat images, which are easily accessed, have an appropriate spectral resolution and well-developed processing methods. These images are an important source of data for urban land extraction and their sprawl pattern quantification at relative large scales [17,18,19].
Over more than 30 years of reform and opening up, China has experienced unprecedented urban expansion and attracted widespread concerns, whose urbanization level were 17.9% in 1978, 26.4% in 1990, 36.2% in 2000, 49.9% in 2010 and 56.1% in 2015, respectively [10,20,21]. Previous studies illustrated the phenomenon of urbanization occurring all over China [8,22], the largest urban agglomerations [23,24], and zones with a long human history and a relatively high level of economic prosperity [25,26]. Conventionally, urban expansion patterns were revealed by analyzing the driving forces. The driving forces of urban land sprawl were divided into direct and potential factors. The direct factors included infrastructure construction, settlement expansion, and industry development [27,28], whereas technology, economy, population, policies, and natural factors belonged to potential factors [29,30,31]. Qualitative analysis of those driving forces was more frequently used because of difficulties of sequential statistics data collection [23]. However, the quantitative analysis of driving forces, which is more valid for scientific strategy proposals, has been insufficient.
Being the traditional industrial and grain base of the country, Northeast China was once the most highly developed region. However, in the 1990s, the region went through a remarkable economic recession after being confronted with tremendous challenges due to resource depletion, environmental pollution, and business reconstruction [10,32], resulting in urbanization falling behind that of the southern coastal cities. Then in 2003, the Revitalizing Old Industrial Base of Northeast China strategy proposed promoting the economic recovery of the region and initiated a new era of urban expansion in Northeast China [8,10]. By occupying quantities of farmland, the urban land in Northeast China expanded 2.37 times, which was the smallest expansion rate, other than Hong Kong, Macao, and Taiwan, based on Landsat images and data from the China-Brazil Earth Resources Satellite (CBERS) CCD and HJ-1 CCD [23]. Landsat images and the SLEUTH urban growth and land cover change model [33] indicated the highest level of landscape fragmentation and the largest loss of farmland with rapid urban expansion was occurring across the Shenyang metropolitan area. However, none of the previous studies explicitly separated urban land (direct land use information on urbanization [34]) from impervious surfaces for entire regions in Northeast China over a relatively long time period.
Therefore, based on Landsat images, this study addressed the need for urban land extraction and driving forces analysis from 1990 to 2015 in Northeast China through modifying object-based backdating classification, calculating the expansion index, and conducting statistical analyses. The objectives of this study were to: (1) create a medium-resolution (30 m) urban land cover dataset for Northeast China in four study periods: 1990, 2000, 2010, and 2015; (2) use the expansion index to characterize the urban land expansion patterns from the first phase to the third phase, 1990–2000, 2000–2010, and 2010–2015; and (3) quantify the influence of socioeconomic factors on urban land sprawl.
2. Materials and Methods
2.1. Study Area
Northeast China (Figure 1) is located between 38°and 54°N and 116° and 136°E, covering an area of 1.25 × 10⁶ km2 [34]. It is located in the eastern Eurasia continent, whose southern part is next to the Bohai Sea and the Yellow Sea of China. The area borders the Mongolian plateau in the west and the Siberian Plateau in the north. Northeast China also adjoins Russia in the north and northeast with boundaries being the Ergun River, Amur River, and Wusuli River. Mongolia is adjacent to the central west of the study area. Northeast China is separated from North Korea by the Tumen and Yalu Rivers. Located in the continental monsoon climate area, the summers are mild and humid and the winters are long and harsh. The mean annual temperature is 2.75–5.72 °C, with an average precipitation of 250–700 mm [35].
The area has fertile land, being one of three world-famous black soil belts, and is the main grain-producing area in China, so the area is vital for the country’s food security. However, many studies have demonstrated that urban land has encroached considerably on farmland [23,32], threatening agricultural productivity in China [36]. The 40 prefecture-level cities are governed within the study area. These cities were the basic units for the following driving forces analysis and are divided amongst the provinces as follows: 14 in Liaoning Provinces, nine in Jilin Provinces, 13 in Heilongjiang Provinces, and four in the Eastern Inner Mongolia Autonomous region. In 2015, the total population was 117.2 million people [37]. Since the initialization of the Northeast Old Industrial Base Strategy in 2003, urbanization in Northeast China has developed rapidly, resulting in excessive conversion of cultivated land for construction purposes, as well as other problems [38].
2.2. Data Sources and Preprocessing
The 422 cloud-free remote sensing images used in this study included Landsat Thematic Mapper (TM) imagery from 1990, 2000 and 2010 as well as Landsat Operational Land Imager (OLI) imagery from 2015. The images were acquired from the United States Geological Survey (USGS) Center (http://glovis.usgs.gov/), and were nominally processed as Level 1 terrain corrected. Landsat images have been widely used to investigate spatial changes in settlements [18,19,20,39]. To address inconsistencies among image datasets, Landsat TM images were geo-rectified against the Landsat OLI images, and then all images were projected onto the Albers equal-area conic coordinate system to accurately extract land cover area. A module in ENVI software [40], i.e., the FLAASH module was used for atmospheric corrections of Landsat images [41]. The point layers, including the center positions of cities, counties, towns and villages, and the polygon layers of different levels of administrative boundaries from the Resource Environmental Science Data Center of Chinese Academy of Sciences (http://www.resdc.cn) and National Earth System Science Data Sharing Infrastructure, National Science and the Technology Infrastructure of China (http://www.geodata.cn) were also used in this study.
In this study, ground surveys were conducted in Northeast China (Figure 1) from July to October 2015 using global positioning system (GPS) units, with location errors less than 10 m. These surveys resulted in 6803 points, covering all land cover types within the study area. The overall accuracy of the confusion matrix was used to assess the agreement between the results and the ground-truth [42]. The land resource maps, and river and road data from the National Earth System Science Data Sharing Infrastructure, National Science and Technology Infrastructure of China (http://www.geodata.cn), Advanced Spaceborne Theemal Emission and Reflection Radiometer Global Digital Elevation Model (ASTER GDEM V1) with 30 m spatial resolution acquired from the United States Geological Survey (USGS) Center (http://glovis.usgs.gov/), photos from Google Earth and the historic investigation points from local experts were used as auxiliary data to achieve accurate land cover classification.
The statistical data used for the quantitative analysis of factors affecting urban land sprawl was collected from statistical yearbooks of Heilongjiang, Jilin, Liaoning, and Eastern Inner Mongolia Autonomous region for 1991, 2001, 2011 and 2016. According to the correlation and accessibility for a long-term study, the nine selected statistical indicators for the 40 prefecture-level cities in the study area were: total population, urban population, gross domestic product, secondary industry product, tertiary industry product, per capita gross domestic product, floor space of buildings under construction in commercial house, per capita disposable income of urban permanent residents, and gross output value of construction industry.
2.3. Object-Based Backdating Classification and Urban Land Dynamics
2.3.1. Object-Based Backdating Classification
An backdating approach, as a synthesis of the post-classification comparison and pre-classification change detection, typically started with the reference map, based on which the classification and change analysis are conducted [43], which conducted classification only at locations with changes and maintained the consistency of the features with on changes [44,45]. In order to reduce the ‘salt and pepper’ effect [44], the backdating approach integrated with an object-based method was used for Land Use/Land Cover (LULC) classifications. Five major land cover types and other land were found within the study area: forest, grassland, wetlands, farmland, and settlements. With this modified approach applied in this study, the LULC maps from 1990 to 2015 were generated through the following two steps:
- Reference map production: The 2015 LULC map was derived from 2015 Landsat OLI imagery using an object-based classification approach by the eCognition Developer 8.64 software. The work flow involved segmenting images, using a bottom-up region merging method [46], rule-building, and exporting vectors. After a trial and error process for testing the segmentation parameters, three levels of objects were created by setting parameters for different scales, the shape factor, and compactness factor, as shown in Table 1. Then, a decision tree approach was used and the rule sets were created based on the statistical analysis of the training areas resulting from the field surveys and images, including spectral information, spatial relations, and geometric characteristics (Figure 2). Visual interpretation and manual editing were conducted to further confirm the classifications for a highly accurate reference LULC map. Accuracy assessment was conducted with the 6803 points from the ground survey data, with at least 80 samples for each category. The overall accuracy of the 2015 LULC map was 93%, and that for the settlements was 95%.
- LULC maps creation for other years: Using the 2015 LULC map as the reference map, the LULC classification maps for 1990, 2000, and 2010 were derived separately using an object-based backdating approach with change vector analysis [44,45]. More details about the classification approach can be found in previous studies [44,45]. Accuracy assessment was also completed for the LULC classification maps in 1990, 2000, and 2010 using historical field survey points and Google Earth images, as well as visual interpretation of the Landsat TM data as reference data. The overall accuracies of these three classification maps were 86% for 1990, 86% for 2000, and 88% for 2010, and that of settlements in the three years were 90%, 91% and 93%, respectively.
2.3.2. Selection of Urban Land Patches
As no international agreement exists on how to define urban land [52,53], urban land in this research was defined as spatially continuous artificial areas in non-village areas, and where the local government office was typically located in Northeast China. Specifically, urban land was extracted in two steps [45]: (1) The class objects “settlements” were selected from the LULC maps as potential urban land; (2) The urban land for 1990, 2000, 2010 and 2015 were separated from villages using the vector layer of points of cities, counties, towns and villages.
2.3.3. Calculation of Growth Rate
The area (km2/year) of the annual growth rate of urban land (AGR) and the proportion (%) of the growth rate of urban land (GR) were used to quantify the expansion speed of urban land for over two decades. Temporal patterns of urban land expansion for each province and for the whole study area were reflected by AGR. To compare the provinces, GR was calculated. The two indexes are defined as follows:
where Send (km2) and Sstart (km2) are the area of urban land at the end and start of the period, respectively, and n (years) is the duration between the start and end time.
2.3.4. The Expansion Index
The Expansion Index (E), according to previous studies [10,54], was chosen to quantitatively identify the three main urban land expansion types: infilling, edge-expansion, and outlying. A newly grown patch spreading as the gap or hole between old patches or within an old patch was defined as a infilling one, while that growing unidirectionally in more or less parallel strips from an edge was an edge-expansion patch, and it would be referred to an outlying type when the newly grown patch was found isolated from the old [55]. The E was acquired using the Analysis Tools of ArcGIS software as follows:
where Pnew (km) is the perimeter of a newly developed urban land patch, and Lcom (km) is the length of common edge of this expansion patch and an existing urban land patch or patches. This patch is identified as infilling expansion when E > 0.5, edge expansion when 0 < E ≤ 0.5, and outlying expansion when E = 0.
2.4. Statistical Analysis
2.4.1. Pearson Correlation Coefficient
The Pearson correlation coefficient (rxy) for the nine factors and urban land of each prefecture-level city in Northeast China was calculated to assess their relationship. The two variables are considered positively correlated when rxy was larger than 0, and vice versa. rxy is widely used to the measure of the linear correlation and the average response of a whole sample [53]. rxy was calculated using R 3.2.2 software with the p-value from the t-test as follows:
where i ranges from 1 to 40 in the study area; n is the total number of cities (i.e., 40 in this study); xi is the statistics factor of city i; yi is the built-up land area of the city i; and and are the mean statistical factor and urban land area of the cities, respectively. rxy is regarded to be significantly different and credible when the p-value is below 0.05.
2.4.2. Multiple Linear Stepwise Regression
Multiple linear stepwise regression is a method of fitting regression models in which the choice of predictive variables is automatically performed, and each of the variable’s performance or its contribution to the overall model can be easily determined [56]. In the R 3.2.2 software, a sequence of F-tests and t-tests are performed, with adjusted R2 (the increasing sample number increased the value of R2) and backward elimination. Backward elimination involves starting with all candidate variables, testing the deletion of each variable using the Akaike information criterion, deleting the variable whose loss results in the most statistically insignificant deterioration of the model fit, and repeating this process until no further variables can be deleted without a statistically significant loss of fit. To eliminate the effect of factor dimension and magnitude, significantly related statistics factors and the area of urban land in each year were normalized [52] as follows:
where x*ik is the normalized value of the related statistical factor k or the area of urban land in the city i, between 0 to 1; xik is the original value of the related statistics factor k or the area of urban land in the city i; min(xk) is the minimum value of factor k or the area of urban land of the 40 cities in each year; and max(xk) is the maximum value of factor k or the area of urban land of the 40 cities in each year.
After the normalization, multiple linear stepwise regression was acquired using R 3.2.2 software as follows:
where Y* is the normalized value of the area of urban land; x*k is the normalized value of automatically-chosen factors k with minimum value of AIC; αk is the coefficient of factors k, theoretically speaking, the larger absolute value of αk meaning the more contribution to the regression model, and plus and minus value indicating positive and negative contribution, respectively; β is intercept; αk and β are accepted to be significant and credible when the p-value of the t-test is below 0.05; The regression model is accepted to be significant and credible when the p-value of the F-test is below 0.05, and larger value of adjusted R2 meaning a better model fit.
3. Results
3.1. Area Changes of Urban Land
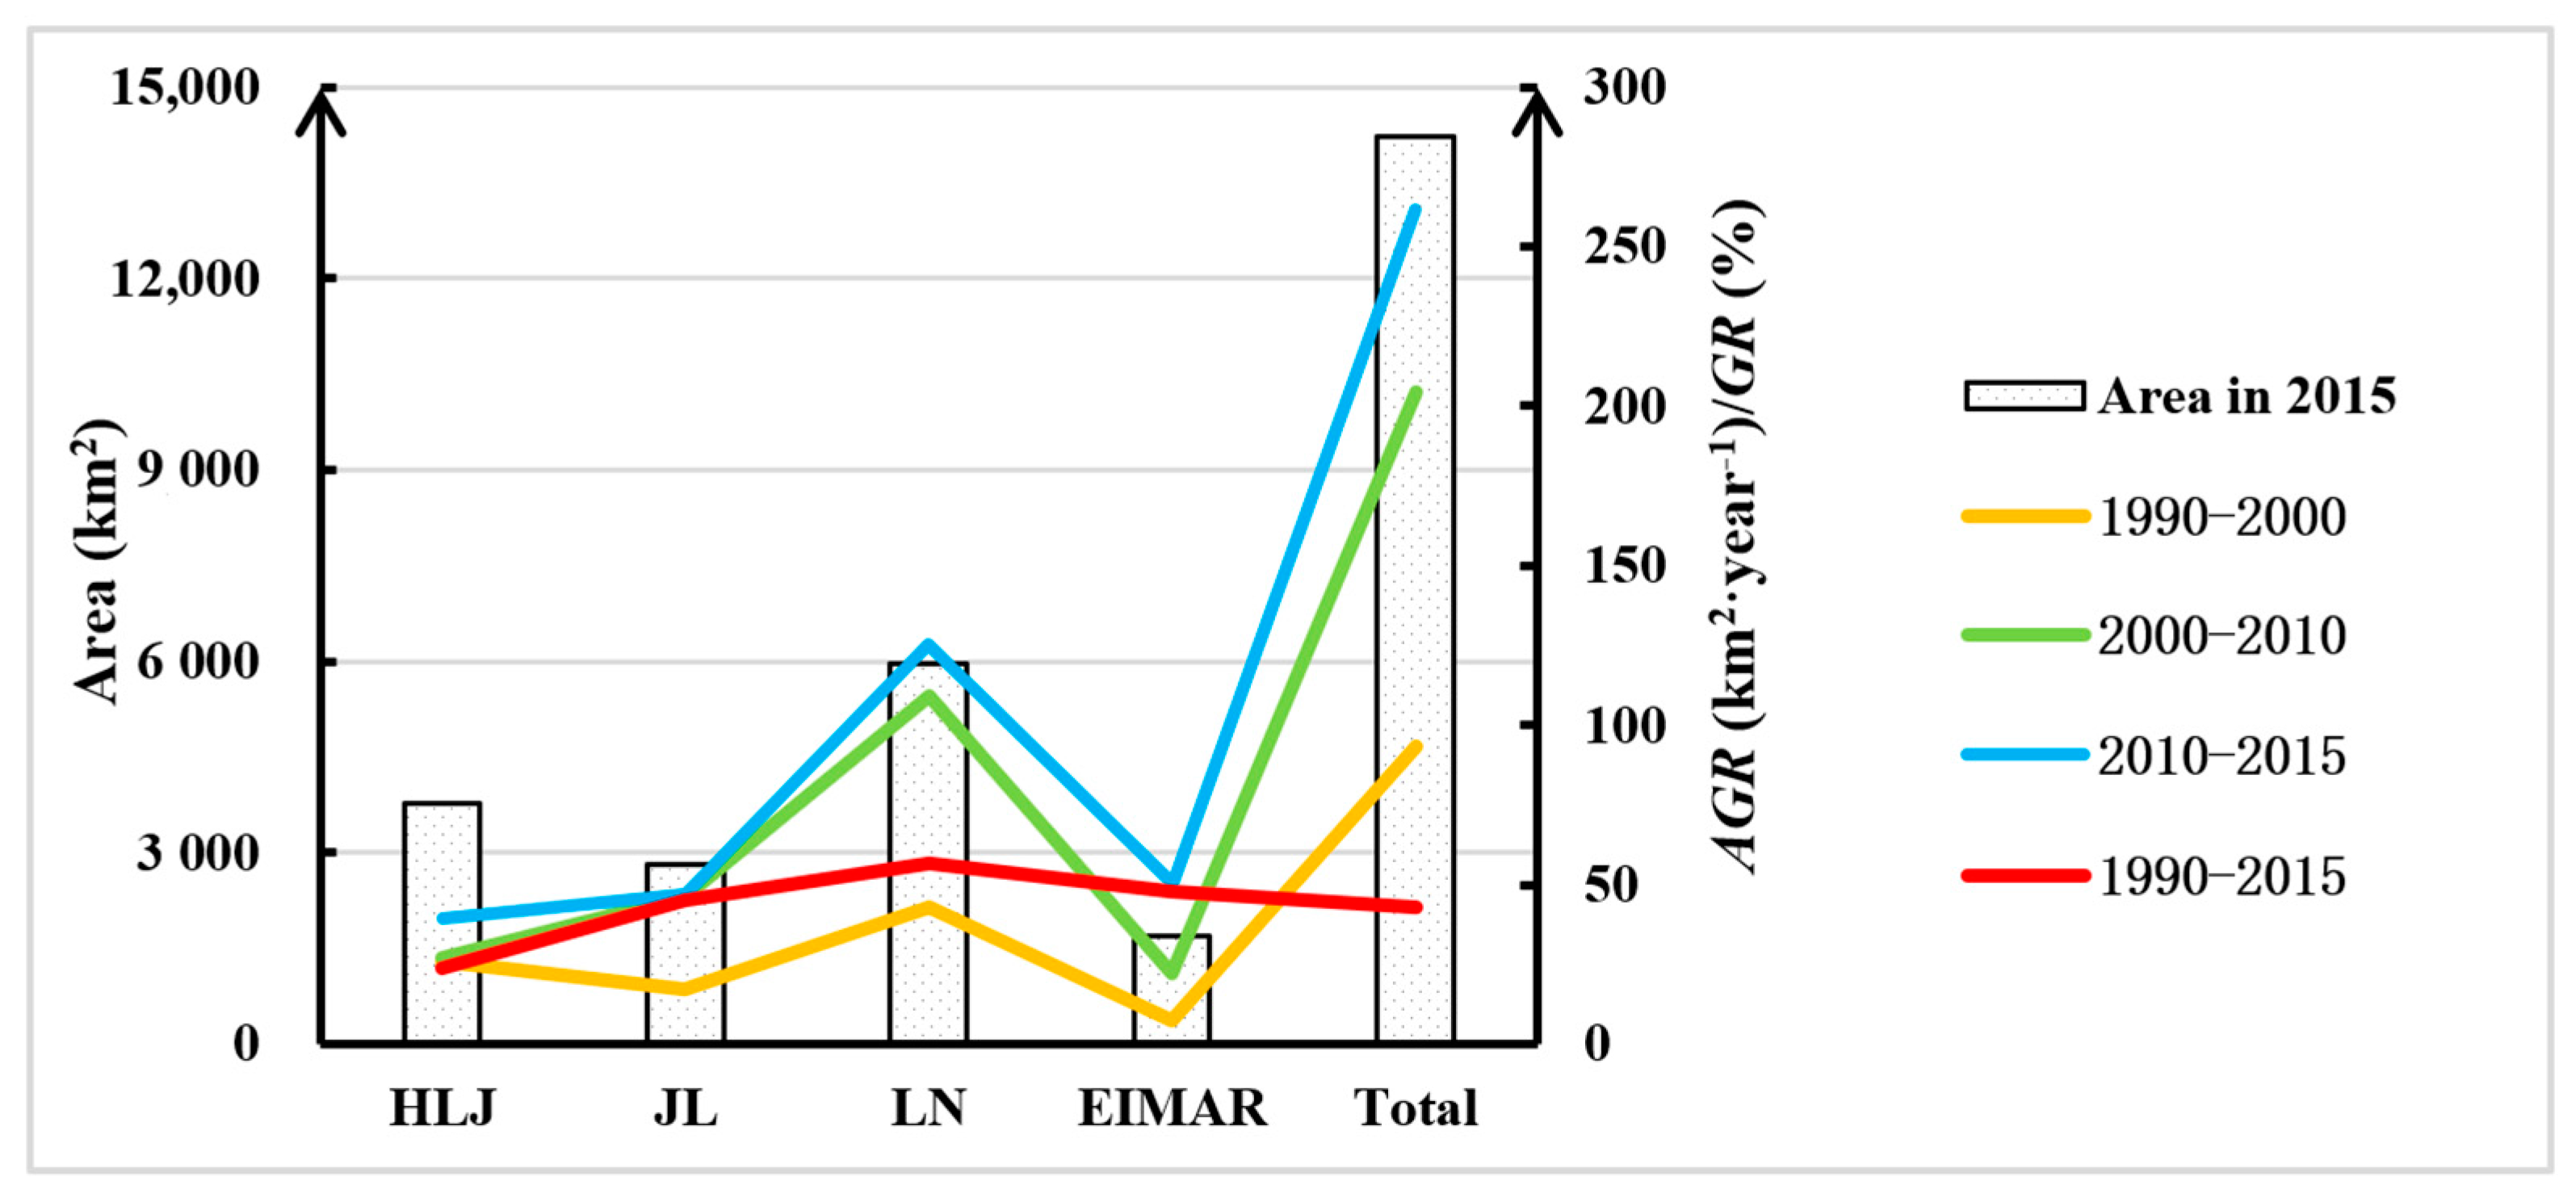
In 2015, the urban land area was 1.14% of the total study area, and the percentages for Liaoning, Jilin, Heilongjiang, and Eastern Inner Mongolia Autonomous region were 4.08%, 1.47%, 0.79% and 0.37%, respectively. Shenyang City, Dalian City, Changchun City, Harbin City, and Hulun Buir City were the top five cities with the most urban land holdings. The urban land patches were mainly found in the middle part of the study area and Liaoning, especially in coastal areas.
The annual growth rate of urban land increased from the first phase to the third phase (Figure 3). Specifically, Liaoning always had the highest annual growth rate for each phase. The rank of Heilongjiang in terms of annual growth rate among the four regions dropped from second to fourth from the first phase to the third phase. However, Eastern Inner Mongolia Autonomous region showed strong growth momentum in more recent years. For Jilin, the growth of urban land was maintained at an average level. From 1990 to 2015, the urban land of Heilongjiang grew the slowest with a 23.78% growth rate, which was the only region below the average level of 43.15%. The grown rate of Liaoning increased fastest, with 56.41%, followed by Eastern Inner Mongolia Autonomous region and Jilin. The urban land sprawl was obvious in the three capital cities: Harbin, Changchun, and Shenyang (Figure 4). Urban land expanded northward and southward for Harbin City, whereas urban land within Changchun City sprawled west and east. Meanwhile, urban land within Shenyang City developed relatively equally in all directions.
3.2. Urban Land Expansion Types
Urban land expansion patterns varied in time and space from the first phase to the third phase in Northeast China (Figure 5). In general, although urban land patches with edge expansion decreased, this was the main type of expansion following outlying expansion. After the first phase, 1990 to 2000, outlying expansion replaced edge expansion and became the main urban expansion type in the study area, though the percentage of outlying expansion slightly decreased due to little growth in infilling patches. Expansion patterns of the four regions in the study area were quite different. In the first phase, the main expansion type for urban land in Heilongjiang and Jilin was outlying expansion, while that for Liaoning was edge expansion, and the three expansion types were relatively equal in Eastern Inner Mongolia Autonomous region. In the second phase, the main type in all four regions was outlying expansion followed by edge-expansion, and infilling. In the last phase, three regions were dominated by outlying expansion, which was quite similar within the last decade, except for Heilongjiang, which was dominated by edge expansion. Compared to other provinces, the urban expansion pattern in Jilin was relatively stable, whereas that in Heilongjiang changed the most.
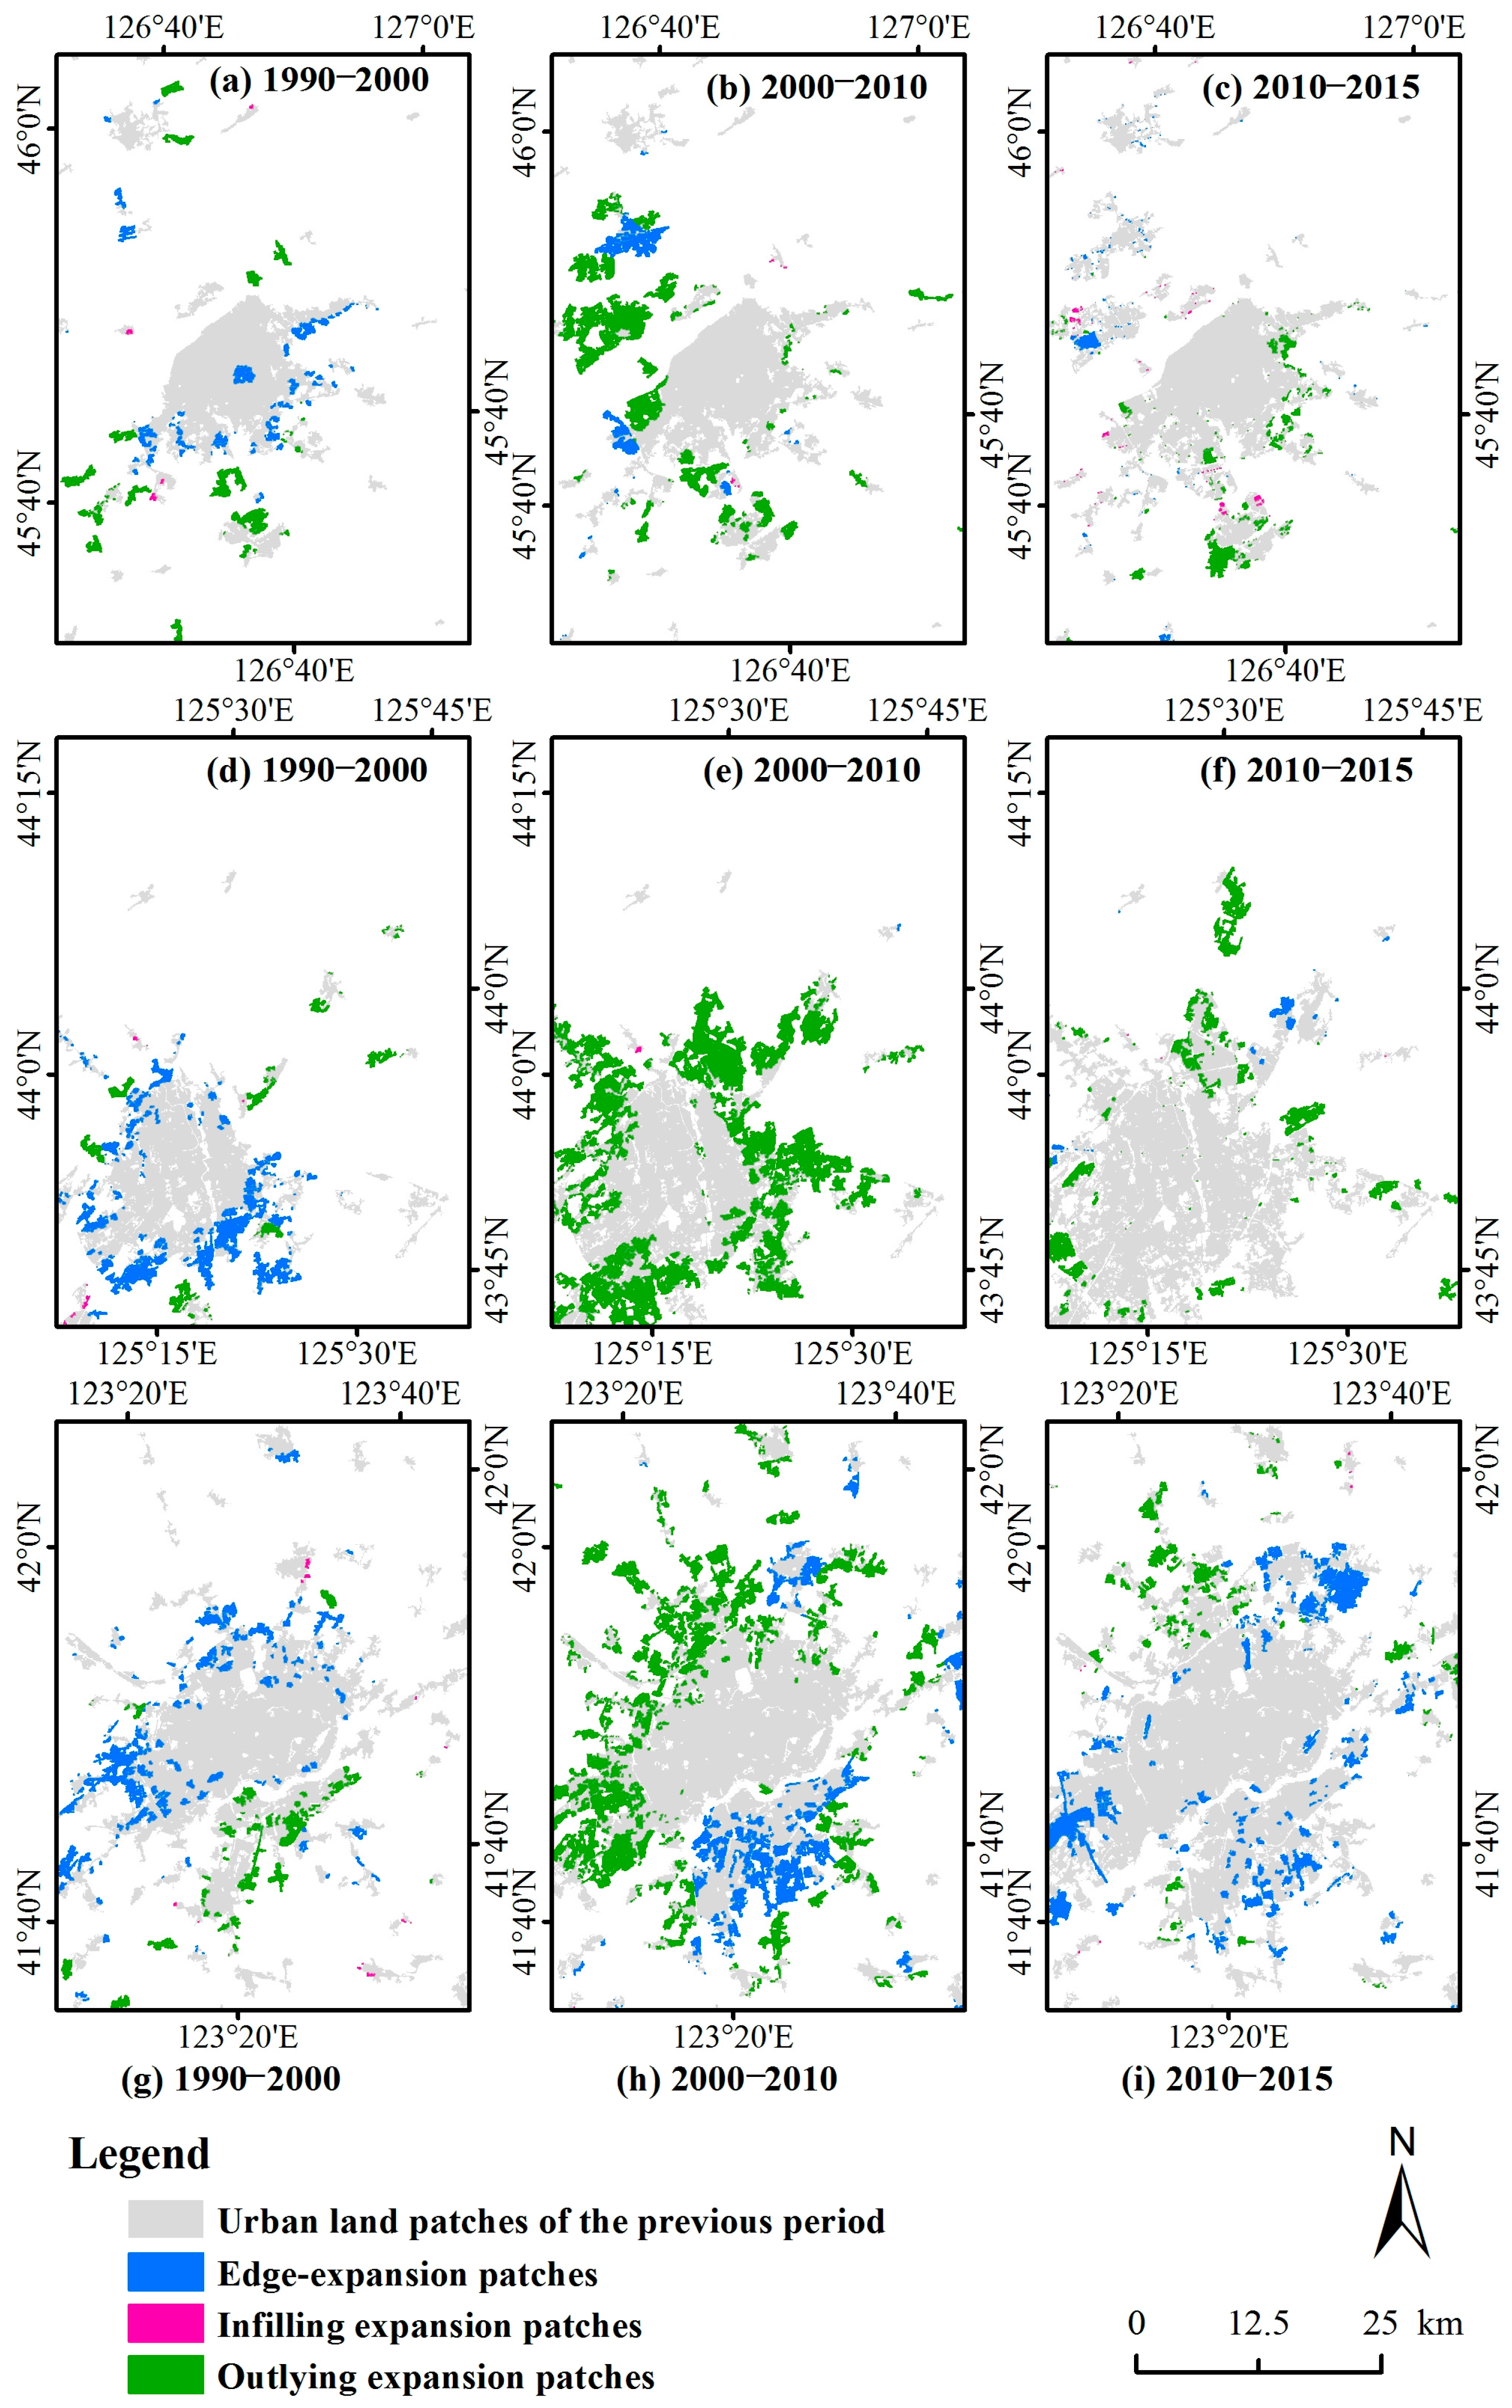
To acquire more detailed dynamics information on the urban land expansion patterns in Northeast China, typical urban land sprawl patterns within three capital cities were extracted (Figure 6). The sprawl patterns of typical urban land within Harbin City were similar to the sprawl patterns of urban land in the entire Heilongjiang during the study period, except for the third phase (Figure 6a–c). Typical urban land within Harbin City experienced major outlying expansion. From 1990 to 2000, edge expansion and outlying were the major types of urban land expansion, mainly located in south part of the typical urban land within Harbin City. In the following phase, typical urban land within Harbin City experienced quick growth, and outlying expansion was the dominant type, concentrated in the west. For 2010 to 2015, urban land expansion slowed, and outlying expansion was still dominant type, distributed in the south. For Changchun City, the expansion pattern of the typical urban land aligned with the overall expansion patterns of urban land observed in the entire Jilin during the study period, except for the first phase (Figure 6d–f). In the first decade, edge expansion was dominant, mainly located in the south part. For 2000–2010, typical urban land increased considerably through the outlying major type, concentrated in the west and east. For 2010 to 2015, urban land expansion also decreased and outlying was still the main expansion type distributed in the west and east. However, the expansion patterns of the typical urban land within Shenyang City were different from those of urban land in the entire Liaoning during the study period, except for the second phase (Figure 6g–i). At first, edge-expansion and outlying were the main expansion types, mainly located in the northern and southern urban areas within Shenyang City, respectively. Then, the typical urban land also quickly increased, and outlying was the main expansion type, concentrated in the north. Finally, urban land expanded with the edge-expansion-major type and was distributed in the middle to northern part of the city. Overall, typical urban land sprawl within the three capital cities all clearly increased from 2000 to 2010 following the same major outlying expansion pattern.
3.3. Urban Land Expansion with Socioeconomic Development
Based on the correlation analysis of 160 samples of 40 cities for four periods, Table 2 shows the r between the value of each statistic index and the area of urban land, as well as credibility of the r value. All nine indexes had a strongly significant positive relationship with the area of urban land for all r above 0 and their p-values were all above 0.01. Compared to the other indexes, per capita disposable income of permanent urban residents and per capita gross domestic product lacked a close correlation with the urban land area, as their r were both below 0.5. However, for r values below 0.75, tertiary industry product, gross domestic product, secondary industry product, and total population were strongly associated with the urban land area.
According to the p-value of the formula and the adjusted R2 (Table 3), the five multiple linear stepwise regression models were all strongly significant and credible. Generally speaking, total population, urban population, gross domestic product, secondary industry product, and tertiary industry product were the automatically chosen factors for urban land expansion in Northeast China from 1990 to 2015, which was consistent with above correlation analysis. Based on the correlation coefficients of the factors and their p-values, urban land sprawl was most positively influenced by secondary industry product, followed by tertiary industry product, total population, and urban population. Although gross domestic product was one of the factors, its effect on urban land sprawl was uncertain, as its p-value of the coefficients was below 0.05.
The factors influencing urban land sprawl in Northeast China varied over time. In 1990, urban population, gross domestic product, secondary industry product, per capita gross domestic product, per capita disposable income of permanent urban residents, and gross output value of construction industry were the automatically chosen factors. Urban land sprawl was most positively influenced by gross domestic product, followed by gross output value of construction industry, and three other factors negatively influenced urban land sprawl: secondary industry product, per capita gross domestic product, and urban population. Similarly, the effect of per capita disposable income of urban permanent residents on urban land expansion was unknown. In 2000, the influence of total population was uncertain, the floor space of buildings under construction in commercial houses had a positive impact, and gross output value of construction industry had a positive influence. In 2010, gross output value of construction industry had a mainly negative influence, followed by three factors, tertiary industry product, total population, and secondary industry product that had a positive influence. Meanwhile, although urban population was one of the factors, its effect on urban land expansion, either positive or negative, was unclear. For 2015, gross domestic product, secondary industry product, tertiary industry product, floor space of buildings under construction in commercial house, and gross output value of construction industry were driving forces. Urban land expansion was most positively influenced by gross domestic product, followed by being negatively influenced by secondary industry product. The effect of the other three factors on urban land expansion remained unclear.
All nine indexes were involved in at least one model, which was consistent with the significant correlation analysis results, and the effect of per capita disposable income of urban permanent residents on urban land expansion remained unclear based on the p-value of its coefficient in the five models. Secondary industry product and gross output value of construction industry were the most common indexes chosen as driving forces in four models, whereas per capita gross domestic product and per capita disposable income of urban permanent residents were used at least for one model. In addition, the effects of gross domestic product and total population on urban land sprawl were all positive and relatively stable compared to the other indexes.
4. Discussion
4.1. Spatiotemporal Characteristics of Urban Expansion
Northeast China experienced unique urban expansion from 1990 to 2015. In spite of the difficulties and inconsistencies in the definition of urban for comparisons between studies, the change tendency of urban land was similar. Urban land area increased faster in 2000–2010 than in 1990–2000, and the spatial distribution of urban land expansion in Harbin, Changchun, and Shenyang cities was quite similar in this study. However, the growth rate and urban land patches in a prior study were 38.87 km2/year for 1990–2000 and 62.10 km2/year for 2000–2010, which were different from those in this study, because they defined urban land as the land used for residential, commercial, industrial, recreational, and transportation in cities and towns. The type of urban land was less than this paper, and they considered Northeast China as the zone covering Jilin, Heilongjiang, and Liaoning without Eastern Inner Mongolia Autonomous region [8]. The built-up area was mainly located in the western parts of Northeast China (not including Eastern Inner Mongolia Autonomous region), and especially in Liaoning and western Jilin. Northeast China had the highest urban land sprawl increase in the previous decade from 2010 to 2013, from 1.10%/year to 2.82%/year [38].
Furthermore, the characteristics of urban land sprawl varied in cities and regions across Northeast China from 1990 to 2015, which was also recognized by prior studies despite some differences in the details. In this study, the urban land of the three capital cities in Northeast China all expanded faster in 2000–2010 than in 1990–2000. The fastest urban expansion occurred in Shenyang, at 17.7 km2/year in 1990–2000 and 28.9 km2/year in 2000–2010, where the slowest expansion was in Harbin, at 11.7 km2/year for 1990–2000 and 12.5 km2/year in 2000–2010 [10]. The types of urban expansion in the prior study were different from this paper given the difference in the definition of urban land and the unequal spatial boundaries of the three capital cities [10]. The prior study discovered that the edge expansion was the dominant growth type for all cities, followed by the outlying and infilling modes, from 1990 to 2015, which is not in line with the results in Section 3.2. A different prior study determined that urbanization developed more southward than any other direction between 1990 and 2005, since the Changchun government created several development zones in the southern part of the city [57], which is consistent with findings in this research.
From the above comparison, the spatiotemporal characteristics of urban expansion found in this paper appear to be credible. A number of studies focused on the detailed spatial dynamics of urban land sprawl in typical cities in Northeast China or roughly analyzed all of China, obtaining various results for different definitions and study periods. Therefore, we investigated both the entire region as well as typical cities, including analyzing the driving forces based on 40 cities in Northeast China. The results are meaningful for creating new understanding about the urbanization in Northeast China.
4.2. Driving Forces of Urban Expansion
Although all nine indexes had strongly significant positive relationships with urban land area, some driving factors showed negative influences in the regression models. In 1990, GOVCI was positively related with urban land expansion, whereas SIP, including GOVCI and gross output value of industry, had a negative impact, indicating that the initial industrial development hindered urban land construction. In addition, the agricultural population was the strongest inhibitor of urban land sprawl for UP and GDP were positive factors whereas PCGDP was negative. In 2010, the construction industry in the study area focused on non-urban land development according to the passive impact of GOVCI. As for 2015, TIP was passively related, which implied that urban land expansion was subjected to GDP growth, and tertiary industry development strategies for urbanization in the study area were supposed to be adjusted.
Commonly, driving forces analysis is conducted using one of two main methods: qualitative or quantitative, based on two types of factors: spatial data or social-economic statistical data. Population and economic conditions reflected by social-economic statistical data may not directly influence urban expansion; instead, other factors like policies, topography, hydrology, influence of neighboring cities, especially satellite cities surrounding the metropolis, and land availability, are important factors but are difficult to quantify [8,58]. Additionally, explicit spatial data are suitable for the local area at small scale like individual cities, whereas social-economic statistical data like population, income, and investment, are more applicable for regional and global studies [45].
In this research, the influence of socioeconomic factors were quantified, whereas the effects of the factors on urban expansion patterns were briefly discussed in previous studies [10,58,59]. The results of the impacts of non-agriculture population and GDP, determined by the Pearson correlation coefficients, were similar with the results of a former study [8], whereas the influence and their dynamics were outlined in further detailed in this study. A prior study demonstrated that urban expansion was closely associated with urban planning, economic development due to the Revitalizing Old Industrial Base of the Northeast China policy, natural barriers, and limitations imposed by the Songhua River in the three capital cities in Northeast China from 1980 to 2010 [10].
4.3. Limitations and Future Work
To avoid gaps in the information about the fine-scale changes in urban land, high spatial resolution imagery, like IKONOS and QuickBird, with rich spatial information for identification of different types of settlements, and hyperspectral data that has the potential to derive detailed information about the nature and properties of different surface materials on the ground, could be used as reference data for accuracy assessment in future work [13,60,61]. In this study, sequential medium resolution (30 m) land cover maps of Northeast China were created, and a deeper analysis of the relationship between urban expansion and farmland decrease or non-urban land dynamics would be warranted to better understand the characteristics and effects of urban land sprawl. Moreover, direct causes, policies, urban planning, and natural barriers of urbanization were supposed to be further investigated [8]. Spatial factors, like distance to city center, rivers, farmland and roads, should be chosen as factors in driving forces analysis. As they are more persuasive and explicit in space than spatial statistics, Moran’s I, geographical weighted regression models, and Geodetector have been used in the quantitative analysis of driving forces [62,63,64].
5. Conclusions
A medium-resolution land cover dataset was produced in this study to characterize sequential urban development in Northeast China from 1990 to 2015. This dataset has proven to be valuable for quantifying spatiotemporal urban land expansion patterns with the help of an expansion index. Based on statistical analysis, additional details were revealed about the spatiotemporal influence of socioeconomic factors on urban land sprawl. Based on this urban land cover dataset, the applications of the spatial and driving forces analyses showed variation in urban development processes across the three capital cities and four regions in Northeast China.
This study had several findings. Constant increases in urban land growth rate were observed in Northeast China from 1990 to 2015, mainly concentrated in the middle part of the study area as well as Liaoning, especially in its coastal areas. The expansion patterns transitioned from edge-expansion-major to outlying-major. Specifically, Liaoning had the fastest growth rate with expansion patterns similar to that of the entire study area, and Jilin maintained an average increase with an outlying-major pattern, whereas the growth rank of Heilongjiang among four regions dropped with expansion patterns opposite to that of the entire study area. Eastern Inner Mongolia Autonomous region showed strong growth momentum in the later years, with expansion patterns similar to that of the entire study area. Furthermore, urban land expanded northward and southward with an outlying-major pattern within Harbin City, west and east with expansion patterns transitioning from the edge-expansion-major to outlying-major within Changchun City, and relatively equally in all directions with expansion patterns transitioning from the edge-expansion-major or outlying-major within Shenyang City. Tertiary industry product, gross domestic product, secondary industry product, and total population were strongly positively associated with urban land area. The above four indexes together with urban population were the driving forces of urban land sprawl in Northeast China from 1990 to 2015.
With the acceleration of urban expansion in the 21st century, managing the trade-offs between urban expansion and environmental protection will be a considerable challenge for local governments in Northeast China. The results of this study will be valuable to local governments when planning sustainable land use and urban development.
Acknowledgments
This study was supported by the National Natural Science Foundation of China (No. 41471148) and the Strategic Planning Project of the Institute of Northeast Geography and Agroecology (IGA), Chinese Academy of Sciences (No. Y6H2091001). The authors are grateful to the USGS and the Remote Sensing Data Sharing Center of China for providing Landsat data, and the colleagues who participated in the field surveys and data collection. Acknowledgments for the data support from ‘Resource Environmental Science Data Center of Chinese Academy of Sciences (http://www.resdc.cn)’ and ‘National Earth System Science Data Sharing Infrastructure, National Science & Technology Infrastructure of China (http://www.geodata.cn)’.
Author Contributions
Lin Chen, Chunying Ren, and Bai Zhang designed this research. Lin Chen and Mingyue Liu conducted the analysis. Lin Chen, Chunying Ren, and Zongming Wang wrote the paper.
Conflicts of Interest
The authors declare no conflict of interest.
References
- Kii, M.; Nakamura, K. Development of a suitability model for estimation of global urban land cover. Transp. Res. Procedia 2017, 25, 3165–3177. [Google Scholar] [CrossRef]
- Lutz, W.; Sanderson, W.; Scherbov, S. The end of world population growth. Nature 2001, 412, 543–545. [Google Scholar] [CrossRef] [PubMed]
- Seto, K.C.; Fragkias, M.; Gueneralp, B.; Reilly, M.K. A meta-analysis of global urban land expansion. PLoS ONE 2011, 6, e23777. [Google Scholar] [CrossRef] [PubMed]
- Schneider, A. Monitoring land cover change in urban and pen-urban areas using dense time stacks of Landsat satellite data and a data mining approach. Remote Sens. Environ. 2012, 124, 689–704. [Google Scholar] [CrossRef]
- He, C.Y.; Liu, Z.F.; Tian, J.; Ma, Q. Urban expansion dynamics and natural habitat loss in China: A multiscale landscape perspective. Glob. Chang. Biol. 2014, 20, 2886–2902. [Google Scholar] [CrossRef] [PubMed]
- Nassauer, J.I.; Raskin, J. Urban vacancy and land use legacies: A frontier for urban ecological research, design, and planning. Landsc. Urban Plan. 2014, 125, 245–253. [Google Scholar] [CrossRef]
- Reza, A.; Weng, Q.H.; Abbas, A.; Seyed, K.A. Spatial-temporal dynamics of land surface temperature in relation to fractional vegetation cover and land use/cover in the Tabriz urban area. Remote Sens. Environ. 2009, 113, 2606–2617. [Google Scholar]
- Kuang, W.H.; Liu, J.Y.; Zhang, Z.X.; Liu, D.S.; Xiang, B. Spatiotemporal dynamics of impervious surface areas across China during the early 21st century. Chin. Sci. Bull. 2013, 58, 1691–1701. [Google Scholar] [CrossRef]
- Lu, D.S.; Li, G.Y.; Kuang, W.H.; Moran, E. Methods to extract impervious surface areas from satellite images. Int. J. Digit. Earth 2014, 7, 93–112. [Google Scholar] [CrossRef]
- Sun, Y.; Zhao, S.Q.; Qu, W.Y. Quantifying spatiotemporal patterns of urban expansion in three capital cities in Northeast China over the past three decades using satellite data sets. Environ. Earth Sci. 2015, 73, 7221–7235. [Google Scholar] [CrossRef]
- Sugg, Z.P.; Finke, T.; Goodrich, D.C.; Moran, M.S.; Yool, S.R. Mapping impervious surfaces using object-oriented classification in a semiarid urban region. Photogramm. Eng. Remote Sens. 2014, 80, 343–352. [Google Scholar] [CrossRef]
- Qin, Y.W.; Xiao, X.M.; Dong, J.W.; Chen, B.Q.; Liu, F.; Zhang, G.L.; Zhang, Y.; Wang, J.; Wu, X.C. Quantifying annual changes in built-up area in complex urban-rural landscapes from analyses of PALSAR and Landsat images. ISPRS J. Photogramm. Remote Sens. 2017, 124, 89–105. [Google Scholar] [CrossRef]
- Xu, R.; Zhang, H.S.; Lin, H. Urban impervious surfaces estimation from optical and SAR Imagery: A comprehensive comparison. IEEE J. Sel. Top. Appl. Earth Obs. Remote Sens. 2017, 10, 4010–4021. [Google Scholar] [CrossRef]
- Zhang, L.; Weng, Q.H.; Shao, Z.F. An evaluation of monthly impervious surface dynamics by fusing Landsat and MODIS time series in the Pearl River Delta, China, from 2000 to 2015. Remote Sens. Environ. 2017, 201, 99–114. [Google Scholar] [CrossRef]
- Liu, Y.X.Y.; Yang, Y.P.; Jing, W.L.; Yao, L.; Yue, X.F.; Zhao, X.D. A new urban index for expressing inner-city patterns based on MODIS LST and EVI regulated DMSP/OLS NTL. Remote Sens. 2017, 9, 777. [Google Scholar] [CrossRef]
- Cai, D.L.; Fraedrich, K.; Guan, Y.N.; Guo, S.; Zhang, C.Y. Urbanization and the thermal environment of Chinese and US-American cities. Sci. Total Environ. 2017, 589, 200–211. [Google Scholar] [CrossRef] [PubMed]
- Deng, C.B.; Wu, C.S. A spatially adaptive spectral mixture analysis for mapping subpixel urban impervious surface distribution. Remote Sens. Environ. 2013, 133, 62–70. [Google Scholar] [CrossRef]
- Pan, T.; Lu, D.S.; Zhang, C.; Chen, X.; Shao, H.; Kuang, W.H.; Chi, W.F.; Liu, Z.J.; Du, G.M.; Cao, L.Z. Urban land-cover dynamics in arid China based on high-resolution urban land mapping products. Remote Sens. 2017, 9, 730. [Google Scholar] [CrossRef]
- Jia, Y.Q.; Tang, L.N.; Wang, L. Influence of ecological factors on estimation of impervious surface area using Landsat 8 imagery. Remote Sens. 2017, 9, 751. [Google Scholar] [CrossRef]
- Huang, L.; Yan, L.J.; Wu, J.G. Assessing urban sustainability of Chinese megacities: 35 years after the economic reform and open-door policy. Landsc. Urban Plan. 2016, 14, 57–70. [Google Scholar] [CrossRef]
- Gu, C.L.; Hu, L.Q.; Ian, G.C. China’s urbanization in 1949–2015: Processes and driving forces. Chin. Geogr. Sci. 2017, 27, 847–859. [Google Scholar] [CrossRef]
- Zhang, Z.X.; Wen, Q.K.; Liu, F.; Zhao, X.L.; Liu, B.; Xu, J.Y.; Yi, L.; Hu, S.G.; Wang, X.; Zuo, L.J.; et al. Urban expansion in china and its effect on cultivated land before and after initiating ‘Reform and Open Policy’. Sci. China Earth Sci. 2016, 59, 1930–1945. [Google Scholar] [CrossRef]
- Hu, Y.N.; Peng, J.; Liu, Y.X.; Du, Y.Y.; Li, H.L.; Wu, J.S. Mapping development pattern in Beijing-Tianjin-Hebei urban agglomeration using DMSP/OLS nighttime light data. Remote Sens. 2017, 9, 760. [Google Scholar] [CrossRef]
- Ou, J.P.; Liu, X.P.; Li, X.; Chen, Y.M.; Li, J. Quantifying spatiotemporal dynamics of urban growth modes in metropolitan cities of China: Beijing, Shanghai, Tianjin, and Guangzhou. J. Urban Plan. Dev. 2017, 143, 04016023. [Google Scholar] [CrossRef]
- Shen, G.R.; Abdould, N.; Zhu, Y.; Wang, Z.J.; Gong, J.H. Remote sensing of urban growth and landscape pattern changes in response to the expansion of Chongming Island in Shanghai, China. Geocarto Int. 2017, 32, 488–502. [Google Scholar] [CrossRef]
- Zhang, L.; Wei, Y.H.D.; Meng, R. Spatiotemporal dynamics and spatial determinants of urban growth in Suzhou, China. Sustainability 2017, 9, 393. [Google Scholar] [CrossRef]
- Fan, F.L.; Fan, W. Understanding spatial-temporal urban expansion pattern (1990–2009) using impervious surface data and landscape indexes: A case study in Guangzhou (China). J. Appl. Remote Sens. 2014, 8, 083609. [Google Scholar] [CrossRef]
- Zhang, Z.M.; He, G.J.; Wang, M.M.; Wang, Z.H.; Long, T.F.; Peng, Y. Detecting decadal land cover changes in mining regions based on satellit remotely sensed imagery: A case study of the stone mining area in Luoyuan County, SE China. Photogramm. Eng. Remote Sens. 2015, 81, 745–751. [Google Scholar] [CrossRef]
- Lin, J.Y.; Liu, X.P.; Li, K.; Li, X. A maximum entropy method to extract urban land by combining MODIS reflectance, MODIS NDVI, and DMSP-OLS data. Int. J. Remote Sens. 2014, 35, 6708–6727. [Google Scholar] [CrossRef]
- Hu, Y.H.; Jia, G.S.; Pohl, C.; Feng, Q.; He, Y.T.; Gao, H.; Xu, R.H.; Van, G.J.; Feng, J.M. Improved monitoring of urbanization processes in China for regional climate impact assessment. Environ. Earth Sci. 2015, 73, 8387–8404. [Google Scholar] [CrossRef]
- Yang, Y.Y.; Zhang, S.W.; Yang, J.C.; Xing, X.S.; Wang, D.Y. Using a cellular automata-markov model to reconstruct spatial land-use patterns in Zhenlai County, Northeast China. Energies 2015, 8, 3882–3902. [Google Scholar] [CrossRef]
- Li, B.; Tong, L.J. Vulnerability and sustainable development mode of coal cities in Northeast China. Chin. Geogr. Sci. 2008, 18, 119–126. [Google Scholar]
- Xia, F.M.; He, H.S.; Clarkec, K.C.; Hu, Y.M.; Wu, X.Q.; Liu, M.; Shi, T.; Geng, Y.; Gao, C. The potential impacts of sprawl on farmland in Northeast China-evaluating a new strategy for rural development. Landsc. Urban Plan. 2012, 104, 34–46. [Google Scholar] [CrossRef]
- Kuang, W.H.; Liu, J.Y.; Dong, J.W.; Chi, W.F.; Zhang, C. The rapid and massive urban and industrial land expansions in China between 1990 and 2010: A CLUD-based analysis of their trajectories, patterns, and drivers. Landsc. Urban Plan. 2016, 145, 21–33. [Google Scholar] [CrossRef]
- Man, W.D.; Wang, Z.M.; Liu, M.Y.; Lu, C.Y.; Jia, M.M.; Mao, D.H.; Ren, C.Y. Spatio-temporal dynamics analysis of cropland in Northeast China during 1990–2013 based on remote sensing. Trans. Chin. Soc. Agric. Eng. 2016, 32, 1–10. [Google Scholar]
- Cai, H.Y.; Yang, X.H.; Xu, X.L. Spatiotemporal patterns of urban encroachment on cropland and its impacts on potential agricultural productivity in China. Remote Sens. 2013, 5, 6443–6460. [Google Scholar] [CrossRef]
- China Statistical Yearbook 2016; China Statistics Press: Beijing, China, 2016.
- Liu, W.C.; Liu, J.Y.; Kuang, W.H.; Ning, J. Examining the influence of the implementation of Major Function-oriented Zones on built-up area expansion in China. J. Geogr. Sci. 2017, 27, 643–660. [Google Scholar] [CrossRef]
- Tian, G.J.; Qiao, Z.; Zhang, Y.Q. The investigation of relationship between rural settlement density, size, spatial distribution and its geophysical parameters of China using Landsat TM images. Ecol. Model. 2012, 231, 25–36. [Google Scholar] [CrossRef]
- ENVI User’s Guide: Version 4.8; Research Systems, Inc.: Boulder, CO, USA, 2010.
- Nazeer, M.; Nichol, J.E.; Yung, Y.K. Evaluation of atmospheric correction models and Landsat surface reflectance product in an urban coastal environment. Int. J. Remote Sens. 2014, 35, 6271–6291. [Google Scholar] [CrossRef]
- Jia, M.M.; Liu, M.Y.; Wang, Z.M.; Mao, D.H.; Ren, C.Y.; Cui, H.S. Evaluating the effectiveness of conservation on mangroves: A remote sensing-based comparison for two adjacent protected areas in Shenzhen and Hong Kong, China. Remote Sens. 2016, 8, 627. [Google Scholar] [CrossRef]
- Xian, G.; Homer, C. Updating the 2001 National Land Cover Database Impervious Surface Products to 2006 using Landsat imagery change detection methods. Remote Sens. Environ. 2010, 114, 1676–1686. [Google Scholar] [CrossRef]
- Yu, W.J.; Zhou, W.Q.; Qian, Y.G.; Yan, J.L. A new approach for land cover classification and change analysis: Integrating backdating and an object-based method. Remote Sens. Environ. 2016, 177, 37–47. [Google Scholar] [CrossRef]
- Wang, K.; Zhou, W.Q.; Xu, K.P.; Liang, H.M.; Yu, W.J.; Li, W.F. Quantifying changes of villages in the urbanizing Beijing metropolitan region: Integrating remote sensing and GIS analysis. Remote Sens. 2017, 9, 448. [Google Scholar] [CrossRef]
- Baatz, M.; Schäpe, A. Multiresolution segmentation: An optimization approach for high quality multi-scale image segmentation. In Angewandte Geographische Informationsverarbeitung XII; Herbert Wichmann Verlag: Heidelberg, Germany, 2000; Volume 58, pp. 12–23. [Google Scholar]
- Lillesand, T.M.; Kiefer, R.W. Remote Sensing and Image Interpretation, 5th International Edition ed; John Wiley & Sons: New York, NY, USA, 2003. [Google Scholar]
- Zheng, S.D.; Zheng, J.H.; Shi, M.H.; Guo, B.L.; Sen, B.T.; Sun, Z.Q.; Jia, X.G.; Li, X.J. Classification of cultivated Chinese medicinal plants based on fractal theory and gray level co-occurrence matrix textures. J. Remote Sens. 2014, 18, 868–886. [Google Scholar]
- Sun, W.W.; Du, B.; Xiong, S.L. Quantifying sub-pixel surface water coverage in urban environments using low-albedo fraction from Landsat imagery. Remote Sens. 2017, 9, 428. [Google Scholar] [CrossRef]
- Estoque, R.C.; Murayama, Y. Classification and change detection of built-up land from Landat-7 ETM+ and Landat-8 OLI/TIRS imageries: A comparative assessment of various spectral indices. Ecol. Indic. 2015, 56, 205–217. [Google Scholar] [CrossRef]
- Liu, Z.; Li, Z.X.; Zhang, Y.K.; Zhang, C.; Huang, J.X.; Zhu, D.H. Seed maize identification based on time-series EVI decision tree classification and high resolution remote sensing texture analysis. Trans. Chin. Soc. Agric. Mach. 2015, 46, 321–327. [Google Scholar]
- Tong, L.Y.; Hua, S.G.; Frazier, A.E.; Liu, Y.S. Multi-order urban development model and sprawl patterns: An analysis in China, 2000–2010. Landsc. Urban Plan. 2017, 167, 386–398. [Google Scholar] [CrossRef]
- Christoph, A.; Rashmin, G.; Joachim, U.; Oscar, I. Consistent yet adaptive global geospatial identification of urban-rural patterns: The iURBAN model. Remote Sens. Environ. 2016, 187, 230–240. [Google Scholar]
- Xu, C.; Liu, M.S.; Zhang, C.; An, S.Q.; Yu, W.; Chen, J.M. The spatiotemporal dynamics of rapid urban growth in the Nanjing metropolitan region of China. Landsc. Ecol. 2007, 22, 925–937. [Google Scholar] [CrossRef]
- Liu, X.; Li, X.; Chen, Y.M.; Tan, Z.Z.; Li, S.Y.; Ai, B. A new landscape index for quantifying urban expansion using multi-temporal remotely sensed data. Landsc. Ecol. 2010, 25, 671–682. [Google Scholar] [CrossRef]
- Zaman, N.A.F.K.; Kanniah, K.D.; Kaskaoutis, D.G. Estimating particulate matter using satellite based aerosol optical depth and meteorological variables in Malaysia. Atmos. Res. 2017, 193, 142–162. [Google Scholar] [CrossRef]
- Li, X.Y.; Li, H.; Liu, H.J. Effects of urbanization on black soil: A remote sensing perspective. Energy Eng. Environ. Eng. 2014, 535, 478–482. [Google Scholar] [CrossRef]
- Li, L.W.; Lu, D.S.; Kuang, W.H. Examining urban impervious surface distribution and its dynamic change in Hangzhou metropolis. Remote Sens. 2016, 8, 265. [Google Scholar] [CrossRef]
- Dou, Y.Y.; Liu, Z.F.; He, C.Y.; Yue, H.B. Urban land extraction using VIIRS nighttime light data: An evaluation of three popular methods. Remote Sens. 2017, 9, 175. [Google Scholar] [CrossRef]
- Myint, S.W.; Gober, P.; Brazel, A.; Grossman-Clarke, S.; Weng, Q.H. Per-pixel vs. object-based classification of urban land cover extraction using high spatial resolution imagery. Remote Sens. Environ. 2011, 115, 1145–1161. [Google Scholar] [CrossRef]
- Weng, Q.H. Remote sensing of impervious surfaces in the urban areas: Requirements, methods, and trends. Remote Sens. Environ. 2012, 117, 34–49. [Google Scholar] [CrossRef]
- Aljoufie, M.; Brussel, M.; Zuidgeest, M.; Maarseveen, M.V. Urban growth and transport infrastructure interaction in Jeddah between 1980 and 2007. Int. J. Appl. Earth Obs. Geoinf. 2013, 21, 493–505. [Google Scholar] [CrossRef]
- De la Luz Hernandez-Flores, M.; Otazo-Sanchez, E.M.; Galeana-Pizana, M.; Roldán-Cruz, E.I.; Razo-Zárate, R.; González-Ramírez, C.A.; Galindo-Castillo, E.; Gordillo-Martínez, A.J. Urban driving forces and megacity expansion threats. Study case in the Mexico City periphery. Habitat Int. 2017, 64, 109–122. [Google Scholar] [CrossRef]
- Wang, J.F.; Xu, C.D. Geodetector: Principle and prospective. Acta Geogr. Sin. 2017, 72, 116–134. [Google Scholar]
Figure 1.
Location of the study area and ground survey points of 2015.
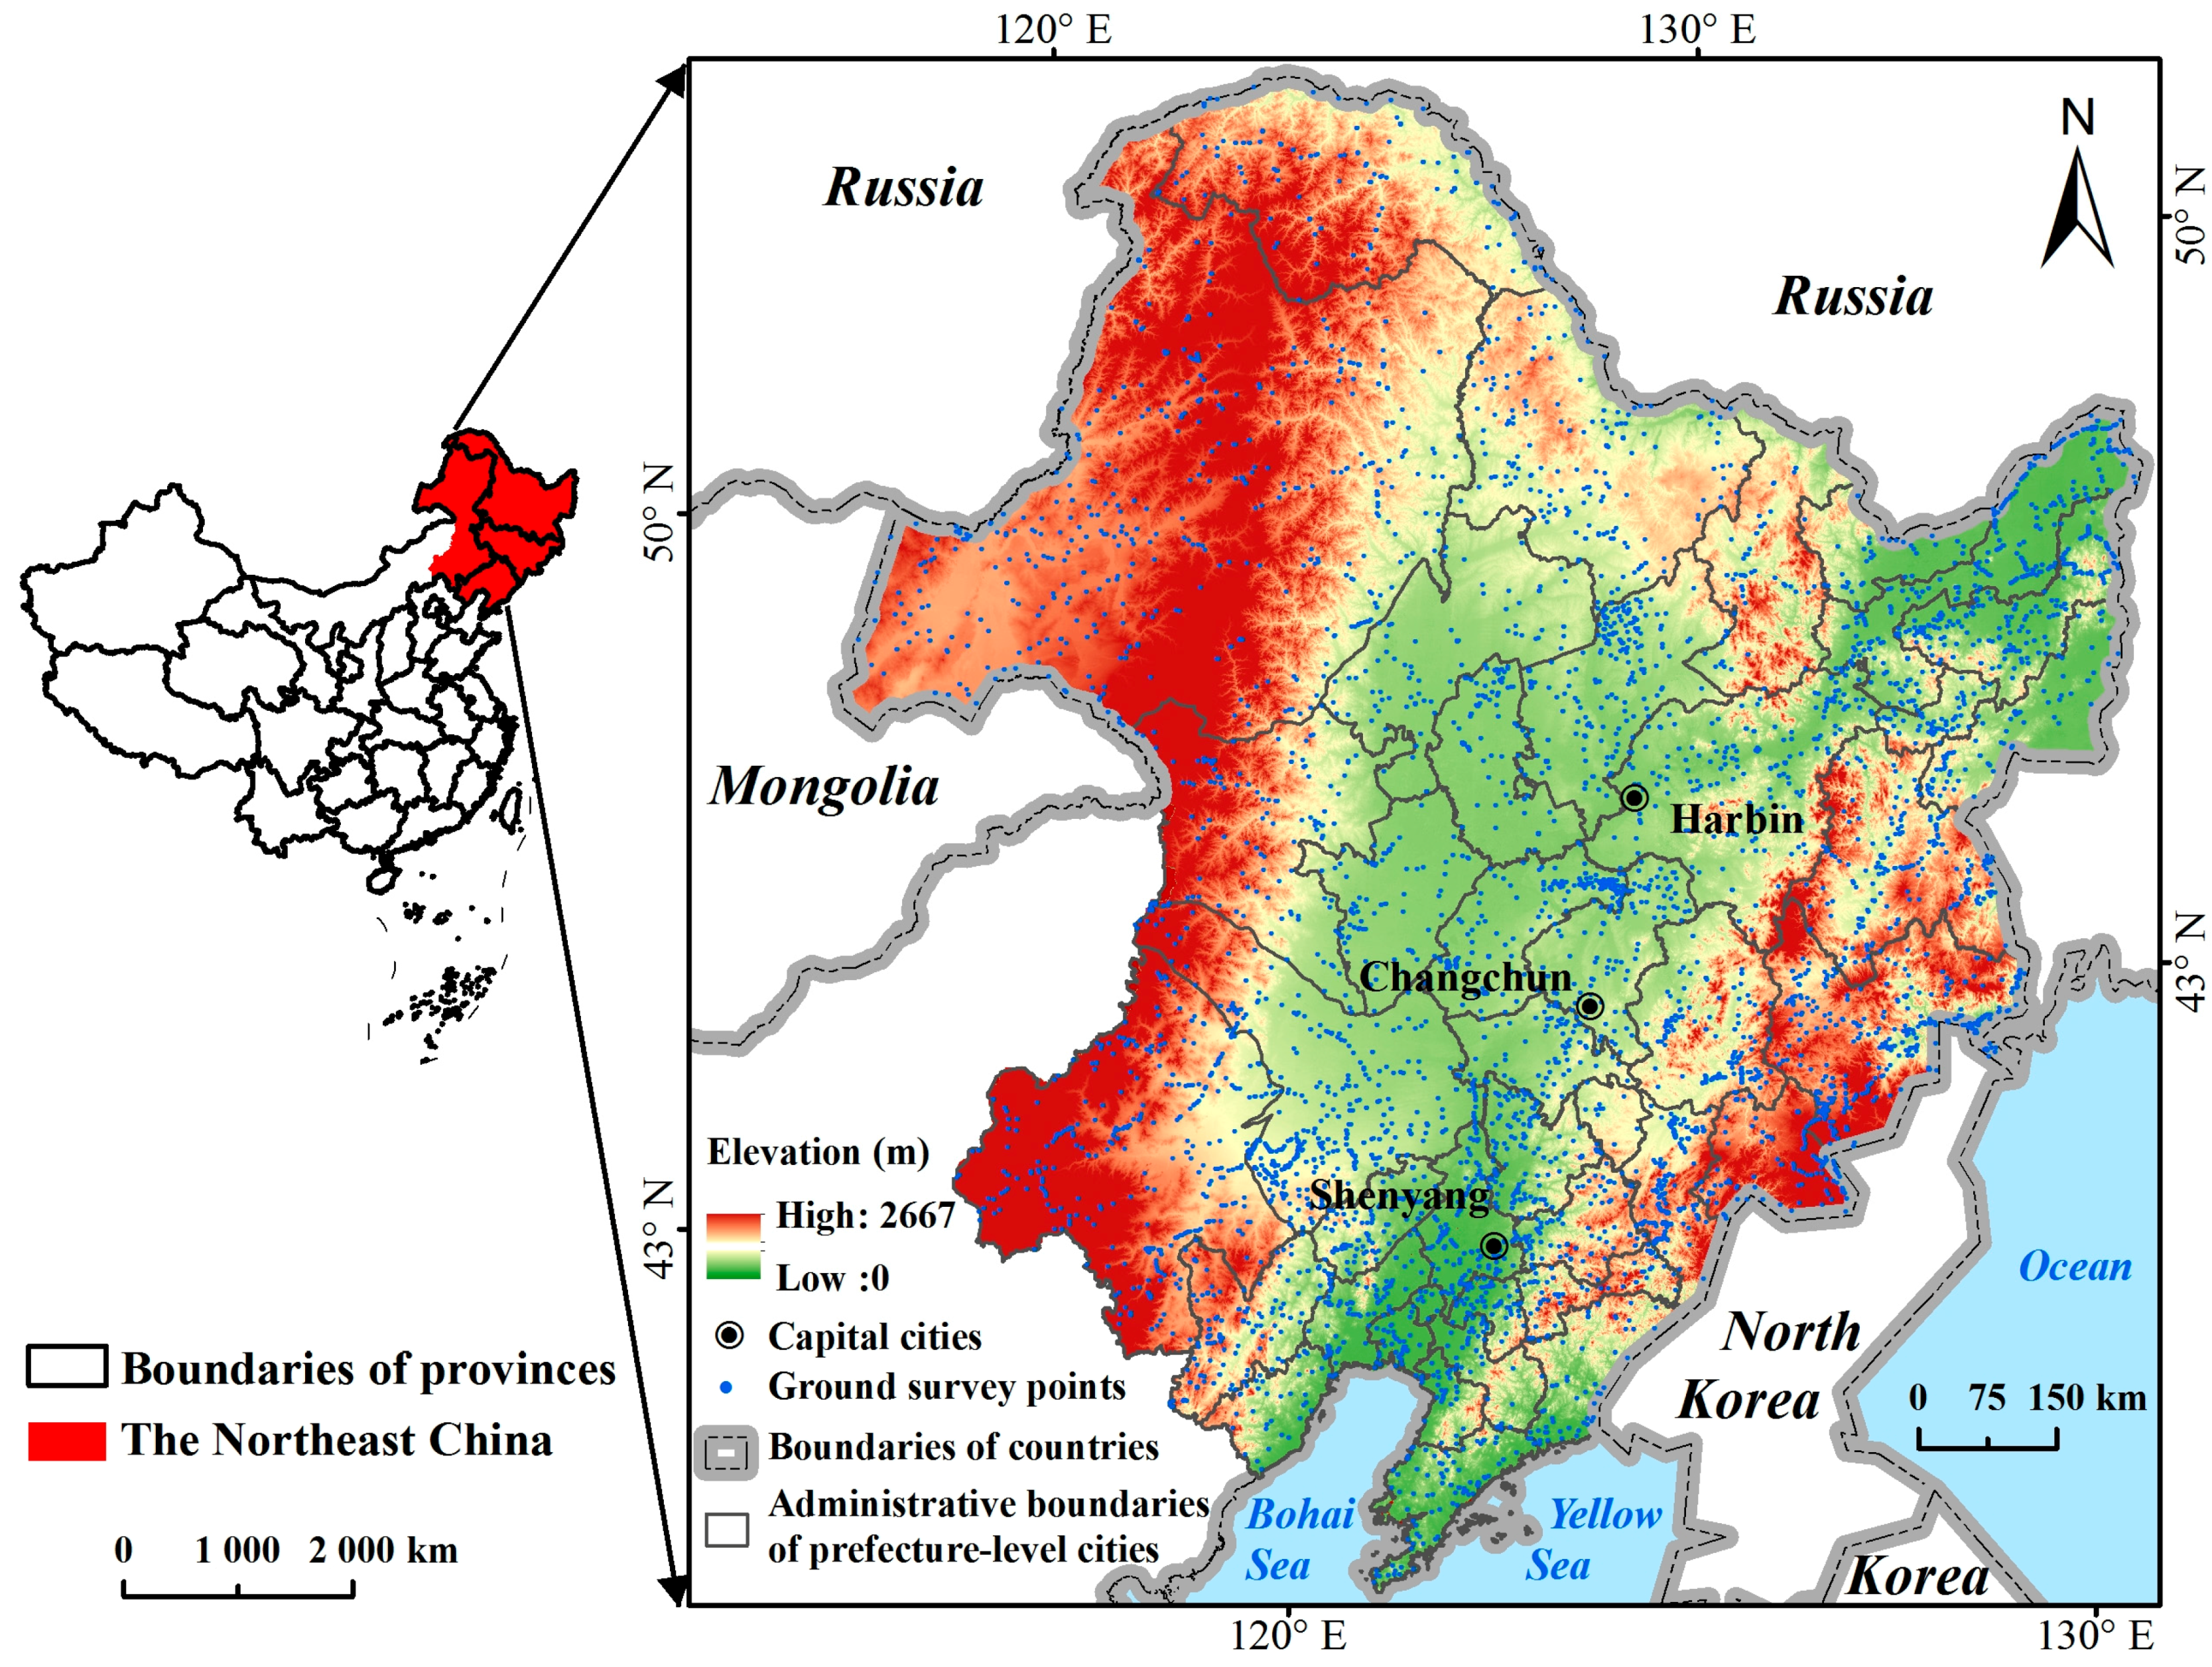
Figure 2.
The outline of the decision tree. The threshold of each rule set varied with images. NDVI is the Normalized Difference Vegetation Index (NDVI), calculated from bands four and five of Landsat OLI [47]; GLCM mean is the mean value of the gray level co-occurrence matrix and is widely used in textural features extraction, calculated by the gray scale value of the images [48]. Elevation and slope are calculated from ASTER GDEM V1 data; NDWI is the Normalized Difference Water Index, calculated from bands three and five of Landsat OLI [49]; NDBI is the Normalized Difference Build-up Index, calculated from bands five and six of Landsat OLI [50]; and EVI/Phenology is Enhanced Vegetation Index varied in time, calculated from bands one, four, and five of Landsat OLI [51].
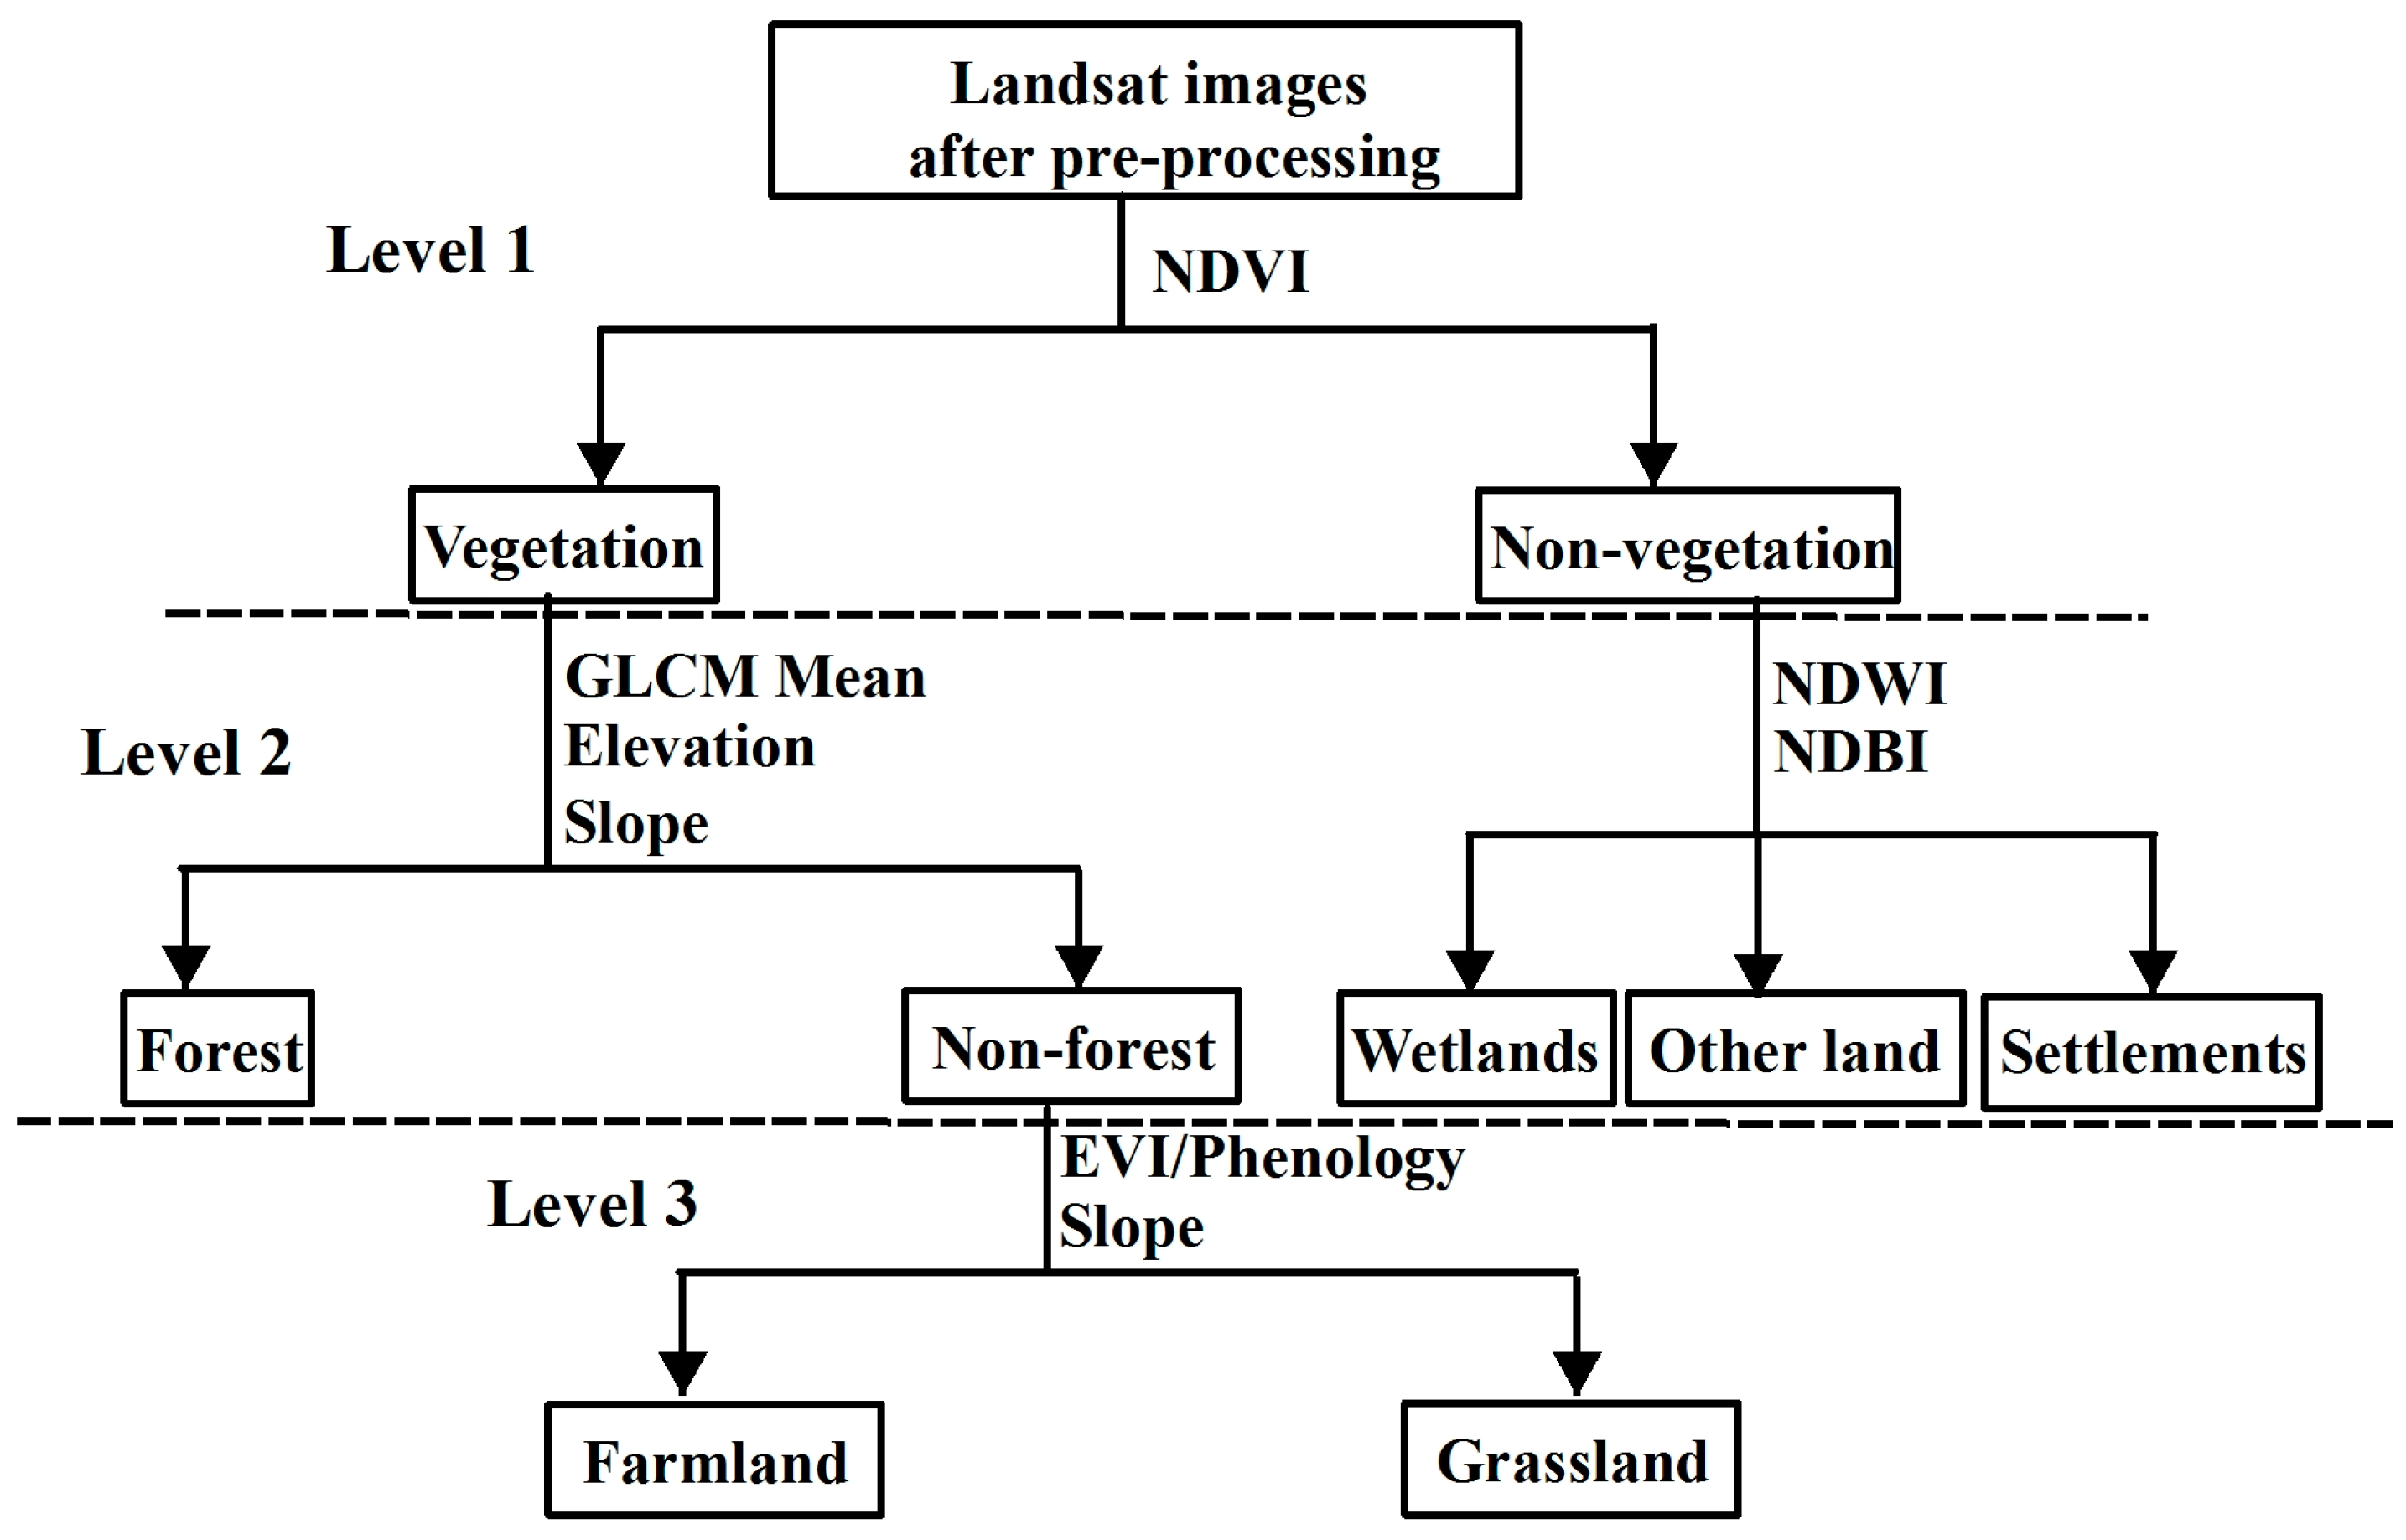
Figure 3.
Urban land growth for four provinces in Northeast China. HLJ, JL, LN, and EIMAR are the abbreviations for Heilongjiang, Jilin, Liaoning, and Eastern Inner Mongolia Autonomous region, respectively.
Figure 3.
Urban land growth for four provinces in Northeast China. HLJ, JL, LN, and EIMAR are the abbreviations for Heilongjiang, Jilin, Liaoning, and Eastern Inner Mongolia Autonomous region, respectively.

Figure 4.
Typical growth for three capital cities in Northeast China. The urban land distribution of the same city in different years is shown in rows, and that of the same year in different cities is shown in columns.
Figure 4.
Typical growth for three capital cities in Northeast China. The urban land distribution of the same city in different years is shown in rows, and that of the same year in different cities is shown in columns.
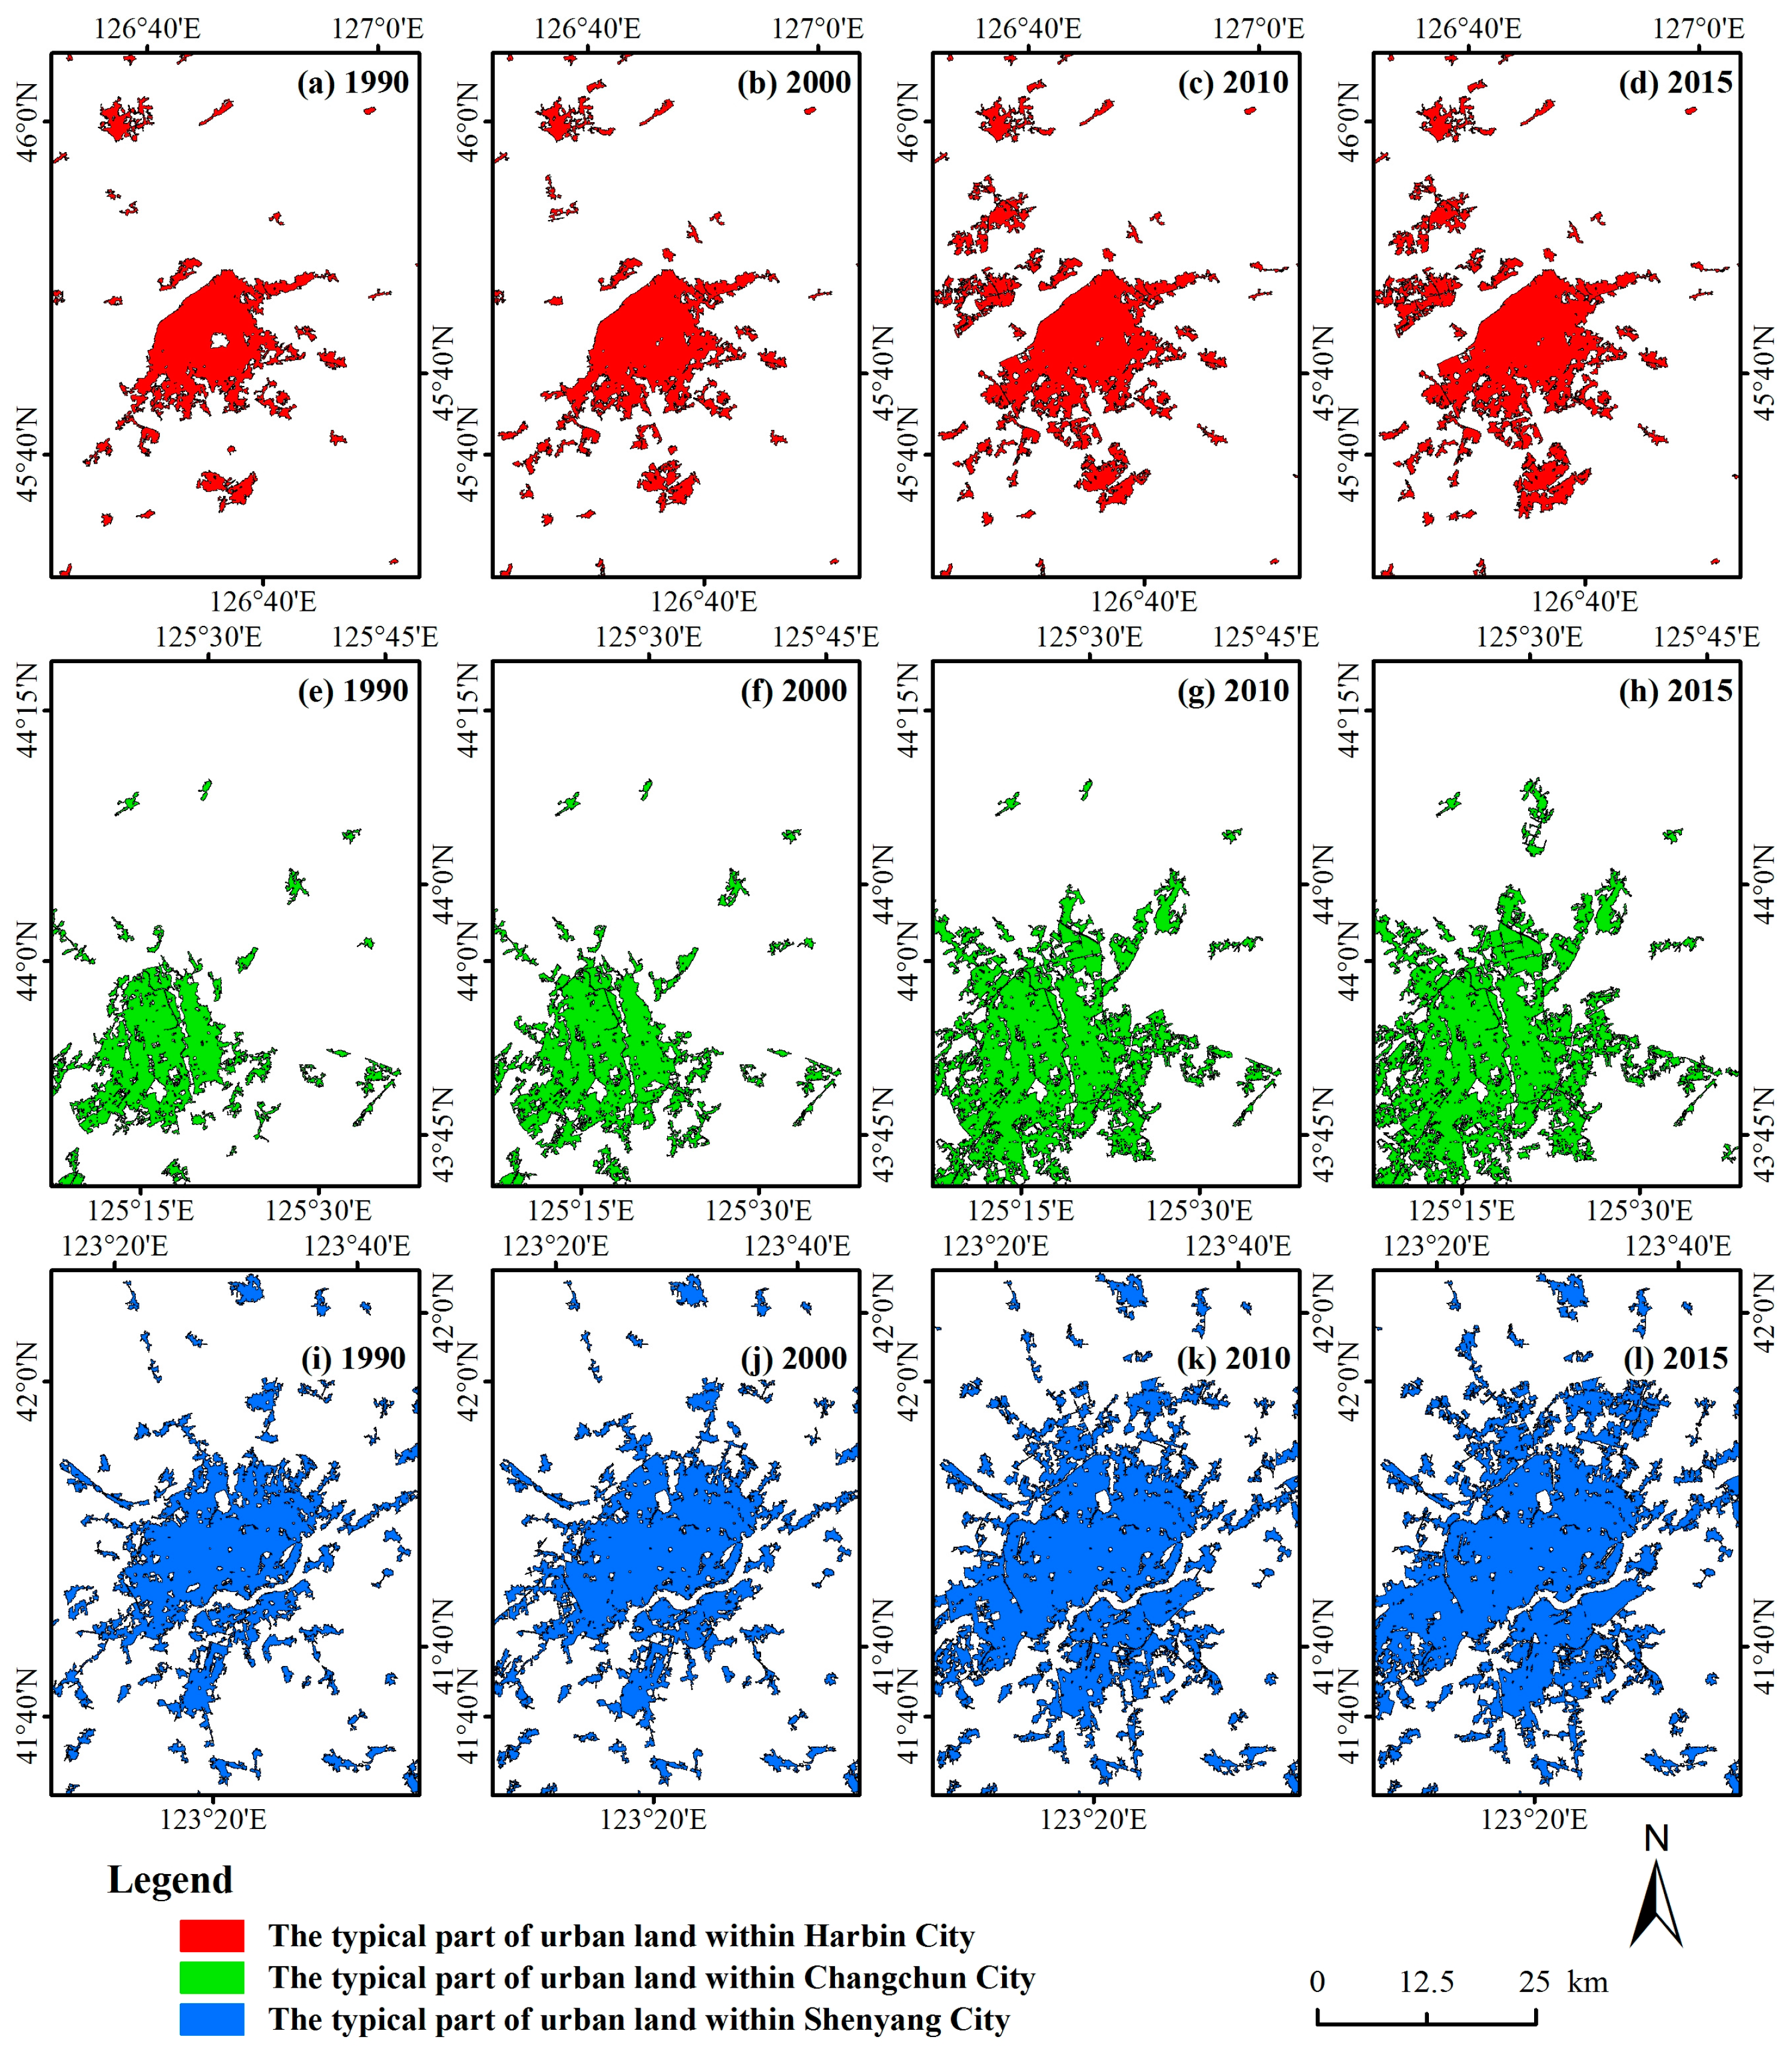
Figure 5.
The proportion of three expansion types in (a) Heilongjiang (HLJ); (b) Jilin (JL); (c) Liaoning (LN); (d) Eastern Inner Mongolia Autonomous Region (EIMAR); and (e) the total study area over the three decades.
Figure 5.
The proportion of three expansion types in (a) Heilongjiang (HLJ); (b) Jilin (JL); (c) Liaoning (LN); (d) Eastern Inner Mongolia Autonomous Region (EIMAR); and (e) the total study area over the three decades.
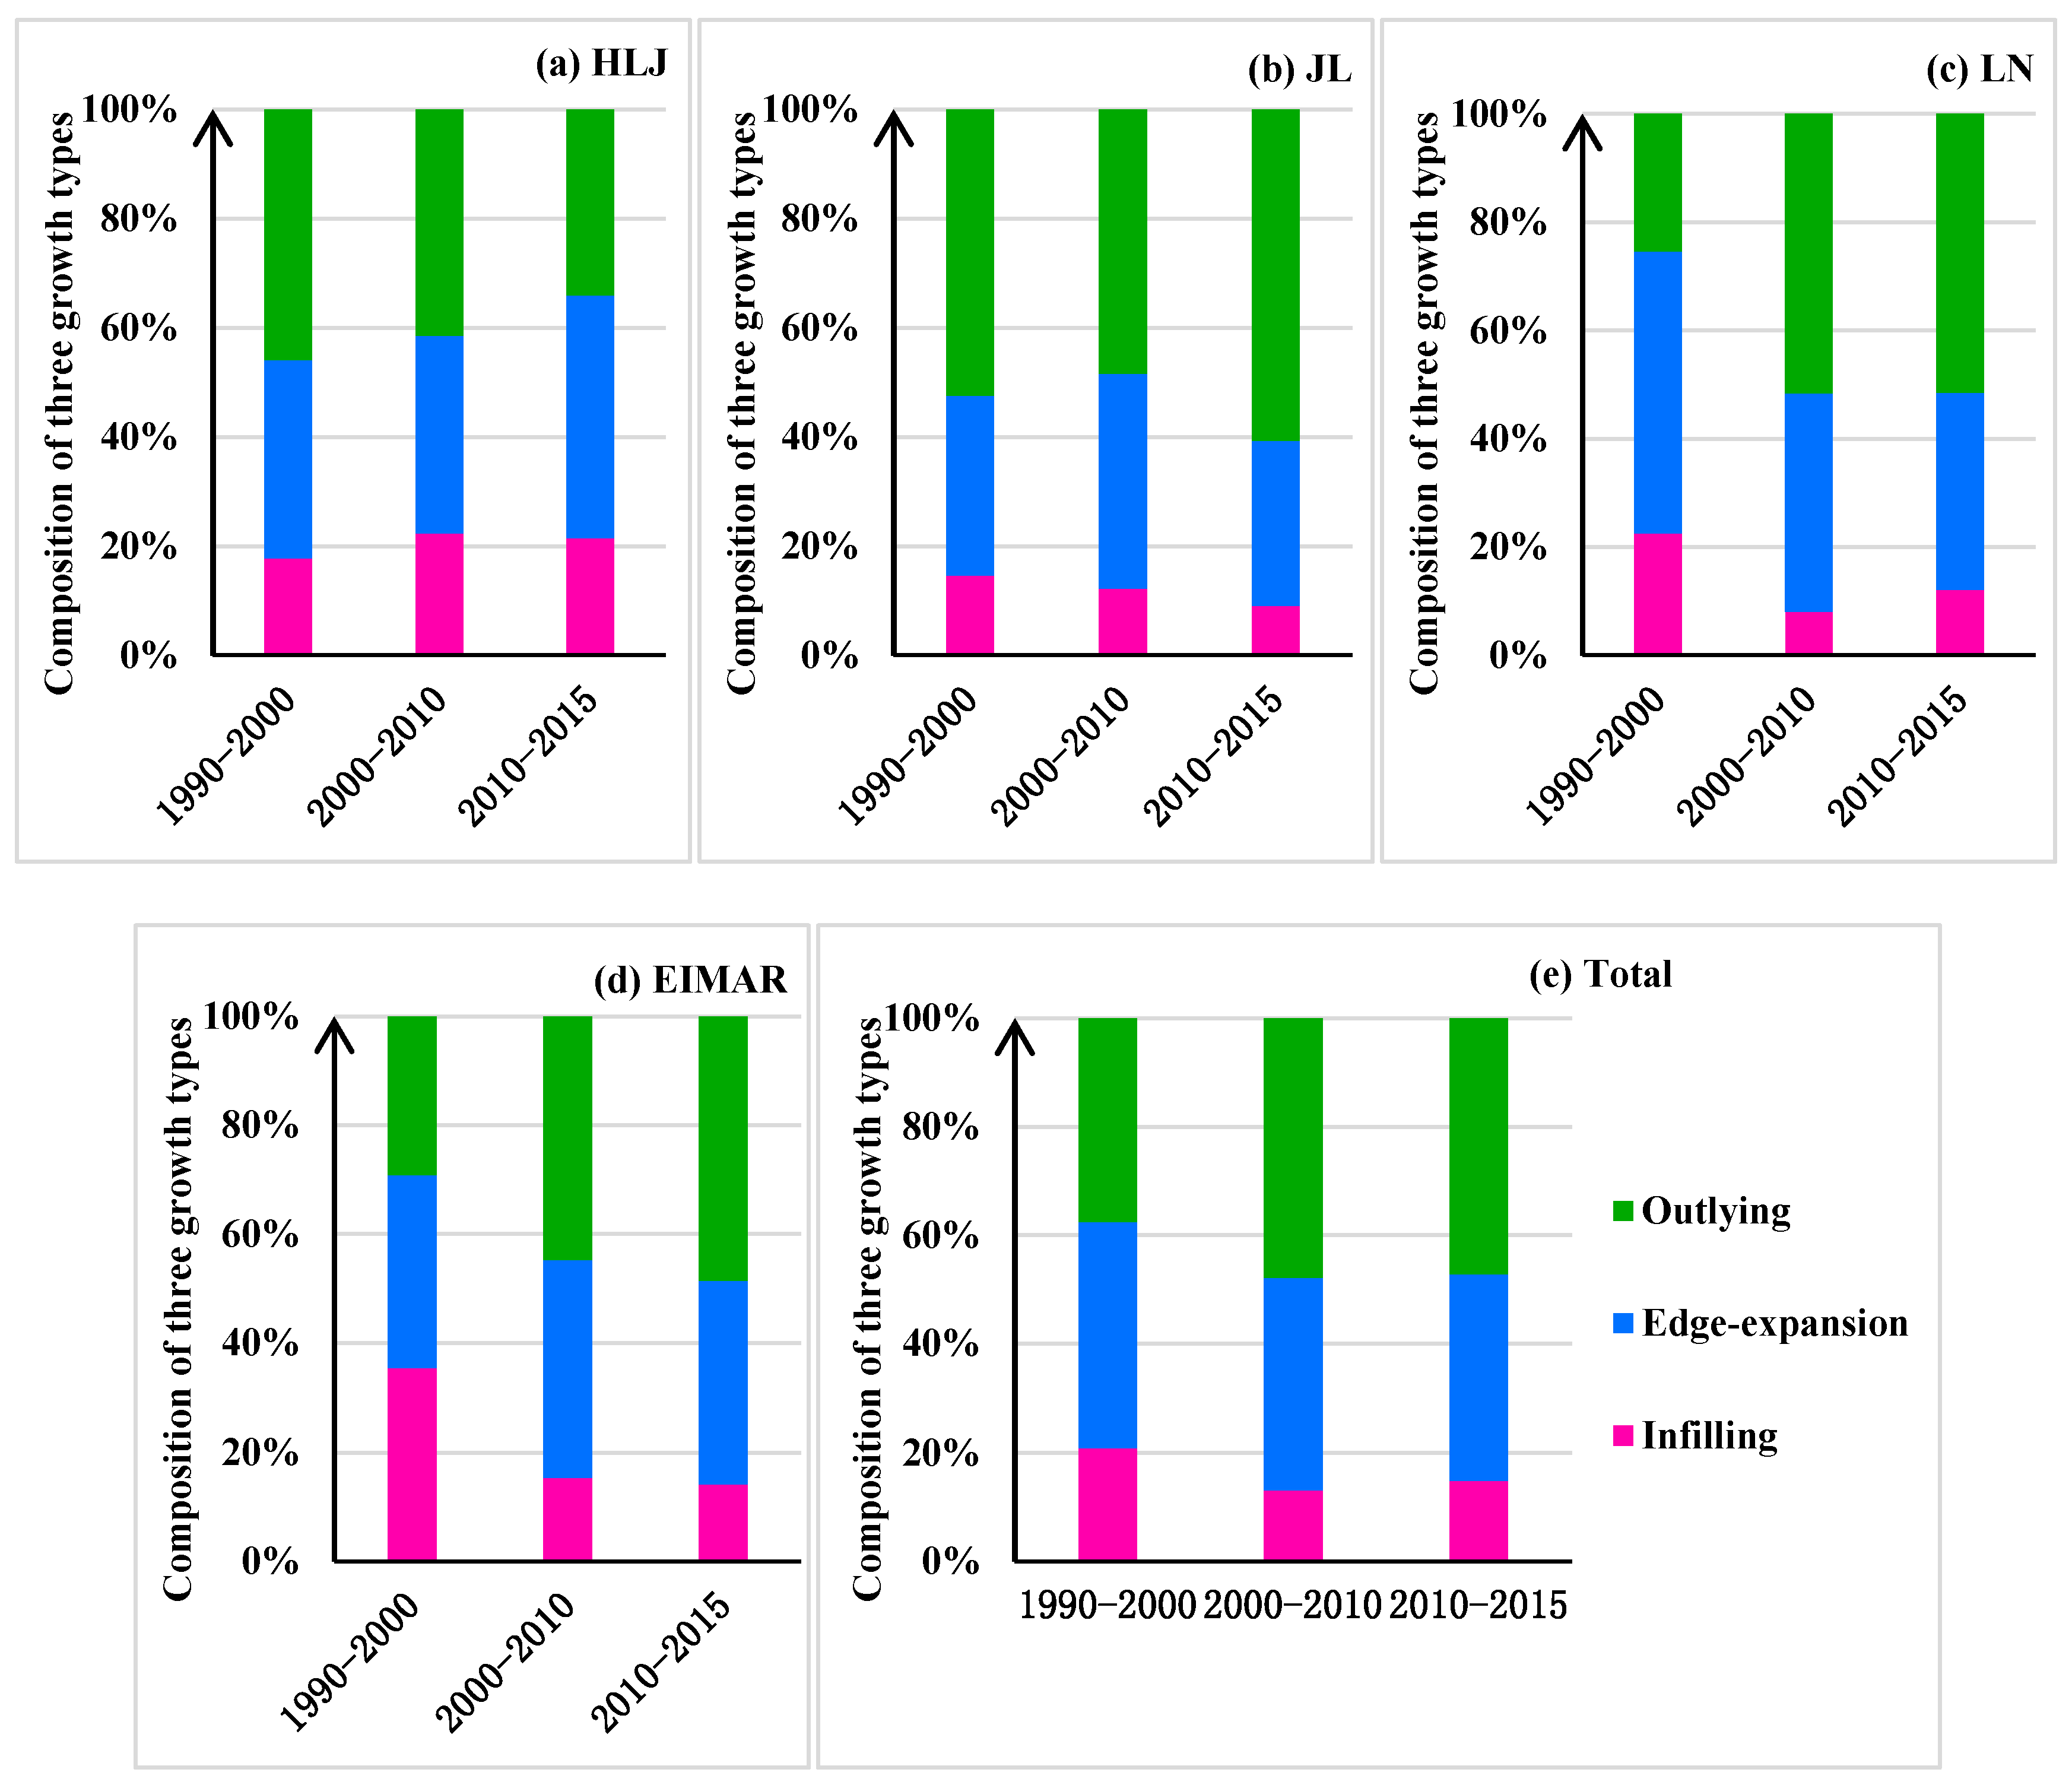
Figure 6.
Typical patterns of urban land expansion within (a–c) Harbin; (d–f) Changchun; and (g–i) Shenyang, and that of the same study phase in different cities are shown in columns.
Figure 6.
Typical patterns of urban land expansion within (a–c) Harbin; (d–f) Changchun; and (g–i) Shenyang, and that of the same study phase in different cities are shown in columns.


Table 1.
Multi-scale segmentation parameters.
| Parameter | Level 1 | Level 2 | Level 3 |
|---|---|---|---|
| Scale | 50 | 30 | 10 |
| Shape | 0.3 | 0.2 | 0.1 |
| Compactness | 0.4 | 0.4 | 0.4 |
Table 2.
The Pearson correlation coefficient (r) of the correlation analysis between the urban land area and statistical data.
Table 2.
The Pearson correlation coefficient (r) of the correlation analysis between the urban land area and statistical data.
| Statistical Data Related to Urban Land (km2) | r |
|---|---|
| Total population (104 persons) | 0.76 ** |
| Urban population (104 persons) | 0.64 ** |
| Gross domestic product (100 million Yuan) | 0.78 ** |
| Secondary industry product (100 million Yuan) | 0.77 ** |
| Tertiary industry product (100 million Yuan) | 0.78 ** |
| Per capita gross domestic product (Yuan) | 0.48 ** |
| Floor space of buildings under construction in commercial house (104 m2) | 0.73 ** |
| Per capita disposable income of urban permanent residents (Yuan) | 0.33 ** |
| Gross output value of construction industry (104 Yuan) | 0.60 ** |
Note: ** denotes strongly significant with a p-value below 0.01.
Table 3.
Multiple linear stepwise regression models for each study period.
| Year | Formula | Adjusted R2 |
|---|---|---|
| 1990 | UL = −0.32 **UP + 49.31 **GDP − 12.48 **SIP − 1.92 **PCGDP − 2.20PCDIUPR + 13.63 *GOVCI + 0.10 ** | 0.86 ** |
| 2000 | UL = 0.14TP + 2.61 **FSBCCH + 8.17 *GOVCI + 0.05 * | 0.81 ** |
| 2010 | UL = 0.37 **TP − 0.45UP + 0.29 *SIP + 2.00 **TIP − 3.28 *GOVCI + 0.08 * | 0.85 ** |
| 2015 | UL = 3.39 *GDP − 0.95SIP − 2.04 *TIP + 0.30FSBCCH + 0.25GOVCI + 0.04 | 0.86 ** |
| General | UL = 0.33 **TP + 0.13 *UP − 1.22GDP + 0.98 **SIP + 0.86 *TIP + 0.04 ** | 0.79 ** |
Note: UL, TP, UP, GDP, SIP, TIP, PCGDP, FSBCCH, PCDIUPR, and GOVCI are the abbreviations for area of urban land, total population, urban population, gross domestic product, secondary industry product, tertiary industry product, per capita gross domestic product, floor space of buildings under construction in commercial house, per capita disposable income of urban permanent residents, and gross output value of construction industry, respectively. * denotes significant with a p-value below 0.05; ** denotes strongly significant with a p-value below 0.01.
© 2018 by the authors. Licensee MDPI, Basel, Switzerland. This article is an open access article distributed under the terms and conditions of the Creative Commons Attribution (CC BY) license (http://creativecommons.org/licenses/by/4.0/).
Share and Cite
MDPI and ACS Style
Chen, L.; Ren, C.; Zhang, B.; Wang, Z.; Liu, M. Quantifying Urban Land Sprawl and its Driving Forces in Northeast China from 1990 to 2015. Sustainability 2018, 10, 188. https://doi.org/10.3390/su10010188
AMA Style
Chen L, Ren C, Zhang B, Wang Z, Liu M. Quantifying Urban Land Sprawl and its Driving Forces in Northeast China from 1990 to 2015. Sustainability. 2018; 10(1):188. https://doi.org/10.3390/su10010188
Chicago/Turabian StyleChen, Lin, Chunying Ren, Bai Zhang, Zongming Wang, and Mingyue Liu. 2018. "Quantifying Urban Land Sprawl and its Driving Forces in Northeast China from 1990 to 2015" Sustainability 10, no. 1: 188. https://doi.org/10.3390/su10010188
Note that from the first issue of 2016, this journal uses article numbers instead of page numbers. See further details here.