Influencing Factors and Development Trend Analysis of China Electric Grid Investment Demand Based on a Panel Co-Integration Model

1
School of Economics and Management, North China Electric Power University, Beijing 102206, China
2
Beijing Key Laboratory of New Energy and Low-Carbon Development, North China Electric Power University, Changping, Beijing 102206, China
3
Department of Economics and Management, North China Electric Power University, Baoding 071003, China
4
State Power Economic Research Institute China State Grid Corp, Beijing 102209, China
*
Author to whom correspondence should be addressed.
Sustainability 2018, 10(1), 256; https://doi.org/10.3390/su10010256
Submission received: 8 December 2017
/
Revised: 13 January 2018
/
Accepted: 15 January 2018
/
Published: 19 January 2018
(This article belongs to the Special Issue Sustainable Electric Power Systems Research)
Abstract
:Electric grid investment demand analysis is significant to reasonably arranging construction funds for the electric grid and reduce costs. This paper used the panel data of electric grid investment from 23 provinces of China between 2004 and 2016 as samples to analyze the influence between electric grid investment demand and GDP, population scale, social electricity consumption, installed electrical capacity, and peak load based on co-integration tests. We find that GDP and peak load have positive influences on electric grid investment demand, but the impact of population scale, social electricity consumption, and installed electrical capacity on electric grid investment is not remarkable. We divide different regions in China into the eastern region, central region, and western region to analyze influence factors of electric grid investment, finally obtaining key factors in the eastern, central, and western regions. In the end, according to the analysis of key factors, we make a prediction about China’s electric grid investment for 2020 in different scenarios. The results offer a certain understanding for the development trend of China’s electric grid investment and contribute to the future development of electric grid investment.
1. Introduction
The power grid is an important part in maintaining the stability of the state energy system. With the steady development of the Chinese economy, the continuous improvement of people’s living standards, the growing need for electric power, and the continuous scale and level of development in electric grid investment, grid management problems still exist regarding the lack of scientific basis in evaluating investment, and managers evaluate electric grid investment more from the point of finance. In the foreseeable future, how to evaluate power grid investment scientifically and objectively in the situation of uncertainty and high risks is an inevitable problem. Therefore, at first, this paper analyzed influencing factors and research methods of China’s electric grid investment, pointing out the disadvantages of the present research, and showed the importance of predicting development trends of China’s electric grid investment.
For the first part of the introduction, the article analyzes the significance of electric grid investment, makes a comment on the literature review about the influence factors of electric grid investment, analyzes the research trends until now, and puts forward some existing problems. The second part sets forth the major research methods—panel co-integration and pooled regression model. In part three, the co-integration relation analysis on the panel data in 23 provinces is made according to co-integration theory. We obtain different regression analysis results for different geographical distributions, and make a contrast in order to get the development direction of different regions. Part four predicts the amount of electric grid investment by multiple scenarios, obtains concrete predicted values of electric grid investment in 2020 in 23 provinces under three scenarios.
2. Literature Review
2.1. Literature Review about Influence Factors of Electric Grid Investment
Power grid investment belongs to the category of fixed investments, it has the general properties of other social fixed investments. In related papers on electric grid investment, many of papers evaluated it from long-term impact and short-term impact. With short-term impact, electric grid investment can drive economic growth. With long-term impact, electric grid investment can increase fixed asset stocks and raise the supply ability.
At present, it is deficient of the study about electric grid investment at home and abroad, it is focused on influencing factors of electric power consumption and electricity demand, the coordinated relations between electric power consumption and economic development. The influencing factors of electric power investment are shown in Table 1.
This paper used the data of Chinese electric grid investment in 2004–2016 in 23 provinces, based on the influencing factor occurrences and accessibility of its data, and chose GDP, population scale, total electricity consumption, electric installed capacity, and peak load as the influencing factors of China’s electric grid investment.
2.2. Research Methods for Influencing Factors of Electric Grid Investment
The specific literature arrangement of the research methods is shown in Table 2.
Through the above arrangement of research methods, we found research methods mostly have the following properties: First, many articles quantify influencing factors of electric grid investment to indices according to principia mathematica, and establish a perfect evaluating indices system. Second, research methods generally have a refined and succinct flow. Third, results are mostly quantized.
Even with these new developments in research, a view of research is incomprehensible, to some extent. As stated above, electric grid investment is influenced by many factors. Thus, if we conduct regression analysis using a small number of indicators, it is difficult to reflect the relationship among influencing factors of electric grid investment roundly.
According to the analysis of influencing factors, some papers may predict the value of electric grid investment. However, this prediction may be inaccurate, because electric grid investment involves society, economics, and so on. These factors should be considered with a great deal of random disturbances. Meanwhile, the decision of the grid company has obvious indefiniteness, decision elements have complications which add to the uncertainty of the indices, and the lack of historical data has a strong impact on the prediction of the indices.
In addition, some influencing factors of electric grid investment have to be made by qualitative analysis by experts in the related field according to their experience. This assay method has relative limitations, and cannot satisfy the demand of evaluating electric grid investment scientifically. Thus, we should focus on deeper research on quantitative analysis, establishing informationalized analysis systems of electric grid investment. It is not only beneficial to manage the investment structure and optimize investment projects, but also to enhance the analysis efficiency and provide more accurate analysis results.
3. Research Methods
3.1. Panel Co-Integration
General regression analysis did not attach great value to autocorrelation of residuals frequently, but, in practice, many macro time series are non-stationary. If we analyze non-stationary time series by the method of analyzing the stationary time series, the results of measuring will inevitably have deviation. In this paper, electric grid investment and its influencing factors are non-stationary variables usually, but there is a long-term stable relationship in the same order of non-stationary variables, that is, a co-integration relationship. Thus, we can find a co-integration relationship by a Pedroni panel co-integration test, obtain co-integrated vectors, and set up a long-run equilibrium model among variables.
(1) Unit root test
Generally, a panel data model needs to examine the stationarity of data before regression analysis, because some non-stationary time series have the same changing trend, but the time series do not necessarily have direct correlations between them. Thus, if we conduct regression analyses on these data, the regression result has higher R2, but it has no real meaning, and is a spurious regression. In order to avoid the spurious regression, we should examine the stationarity of all panel time series. The most regular way of testing the stationarity of data is the unit root test.
The first step of the unit root test is drawing sequence diagram for panel time series. We should judge whether the line chart of variables has a trend term and intercept term. The main methods of the unit root test include LLC, IPS, Breintung, Fisher-ADF, Fisher-PP, and so on. Among them, LLC and Breintung belong to homogeneous panel test; IPS, Fisher-ADF, and Fisher-PP belong to the heterogeneous panel test. Since all longitudinal section time series have roots of unity in the homogeneous panel test, its alternative hypothesis is inconsistent with reality. We can choose the same unit root test—LLC and the different unit root test—Fisher-ADF to analyze, if the result rejected the null hypothesis, we could define that this time series is steady.
(2) Co-integration test
If the result of the unit root test is integrated of the same order, we can perform a co-integration test. When the series are stable after the combination of two or more non-stationary variable sequences, we consider that there is a co-integration relation between these variable sequences.
The methods of the co-integration testing include Kao, Pedroni, and Johansen tests. The methods can be divided into two types: one is a co-integration test based on the residual error, and its basic idea is extending the EG method of the time series to the panel data, like the Kao test and Pedroni test. The null hypothesis of these co-integration tests is a lack of co-integration. Kao is a method for a fixed effects model whose slope is homogeneous, but the Pedroni test allows the existence of the heterogeneous panel. The other is the Johansen test, its basic idea is extending the likelihood classification of VAR to the heterogeneous panel data. This method can test multiple co-integration relations and allow the existence of a spatial correlation. Thus, if the data passes the co-integration test, we can consider that there is a long-run stationary relation in the variables. On this basis, the regression result is more accurate.
3.2. Pooled Regression Model
Panel data regression models are based on panel data, which are observations on the same cross-sectional, or individual, units over several time periods.
The pooled regression models include mixed, fixed, and random effects models using dummy variables. Here we use a fixed effects model. The mixed model formula function is shown in the equation
Here, is the explained variable, representing the observation of the ith individual in t time. is the explanatory variable, representing the observation of kth explanatory variable of the ith individual in t time. are the estimated parameters. are the random effects. i means the individual, and there are N individuals. t means time, and there are T times.
Then the ordinary least squares (OLS) method is used to calculate the parameters.
4. China Electric Grid Investment Co-Integration Analysis
4.1. Variables and Data Characteristics
This article selected the panel data of 23 provinces from 2004 to 2016 to consider the relation between electric grid investment (EGI) and gross domestic product (GDP), population scale (POP), social electricity consumption (SEC), electric installed capacity (EIC), and peak load (PL). The 23 provinces consist of Beijing, Tianjin, Liaoning, Shanghai, Jiangsu, Zhejiang, Fujian, Shandong, Shanxi, Jilin, Heilongjiang, Anhui, Jiangxi, Henan, Hubei, Hunan, Sichuan, Chongqing, Shaanxi, Gansu, Ningxia, Qinghai, and Xinjiang. The descriptive statistics of the influencing factors are shown in Table 3.
The data are obtained from the Energy Statistical Yearbook of Beijing, Tianjin, Liaoning, Shanghai, Jiangsu, Zhejiang, Fujian, Shandong, Shanxi, Jilin, Heilongjiang, Anhui, Jiangxi, Henan, Hubei, Hunan, Sichuan, Chongqing, Shaanxi, Gansu, Ningxia, Qinghai, and Xinjiang from 2004 to 2016.
(1) Unit root test
The sample period of this article is 2004 to 2016, which is less than 20. Thus, the data belongs to the short panel date, and it makes little sense to make a unit root test. This is because the objective of the unit root test is to examine the stationarity of time series data, and the method is mostly used for standing data. Spurious regression exists because there are obvious time series. If the sample period of the data is short, every one year of data increase has a great impact on the test of stationarity. Thus, we do not conduct the unit root test in this article.
(2) Co-integration test
We choose the Pedroni test to conduct a stationary test. The Pedroni test includes seven statistics, and can be divided into two types: a test in the dimension and a test between dimensions. The former is used for homogeneous panel data, and supposes that each cross-section sequence has the same AR coefficient, and including the panel v-statistic, panel rho-statistic, panel PP-statistic and panel ADF-statistic. The latter is used for heterogeneous panel data, including the group rho-statistic, group PP-statistic, and group ADF-statistic. The null hypothesis of two types thinks that there is an absence of co-integration relationships in variables. The results of co-integration testing are shown in the Table 4.
As a matter of experience, in the Pedroni panel co-integration test, if the data of co-integration is a small sample, the most powerful and effective methods are the group ADF-statistic and panel ADF-statistic. From Table 4, we know that p values of panel PP-statistic, panel ADF-statistic, group PP-statistic, and group ADF-statistic are all less than 0.05, so the results reject the null hypothesis. We can consider that there is a co-integration relation between EGI and GDP, POP, SEC, EIC, and PL.
(3) Regression analysis of panel data
Based on the co-integration test, we performed a regression analysis for the influencing factors of electric grid investment by the method of pooled least squares, the results of 23 provinces are shown in Table 5.
It can be seen from Table 5 that the p values of variable ln(GDP) and ln(PL) are less than 0.05, so there are significant correlations between EGI and GDP, and PL. Meanwhile, the coefficients of GDP and PL are all positive. We can conclude that GDP and PL are positively related to EGI, and PL played more of a role than GDP.
Finally, below, we can obtain the co-integration equation (Equation (2)) of EGI in 23 provinces
In order to analyze the diversity of electric grid investment development in different regions, this article conducts regression analyses of panel data for Eastern China, Central China, and Western China. Among them, the eastern region consist of Beijing, Tianjin, Liaoning, Shanghai, Jiangsu, Zhejiang, Fujian, and Shandong; the central region consist of Shanxi, Jilin, Heilongjiang, Anhui, Jiangxi, Henan, Hubei, and Hunan; and the western region consist of Sichuan, Chongqing, Shaanxi, Gansu, Ningxia, Qinghai, and Xinjiang. The results of the eastern region are shown in Table 6.
From Table 6, we know that the p value of variable ln(PL) is less than 0.05, and the coefficient of PL is positive, so there are significant positive correlations between EGI and PL, and other influencing factors have no significant influence on electric power investment.
Finally, below, we can obtain the co-integration equation (Equation (3)) of the eastern region
The results for the central region are shown in Table 7.
From Table 7, we know that the p value of the variable ln(GDP) is less than 0.05, and the coefficient of GDP is positive, so there is a significant positive correlation between EGI and GDP, and other influencing factors have no significant influence on electric power investment.
Below, we can get the co-integration equation (Equation (4)) of the central region
The results of western region are shown in Table 8.
From Table 8, we know that the p values of the variables ln(GDP) and ln(SEC) are less than 0.05, and the coefficients of GDP and SEC are positive, so there are significant positive correlations between EGI and GDP, and SEC, and the variable ln(SEC) has a larger influence on electric grid investment than the variable ln(GDP). Other influencing factors have no significant influence on electric power investment.
Below, we can obtain the co-integration equation (Equation (5)) of the western regions
4.2. Analysis of Co-Integration Results
First, we can see that there exist obvious positive relationships between GDP, PL, and EGI of 23 provinces in China; among them, the effect of PL is more obvious. However, POP, SEC, and EIC have no influence on EGI.
It is a considerable improvement in the power grid in China through the rapid development in the last few years. It already meets the electricity demand of the general population, mainly, as installed capacity increased faster, and the increase of electricity consumption is steadier than the economic development. However, the main and immediate issue in China is that building power grids, expanding power supply, and broadening marketing by the existing development mode can no longer meet the demand of peak load and economic development, with the scale of power grids and power supply increasingly expanding. Power grids need to transform growth patterns to heighten the ability of dealing with peak load, and to guarantee grid system security and stable operation. Thus, the development of GDP and peak load made a considerable impact on electric grid investment, power girds have to increase the investment in the relevant respects, in order to promote technological progress and the rapid development of the grid.
Meanwhile, the effects of influencing factors from different regions have shown different levels of changes to electric grid investment. From the test results, we know that peak load has an obvious positive relationship with electric grid investment in Eastern China; GDP has an obvious positive relationship with electric grid investment in Central China; and GDP and social electricity consumption have obvious positive relationships with electric grid investment in Western China.
Via the comparison, we find that each region has unique features. In Eastern China, the growth of economic development has levelled off compared with the central and western regions, so the promotion of GDP to electric grid investment has not been distinct. With the energy of hydroelectricity, thermal power, and wind power mainly distributed in mid-western China, load demand is concentrated in mid-eastern or coastal China, and the high voltage transmission line is long. Thus, the main objective of the eastern grid is ensuring safe power network operation and responding to the changes in load. Although the economic development level of central and western regions is less than the eastern region, GDP maintained a rapid growth rate in central and western regions, and the rapid economic development has a strong driving force on electric grid investment. In the western region, social electricity consumption has gradually increased along with the growth of GDP, so it has a positive effect on electric grid investment. The power grid in the west developed slowly compared with the eastern region; so far, the electric grid investment in the western region is still related with GDP and social electricity consumption. Along with the sustainable development of the future western power grid, the influencing factors of the western electric grid investment will change correspondingly.
5. Development Trend Forecast of the Electric Grid
Due to the enormous investment, length of the investment period, and payback period, not only will grid companies raise funds through multiple channels to ensure the smooth process of electric grid investment, but it is necessary to predict the demand of electric grid investment effectively in order to pool funds, lower funding costs, and improve managerial skill and the financial situation of the enterprise. In the previous section, we analyzed the influencing factors of electric grid investment and the development of national, eastern, western, and central power grids. With the development of society, the development situation of electric grid investment will change correspondingly. The publication of the ninth document had especially begun to reform the power system, which also has a great effect on electric grid investment. The State Grid Corporation of China has already invested 2.5 trillion yuan since the 11th Five-Year Plan, the amount of investment per year is less than 300 billion yuan on average, but it was 350 billion yuan per year during the previous four years of the 12th Five-Year Plan. In 2014, the amount of investment was 338.5 billion yuan, but in 2015 it was 420.2 billion yuan, with year-on-year growth of 24%. The country plans to build and improve the smart grid widely in about 2020, so electric grid investment will maintain a high growth rate during the 13th Five-Year Plan. This section analyzes the development trend of China’s electric grid investment in 23 provinces in 2020.
5.1. Scenario Design of Electric Grid Investment
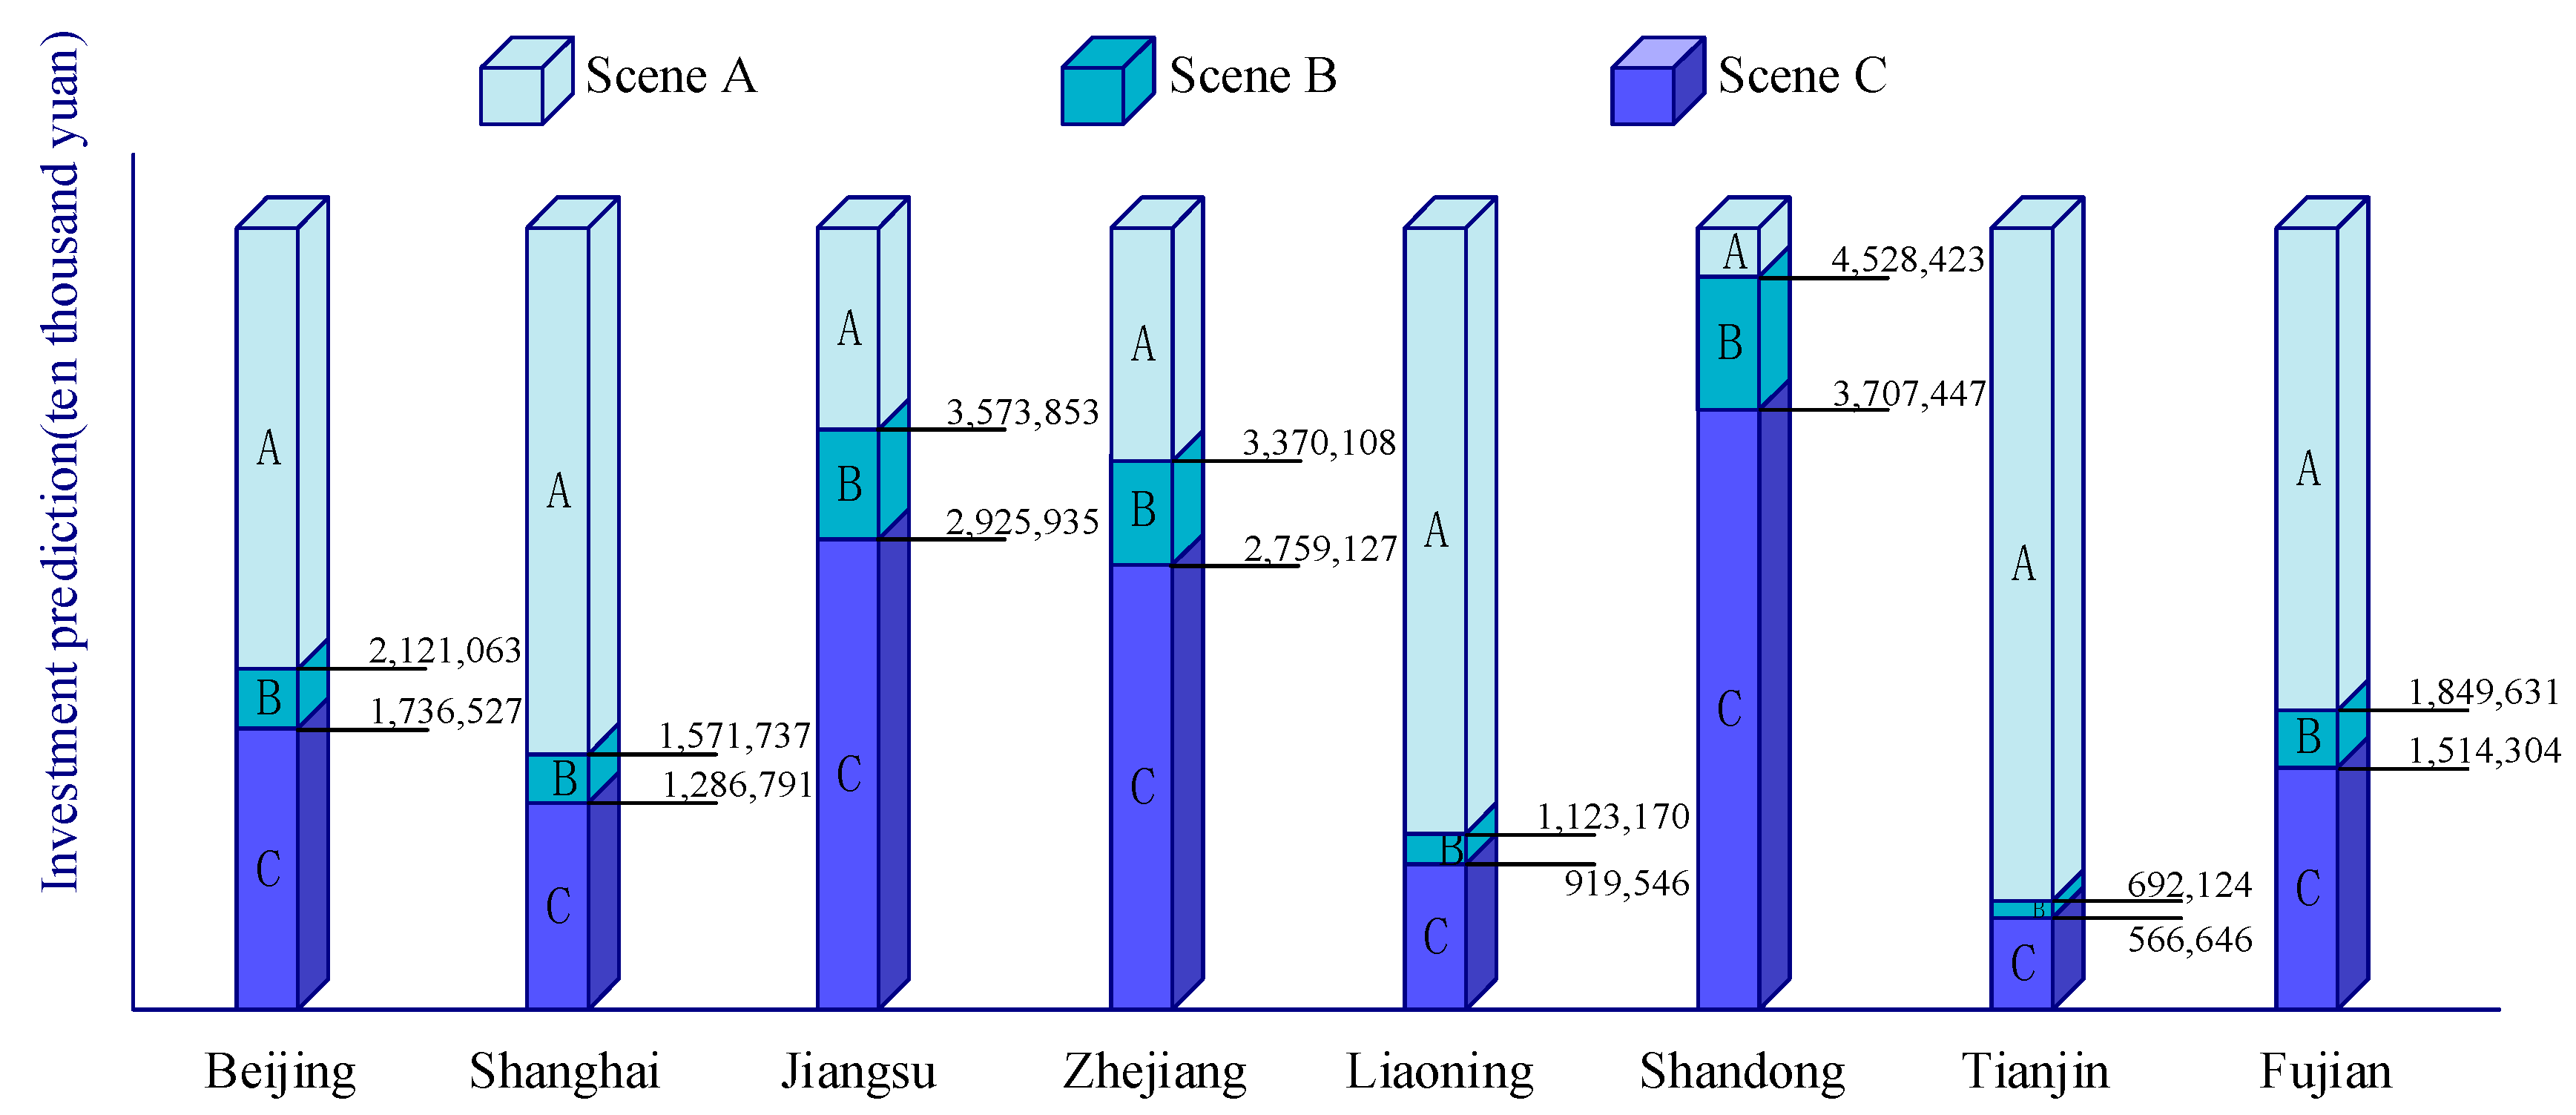
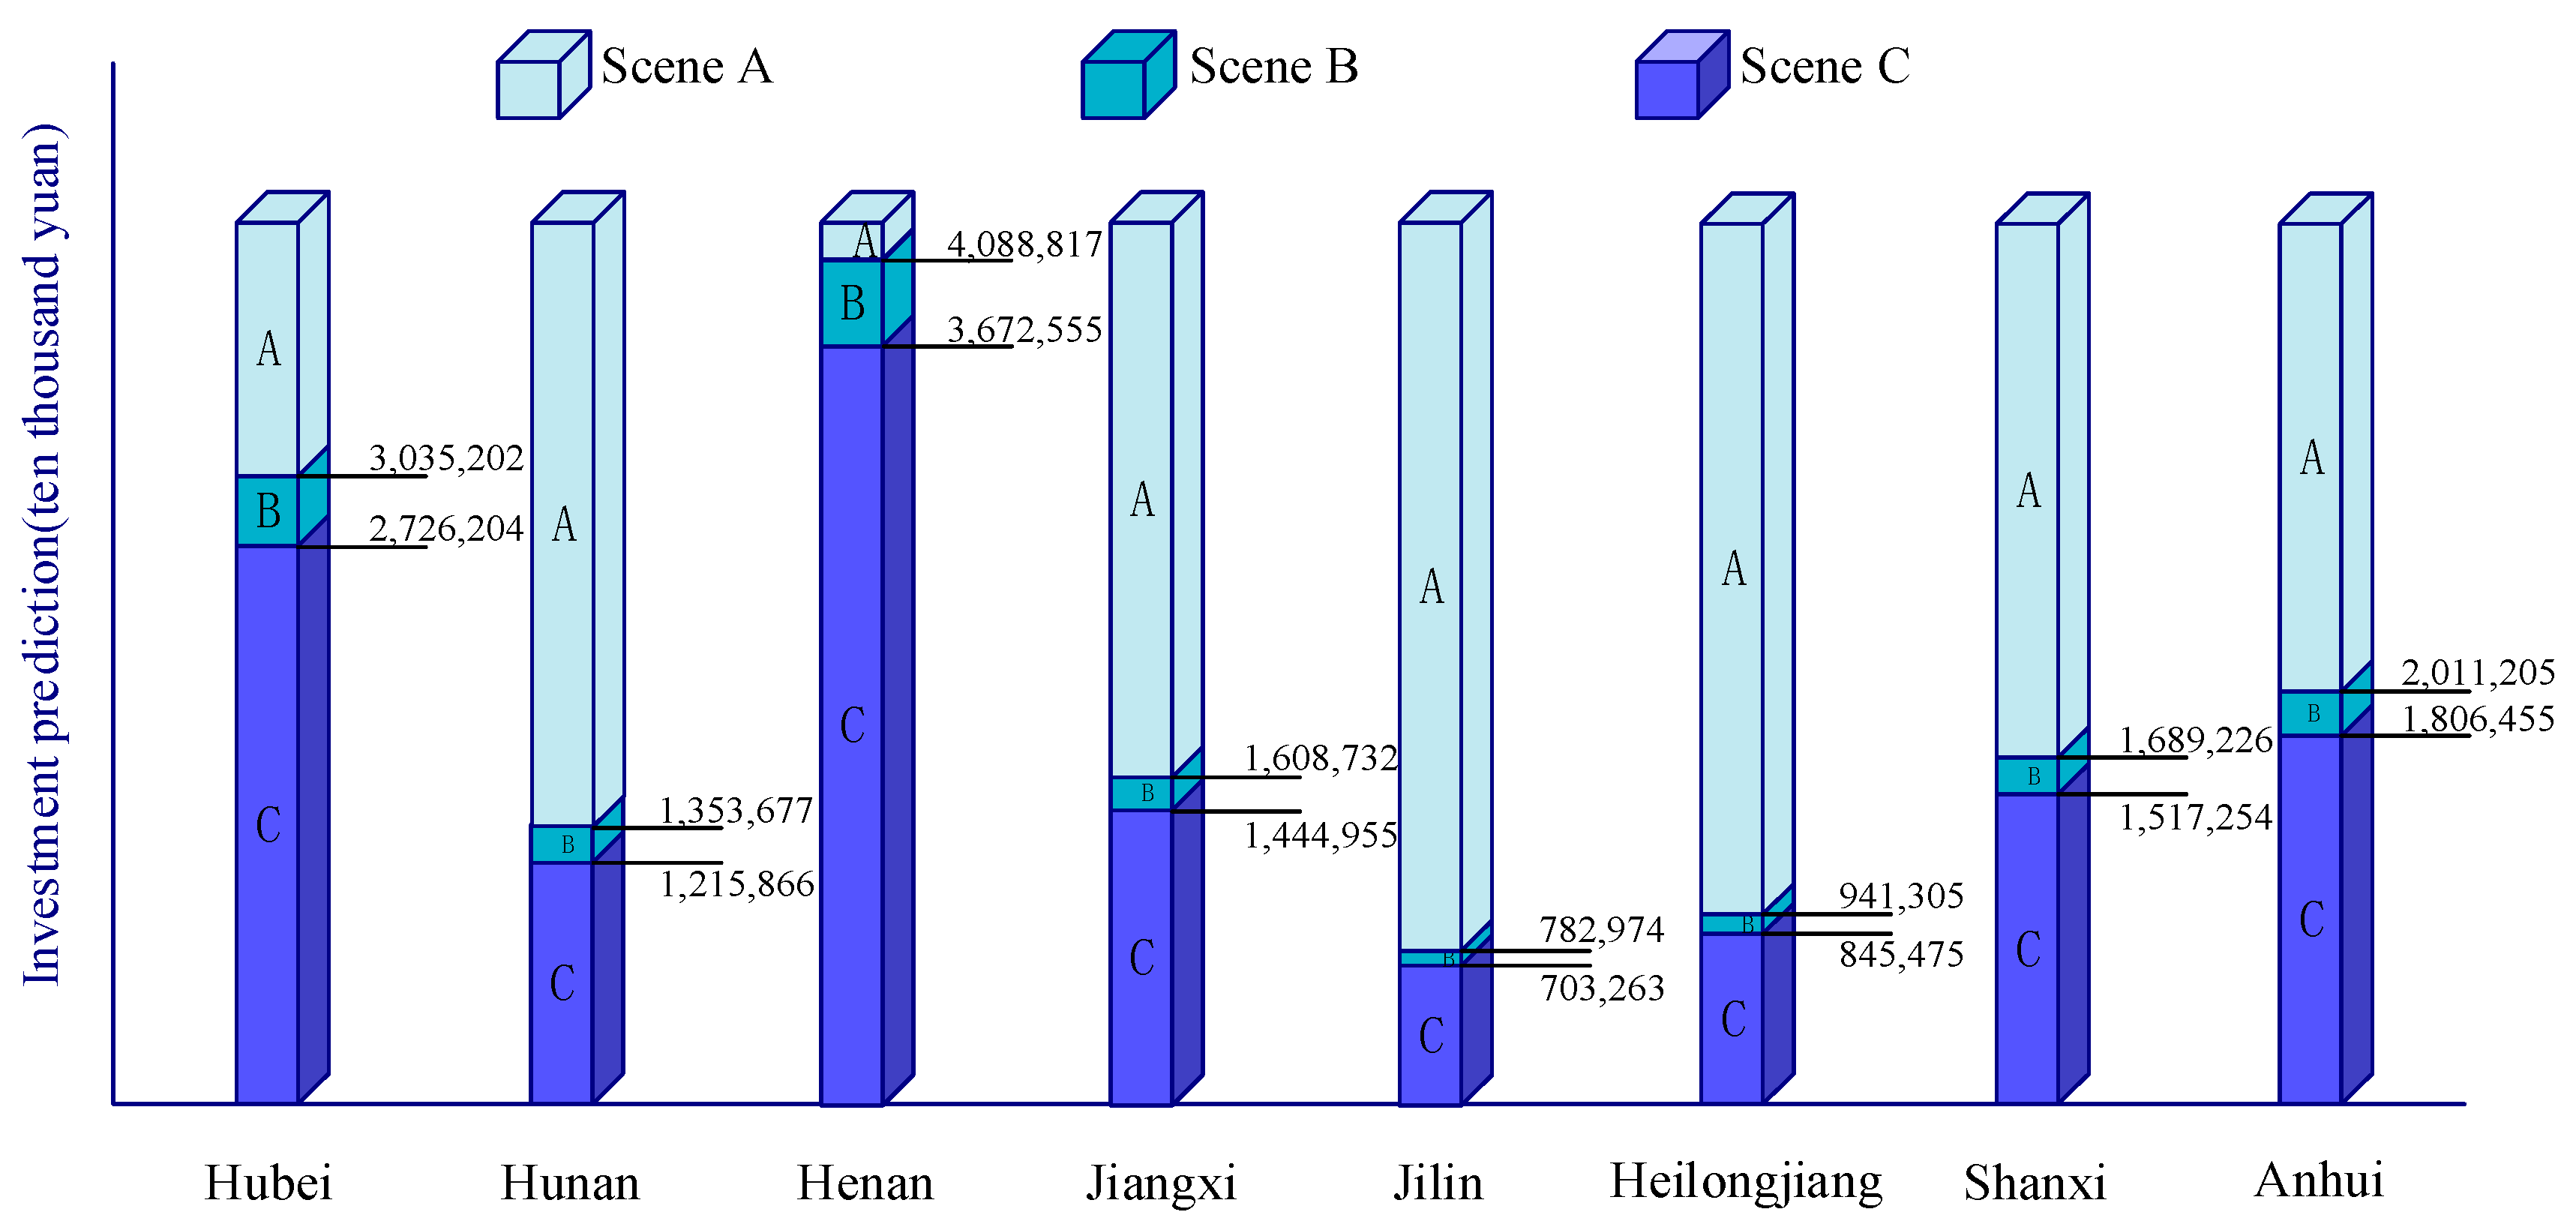
In order to analyze the development demand of electric grid investment, this article sets three scenes of A, B, and C according to the influencing factors of electric grid investment. Scene A is the development situation of electric grid investment at high speed in one region. Scene B is the development situation of electric grid investment at medium speed in one region. Scene C is the development situation of electric grid investment at low speed in one region. We predict the electric grid investment scale of 23 provinces in 2020, according to the relationship between electric grid investment and its influencing factors.
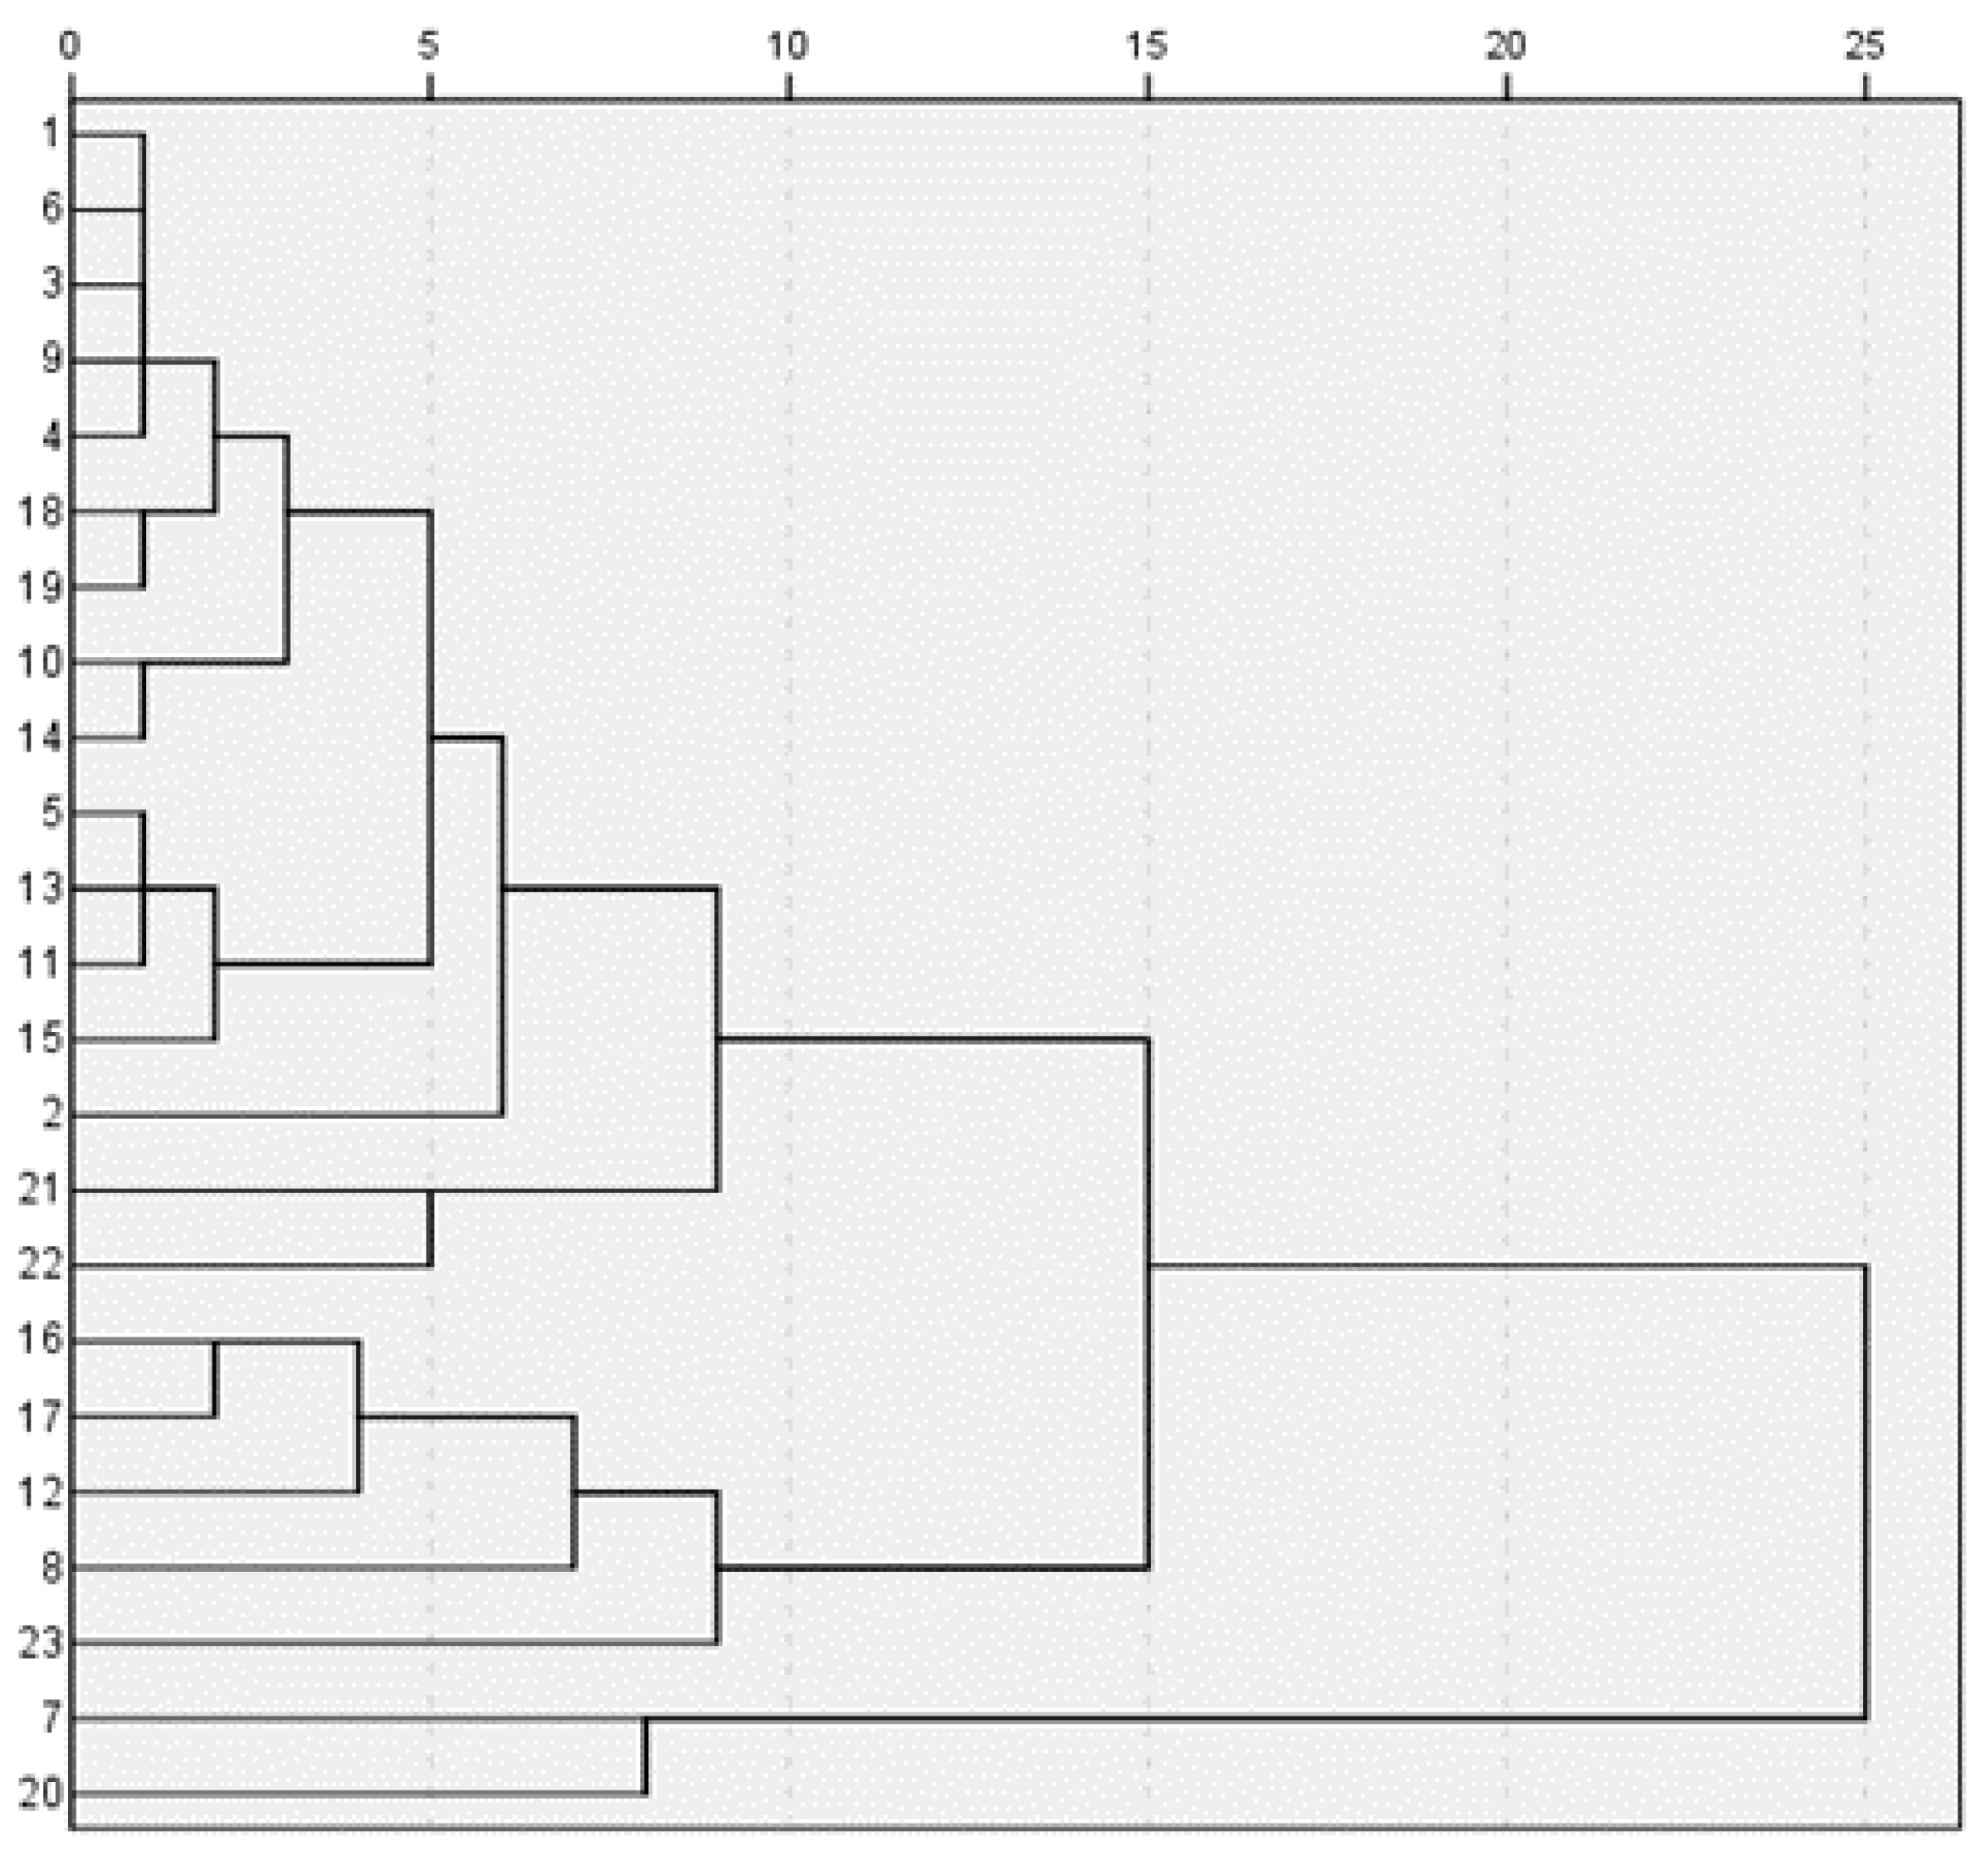
Firstly, the influencing factors of electric grid investment have been identified, include GDP, SEC, and PL. PL has an obvious positive relationship with EGI in Eastern China; GDP has an obvious positive relationship with EGI in Central China; and GDP and SEC have obvious positive relationships with EGI in Western China. Secondly, aiming to define the boundaries of high speed, medium speed, and low speed, we divided the growth rate of 23 provinces in 2012–2016 into three areas by cluster analysis. The dendrograms are shown in followings Figure 1, Figure 2 and Figure 3.
The left figures in the dendrograms represent 23 provinces, and the specific means are shown in Table 9.
From Figure 1, the GDP growth rate of 23 provinces can be divided into three categories: Liaoning belongs to the first category. The second category includes Beijing, Shanghai, Zhejiang, Jilin, Heilongjiang, and Shanxi. All the others belong to the third category. The PL growth rate is classified to three groups. According to Figure 2, we can know that Xinjiang belongs to the first category. The second category includes Chongqing. The others belong to the third category. In Figure 3, the SEC growth rate is classified to three groups. Shaanxi, Xinjiang, Fujian, Jiangxi, and Anhui belong to the first category. The third category includes Tianjin and Qinghai. The others belong to the second category.
Then, referring to the specific average GDP, PL, and SEC growth rate of each province from 2012 to 2016, we can consider GDP growth rate above 8% as high speed, from 5% to 8% as medium speed, and less than 5% as low speed. Similarly, a PL growth rate above 10% is high speed, from 4% to 10% is medium speed, and less than 4% is low speed. An SEC growth rate above 5% is high speed, from 2% to 5% is medium speed, and less than 2% is low speed. The specific scenario design is shown in Table 10.
5.2. Simulation of the Scale of Electric Grid Investment in 23 Provinces
6. Conclusions
This article analyzed the relationship of electric grid investment and GDP, population scale, social electricity consumption, electric installed capacity, and peak load by the panel data of 23 provinces in China from 2004 to 2016. Next, we predicted the development trend of electric grid investment by the scenario analysis method. The panel data analysis includes the computing method of the unit root test, co-integration test, and regression analysis, it can effectively exploit and use the information of sample data, its conclusions are more robust. The scenario analysis method is an effective forecast method. It has no fixed steps, and specific scenario analysis varies by different application fields, data, and technical background. Thus, scenario analysis method is a very important tool in many spheres to find the development trend and avoid decision-making mistakes for managers.
Based on the regional differences of electric grid investment development, this essay can represent, quantifiably, the correlations between electric grid investment and various influencing factors. The analysis results make it possible to estimate electric grid investment in an environment of high uncertainty. So we can obtain sustainability from theory with respect to the scheduling and managing of electric grid investment. Predicting the development trend of electric grid investment can help to perfect further project decision-making processes, and improve management and decision levels of investment projects.
Acknowledgments
This work has been supported by Ministry of Education, Humanities and Social Science Fund (No. 15YJC630058), the Fundamental Research Funds for the Central Universities (No. 2017MS083 and No. 2018ZD14), and the Science and Technology Project of SGCC.
Author Contributions
Jinchao Li and Lin Chen contributed to the conception, design, and computation. Yuwei Xiang collected and interpreted the data. Jinying Li and Dong Peng analyzed the calculation results. All of the authors drafted and revised the manuscript together and approved its final publication.
Conflicts of Interest
The authors declare no conflict of interest.
References
- Ji, L.; Yang, L.; Fei, G. The influencing factors analysis and forecast about construction investment of power grid. China Power Enterp. Manag. 2016, 6, 85–92. (In Chinese) [Google Scholar]
- Zhao, H.; Yang, L.; Li, C.; Ma, X. Research on prediction to investment demand of power grid based on co-integration theory and error correction model. Power Syst. Technol. 2011, 35, 193–198. (In Chinese) [Google Scholar]
- Wei, Z. Research on the Method of Grid Investment Measurement and Software Implementation Based on Grey Theory. Master’s Thesis, University of Electronic Science and Technology of China, Chengdu, China, 2013. (In Chinese). [Google Scholar]
- Xia, H.; Ye, J. Grid Investment Fluctuation Factors and Growth Effect. Power Syst. Technol. 2011, 35, 12–20. (In Chinese) [Google Scholar]
- Shi, X.; Liu, X.; Yao, L. Assessment of instruments in facilitating investment in off-grid renewable energy projects. Energy Policy 2016, 95, 437–446. [Google Scholar] [CrossRef]
- Katja, K.; Jörg, W. Long-term investment in electricity: A trade-off between co-ordination and competition. Util. Policy 2004, 12, 243–251. [Google Scholar]
- Kucsera, D.; Rammerstorfer, M. Regulation and grid expansion investment with increased penetration of renewable generation. Resour. Energy Econ. 2014, 37, 184–200. [Google Scholar] [CrossRef]
- Chen, K.; Li, X.; Huang, K. Reform of transmission-distribution electricity price: Study on the relationship between the price, quantity and investment. Price Theory Pract. 2017, 4, 52–55. [Google Scholar]
- Cambini, C.; Meletiou, A.; Bompard, E.; Masera, M. Market and regulatory factors influencing smart-grid investment in Europe: Evidence from pilot projects and implications for reform. Util. Policy 2016, 40, 36–47. [Google Scholar] [CrossRef]
- Deng, G. Research on Long-Term and Dynamic Relationship between Factors of Power Grid Investment Base on Time Series Analysis. Master’s Thesis, Zhejiang University, Hangzhou, China, 2015. [Google Scholar]
- Hu, B.; Hu, G.; Hu, C.; Qing, S.; Li, M.; Peng, C. Grid infrastructure investment calculation model based on gray prediction. J. Univ. Electron. Sci. Technol. China 2013, 42, 890–894. [Google Scholar]
- Li, W.; Yin, X.; Zhang, Q.; Liu, J. Research and implementation of the informatization investment efficiency of grid enterprise evaluation model based on fuzzy comprehensive evaluation method. In Proceedings of the 2012 Fourth International Conference on Computational and Information Sciences, Chongqing, China, 17–19 August 2012; pp. 396–399. [Google Scholar]
- Zeng, M.; Yan, F.; Tian, K.; Dong, J. Analysis of investment benefit of smart electric grid based on triangular fuzzy numbers. East China Electr. Power 2010, 38, 638–641. (In Chinese) [Google Scholar]
- He, K.; Zeng, M.; Qiao, H. Research on power grid investment optimization model based on system dynamics. Shaanxi Electr. Power 2015, 43, 62–65. (In Chinese) [Google Scholar]
- Zhang, X.; Niu, Y.; Zhao, X. Co-integration Analysis of Electricity Consumption in China. Proc. CSEE 2008, 13, 114–119. [Google Scholar]
- Oliveira, F. The value of information in electricity investment games. Energy Policy 2008, 36, 2364–2375. [Google Scholar] [CrossRef]
- Taliotis, C.; Shivakumar, A.; Ramos, E.; Howells, M.; Mentis, D.; Sridharan, V.; Broad, O.; Mofor, L. An indicative analysis of investment opportunities in the African electricity supply sector-Using TEMBA (The Electricity Model Base for Africa). Energy Sustain. Dev. 2016, 31, 50–66. [Google Scholar] [CrossRef]
- Kim, S.; Park, J.; Lee, H.; Park, G.; Lee, S.; Kim, W.; Yoon, Y. Economic evaluation for generation investment in South Korea electricity market. In Proceedings of the 2009 IEEE Power & Energy Society General Meeting, Calgary, AB, Canada, 26–30 July 2009; pp. 1–5. [Google Scholar]
- Cannistraro, G.; Cannistraro, M.; Cannistraro, A.; Galvagno, A.; Trovato, G. Evaluation on the convenience of a citizen service district heating for residential use. A new scenario introduced by high effiency energy systems. Int. J. Heat Technol. 2015, 33, 167–172. [Google Scholar] [CrossRef]
- Cannistraro, G.; Cannistraro, M.; Cannistraro, A.; Galvagno, A.; Trovato, G. Technical and economic evaluations about the integration of co-Trigeneration systems in the dairy industry. Int. J. Heat Technol. 2016, 34, 332–336. [Google Scholar] [CrossRef]
Figure 1.
The dendrogram of the GDP growth rate in 23 provinces.

Figure 2.
The dendrogram of the PL growth rate in 23 provinces.

Figure 3.
The dendrogram of the SEC growth rate in 23 provinces.

Figure 4.
The predictions of electric grid investment in eastern regions in 2020 (10,000 yuan).

Figure 5.
The predictions of electric grid investment in central regions in 2020 (10,000 yuan).

Figure 6.
The predictions of electric grid investment in western regions in 2020 (10,000 yuan).


Table 1.
The influencing factors of electric grid investment in related papers.
| Author | Influencing Factors | Influencing Factors List |
|---|---|---|
| Ji Liwei, Yang Liping, Fei Gaiying [1] | GDP, industrial structure, power consumption, line loss per unit, power distribution reliability, profit margin, population scale | GDP
Total electricity consumption Installed capacity Profit Population scale Peak load Financial contribution Price index Industrial structure Line loss per unit Power distribution reliability Substation capacity Investment level Regulatory risk Public resistance Lower market concentration Innovation-stimulus mechanisms |
| Zhao Huiru, Yang Lu, Li Chunjie, Ma Xin [2] | GDP, total electricity consumption, power supply volume, power sale quantity, peak load | |
| Wei Zijie [3] | GDP, population scale, substation capacity, total electricity consumption, peak load, increasing amount of power supply unit investment, property/earnings ratio, installed capacity | |
| Xia Huali, Ye Jinshu [4] | GDP, price index, investment level, financial contribution, electric power consumption level | |
| Xunpeng Shi, Xiying Liu, Lixia Yao [5] | Financial incentives, fiscal incentives, elimination of market distortions | |
| Katja Keller, Jorg Wild [6] | Regulatory risk, public resistance | |
| Kucsera, D., Rammerstorfer, M. [7] | Renewable energy installed capacity | |
| Chen, K., Li, X.Z., Huang, K.R. [8] | Price index, total electricity consumption | |
| Cambini C., Meletiou A., Bompard E., Masera M. [9] | Lower market concentration, regulatory incentive, innovation-stimulus mechanisms |
Table 2.
The research methods for influencing factors of electric grid investment in related papers.
Table 2.
The research methods for influencing factors of electric grid investment in related papers.
| Author | Object of Study | Research Methods |
|---|---|---|
| Deng Guojun [10] | Influencing factors of electric grid investment in America | Elastic coefficient method, cointegration theory, HP filtering, VAR model |
| Hu Baichu, Hu Gang, Hu Chaohua, Qing Song, Li Mingwei, and Peng Chao [11] | Grid infrastructure investment | Analytic hierarchy process, gray model |
| Li Wei, Yin Xiudi, Zhang Qianyuan, Liu Jiannan [12] | Informatization investment efficiency of grid enterprise | Fuzzy comprehensive evaluation method |
| Zeng Ming, Yan Fan, Tian Kuo, Dong Jun [13] | Investment efficiency analysis of grid enterprises | Triangular fuzzy number, adjustment factor, fuzzy comprehensive evaluation method |
| He Kelei, Zeng Ming, Qiao Hong [14] | Evaluation of electric grid investment | System dynamics, analog simulation |
| Zhang Xingping, Niu Yuqin, Zhao Xu [15] | Relationship between electricity consumption and fixed investments, per capita disposable income, price level | Granger examination, Vector Error Correction Model |
| Fernando Oliveira [16] | Assumptions of investment in electricity markets and how information influences investment | A dynamic investment game model, the open-loop Cournot model, the Nash value of complete information |
| Constantinos Taliotis, Abhishek Shivakumar, Eunice Ramos, Mark Howells, Dimitris Mentis, Vignesh Sridharan, Oliver Broad, Linus Mofor [17] | Scenarios of power plant investments based on potential for electricity trade and long-term energy planning to develop least cost system configurations | Open Source energy modelling system |
| Sun-Kyo Kim, Jun-Hyung Park, Ho-Chul Lee, Geun-Pyo Park [18] | Method that evaluates the economic efficiency between the investment in electric power generators in an existing monopoly formation and the investment made after reform | Propose a general framework |
| Cannistraro, G., Cannistraro, M., Cannistraro, A., Galvagno, A., Trovato, G. [19] | Evaluation for the replacement of the district heating system with high efficiency heat generators or with heat pumps | Compare costs for heating and hot water supplied by district heating |
| Cannistraro, G., Cannistraro, M., Cannistraro, A., Galvagno, A., Trovato, G. [20] | Evaluation for the technical and economic feasibility of a proposed intervention in the integration of a cogeneration and trigeneration system fueled with natural gas in the north of Italy. | Economic and financial assessments |
Table 3.
Descriptive statistics of the influencing factors.
| Variable | Unit | N | Mean | StDev | Min | Max |
|---|---|---|---|---|---|---|
| GDP index | / | 299 | 111.34 | 2.84 | 97.5 | 117.4 |
| POP | 10,000 people | 299 | 4314.49 | 2584.55 | 539 | 9946.64 |
| SEC | 10,000 kWh | 299 | 16,319,353.5 | 21,166,849.1 | 1,605,033 | 145,844,200 |
| EIC | 10,000 kW | 299 | 3076.34 | 2190.11 | 370.83 | 10,941.79 |
| PL | 10,000 kW | 299 | 1961.83 | 1528.55 | 224 | 8886 |
N (Number) is the number of the analysis example. StDev is the standard deviation.
Table 4.
The results of Pedroni co-integration test.
| Statistic | Prob. | Weighted Statistic | Prob. | |
|---|---|---|---|---|
| Panel v-statistic | –1.972551 | 0.9757 | −4.410807 | 1.0000 |
| Panel rho-statistic | 4.316769 | 1.0000 | 4.225413 | 1.0000 |
| Panel PP-statistic | –6.081687 | 0.0000 | –13.52441 | 0.0000 |
| Panel ADF-statistic | –1.387338 | 0.0827 | –5.235396 | 0.0000 |
| Group rho-statistic | 6.134689 | 1.0000 | ||
| Group PP-statistic | –17.59534 | 0.0000 | ||
| Group ADF-statistic | –3.174253 | 0.0008 |
Table 5.
The estimated results of pooled regression models about electric grid investment of 23 provinces.
Table 5.
The estimated results of pooled regression models about electric grid investment of 23 provinces.
| Variable | Coefficient | Std. Error | t-Statistic | Prob. |
|---|---|---|---|---|
| ln(GDP) | 0.582800 | 0.095145 | 6.125367 | 0.0000 |
| ln(POP) | –0.036786 | 0.060289 | –0.610164 | 0.5422 |
| ln(SEC) | 0.049978 | 0.092376 | 0.541027 | 0.5889 |
| ln(EIC) | 0.003494 | 0.083502 | 0.041849 | 0.9666 |
| ln(PL) | 0.904619 | 0.116268 | 7.780467 | 0.0000 |
| Constant | 2.956670 | 0.961816 | 3.074048 | 0.0023 |
Table 6.
The estimated results of pooled regression models regarding electric grid investment in Eastern China.
Table 6.
The estimated results of pooled regression models regarding electric grid investment in Eastern China.
| Variable | Coefficient | Std. Error | t-Statistic | Prob. |
|---|---|---|---|---|
| ln(GDP) | 0.260678 | 0.164232 | 1.587255 | 0.1157 |
| ln(POP) | 0.023405 | 0.213368 | 0.109694 | 0.9129 |
| ln(SEC) | –0.032222 | 0.116152 | –0.277413 | 0.7820 |
| ln(EIC) | –0.030280 | 0.154517 | –0.195965 | 0.8450 |
| ln(PL) | 0.891828 | 0.157245 | 5.671594 | 0.0000 |
| Constant | 5.981604 | 1.157340 | 5.168407 | 0.0000 |
Table 7.
The estimated results of pooled regression models regarding electric grid investment in Central China.
Table 7.
The estimated results of pooled regression models regarding electric grid investment in Central China.
| Variable | Coefficient | Std. Error | t-Statistic | Prob. |
|---|---|---|---|---|
| ln(GDP) | 0.952669 | 0.151635 | 6.282653 | 0.0000 |
| ln(POP) | 0.386049 | 0.202981 | 1.901897 | 0.0601 |
| ln(SEC) | –0.153487 | 0.431762 | –0.355490 | 0.7230 |
| ln(EIC) | 0.418419 | 0.257140 | 1.627205 | 0.1069 |
| ln(PL) | 0.374573 | 0.410293 | 0.912941 | 0.3635 |
| Constant | 1.136679 | 4.193798 | 0.271038 | 0.7869 |
Table 8.
The estimated results of pooled regression models regarding electric grid investment in Western China.
Table 8.
The estimated results of pooled regression models regarding electric grid investment in Western China.
| Variable | Coefficient | Std. Error | t-Statistic | Prob. |
|---|---|---|---|---|
| ln(GDP) | 0.683244 | 0.271942 | 2.512468 | 0.0136 |
| ln(POP) | 0.019344 | 0.114745 | 0.168580 | 0.8665 |
| ln(SEC) | 0.924933 | 0.402610 | 2.297341 | 0.0237 |
| ln(EIC) | –0.131614 | 0.256927 | –0.512263 | 0.6096 |
| ln(PL) | 0.331801 | 0.419268 | 0.791382 | 0.4306 |
| Constant | –6.788440 | 3.989523 | –1.701567 | 0.0920 |
Table 9.
The means of the figures in three dendrograms.
| Number | Province | Number | Province | Number | Province |
|---|---|---|---|---|---|
| 1 | Beijing | 9 | Hubei | 17 | Shaanxi |
| 2 | Shanghai | 10 | Hunan | 18 | Sichuan |
| 3 | Jiangsu | 11 | Henan | 19 | Chongqing |
| 4 | Zhejiang | 12 | Jiangxi | 20 | Qinghai |
| 5 | Liaoning | 13 | Jilin | 21 | Ningxia |
| 6 | Shandong | 14 | Heilongjiang | 22 | Gansu |
| 7 | Tianjin | 15 | Shanxi | 23 | Xinjiang |
| 8 | Fujian | 16 | Anhui |
Table 10.
The scenario design regarding the development demand of electric grid investment in 23 provinces.
Table 10.
The scenario design regarding the development demand of electric grid investment in 23 provinces.
| Regions | Influencing Factor | Scene A | Scene B | Scene C |
|---|---|---|---|---|
| Beijing, Tianjin, Liaoning, Shanghai, Jiangsu, Zhejiang, Fujian, Shandong | PL | growth rate > 10% | 4% ≤ growth rate ≤ 10% | growth rate < 4% |
| Shanxi, Jilin, Heilongjiang, Anhui, Jiangxi, Henan, Hubei, Hunan | GDP | growth rate > 8% | 5% ≤ growth rate ≤ 8% | growth rate < 5% |
| Sichuan, Chongqing, Shaanxi, Gansu, Ningxia, Qinghai, Xinjiang | GDP | growth rate > 8% | 5% ≤ growth rate ≤ 8% | growth rate < 5% |
| SEC | growth rate > 5% | 2% ≤ growth rate ≤ 5% | growth rate < 2% |
© 2018 by the authors. Licensee MDPI, Basel, Switzerland. This article is an open access article distributed under the terms and conditions of the Creative Commons Attribution (CC BY) license (http://creativecommons.org/licenses/by/4.0/).
Share and Cite
MDPI and ACS Style
Li, J.; Chen, L.; Xiang, Y.; Li, J.; Peng, D. Influencing Factors and Development Trend Analysis of China Electric Grid Investment Demand Based on a Panel Co-Integration Model. Sustainability 2018, 10, 256. https://doi.org/10.3390/su10010256
AMA Style
Li J, Chen L, Xiang Y, Li J, Peng D. Influencing Factors and Development Trend Analysis of China Electric Grid Investment Demand Based on a Panel Co-Integration Model. Sustainability. 2018; 10(1):256. https://doi.org/10.3390/su10010256
Chicago/Turabian StyleLi, Jinchao, Lin Chen, Yuwei Xiang, Jinying Li, and Dong Peng. 2018. "Influencing Factors and Development Trend Analysis of China Electric Grid Investment Demand Based on a Panel Co-Integration Model" Sustainability 10, no. 1: 256. https://doi.org/10.3390/su10010256
Note that from the first issue of 2016, this journal uses article numbers instead of page numbers. See further details here.