Fit between Organizational Culture and Innovation Strategy: Implications for Innovation Performance

1
School of Business Administration, Shanghai Lixin University of Accounting and Finance, Shanghai 201209, China
2
School of Finance, Shanghai University of Finance and Economics, Shanghai 200433, China
3
Business School, Sichuan University, Chengdu 610065, China
*
Author to whom correspondence should be addressed.
Sustainability 2018, 10(10), 3378; https://doi.org/10.3390/su10103378
Submission received: 22 August 2018
/
Revised: 17 September 2018
/
Accepted: 18 September 2018
/
Published: 21 September 2018
(This article belongs to the Collection Sustainable Innovation in Organizations for Improving Decisions)
Abstract
:Although prior studies have indicated the interrelationships between specific types of innovation strategy and specific elements of organizational culture, few studies simultaneously evaluate the relationship between the two multi-dimensional constructs in holistic perspective. Based on configuration theory, we conceptualize fit as ‘profile deviation’, and investigate the fit between an organization’s culture and its innovation strategy. Data were collected from 183 Chinese organizations. We examine the hypothesis that greater fit between organizational culture and innovation strategy encourages superior innovation speed and innovation quality. Our results provide evidence that in the group of organizations exhibiting either exploratory or exploitative innovation strategy, the more similar the organizational culture configurations are to those of the top performers, the higher their innovation speed and innovation quality are. In the group of organizations exhibiting ambidextrous innovation strategy, the fit between organizational culture and innovation strategy is insignificantly associated with innovation speed and innovation quality. Implications for applying the culture–strategy fit in innovation management are discussed.
1. Introduction
Innovation strategy that outlines how organizations intend to achieve their innovative goals is critical for organizations to attain competitive advantage [1]. However, organizations have increasingly realized that it is easier to formulate innovation strategy than how to implement it. The way organizations sense and behave towards the environment has been identified as an important cause of difficulty in implementing innovation strategy [2]. The literature suggests that to enable innovation strategy implementation and achieve superior innovation performance, organizations should combine their shared norms and values with the strategy requirement [3]. This indicates that the fit between innovation strategy and organizational culture is critical for effective and efficient implementation of innovation strategy [4]. However, many organizations are still facing the difficult challenges of managing organizational culture in ways that successfully enable innovation strategy implementation [5]. Although this issue is of great theoretical and practical importance, the current understanding about how organizational culture should be managed to facilitate innovation strategy implementation and how this affects innovation performance is still limited.
Investigating this complex theoretical and managerial problem presents two significant challenges. First, organizational culture and innovation strategy have been widely treated as multidimensional phenomena that comprise different but interconnected elements [6,7]. Although past studies have posited interrelationships between particular innovation strategic types and particular elements of organizational culture, few studies have simultaneously evaluated the relationship between the multi-dimensional constructs from a holistic perspective [8,9]. As Burton et al. [5] stated, “largely missing in the prior work is the study of the interrelationships between organizational culture and strategy, and how these factors interact to affect firm performance”. Therefore, evaluating the culture–strategy fit in holistic terms requires simultaneous assessment of the relationships among the variables that comprise organizational culture and innovation strategy.
Second, successfully managing organizational culture to implement innovation strategy involves reconciling multiple and often conflicting contingencies. For example, some studies argued that organizational culture can strengthen the relationship between innovation strategies and organizational performance [10], while others argued that organizational culture may negatively or not influence the strategy–performance relationships [11]. These conflicting findings make the identification of correct configuration of organizational culture needed to implement a particular innovation strategy extremely difficult [9]. Therefore, how to assess whether all the elements of organizational culture are managed in ways that enable the implementation of a particular innovation strategy is important.
In the current study, we draw on configuration theory to develop a conceptual model that links various elements of organizational culture managed in ways that enable innovation strategy to reap the value of innovation speed and innovation quality. This study makes two main contributions. First, we empirically examine the interrelationships between organizational culture and innovation strategy in holistic perspective. Our findings provide empirical insights about the conceptualization of the fit between organizational culture and innovation strategy. Although organizational culture and innovation strategy are important constructs in organization literature, little is known about the interrelationship between the two multi-dimensional constructs from configuration theory [4]. Hence, the present study contributes to configuration theory literature by helping to ‘build out’ the set organizational phenomena that should be included in configurational theorizing. Second, we examine the innovation performance impact of culture–strategy fit. Our results provide empirical support for previously untested argument on the relationship between culture–strategy fit and innovation performance [12]. Therefore, our finding enriches the innovation literature that the fit between organizational culture and innovation strategy is an important driver of strategy implementation success. Importantly, our finding suggests the need for making innovation strategy decisions to develop a holistic assessment of organizational culture characteristics.
The rest of the study is organized as follows. In the next section, we mainly conceptualize exploratory and exploitative innovations as the specific components of innovation strategy based on the innovation literature [7], and adopt the competing values framework to define clan, adhocracy, hierarchical, and market cultures as the specific components of organizational culture [13]. Furthermore, we apply configuration theory to define the fit between organizational culture and innovation strategy. In Section 3, we empirically examine the innovation performance implications of the culture–strategy fit. Section 4 describes the empirical research design and data analysis. Section 5 shows the fit analytic process and hypotheses testing results. Finally, implications and issues for future research are discussed.
2. Literature Review
2.1. Innovation Strategy
Innovation strategy refers to how firms turn to new product or technology development to survive rapid market changes [14]. In the current market, organizations normally face the challenge of reconciling various resource requirements to respond to market changes and competition [15]. An innovation strategy could help the organization determine the configuration of existing resources, products, processes, and systems to adapt to the market. Meanwhile, it guides the organization in making appropriate decisions on which work and functions should be made in the future market [14].
Organizations are required to develop various strategies to explore new opportunities and exploit existing capabilities simultaneously [16]. Accordingly, the literature proposed that the central component of innovation strategy is the relative emphasis placed on exploitative innovation versus exploratory innovation [16]. In this view, many scholars have identified exploratory and exploitative innovation strategies as fundamental types of innovation strategy [7,16]. They argued that because of market dynamics and organizational resource constraints, extending the understanding on the ways organizations shift between exploratory and exploitative innovation strategies is important and necessary [17].
A wide range of management literature has highlighted the distinction between exploration and exploitation. It is suggested that “exploration implies firm behaviors characterized by search, discovery, experimentation, risk taking and innovation, while exploitation implies firm behaviors characterized by refinement, implementation, efficiency, production and selection” [18] (p. 481). In this view, organizations with exploratory innovation strategy emphasize offering new designs, creating new markets, and developing new distribution channels to meet the changed needs of emerging customers or markets [19]. In contrast, organizations with exploitative innovation strategy would actively engage in broadening existing knowledge and skills, improving established designs, expanding existing products and services, and increasing efficiency of existing distribution channels to respond to market change [19].
Because exploratory and exploitative innovations compete for resources in organizations, a tension exists between exploratory and exploitative innovation strategies [16]. Under this condition, organizations need to make tradeoffs or synergies between exploratory and exploitative innovation strategies [16,18]. The theoretical and empirical evidence further indicated that too little of either exploration or exploitation would reduce performance [20]. Accordingly, scholars have realized the benefits of balancing exploratory and exploitative innovations [18]. They suggested that an organization should simultaneously invest and balance both exploratory and exploitative innovations to achieve optimal performance [21].
2.2. Organizational Culture
Organizational culture involves the system of shared values, beliefs, and assumptions that help individuals and groups to function within organizations [22]. Through rituals, routines, and managerial values, organizational culture could shape employee behavior and affect an organization’s investment and resource allocation decisions [23]. To explore the role of organizational culture in improving innovation performance, scholars have proposed several alternative ways to categorize organizational culture, such as relationship- and transaction-oriented culture (e.g., [24]) and focus- and control-oriented culture (e.g., [25]). In the current research, we adopt the framework the Competing Values Model (CVM) proposed by Cameron and Quinn [13] to investigate organizational culture.
The reasons for choosing the CVM to study organizational culture are as follows. First, the “measures of organizational culture that directly or indirectly assess the CVM have been administered in over 10,000 organizations globally within the following academic disciplines: management, marketing, supply-chain management, accounting, social services, hospitality, and health care” [26] (p. 678). Second, the CVM emphasize the problems of organizational change which is highly relevant to understanding innovation [9]. Third, the “CVM reveals the complexity of value orientations and allows the comparison of value orientations within organizations. It thus is regarded as an appropriate model for organizational culture studies conducted in the context of developing economies with great evolutionary dynamics” [6] (p. 375). Indeed, Chinese organizations remain in a developmental stage and constantly change their business scopes and scales, which make them embrace competing and conflicting values to cope with a highly volatile environment [27]. Specifically, during the transition process of China, Chinese organizations, especially the state-owned firms, have evolved from stability and control toward more autonomy in their operations. The market transformation process further makes these organizations not only pay attention to internal operations but also to the external market [28]. The CVM would be helpful to explore the conflicting values in organizations operating in China.
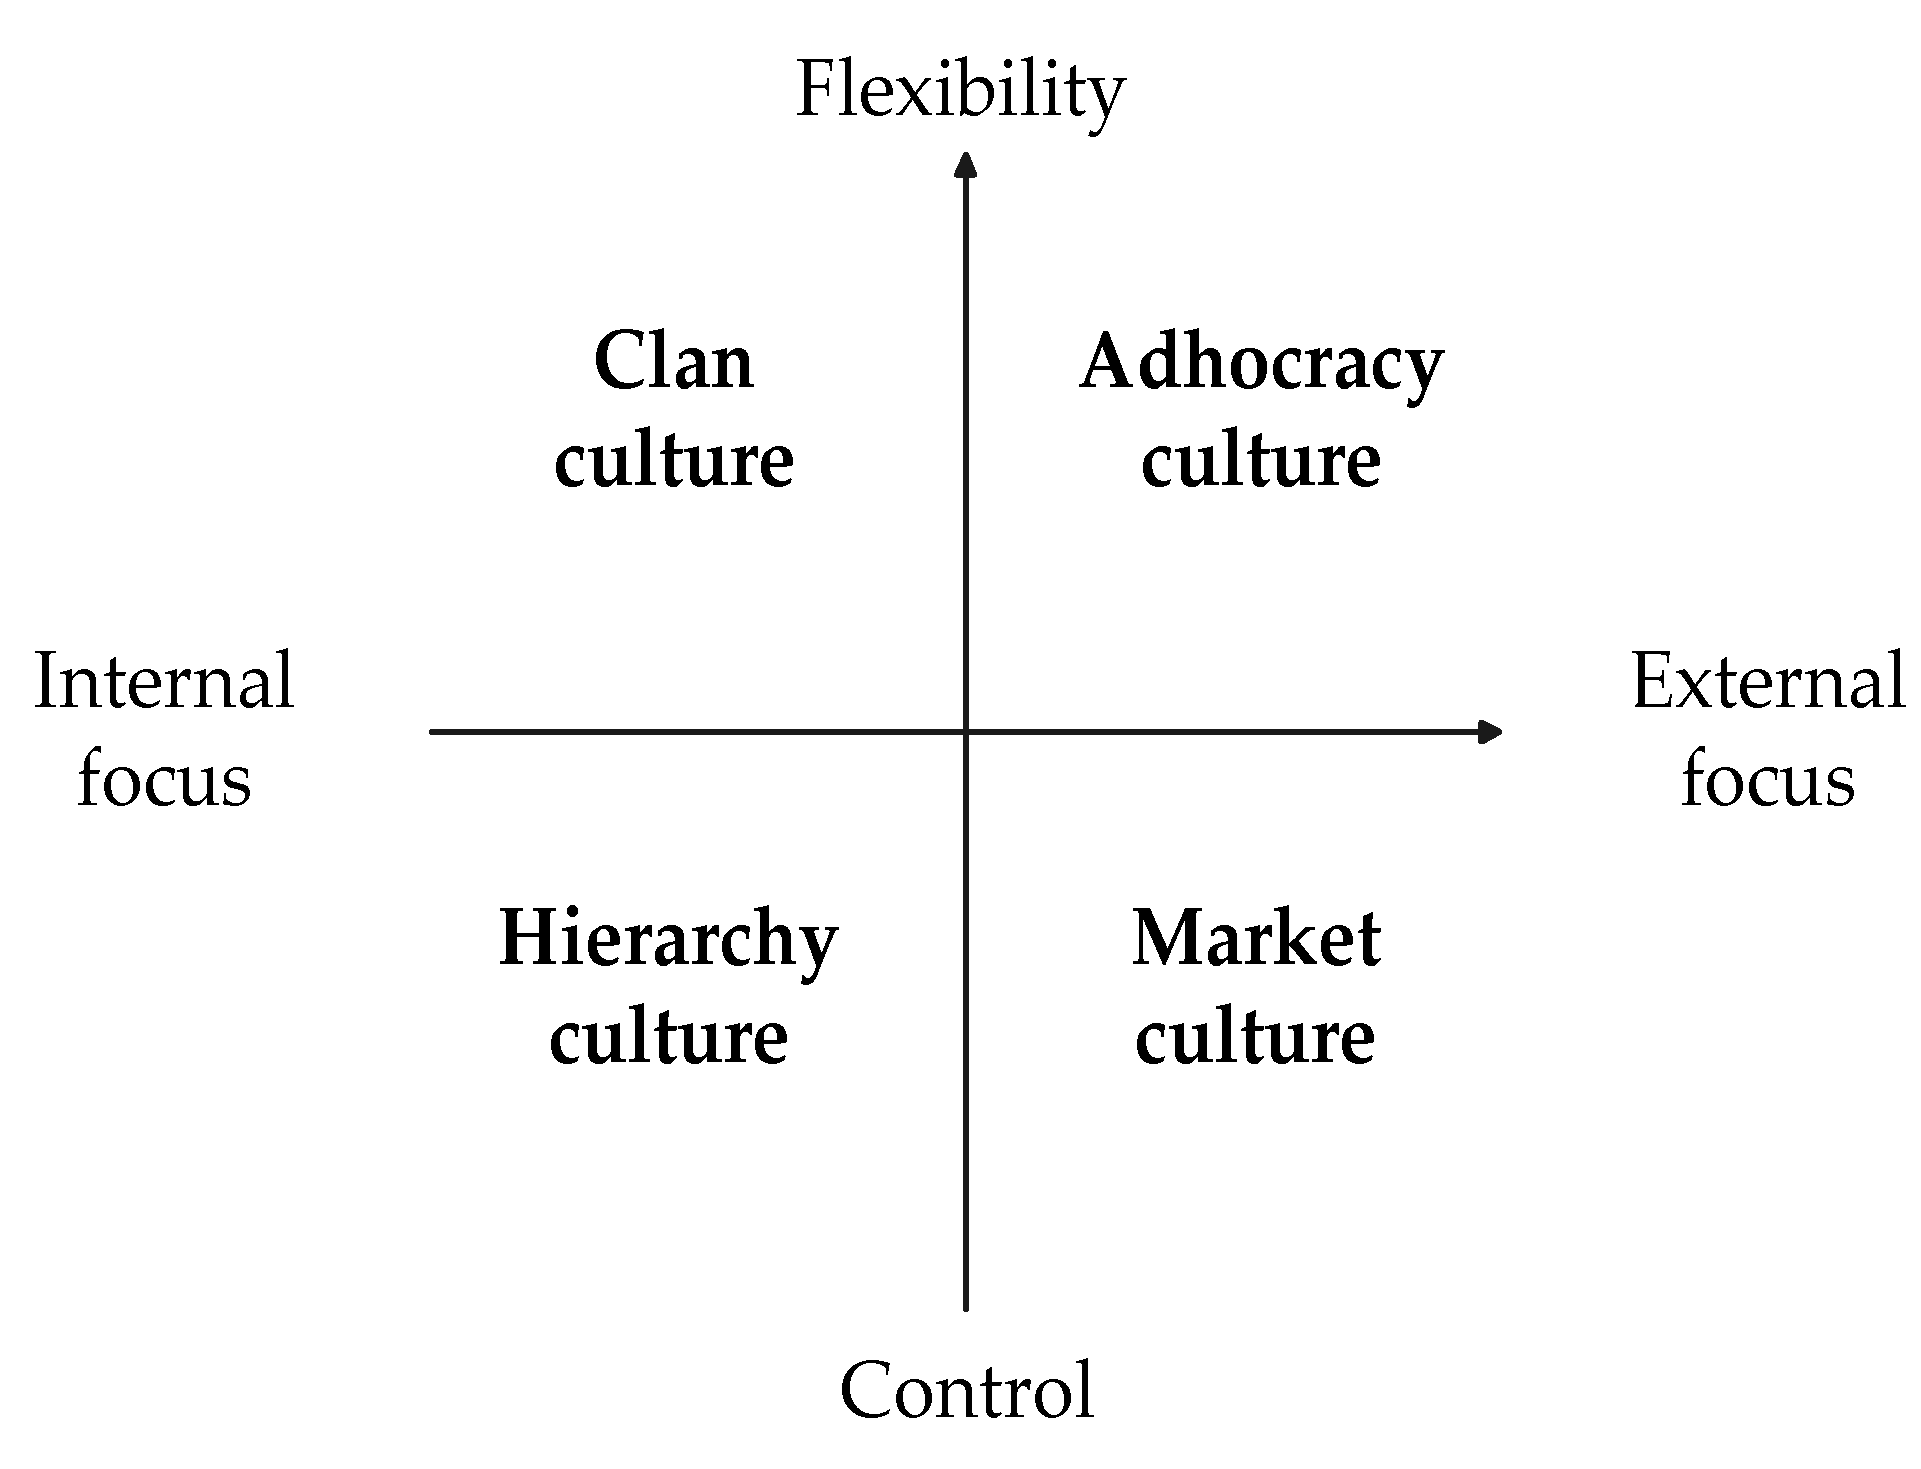
The CVM is characterized by the dimensions of flexibility/control and internal/external [13]. The flexibility orientation values empowerment, flexibility, and spontaneity, while the control orientation emphasizes order, efficiency, and achievement. Comparably, an internal focus emphasizes the development of people and systems within the organization, while an external focus stresses external positioning and interactions with the environment [6]. As Figure 1 shows, the two dimensions categorize organizational culture into the types of adhocracy, clan, market, and hierarchy culture.
Adhocracy culture concentrates on flexibility and is externally orientated, with emphasis on creativity, entrepreneurship and risk taking [9]. Clan culture is flexibility oriented and internally focused. Organizations with this culture are characterized by teamwork, employee involvement, and corporate commitment to employees [9]. Market culture is control oriented and externally focused. This culture values productivity and competitiveness, but has low levels of trust, morale, and resistance to change [5]. Hierarchical culture is control oriented and internal focused. This culture focuses on uniformity, efficiency, and close adherence to rules and regulations [6]. As Deshpandé et al. [29] contended, “these culture types are modal or dominant ones rather than mutually exclusive ones” (p. 26). This notion indicates that “a high rating on one dimension (e.g., internal orientation) does not exclude high rating at the other end (e.g., external orientation)” [30] (p. 525).
2.3. Innovation Performance
Both effectiveness and efficiency have been presented as the two important dimensions of organizational performance [31]. Firms make important trade-off decisions in emphasizing either effectiveness or efficiency in their innovation strategy and may make similar trade-offs in their organizational culture [5]. Differentiating the two dimensions of innovation performance could help understand the influence of the fit holistically, which differs from previous studies that focus either on a specific aspect of innovation performance or mix different aspects of performance at an aggregate level.
In the innovation literature, scholars have proposed innovation speed and innovation quality to represent efficiency and effectiveness of innovation, respectively [32]. Innovation speed is the important indicator of innovation efficiency, which presents the quickness of the organization to generate novel ideas, launch and develop new products, introduce new processes, and derive new problem-solving methods compared with key competitors [33]. Innovation quality is the key indicator of innovation effectiveness, which reflects newness and creativity of new ideas, products, processes, practices, and management of the organization [34]. Chinese organizations are increasingly challenged to meet the demands for efficiency and effectiveness because China is transforming itself towards a market economy. Specifically, because of rapid internal market transformation and unprecedented globalization, Chinese organizations are confronted with an increasing market competition and opportunity [35]. On one hand, Chinese market is becoming highly competitive and dynamic. To respond to quick changes of market demand, organizations need to create and develop new product and service quickly [36]. On the other hand, market economics reform is making Chinese market and customers become mature. More customers expect to acquire high-quality products and services. Under this condition, providing creative products and offering attractive solutions to the market is becoming key for the survival and development of Chinese organizations in saturating the existing market and expanding the emerging market [37]. Given the various focus of innovation speed and innovation quality, we develop separate hypotheses for each of the two innovation performance variables.
2.4. Configuration Theory and Defining the Fit
The existing innovation strategy research has mostly focused on traditional contingency theory to investigate the fit between innovation strategy and the contingency factors, such as organizational structure [38,39] and market environment [40,41], in improving organizational performance. However, these available research approaches are not well suited to deal with the configuration involving complex multi-dimensional constructs [42]. Under this condition, innovation scholars have increasingly recognized that configuration theory would be helpful for exploring the role of the fit between multiple dimensions of innovation strategy and organizational culture in improving innovation performance outcomes. Configuration theory may provide the opportunity to enrich knowledge on ‘fit’ across multi-dimensional constructs that cannot be reached by traditional methods such as interactions or the contingency theory [39].
Configuration theory focuses on the premise that for each set of strategic characteristics, an ideal set of organizational characteristics exists for organizations to be superior performing [42]. The configuration of organizational characteristics associated with superior performance is called as an ideal profile, because the complex ‘gestalts’ of multiple, interdependent, and mutually reinforcing organizational characteristics enable organizations to achieve their strategic goals [39]. Accordingly, configuration theory posits that higher performance originates from the fit or alignment among the relevant strategic characteristics and organizational characteristics [43,44]. This theory has been widely used to assess complex, multidimensional phenomena implied in alignment or fit relationships in a way that is more consistent with the holistic perspective than traditional approaches, such as interactions or contingency theory [45].
Fit has been conceptualized and measured in various ways in academic research. For example, Venkatraman [46] uses “fit as covariation” approach and Olson et al. [38] employ “fit as moderation” approach. Consistent with configuration theory-based studies (e.g., [47]), we conceptualize and assess fit as ‘profile deviation’. The ‘profile deviation’ approach is appropriate for this study because of two reasons. First, this approach is often used to test fit among multidimensional variables, and examine its impact on a criterion variable such as performance simultaneously [48]. Second, this approach assesses fit in ways that are more consistent with the holistic framing of organizational culture and innovation strategy than traditional approaches such as interactions or contingency theory [43].
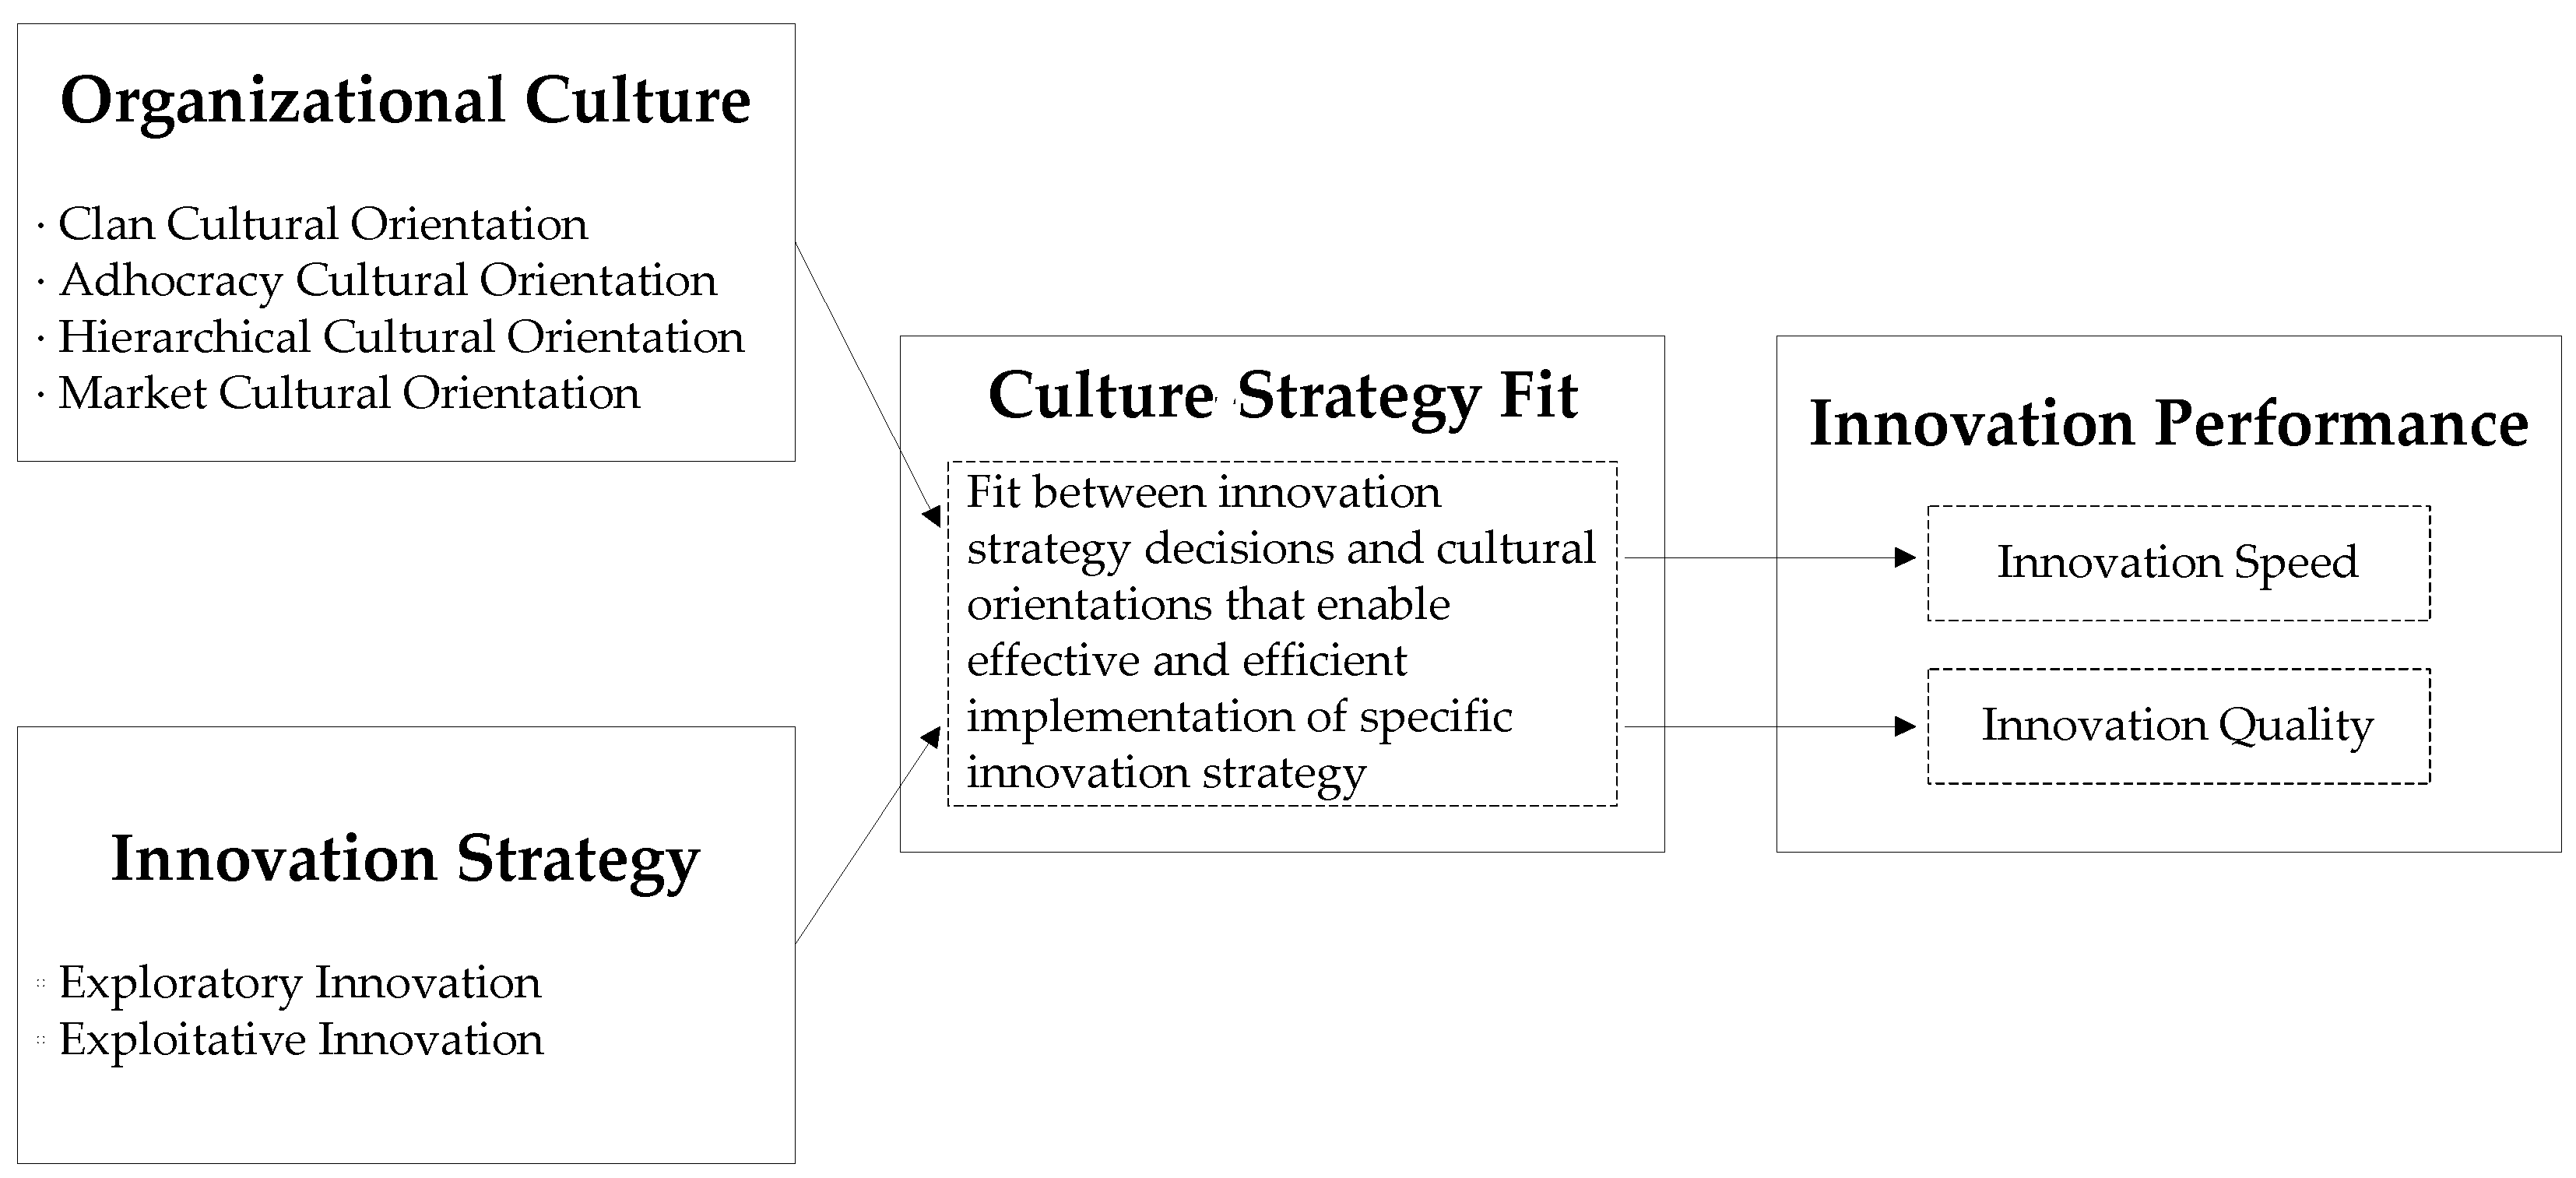
The ‘profile deviation’ approach views the fit between innovation strategy and organizational culture as the degree to which organizational culture characteristics differ from those of an ideal profile in implementing a particular innovation strategy. The existing literature indicates that certain characteristics of organizational culture may be appropriate for executing a particular innovation strategy [5]. However, studies that can translate theoretical statements into precise numerical estimates across multiple dimensions of variables are limited [49]. To address this issue, the ‘profile deviation’ approach advocates the assessment of fit by using empirically derived ideal profiles [39]. This approach identifies higher performing organizations in each innovation strategic type, and calibrates organizational cultures of these organizations as an ideal profile for the implementation of an innovation strategy (e.g., [38]). These organizations are considered to have ideal profiles because their higher performance indicates their ability to configure or align their organizational culture to support their strategic behavior (e.g., [5]). In sum, our research question pertains to the fit between organizational culture and innovation strategy. As shown in Figure 2, the current research tries to investigate the fit between four orientations of organizational culture and two types of innovation strategy, and to test the influence of the fit on innovation speed and innovation quality.
3. Hypotheses Development
The fit between organizational culture and innovation strategy is desirable to achieve superior innovation performance (e.g., [50]). Organization theorists have suggested that organizational culture and innovation strategy are intimately connected. The choice of innovation strategy reflects desired behaviors of managers and employees within an organization [51]. In the implementation of the given innovation strategy, organizations must create an appropriate culture that fosters innovation strategy by ensuring employee skills, providing incentives, and removing obstacles [52]. The different emphases on exploratory or exploitative innovation strategy require different support of cultural values and orientations, and thus, the implementation of different innovation strategies needs different configurations of cultural characteristics. For example, exploratory innovation strategy is more likely to embrace flexible cultural values, whereas exploitative innovation strategy may emphasize on control and stability values [9].
Following the above ideas, we propose that the degree to which an organization’s culture and innovation strategy are aligned is likely to have an important effect on innovation speed and innovation quality. Specifically, as the important indicator of efficiency, innovation speed refers to the extent to which an organization can develop and implement new products and processes quicker than competitors [53]. Configuration theory indicates that for efficiency-maximizing organizations of each innovation strategic type, an ideal organization culture exists in which the configuration of organizational culture enables the implementation of given innovation strategy in a way that leads to superior innovation speed [39]. Specifically, when innovation strategy and organizational culture are aligned, organizational strategic focus and employees’ shared values will be in fit. Such a fit could facilitate employees adopting intended manners to implement innovation strategy, which would lower behavioral barriers among employees [54,55]. This can speed up responses to customer requirements by enhanced knowledge sharing or transfer [56], reinforcing shared understanding [54] and resolving conflict [51].
For example, by documenting processes in detail and providing information that employees need for task fulfillment, hierarchy culture can fit with exploitative innovation strategy to accelerate operational processes for meeting customer requirements [57]. Similarly, by emphasizing the creation and maintenance of expertise among workplace [58], clan culture could fit with exploitative innovation strategy based on teamwork and employee involvement, which can improve efficiency of innovative activities. In addition, by accumulating knowledge about the opportunities that appear in the market, adhocracy culture could be aligned with exploratory innovation strategy to adapt to a changing environment, thereby ensuring the timeliness of new product launches [12]. Similarly, market culture could be aligned with exploratory innovation strategy by increasing employees’ willingness to embrace new and helpful information from outside sources, which could reduce the cycle of new product development [12].
Conversely, when the requirements of innovation strategy are inconsistent with organizational culture, employees are less likely to engage in behaviors required to implement a planned innovation strategy [59]. The lack of fit may lead employees to resistant implementing innovation strategy because of the conflict of values and norms (e.g., [60]). The resistance would force organizations to spend more time to introduce innovation strategy, and to persuade employees to accept the strategy [51]. Under this condition, organizations would not easily implement a given innovation strategy, thereby losing competitive advantage of attaining quicker response to new product development than their competitors (e.g., [61,62]). In sum, we hypothesize that:
Hypothesis 1 (H1).
The greater the fit between an organization’s innovation strategy and its organizational culture, the greater innovation speed.
From the effectiveness perspective, the literature highlights the need to focus on quality [32]. Innovation quality, which represents the degree to which a product satisfies customer requirements, is often described by variables, such as amount, effectiveness, features, reliability, costs, complexity, innovation degree, and value to the customer [32]. Fit between innovation strategy and organizational culture should be positively associated with innovation quality. Specifically, configuration theory has argued that the effectiveness values achieved by organizations should be greater when an organization’s culture fits well with its strategy [39]. The culture–strategy fit allows organizations to invest few resources in promoting intra-organizational communication and developing control systems (e.g., [4]), which may increase the effectiveness of resource utilization.
Moreover, the culture–strategy fit ensures employees to have strong organizational commitment when their organization implements innovation strategy [63,64], which is essential for improving innovation quality [65]. For example, adhocracy culture emphasizes flexibility and autonomy of employees [12]. Aligning this culture with exploratory innovation strategy could promote employees’ conformity to explore ideas flexibly and independently, which may increase the novelty of product development [66]. Similarly, clan culture can fit with exploratory innovation strategy based on its focus on flexibility, which would be conducive to innovation quality. In addition, by focusing on change in the market—such as customer demands, the fit between market culture, and exploratory innovation strategy—organizations could better gather market information and deeply understand customer demands, which is helpful for providing creative products and offering attractive solutions to the market [12]. Hierarchical culture focuses on employees’ desire for security and emphasizes adherence to given procedures, which are necessary for implementing exploitative innovation strategy [5]. In this event, the cost burden of new product development can be met, and reliable and standardized production with minimal variation or defects can be achieved [65]. Therefore, we propose the following hypothesis.
Hypothesis 2 (H2).
The greater the fit between an organization’s innovation strategy and its organizational culture, the greater innovation quality.
4. Method
4.1. Sample
A questionnaire survey was conducted in China to collect data. We chose to conduct the survey in China because this country is a very important manufacturing base in the world and plays as a powerhouse for global economics [67]. More multinational business organizations are trying their best to operate their businesses alone or collaboratively in China, and more Chinese business organizations actively engage in international business and invest in R&D to become the forefront of innovation [68]. As such, China has been increasingly treated as an ideal setting to conduct innovation research.
To make our survey feasible, we collaborated with a Chinese institution, which is famous for executive training programs, such as training programs on innovation and culture. This institution provided a sampling pool that included 236 business organizations. The sample frame covered a range of manufacturing and service industries, including chemicals, machinery, trade, financial services, and so on. From each of these organizations, one senior executive who had attended the institution’s training programs was chosen as a key informant. One senior executive from each of the included organizations was identified as the respondent because of their control over all activities concerning innovation and their knowledge of the overall strategies in their organizations [69]. Data were obtained by key informant technique, which is consistent with prior studies [6]. A self-administered survey was used to collect data on senior executives’ perceptions of the five constructs—namely, organizational culture, exploratory innovation, exploitative innovation, innovation speed, and innovation quality.
A total of 236 questionnaires were sent to senior executives in the identified business organizations. The respondents were informed that participation in the survey was voluntary and confidential. To encourage response, we made follow-up phone calls and sent reminder emails after we sent out the questionnaires. Finally, we obtained 183 useful responses, representing a response rate of 77.5%. Among the 183 respondents, 74.9% were males. The age of the business organizations had an average of 11.2 years. In terms of size, 15.3% of the organizations have an employee base of between 1 and 100, 26.2% between 101 and 500, 17.5% between 500 and 1000, and the remaining 41.0% have over 1000.
4.2. Measures
We developed the instruments based on previously validated measures. All the items in the questionnaire were measured by using a five-point Likert scale from ‘strongly disagree’ to ‘strongly agree’. Given that the current study was to be conducted in China, we translated the instrument into Chinese after completing the English version. Specifically, we first translated the original English questionnaire to Chinese through a committee and then back-translated it to English [70]. Any conflict was discussed by the translators until agreement was reached. This method ensured the equivalence of meaning between the English and Chinese versions. Three scholars from the areas of innovation and organizational culture were invited to review the questionnaire to ensure the face and content validity. Following their comments and suggestions, we revised the questionnaire.
Organizational culture was assessed with Yarbrough et al.’s [4] 16-item scale. This measurement approach incorporated four dimensions, namely, adhocracy culture, clan culture, hierarchy culture, and market culture. Each dimension was measured by four items. An example of the adhocracy culture scale is: “This is a very dynamic and entrepreneurial place. People are willing to stick their necks out and take risks.” An example of the clan culture scale is: “This is a very personal place. It’s like an extended family. People seem to share a lot of themselves.” An example of the hierarchy culture scale is: “We are an organized and structured place. Detailed procedures help people know what to do.” An example of the market culture scale is: “Our organization emphasizes competitive actions and achievement. Measurable goals are important.”
Innovation strategy was measured by 10 items adopted from Morgan and Berthon [7]. This measurement approach incorporated two dimensions, namely, exploratory innovation strategy and exploitative innovation strategy. An example of the five-item exploratory innovation strategy scale is: “Your products offer unique features not available from competitors’ offerings.” An example of the five-item exploitative innovation strategy scale is: “Products and/or processes are analyzed to search for improvements.”
Innovation speed was measured by using five items adopted from Liao et al. [71]. A sample item is: “Our organization is quick in new product launching as compared to key competitors.”
Innovation quality was measured by Lahiri’s [34] five-item scale. A sample item is: “Our organization does better in new product launching as compared to key competitors.”
The current study considered two control variables, namely, organization size, and organization age, because these factors have been frequently associated with innovation performance [72]. Specifically, organization size was measured by the number of current employees in the organization [73]. Organization size was viewed as an indicator of leadership in the power of pricing and bargaining, and the pervasiveness of operation and management routines, all of which may influence innovation performance [32]. Organization age was calculated as the number of years from the founding date [74]. Organization age may influence innovation performance because different ages may exhibit varied organizational characteristics and resource deployment [74].
4.3. Test for Common Method Variance
Given that our data were collected at the same time with the same questionnaire, Harmon’s single-factor test was applied to assess the potential common method variance. The results showed that all the items can be categorized into nine constructs with eigenvalues greater than 1.0, thereby accounting for 68.33% of the variance. The first construct only accounted for 12.16% of the variance, which indicated that the common method bias is not a serious concern in the current study.
4.4. Assessment of Measures
We conducted confirmatory factor analysis to assess the reliability and validity of the multi-item measurement scale. Table 1 showed that Cronbach’s alpha ranged from 0.67 to 0.86, which indicated that all variables have acceptable reliability. The convergent and discriminant validity of the measurements were tested. As Table 1 showed, all item loadings were higher than the 0.60 criterion. The values of composite reliability ranged from 0.80 to 0.90, which were above the 0.70 recommended level. The average variance extracted (AVE) scores of the constructs ranged from 0.51 to 0.70, which were higher than the 0.5 criterion. These results indicated that convergent validity of our measurement was good. We further compared the correlations of constructs and square root of the AVE scores to assess the discriminant validity. Table 2 indicated that the square root of the AVE scores for each construct was greater than the correlations among the constructs, thereby confirming discriminant validity.
5. Results
5.1. Fit Analytic Process
We took two steps to test the hypothesized relationships [42]. First, drawn from the top performers of each innovation strategic type on innovation speed and innovation quality, we calibrated organizational culture characteristics of the top performers as the ideal organizational culture profiles. Second, the ideal profile deviation scores for each organization were calculated, which reflected the degree of similarity between its culture profile and the ideal profile for its strategic type. Several scholars have suggested that a profile deviation score reflects a ‘misfit’, and the greater the deviation the greater the misfit [42,43]. To support our hypotheses that greater fit is conducive for innovation speed and innovation quality, a negative relationship between profile deviation and each of the two variables is required.
To identify an organizational culture profile that is ‘in fit’ with the specific innovation strategy of an organization, our sample was first grouped based on innovation strategy. Based on the two innovation strategies adopted by the sampled organizations, we used cluster analysis approach to facilitate the specification of groups. Following previous literature, we conducted a two-stage procedure that takes advantage of the strengths of two different clustering approaches [75]. First, Wards clustering algorithm was applied to determine the appropriate number of clusters. Three different innovation strategic groups were then suggested. Second, the K-means algorithm was used to assign each sampled organization to one of the three innovation strategic groups [76]. Table 3 showed the scores of exploratory innovation strategy and exploitative innovation strategy for the three cluster centers. Group 1, labeled as ‘exploratory’, has 33 organizations with higher ratings on exploratory innovation strategy. Group 2, labeled as ‘exploitative’, has 98 organizations with higher ratings on exploitative innovation strategy. Group 3, labeled as ‘ambidextrous’, has 52 ‘ambidextrous’ organizations with the same ratings on both exploratory and exploitative innovation strategy.
Furthermore, we identified ideal organizational culture profile for each innovation strategic group to assess fit. To identify top performers, we followed the criterion of selecting the top three organizations as the highest performers [38]. The mean scores of the top performers on the four organizational culture characteristics were calculated to specify the ideal profile (Table 4) for each innovation strategic group [4].
To operationalize the degree of ‘fit’, Euclidean distance from the individual culture pattern of each of the remaining organizations to the ideal culture pattern was calculated [39,42], using the equation
where is the score on the jth dimension for an organization in the sample, is the mean for the ideal profile along the jth dimension, and j = 1,2,3,4 (the four profile dimensions in this study).
This equation formulates a profile deviation score that represents the degree to which an organization’s culture profile is similar to that of the ideal profile for its innovation strategic group. The profile deviation score for each organization was then regressed onto innovation speed to test H1, and onto innovation quality to test H2. To further test the robustness of our results, we randomly selected a number of organizations for each innovation strategic group equal to the number in each of the ideal profiles, to calibrate an alternative ‘non-ideal’ profile [43]. The profile deviation from a random sample, which emerged not significant to innovation speed and innovation quality, would support our hypotheses.
5.2. Hypothesis Testing
As shown in Table 5, innovation speed regression models indicate significant, negative coefficients of ideal profile deviation for firms implementing an ‘exploratory’ innovation strategy (β = −0.66, p < 0.01), and an ‘exploitative’ innovation strategy (β = −0.35, p < 0.01). However, deviation from the ideal profile for ‘ambidextrous’ firms has a non-significant relationship with innovation speed (β = 0.03). Therefore, the results partially support H1. Fit is important in achieving superior innovation speed, when firms adopt ‘exploratory’ and ‘exploitative’ innovation strategies. In non-ideal regression models, the results indicate no significant relationship between deviation from the non-ideal profile and innovation speed for any of the three innovation strategic types, which provide further evidence of the robustness of the tests.
In H2, we predicted that the more similar a firm’s organizational culture profile is to that of the ideal profile for its innovation strategic type, the greater is its innovation quality. This yielded mixed results. The profile deviation scores are negative and statistically significant in firms implementing an ‘exploratory’ innovation strategy (β = −0.63, p < 0.01), and an ‘exploitative’ innovation strategy (β = −0.29, p < 0.01), whereas non-significant result (β = −0.01) are again found for firms pursuing ‘ambidextrous’ innovation strategy. Non-significant results in non-ideal profile regression models also provide confidence in these findings.
5.3. Post Hoc Analysis
We conducted post hoc analysis to improve the robustness of our fit analysis. First, we evaluated whether or not the three innovation strategic groups are distinct from each other on innovation strategy. An analysis of variance (ANOVA) test and multiple comparison procedure Tukey’s test are conducted for this purpose. Table 6 showed that the three innovation strategic groups are significantly different from each other on the two innovation strategies. Table 7 further showed the difference of exploratory and exploitative innovation strategies among the three innovation strategic groups. The results suggested that organizations in the ‘exploratory’ group have significantly higher exploratory innovation strategy than organizations in the ‘exploitative’ group, whereas organizations in ‘exploitative’ group have significantly higher exploitative innovation strategy than organizations in ‘exploratory’ group. With respect to exploratory and exploitative innovation strategies, organizations in the ‘ambidextrous’ group have significantly higher values than organizations in ‘exploratory’ and ‘exploitative’ groups.
Second, we evaluated the configuration of the two performance variables among the three innovation strategic groups. The average values for innovation speed and innovation quality of the three innovation strategic groups are presented in Table 8.
Furthermore, Table 9 and Table 10 illustrated the differences of innovation speed and innovation quality among the three innovation strategic groups. The results showed that there is no significant difference of innovation speed or quality among the three innovation strategic groups. This result supports the equifinality principle in contingency theory which states that multiple configurations of environmental variables can lead to nearly equivalent performance [77], and provides empirical validation that the innovation strategy clusters can perform as ‘pure’ strategy types.
6. Discussion
This study represents the first attempt to test the general hypotheses that an organization’s innovation performance is influenced by ‘fit’, which is defined as the extent to which an organization’s culture profile matches its innovation strategy. Based on configuration theory, we apply the fit as a ‘profile deviation’ approach to explore the fit between organizational culture and innovation strategy, and how this fit is associated with innovation speed and innovation quality. The results offer insights into the specific configuration between multiple components of innovation strategy and organizational culture. The results about the profiles of the ideal organizational culture indicated that the top-performing organizations of each innovation strategic group have distinctive configurations of organizational culture. This finding is consistent with previous propositions regarding cultural differences between organizations implementing different innovation strategies [9].
The current study finds that for organizations with exploratory and exploitative innovation strategy, the culture–strategy fit is important in achieving superior innovation speed and innovation quality. Specifically, the culture–strategy fit could explain 50% and 41% variance of innovation speed and innovation quality for exploratory organization, respectively, and could explain 13% and 10% variance of innovation speed and innovation quality for exploitative organizations, respectively. All the findings support the hypotheses that the fit between organizational culture and innovation strategy is critical for superior innovation speed and innovation quality.
However, our results indicate that the fit between organizational culture and innovation strategy is not significant for achieving superior innovation speed and innovation quality for ambidextrous organizations. This finding is interesting, but inconsistent with our hypothesis. The potential explanation may be that ambidextrous organizations normally focused on organization–environment coevolution which leads them to concentrate less on the configuration of organizational culture. Specifically, empirical evidence has presented that ambidextrous innovation strategy is the top priority for firms operating in an environment characterized by high dynamism and competitiveness [78,79]. Ambidextrous strategy requires organizations to effectively respond to environment changes through adapting their management effectively and efficiently [80]. However, “organizational culture is stable, difficult to change, and represents the accumulated learning of a group” [81] (p. 312). This indicates that configuring organizational culture with ambidextrous strategy would be difficult and time-consuming. In this view, organizations would find it impossible to reach ideal innovation speed and innovation quality through configuring organizational culture and ambidextrous innovation strategy.
6.1. Theoretical Implications
Our study has several implications for innovation and culture researchers. First, our study presents the fit between innovation strategy and organizational culture from a holistic perspective, and provides empirical evidence for the innovation performance impact of the culture–strategy fit. Our findings extend the existing understanding of the interrelationships between innovation strategy and organizational culture. Specifically, prior studies have presented the interrelationships between particular dimensions of organizational culture and particular types of innovation strategy [8,9]. Our findings provide the benchmarking organizational culture profiles including four cultural components across the exploratory, exploitative, and ambidextrous innovation strategic groups. Our study unpacks the composition of organizational culture and innovation strategy simultaneously, and offers fine-grained insights into the nature of the culture–strategy fit from a holistic perspective. Importantly, our findings suggest the need for implementing innovation strategy to develop a holistic assessment of organizational culture characteristics.
Second, our study finds that innovation performance would be negatively affected by the deviation from an ‘ideal’ organizational culture profile for executing a given innovation strategy. This finding suggests that it is not innovation strategy selection per se that drives inter-firm innovation performance differences, but rather how well a given strategy type is implemented based on organizational culture. Prior literature has highlighted the importance of strategy implementation as a source of competitive advantage [82]. However, our findings imply that the culture–strategy fit will be a key source of competitive advantage for organizations, rather than the pure strategy. This finding enhances our understanding about the specific configurations of organizational culture under different innovation strategic groups, which are important for superior innovation speed and innovation quality.
Finally, by employing configuration theory, our study crystallizes the theoretical argument on how different components of innovation strategy and organizational culture fit as well as how this fit affect innovation performance, thereby extending configuration theory. Specifically, our study integrates the insights between innovation management and organizational culture, and empirically verifies the importance of the fit between innovation strategy and organizational culture by adopting configuration theory [39,42]. Although configuration theory has been widely applied to assess complex, multidimensional phenomena in strategy management [38,39], knowledge management [83], human resource management [43], and marketing [42], its ability to shed light on the interdisciplinary research between innovation and culture had yet to be formally tested prior to the present study, despite recent researchers’ calls for the importance of the configuration between innovation strategy and organizational culture [4]. In this view, configuration theory may provide a good perspective to understand the nature of cross-domain synergies between innovation and culture, and thus, we urge more researchers to investigate interdisciplinary research between innovation and culture from the lens of configuration theory.
6.2. Practical Implications
The current research has some practical implications for managers. First, our findings suggest that managers should prioritize the repositioning of the benefits resulting from innovation strategy into the culture–strategy fit. The fit perspective can help managers extend their understanding about the synergies and conflicts between different types of innovation strategy and organizational culture. This understanding can facilitate managers to be more proactive when deciding on innovation strategy and organizational culture priorities. Specifically, managers should carefully evaluate and arrange the multiple organizational cultures in ways that fit the implementation requirements of different innovation strategy. For example, we suggest that managers control clan culture and promote hierarchy culture when they try to implement exploitative innovation strategy successfully. Meanwhile, we suggest that developing adhocracy culture will be helpful for implementing exploratory innovation strategy.
Second, the current research suggests that managers should not seek a fixed organizational culture template that favors both innovation quality and speed. Indeed, our results suggest that different configurations of organizational culture are required depending on whether the organization is seeking to maximize innovation quality or speed. Therefore, when designing innovation strategic goals, managers should hold an ‘innovation strategy meeting’ with both strategy and culture designers. In this event, managers should perform more informed evaluations about the extent to which they can create or maintain culture conditions that are compatible with innovation strategy decision alternatives.
6.3. Limitations and Future Research
This study has some limitations. First, we conducted the survey in China. The national context may limit the generalizability of our findings. Future research must be cautious when applying our findings in other contexts. Scholars can obtain data from multi-national organizations, and compare the innovation mechanisms of fit between different cultural, economic, and societal contexts.
Second, we collected data from one senior executive from each organization. Although the single respondent has been widely applied to strategy and culture research, it is limited in reflecting the reality of the organization. Therefore, future research may use multiple source data to explore how the culture–strategy fit affects innovation performance.
Finally, we tested our hypotheses with cross-sectional survey data. Such data limited the empirical establishment of the causality between fit and innovation performance (Yang and Li, 2011). A longitudinal study that can better reflect the causal relationship between these variables should be conducted.
Author Contributions
This work was produced through contributions of all the authors. Z.C. designed the research and wrote the paper; S.H. revised the paper; C.L. advised in literature review and the method; M.M. draw the graphs; L.Z. collected and analyzed the data.
Funding
This work was supported by the National Natural Science Foundation of China (Grant No. 71803117).
Conflicts of Interest
The authors declare no conflict of interest.
References
- Arnal, A.J.; Royo, P.; Pataro, G.; Ferrari, G.; Ferreira, V.J.; Lopez-Sabiron, A.M.; Ferreira, G.A. Implementation of PEF Treatment at Real-Scale Tomatoes Processing Considering LCA Methodology as an Innovation Strategy in the Agri-Food Sector. Sustainability 2018, 10, 979. [Google Scholar] [CrossRef]
- Hertenstein, P.; Williamson, P.J. The role of suppliers in enabling differing innovation strategies of competing r multinationals from emerging and advanced economies: German and Chinese automotive firms compared. Technovation 2018, 70, 46–58. [Google Scholar] [CrossRef]
- Saleh, S.D.; Wang, C.K. The Management of Innovation: Strategy, Structure, and Organizational Climate. IEEE Trans. Eng. Manag. 1993, 40, 14–21. [Google Scholar] [CrossRef]
- Yarbrough, L.; Morgan, N.A.; Vorhies, D.W. The impact of product market strategy-organizational culture fit on business performance. J. Acad. Mark. Sci. 2011, 39, 555–573. [Google Scholar] [CrossRef]
- Burton, R.M.; Lauridsen, J.; Obel, B. The impact of organizational climate and strategic fit on firm performance. Hum. Resour. Manag. 2004, 43, 67–82. [Google Scholar] [CrossRef]
- Liu, H.F.; Ke, W.L.; Wei, K.K.; Gu, J.B.; Chen, H.P. The role of institutional pressures and organizational culture in the firm’s intention to adopt internet-enabled supply chain management systems. J. Oper. Manag. 2010, 28, 372–384. [Google Scholar] [CrossRef]
- Morgan, R.E.; Berthon, P. Market Orientation, Generative Learning, Innovation Strategy and Business Performance Inter-Relationships in Bioscience Firms. J. Manag. Stud. 2008, 45, 1329–1352. [Google Scholar] [CrossRef]
- Gupta, B. A comparative study of organizational strategy and culture across industry. Benchmark. Int. J. 2011, 18, 510–528. [Google Scholar] [CrossRef]
- Naranjo-Valencia, J.C.; Jiménez-Jiménez, D.; Sanz-Valle, R. Innovation or imitation? The role of organizational culture. Manag. Decis. 2011, 49, 55–72. [Google Scholar] [CrossRef]
- Muafi, M. The effects of alignment competitive strategy, culture, and role behavior on organizational performance in service firms. Int. J. Organ. Innov. 2009, 2, 106–134. [Google Scholar]
- Kanungo, S.; Sadavarti, S.; Srinivas, Y. Relating IT strategy and organizational culture: An empirical study of public sector units in India. J. Strateg. Inf. Syst. 2001, 10, 29–57. [Google Scholar] [CrossRef]
- Büschgens, T.; Bausch, A.; Balkin, D.B. Organizational Culture and Innovation: A Meta-Analytic Review. J. Prod. Innov. Manag. 2013, 30, 1–19. [Google Scholar] [CrossRef]
- Cameron, K.S.; Quinn, R.E. Diagnosing and Changing Organizational Culture: Based on the Competing Values Framework; Addison-Wesley: Reading, MA, USA, 1999. [Google Scholar]
- Gao, H.S.; Hsu, P.H.; Li, K. Innovation Strategy of Private Firms. J. Financ. Quant. Anal. 2018, 53, 1–32. [Google Scholar] [CrossRef]
- Hongoh, J. The Asian-African Conference (Bandung) and Pan-Africanism: The challenge of reconciling continental solidarity with national sovereignty. Aust. J. Int. Aff. 2016, 70, 1–17. [Google Scholar] [CrossRef]
- Mueller, V.; Rosenbusch, N.; Bausch, A. Success patterns of exploratory and exploitative innovation a meta-analysis of the influence of institutional factors. J. Manag. 2013, 39, 1606–1636. [Google Scholar]
- Mom, T.J.M.; Van Den Bosch, F.A.J.; Volberda, H.W. Investigating Managers’ Exploration and Exploitation Activities: The Influence of Top-down, Bottom-up, and Horizontal Knowledge Inflows. J. Manag. Stud. 2007, 44, 910–931. [Google Scholar] [CrossRef]
- He, Z.L.; Wong, P.K. Exploration vs. exploitation: An empirical test of the ambidexterity hypothesis. Organ. Sci. 2004, 15, 481–494. [Google Scholar] [CrossRef]
- Sariol, A.M.; Abebe, M.A. The influence of CEO power on explorative and exploitative organizational innovation. J. Bus. Res. 2017, 73, 38–45. [Google Scholar] [CrossRef]
- Rothaermel, F.T.; Alexandre, M.T. Ambidexterity in technology sourcing: The moderating role of absorptive capacity. Organ. Sci. 2009, 20, 759–780. [Google Scholar] [CrossRef]
- Yang, T.T.; Li, C.R. Competence exploration and exploitation in new product development: The moderating effects of environmental dynamism and competitiveness. Manag. Decis. 2011, 49, 1444–1470. [Google Scholar] [CrossRef]
- Lee, M.; Kim, H. Exploring the Organizational Culture’s Moderating Role of Effects of Corporate Social Responsibility (CSR) on Firm Performance: Focused on Corporate Contributions in Korea. Sustainability 2017, 9, 1883. [Google Scholar] [CrossRef]
- Chan, L.L.M.; Shaffer, M.A.; Snape, E. In search of sustained competitive advantage: The impact of organizational culture, competitive strategy and human resource management practices on firm performance. Int. J. Hum. Resour. Manag. 2004, 15, 17–35. [Google Scholar] [CrossRef]
- McAfee, R.B.; Glassman, M.; Honeycutt, E.D., Jr. The effects of culture and human resource management policies on supply chain management strategy. J. Bus. Logist. 2002, 23, 1–18. [Google Scholar] [CrossRef]
- Khazanchi, S.; Lewis, M.W.; Boyer, K.K. Innovation-supportive culture: The impact of organizational values on process innovation. J. Oper. Manag. 2007, 25, 871–884. [Google Scholar] [CrossRef]
- Hartnell, C.A.; Ou, A.Y.; Kinicki, A. Organizational culture and organizational effectiveness: A meta-analytic investigation of the competing values framework’s theoretical suppositions. J. Appl. Psychol. 2011, 96, 677–694. [Google Scholar] [CrossRef] [PubMed]
- Ralston, D.; Terpstra-Tong, J.; Terpstra, Z.; Ergi, C. Today’s state-owned enterprises of China: Are they dying dinosaurs or dynamic dynamos? Strateg. Manag. J. 2006, 27, 825–843. [Google Scholar] [CrossRef]
- Li, Y.; Sun, Y.F.; Liu, Y. An empirical study of SOEs’ market orientation in transitional China. Asia Pac. J. Manag. 2006, 23, 93–113. [Google Scholar] [CrossRef]
- Deshpandé, R.; Farley, J.U.; Webster, F.E., Jr. Corporate culture, customer orientation, and innovativeness in Japanese firms: A quadrad analysis. J. Mark. 1993, 57, 23–37. [Google Scholar] [CrossRef]
- McDermott, C.M.; Stock, G.N. Organizational culture and advanced manufacturing technology implementation. J. Oper. Manag. 1999, 17, 521–533. [Google Scholar] [CrossRef]
- Tajeddini, K.; Elg, U.; Trueman, M. Efficiency and effectiveness of small retailers: The role of customer and entrepreneurial orientation. J. Retail. Consum. Serv. 2013, 20, 453–462. [Google Scholar] [CrossRef]
- Wang, Z.N.; Wang, N.X. Knowledge sharing, innovation and firm performance. Expert Syst. Appl. 2012, 39, 8899–8908. [Google Scholar] [CrossRef]
- Allocca, M.A.; Kessler, E.H. Innovation speed in small and medium sized enterprises. Creat. Innov. Manag. 2006, 15, 279–295. [Google Scholar] [CrossRef]
- Lahiri, N. Geographic distribution of R&D activity: How does it affect innovation quality? Acad. Manag. J. 2010, 53, 1194–1209. [Google Scholar]
- Liu, H.F.; Ke, W.L.; Wei, K.K.; Hua, Z.S. Effects of supply chain integration and market orientation on firm performance. Int. J. Oper. Prod. Manag. 2013, 33, 322–346. [Google Scholar] [CrossRef]
- Sheng, S.; Zhou, K.Z.; Lessassy, L. NPD speed vs. innovativeness: The contingent impact of institutional and market environments. J. Bus. Res. 2013, 66, 2355–2362. [Google Scholar] [CrossRef]
- Wei, Z.; Yang, D.; Sun, B.; Gu, M. The fit between technological innovation and business model design for firm growth: Evidence from China. R D Manag. 2014, 44, 288–305. [Google Scholar] [CrossRef]
- Olson, E.M.; Slater, S.F.; Hult, G.T.M. The performance implications of fit among business strategy, marketing organization structure, and strategic behavior. J. Mark. 2005, 69, 49–65. [Google Scholar] [CrossRef]
- Vorhies, D.W.; Morgan, N.A. A configuration theory assessment of marketing organization fit with business strategy and its relationship with marketing performance. J. Mark. 2003, 67, 100–115. [Google Scholar] [CrossRef]
- Hultman, M.; Robson, M.J.; Katsikeas, C.S. Export product strategy fit and performance: An empirical investigation. J. Int. Mark. 2009, 17, 1–23. [Google Scholar] [CrossRef]
- Kabadayi, S.; Eyuboglu, N.; Thomas, G. The performance implications of designing distribution channels to fit with strategy and environment. J. Mark. 2007, 71, 195–211. [Google Scholar] [CrossRef]
- Hughes, P.; Morgan, R.E. Fitting strategic resources with product-market strategy: Performance implications. J. Bus. Res. 2008, 61, 323–331. [Google Scholar] [CrossRef]
- Malhotra, N.; Mavondo, F.; Mukherjee, A.; Hooley, G. Service quality of frontline employees: A profile deviation analysis. J. Bus. Res. 2013, 66, 1338–1344. [Google Scholar] [CrossRef]
- Zott, C.; Amit, R. The fit between product market strategy and business model: Implications for firm performance. Strateg. Manag. J. 2008, 29, 1–26. [Google Scholar] [CrossRef]
- Wu, T.; Wu, Y.C.J.; Chen, Y.J.; Goh, M. Aligning supply chain strategy with corporate environmental strategy: A contingency approach. Int. J. Prod. Econ. 2014, 147, 220–229. [Google Scholar] [CrossRef]
- Venkatraman, N. The concept of fit in strategy research: Toward verbal and statistical correspondence. Acad. Manag. Rev. 1989, 14, 423–444. [Google Scholar] [CrossRef]
- Liu, H.F.; Wei, S.B.; Ke, W.L.; Wei, K.K.; Hua, Z.S. The configuration between supply chain integration and information technology competency: A resource orchestration perspective. J. Oper. Manag. 2016, 44, 13–29. [Google Scholar] [CrossRef]
- Kang, S.; Han, S.J.; Bang, J. The Fit between Employees’ Perception and the Organization’s Behavior in Terms of Corporate Social Responsibility. Sustainability 2018, 10, 1650. [Google Scholar] [CrossRef]
- Maheshwari, M.; Kumar, U.; Kumar, V. Alignment between social and technical capability in software development teams: An empirical study. Team Perform. Manag. 2012, 18, 7–26. [Google Scholar] [CrossRef]
- Klein, A. Corporate culture: Its value as a resource for competitive advantage. J. Bus. Strategy 2011, 32, 21–28. [Google Scholar] [CrossRef]
- Lau, C.M.; Ngo, H.Y. The HR system, organizational culture, and product innovation. Int. Bus. Rev. 2004, 13, 685–703. [Google Scholar] [CrossRef]
- Verdú-Jover, A.J.; Lloréns-Montes, J.F.; Garcia-Morales, V.J. Flexibility, fit and innovative capacity: An empirical examination. Int. J. Technol. Manag. 2005, 30, 131–146. [Google Scholar] [CrossRef]
- Heirman, A.; Clarysse, B. Which tangible and intangible assets matter for innovation speed in start-ups? J. Prod. Innov. Manag. 2007, 24, 303–315. [Google Scholar] [CrossRef]
- Mollaoglu-Korkmaz, S.; Miller, V.D.; Sun, W. Assessing key dimensions to effective innovation implementation in interorganizational project teams: An Integrated Project Delivery case. Eng. Proj. Organ. J. 2014, 4, 17–30. [Google Scholar] [CrossRef]
- Kessler, E.H.; Bierly, P.E. Is faster really better? An empirical test of the implications of innovation speed. IEEE Trans. Eng. Manag. 2002, 49, 2–12. [Google Scholar] [CrossRef]
- De Leede, J.; Looise, J.C.; Alders, B.C.M. Innovation, improvement and operations: An exploration of the management of alignment. Int. J. Technol. Manag. 2002, 23, 353–368. [Google Scholar] [CrossRef]
- Ettlie, J.E.; Elsenbach, J.M. Modified stage-gate regimes in new product development. J. Prod. Innov. Manag. 2007, 24, 20–33. [Google Scholar] [CrossRef]
- Boothby, D.; Dufour, A.; Tang, J. Technology adoption, training and productivity performance. Res. Policy 2010, 39, 650–661. [Google Scholar] [CrossRef]
- Claver, E.; Llopis, J.; Garcia, D.; Molina, H. Organizational culture for innovation and new technological behavior. J. High Technol. Manag. Res. 1998, 9, 55–68. [Google Scholar] [CrossRef] [Green Version]
- Kotter, J. Leading Change; Harvard Business School Press: Cambridge, UK, 1996. [Google Scholar]
- Smith, A.D. Competitive approaches to new product development: A comparison of successful organizations in an unstable economic environment. Team Perform. Manag. Int. J. 2011, 17, 124–145. [Google Scholar] [CrossRef]
- Boyd, J.L.; Bresser, R.K.F. Performance implications of delayed competitive responses: Evidence from the US retail industry. Strateg. Manag. J. 2008, 29, 1077–1096. [Google Scholar] [CrossRef]
- Lau, C.M.; Ngo, H.Y. One country many cultures: Organizational culture of firms of different country origins. Int. Bus. Rev. 1996, 5, 469–486. [Google Scholar] [CrossRef]
- Lee, J.; Miller, D. People matter: Commitment to employees, strategy and performance in Korean firms. Strateg. Manag. J. 1999, 20, 579–593. [Google Scholar] [CrossRef]
- Miron, E.; Erez, M.; Naveh, E. Do personal characteristics and cultural values that promote innovation, quality, and efficiency compete or complement each other? J. Organ. Behav. 2004, 25, 175–199. [Google Scholar] [CrossRef]
- Matsuno, K.; Mentzer, J.T.; Ozsomer, A. The effects of entrepreneurial proclivity and market orientation on business performance. J. Mark. 2002, 66, 18–32. [Google Scholar] [CrossRef]
- Zhao, X.; Huo, B.; Flynn, B.B.; Yeung, J.H.Y. The impact of power and relationship commitment on the integration between manufacturers and customers in a supply chain. J. Oper. Manag. 2008, 26, 368–388. [Google Scholar] [CrossRef]
- Yip, G.; Mckern, B. Innovation in emerging markets–the case of China. Int. J. Emerg. Mark. 2014, 9, 2–10. [Google Scholar] [CrossRef]
- Calantone, R.J.; Cavusgil, S.T.; Zhao, Y.S. Learning orientation, firm innovation capability, and firm performance. Ind. Mark. Manag. 2002, 31, 515–524. [Google Scholar] [CrossRef]
- Brislin, R.W. Translation and content analysis of oral and written material. In Handbook of Cross-Cultural Psychology; Triandis, H.C., Berry, J.W., Eds.; Allyn & Bacon: Boston, MA, USA, 1980. [Google Scholar]
- Liao, C.C.; Wang, H.Y.; Chuang, S.H.; Shih, M.L.; Liu, C.C. Enhancing knowledge management for R&D innovation and firm performance: An integrative view. Afr. J. Bus. Manag. 2010, 4, 3026–3038. [Google Scholar]
- Kollmann, T.; Stöckmann, C. Filling the Entrepreneurial Orientation–Performance Gap: The Mediating Effects of Exploratory and Exploitative Innovations. Entrep. Theory Pract. 2014, 38, 1001–1026. [Google Scholar] [CrossRef]
- Baron, R.A.; Tang, J.T. The role of entrepreneurs in firm-level innovation: Joint effects of positive affect, creativity, and environmental dynamism. J. Bus. Ventur. 2011, 26, 49–60. [Google Scholar] [CrossRef]
- Chen, C.J.; Huang, J.W. Strategic human resource practices and innovation performance–The mediating role of knowledge management capacity. J. Bus. Res. 2009, 62, 104–114. [Google Scholar] [CrossRef]
- Ketchen, D.J.; Shook, C.L. The application of cluster analysis in strategic management research: An analysis and critique. Strateg. Manag. J. 1996, 17, 441–458. [Google Scholar] [CrossRef]
- Choi, B.; Poon, S.K.; Davis, J.G. Effects of knowledge management strategy on organizational performance: A complementarity theory-based approach. Omega 2008, 36, 235–251. [Google Scholar] [CrossRef]
- Jennings, D.F.; Rajaratnam, D.; Lawrence, F.B. Strategy-performance relationships in service firms: A test for equifinality. J. Manag. Issues 2003, 15, 208–220. [Google Scholar]
- Jansen, J.J.P.; van den Bosch, F.A.J.; Volberda, H.W. Exploratory innovation, exploitative innovation, and ambidexterity: The impact of environmental and organizational antecedents. Schmalenbach Bus. Rev. 2005, 57, 351–363. [Google Scholar] [CrossRef]
- Raisch, S.; Birkinshaw, J. Organizational ambidexterity: Antecedents, outcomes, and moderators. J. Manag. 2008, 34, 375–409. [Google Scholar] [CrossRef]
- Gibson, C.B.; Birkinshaw, J. The antecedents, consequences, and mediating role of organizational ambidexterity. Acad. Manag. J. 2004, 47, 209–226. [Google Scholar]
- Lakos, A. Culture of Assessment as a Catalyst for Organizational Culture Change in Libraries. In Proceedings of the 4th Northumbria International Conference on Performance Measurement in Libraries and Information Services, Pittsburgh, PA, USA, 12–16 August 2001; Association of Research Libraries: Washington, DC, USA, 2002. [Google Scholar]
- Bercovitz, J.E.L.; Feldman, M.P. Fishing upstream: Firm innovation strategy and university research alliances. Res. Policy 2007, 36, 930–948. [Google Scholar] [CrossRef]
- Chen, Y.Y.; Huang, H.L. Knowledge management fit and its implications for business performance: A profile deviation analysis. Knowl.-Based Syst. 2012, 27, 262–270. [Google Scholar] [CrossRef]
Figure 1.
The Competing Values Model (CVM).

Figure 2.
Conceptual model.


Table 1.
Loadings, Cronbach’s alpha (α), composite reliability, and average variance extracted (AVE).
Table 1.
Loadings, Cronbach’s alpha (α), composite reliability, and average variance extracted (AVE).
| Variables | Factor Loading | Cronbach’s α | Composite Reliability | AVE |
|---|---|---|---|---|
| Innovation Speed | 0.64–0.83 | 0.82 | 0.88 | 0.64 |
| Innovation Quality | 0.70–0.86 | 0.84 | 0.88 | 0.64 |
| Exploratory Innovation Strategy | 0.68–0.77 | 0.70 | 0.81 | 0.52 |
| Exploitative Innovation Strategy | 0.66–0.84 | 0.74 | 0.84 | 0.57 |
| Clan Culture | 0.78–0.87 | 0.86 | 0.90 | 0.70 |
| Adhocracy Culture | 0.79–0.82 | 0.82 | 0.88 | 0.65 |
| Hierarchy Culture | 0.78–0.84 | 0.84 | 0.90 | 0.68 |
| Market Culture | 0.63–0.75 | 0.67 | 0.80 | 0.51 |
Table 2.
Means, standard deviations, correlations, and square roots of AVE in diagonals.
| Mean | S.D. | 1 | 2 | 3 | 4 | 5 | 6 | 7 | 8 | |
|---|---|---|---|---|---|---|---|---|---|---|
| 1. Innovation Speed | 3.21 | 0.58 | (0.80) | |||||||
| 2. Innovation Quality | 3.15 | 0.59 | 0.67 ** | (0.80) | ||||||
| 3. Exploratory Innovation Strategy | 3.67 | 0.60 | 0.28 ** | 0.33 ** | (0.72) | |||||
| 4. Exploitative Innovation Strategy | 3.82 | 0.54 | 0.18 * | 0.15 * | 0.45 ** | (0.76) | ||||
| 5. Clan Culture | 3.29 | 0.75 | 0.26 ** | 0.35 ** | 0.34 ** | 0.16 * | (0.84) | |||
| 6. Adhocracy Culture | 3.40 | 0.69 | 0.39 ** | 0.39 ** | 0.46 ** | 0.16 * | 0.65 ** | (0.80) | ||
| 7. Hierarchy Culture | 3.61 | 0.71 | 0.16 * | 0.17 * | 0.22 ** | 0.34 ** | 0.29 ** | 0.19 ** | (0.83) | |
| 8. Market Culture | 3.49 | 0.62 | 0.23 ** | 0.21 ** | 0.32 ** | 0.22 ** | 0.19 ** | 0.31 * | 0.25 ** | (0.71) |
* p < 0.05, ** p < 0.01.
Table 3.
Results of cluster analysis.
| Group 1 (N = 33) | Group 2 (N = 98) | Group 3 (N = 52) | |
|---|---|---|---|
| Exploratory Innovation Strategy | 3.84 | 3.28 | 4.31 |
| Exploitative Innovation Strategy | 3.22 | 3.78 | 4.30 |
Table 4.
Ideal organizational culture profiles for each innovation strategic group.
| Ideal Organizational Culture Profiles | ||
|---|---|---|
| Innovation Speed | Innovation Quality | |
| ‘Exploratory’ Group | ||
| Clan Culture | 3.75 | 4.05 |
| Adhocracy Culture | 4.13 | 4.20 |
| Hierarchy Culture | 3.88 | 3.70 |
| Market Culture | 3.63 | 3.55 |
| ‘Exploitative’ Group | ||
| Clan Culture | 2.85 | 3.25 |
| Adhocracy Culture | 3.55 | 3.75 |
| Hierarchy Culture | 3.90 | 4.00 |
| Market Culture | 3.55 | 3.75 |
| ‘Ambidextrous’ Group | ||
| Clan Culture | 4.17 | 4.13 |
| Adhocracy Culture | 4.17 | 4.25 |
| Hierarchy Culture | 4.08 | 4.19 |
| Market Culture | 4.25 | 4.13 |
Table 5.
Regression results.
| Innovation Speed | Innovation Quality | |||||
|---|---|---|---|---|---|---|
| Exploratory | Exploitative | Ambidextrous | Exploratory | Exploitative | Ambidextrous | |
| ‘Ideal’ Fit Models | ||||||
| Profile Deviation | −0.66 ** | −0.35 ** | 0.03 | −0.63 ** | −0.29 ** | −0.01 |
| Organization Size | −0.34 ** | −0.04 | −0.13 | −0.13 | 0.05 | −0.295 |
| Organization Age | −0.10 | 0.02 | 0.07 | −0.21 | 0.41 | 0.197 |
| R2 | 0.50 | 0.13 | 0.01 | 0.41 | 0.10 | 0.06 |
| F-Value | 8.88 ** | 4.32 ** | 0.18 | 5.47 ** | 2.99 * | 0.87 |
| Random ‘Non-Ideal’ Models | ||||||
| Profile Deviation | 0.03 | −0.13 | −0.08 | 0.08 | 0.05 | −0.11 |
| Organization Size | −0.30 | −0.07 | −0.08 | −0.11 | −0.02 | −0.05 |
| Organization Age | −0.05 | 0.05 | 0.09 | −0.04 | 0.08 | 0.00 |
| R2 | 0.10 | 0.02 | 0.01 | 0.02 | 0.01 | 0.01 |
| F-Value | 1.04 | 0.62 | 0.21 | 0.20 | 0.27 | 0.20 |
* p < 0.05, ** p < 0.01.
Table 6.
ANOVA test results for difference in innovation strategy across innovation strategic groups.
Table 6.
ANOVA test results for difference in innovation strategy across innovation strategic groups.
| Constructs | F Value | p Value |
|---|---|---|
| Exploratory Innovation Strategy | 119.33 | 0.00 |
| Exploitative Innovation Strategy | 74.61 | 0.00 |
Table 7.
Difference in innovation strategy across innovation strategic groups (Tukey).
| Innovation Strategic Groups | Exploratory Innovation Strategy | Exploitative Innovation Strategy |
|---|---|---|
| Exploratory Group vs. Exploitative Group | 0.56 ** | −0.56 ** |
| Exploratory Group vs. Ambidextrous Group | −0.47 ** | −1.08 ** |
| Exploitative Group vs. Ambidextrous Group | −1.03 ** | −0.52 ** |
** p < 0.01.
Table 8.
Means for innovation performance variables across innovation strategic groups.
| Innovation Outcomes | Exploratory Group | Exploitative Group | Ambidextrous Group |
|---|---|---|---|
| Innovation Speed | 3.30 | 3.12 | 3.32 |
| Innovation Quality | 3.07 | 3.12 | 3.26 |
Table 9.
Difference in innovation performance variables across innovation strategic groups (ANOVA).
| Innovation Outcomes | F Value | p Value |
|---|---|---|
| Innovation Speed | 2.58 | 0.08 |
| Innovation Quality | 1.31 | 0.27 |
Table 10.
Difference in innovation performance variables across innovation strategic groups (Tukey).
Table 10.
Difference in innovation performance variables across innovation strategic groups (Tukey).
| Innovation Strategic Groups | Innovation Speed | Innovation Quality |
|---|---|---|
| Exploratory Group vs. Exploitative Group | 0.18 | −0.05 |
| Exploratory Group vs. Ambidextrous Group | −0.02 | −0.18 |
| Exploitative Group vs. Ambidextrous Group | −0.20 | −0.14 |
© 2018 by the authors. Licensee MDPI, Basel, Switzerland. This article is an open access article distributed under the terms and conditions of the Creative Commons Attribution (CC BY) license (http://creativecommons.org/licenses/by/4.0/).
Share and Cite
MDPI and ACS Style
Chen, Z.; Huang, S.; Liu, C.; Min, M.; Zhou, L. Fit between Organizational Culture and Innovation Strategy: Implications for Innovation Performance. Sustainability 2018, 10, 3378. https://doi.org/10.3390/su10103378
AMA Style
Chen Z, Huang S, Liu C, Min M, Zhou L. Fit between Organizational Culture and Innovation Strategy: Implications for Innovation Performance. Sustainability. 2018; 10(10):3378. https://doi.org/10.3390/su10103378
Chicago/Turabian StyleChen, Zhi, Shenglan Huang, Chong Liu, Min Min, and Liying Zhou. 2018. "Fit between Organizational Culture and Innovation Strategy: Implications for Innovation Performance" Sustainability 10, no. 10: 3378. https://doi.org/10.3390/su10103378
Note that from the first issue of 2016, this journal uses article numbers instead of page numbers. See further details here.