Fiscal Adjustment Programs versus Socially Sustainable Competitiveness in EU Countries

Department of Finance, The Bucharest University of Economic Studies, 6 Piata Romana, 010374 Bucharest, Romania
*
Author to whom correspondence should be addressed.
Sustainability 2018, 10(10), 3390; https://doi.org/10.3390/su10103390
Submission received: 23 July 2018
/
Revised: 24 August 2018
/
Accepted: 11 September 2018
/
Published: 23 September 2018
(This article belongs to the Special Issue Towards Resilient Entrepreneurship and Technological Development in Self-Sustainable Economies)
Abstract
:After implementing harsh austerity measures during 2008–2011, in the period 2012–2014 the fiscal adjustment programs also involved social equity measures, the quantitative fiscal consolidation being changed into a qualitative one—a reduction of the structural budget deficit accompanied by an improvement of social sustainability indicators. The 2015–2017 period shows mixed evolutions in terms of social progress brought by the recovery of the economic potential lost during the crisis. This research analyzes the sustainability of economic competitiveness dynamics from a social viewpoint during 2012–2014. In this paper, we analyze the way in which the economic and social components of fiscal adjustment programs are dynamically balanced in 24 EU member states. We identify four clusters of countries depending on the relationship between fiscal consolidation/fiscal stimulation and the social dynamics of the sustainability adjusted global competitiveness index. We found that under the pressure of “fiscal adjustment fatigue” caused by tough austerity programs in the period 2008–2011, most of the European countries completed the fiscal adjustment packages with measures to improve the social situation between 2012 and 2017. The fiscal consolidation programs have become more balanced from the perspective of the combination of budgetary austerity—social equity measures. Furthermore, we analyze how some countries on the EU periphery (Central and Eastern Europe, Baltic countries and Portugal, Ireland and Greece, countries that have joined the EU with a lower level of development) are experiencing or not an improvement in the social sustainability generated by the measures aimed at stimulating the economic growth implemented during 2012–2017. To conclude, we proposed a few pillars that could be integrated if an “ideal adjustment program” is to be achieved.
1. Introduction
The financial crises of recent years have revealed structural deficiencies in the financial and banking system. Banks’ bailout brought in adverse/undesired effects, several European countries being facing a sovereign debt crisis. The need to break the link between banking sector crisis and the sovereign debt problems required austerity programs to restore the soundness of public finances. Moves to reduce structural budget deficits were accompanied by competitive devaluations, particularly among the periphery EU countries. During 2008–2011, the austerity programs had a positive impact on economic competitiveness but, at the same time, the social environment has been neglected. Thus, implementing fiscal consolidation in EU countries in a bid to increase sustainability of public finances and economic competitiveness has not always been accompanied by a consolidation of the social safety net. Therefore, the speed of fiscal consolidation was rather limited due to an adversity of the population towards reforms. There is a high risk that the increase in competitiveness is short-lived/merely temporary, without providing for the desired medium and long-term structural change.
No one can say whether austerity programs are good or bad. The analysis of them must be done for each country separately, in line with their specifics. The idea that these processes always result in restoring investor/financial market confidence in an economy, in boosting competitiveness and should generate a virtuous circle determined by sustainable economic growth is far from being universally validated in the economic theory. We might consider the past and present ideas on austerity as a counterpart to the interventionist theories rather than as a feasible alternative to the positive economic evolution. Mark Blyth (2015) shows that some gradual and temporary forms of devaluation and cuts in personnel can be used to offset wage increases. However, their widespread use—as it happened in the European Union in 2008–2011—only leads to vicious circles, as Keynes (1964) explains, providing two main arguments. Keynes’s first argument against austerity was that a decrease in workers’ wages would severely reduce consumption and cause deflation, coupled with poverty and unemployment [1]. The second argument defines a rational process—in doubtful circumstances of economic uncertainty, the incentive to invest of private economic actors is dramatically reduced, as they consider saving as being more efficient.
This approach is quite new in literature, as the works elaborated so far focused on the impact of fiscal adjustment programs on economic growth and public debt (through estimating multiplier effects), the structure of fiscal consolidation—on the budget expenditure or budget revenues—and on the success of competitive devaluation processes—particularly by cutting prices and wages—on increasing competitiveness, growing exports and economic recovery. The research in this area is less devoted to the social dimension of the fiscal adjustment programs and the strictly necessary mix between higher competitiveness and social sustainability. We believe that the fiscal adjustment programs that trigger increased competitiveness but fail to maintain a stable/fair social safety net are not successful in the medium and long run. The risk that fiscal adjustment would be reversed is high in such circumstances.
Unlike most papers in this area addressing the issue by approaching fiscal adjustment programs only through the lens of increased economic competitiveness, our study links the processes of fiscal adjustment, economic competitiveness and social sustainability in an integrated approach, a premise that should be implemented by any fiscal consolidation program if it is deemed to be successful.
This paper opens a new research direction in terms of the characteristics of the fiscal adjustment programs—socially sustainable or not, it is proposing policymakers a dynamic balancing of substantiation and implementation of these programs in order to highlight the importance of a reasonable acceptability of reforms by the public. An increase in the quality of the measures aimed to secure public finances recovery cannot be achieved in the absence of a more comprehensive assessment that would include testing the preferences of the public.
Our study may represent a starting point for further steps aimed at increasing the consistency when fiscal adjustment programs are crafted, changing the paradigm of their assessment and creating new methodologies and indicators to measure the continuity of the positive effects of the measures implemented.
2. Literature Review
In fact, the philosophy at the core of the programs aimed at restoring competitiveness via internal/external devaluation is called ordoliberalism in the economic doctrine. Blyth (2015) shows that focusing on the need for peripheral countries to drastically reduce wages and costs in order to restore competitiveness while ignoring the role of countries with current account surpluses in generating the crisis shows a deeply ordoliberal understanding of economic management [2]. Wolf (2010) defines suggestively this issue by showing that if all countries should have a current account surplus “to whom should it be—to Martians?” The author concludes that the outcome of this hypothetical process would be a permanent economic depression [3].
Are there successful cases as expansionary fiscal adjustment? Giavazzi and Pagano (1990) analyze the cases of Denmark and Ireland and conclude that the answer is positive and the succession of phenomena/processes is as follows: making fiscal adjustments through a consistent/credible program results in favorable expectations of investments and economic growth and thus “an expansion greater than the contraction caused by budgetary expenditure restraint” [4]. The lineage of ideas continues on this research course, and two other authors, Alesina and Perotti (1995), find that successful fiscal adjustment programs are mainly due to cuts in social assistance programs, budget spending and job reduction in the public sector [5].
Alesina and Ardagna (1998) conclude that there are three pillars that need to be implemented in order to ensure the success of a fiscal adjustment in providing the effects of economic growth: cuts in social transfers, lower social benefits and reduced public sector wages. It may be possible, but the subsequent causal succession starting from the general behavior of individuals is improbable. However, it seems at least difficult to internalize the arguments of the two authors in the economic behavior of individuals (if the individual is homo economicus it is hard to say) [6].
DeLong and Summers (2012) analyzed the effectiveness of discretionary fiscal policy in protracted recession economies and monetary policy constraint of lower zero-bound interest rates. The authors concluded that budget adjustment policies, given the strong output reduction, will have adverse effects both in the short, as well as in the long term [7,8].
From an analysis of the European Parliament carried out in 2013 it resulted that the austerity measures promoted at EU level have negatively affected the ability to achieve the objectives of employment and poverty reduction undertaken by the Europe 2020 strategy. Thus, large public spending cuts have negatively influenced economic growth, generating higher unemployment and growing income inequalities [9].
In 2015, Alesina, Barbiero and Favero examined the programs of budget deficit adjustment in 2009–2013 in a few OECD countries, concluding that “there has been a very big difference between tax-based and expenditure-based fiscal adjustments” and “the tax based fiscal adjustment have indeed very costly in terms of output losses” [10].
Ștefănescu-Mihăilă (2015) analyzed the impact of education on competitiveness in the case of Romania, which suffered the second fiscal adjustment in the European Union following an economic crisis [11].
Lecerf (2016) argued that the economic crisis and fiscal consolidation programs have had a major negative impact on European citizens, leading to the increase of poverty and social exclusion rates. Unfortunately, the measures aimed at reducing poverty had only a marginal effect in the European Union [12].
Djankova, Nikolovab and Zilinskyc (2016) argued that weaker government performance is one of the most important factors influencing the quality of life gap in the Central and Eastern Europe countries compared with developed economies in the European Union. In turn, reduced quality of life negatively influences the success of the structural reforms implemented in those economies, affecting their long-term competitiveness [13].
Michail, Savva and Koursaros (2017) have studied the impact of fiscal consolidation process on the confidence of economic agents, which has a decisive influence on consumer and investment decisions in that economy [14].
Rădulescu, Fedajev, Sinisi, Popescu and Iacob (2018) have examined the role of the Europe 2020 strategy in overcoming structural weaknesses in the European Union and improving the economic and social competitiveness of those economies [15].
Popescu, Sima, Nica and Gheorghe (2017) have analyzed the differences between the indicators used to measure the economic competitiveness and have argued the importance of increasing competitiveness for less developed economies in the European Union [16].
Paulusa, Figarib and Sutherlanda (2016) have studied the distributional impact of fiscal adjustment measures, arguing that the poorest households were most affected, which negatively influenced the social competitiveness process [17]. The same conclusion is supported by Perez and Matsaganis (2017) which have established that fiscal austerity measures have led to an increase of the income inequality and of the poverty rate in the Southern European Union countries [18]. An IMF report (2018) highlighted the negative impact of austerity fiscal programs on young people in the context of a significant increase in unemployment rates among them [19]. Also, the OECD (2017) explained the effect of increasing income inequality not only on economic growth in the EU, but also on social cohesion, leading to social exclusion and lack of social cohesion at European level [20].
Kolev and Matthes questioned the need to implement a smart fiscal consolidation program that combines measures to boosts long-term economic potential, minimize negative short-term impacts, and ensure a fair society [21]. A counterpart of the optimal program is the one applied in Greece during 2008–2017, a country where economic and societal effects were heavily negative, as shown [22].
Of course, the scientific literature is vast in this field. Yet some questions remain without an answer widely accepted by the scientific community. Isn’t deflation, by cutting wages and prices, resulting in loss of output, persistent unemployment and uncertainty in terms of micro- and macro-economics? Isn’t the phenomenon of debt deflation occurring with all its negative effects on economies with already unsustainable debts, as well as consumption decrease and revenue losses?
Shouldn’t we reconsider and implement fiscal adjustment programs and strive for a structural increase of competitiveness especially during the periods of expansionary gap, of economic boom? Should we implement programs of fiscal consolidation and boost competitiveness through internal/external devaluation or is a structure with higher added value of exports necessary, as Felipe and Kumar (2011) claim [23]? Can all European countries build an economy based on exports? Do all these countries have a consistent tradable goods’ sector up for export?
Have the latest fiscal adjustment programs implemented in EU states resulted in an increased socially sustainable competitiveness? Do we find structural or only non-lasting gains in terms of micro- and macro-economics?
3. Method, Assessment and Interpretation of Results
How sustainable are the EU tax adjustments in terms of increased competitiveness and improved social climate? Most studies regarding fiscal and budget adjustments measure their magnitude by reducing the share of the structural budget deficit in the potential GDP.
Our research plan was established in view of the following activities: analysis of the relevant scientific literature in the field; substantiating research assumptions; data collection; the choice and use of statistical and econometric techniques to estimate the established correlations; analysis and interpretation of results; public policy conclusions and recommendations.
In this paper, we use the method of analyzing the correlation between an indicator showing the implementation of fiscal adjustment programs/fiscal stimulus and the indicator showing the increase/decrease of adjusted competitiveness in social terms. Afterwards, we group the countries in four major clusters according to the evolution of the indicators mentioned above.
The stages in our research were as follows. Firstly, we collected data on the structural deficit budget (percentage points potential GDP) and the Social Sustainability-adjusted Global Competitiveness Index for 24 EU-28 countries. Second, to highlight the correlation between the dynamics of these two indicators we used the simple correlation method. In the case of the clustering of the states analyzed from the perspective of this correlation we used the Ward econometric technique.
To test the sustainability of the fiscal adjustments in terms of increased competitiveness and improved social climate we used a composite indicator calculated by World Economic Forum called Social Sustainability-Adjusted Global Competitiveness Index (ssaGCI). It is an indicator calculated as the product of GCI (Global Competitiveness Index) and social sustainability coefficient. This coefficient involves the relation between economic prosperity and social inclusion. “Global Competitiveness Index measures the level of competitiveness of an economy, which is defined as the set of institutions, policies and factors that determine the level of productivity of an economy” (World Economic Forum, 2014) [24]. We remind that the Global Competitiveness Index is the index that considers all economic engines which raise the efficiency and prosperity of a country—institutional development, health, education and human capital, the sustainability of the macroeconomic environment, the elements related to the efficient functioning of the goods, labor and financial market, technology and business sophistication. Below these pillars, ssaGCI includes improvements in the living standards of the population (access to health, education, social protection, employment, social mobility and unemployment) and also the progress in the fight against inequality of income.
The indicator ssaGci measures whether the higher economic competitiveness is accompanied by the consolidation of the social safety net, if the process called inclusive economic growth is to be obtained. Finally, we are all aware that the purpose of consistent public policies must be reflected by better living standards, in other words an increased competitiveness with a social purpose.
The ssaGCI indicator has been proposed to try to identify the relationship between social sustainability and development. The social sustainability of fiscal adjustment programs refers to how their implementation has improved/worsened the indicators on inclusion, equity and cohesion. Improvements in the ssaGCI indicator—even marginal—reflect the concern of policymakers to maintain/strengthen the social safety net, and its worsening may reflect tough austerity measures for the population. The lower the initial value of ssaGCI compared to other countries, the greater is the risk of implementing fiscal consolidation programs that only boost competitiveness but not development. In addition, the population’s adversity is greater, with political (populism), economic (low economic growth) and social (social disorder) implications. The values and dynamics of ssaGCI are important to understand the degree of social sustainability of fiscal consolidation programs.
Greater economic and social cohesion creates the premises for an acceleration of the structural reform and, therefore, for a higher speed of real convergence. The expansionary fiscal adjustment does not mean achieving a volatile economic growth, which is highly polarized and does not lead to social inclusion. On the other hand, increased competitiveness via internal devaluation represents only a bitter success, a temporary one if judged in terms of an efficient program of fiscal and budget adjustment program.
Unfortunately, the values of the ssaGCI indicator are shown in The Global Competitiveness Report only in 2012, 2013 and 2014. The short estimation period involves the impossibility of using elaborated econometric/statistic methods.
The main target of this research is the analysis of the fiscal adjustment programs in EU countries in terms of socially changing the sustainable economic competitiveness.
In our analysis, we used the change of the structural budget deficit share in the potential GDP in 2014 compared to 2012, on the one hand, and the change of the ssaGCI, on the other hand, in 24 EU28 countries.
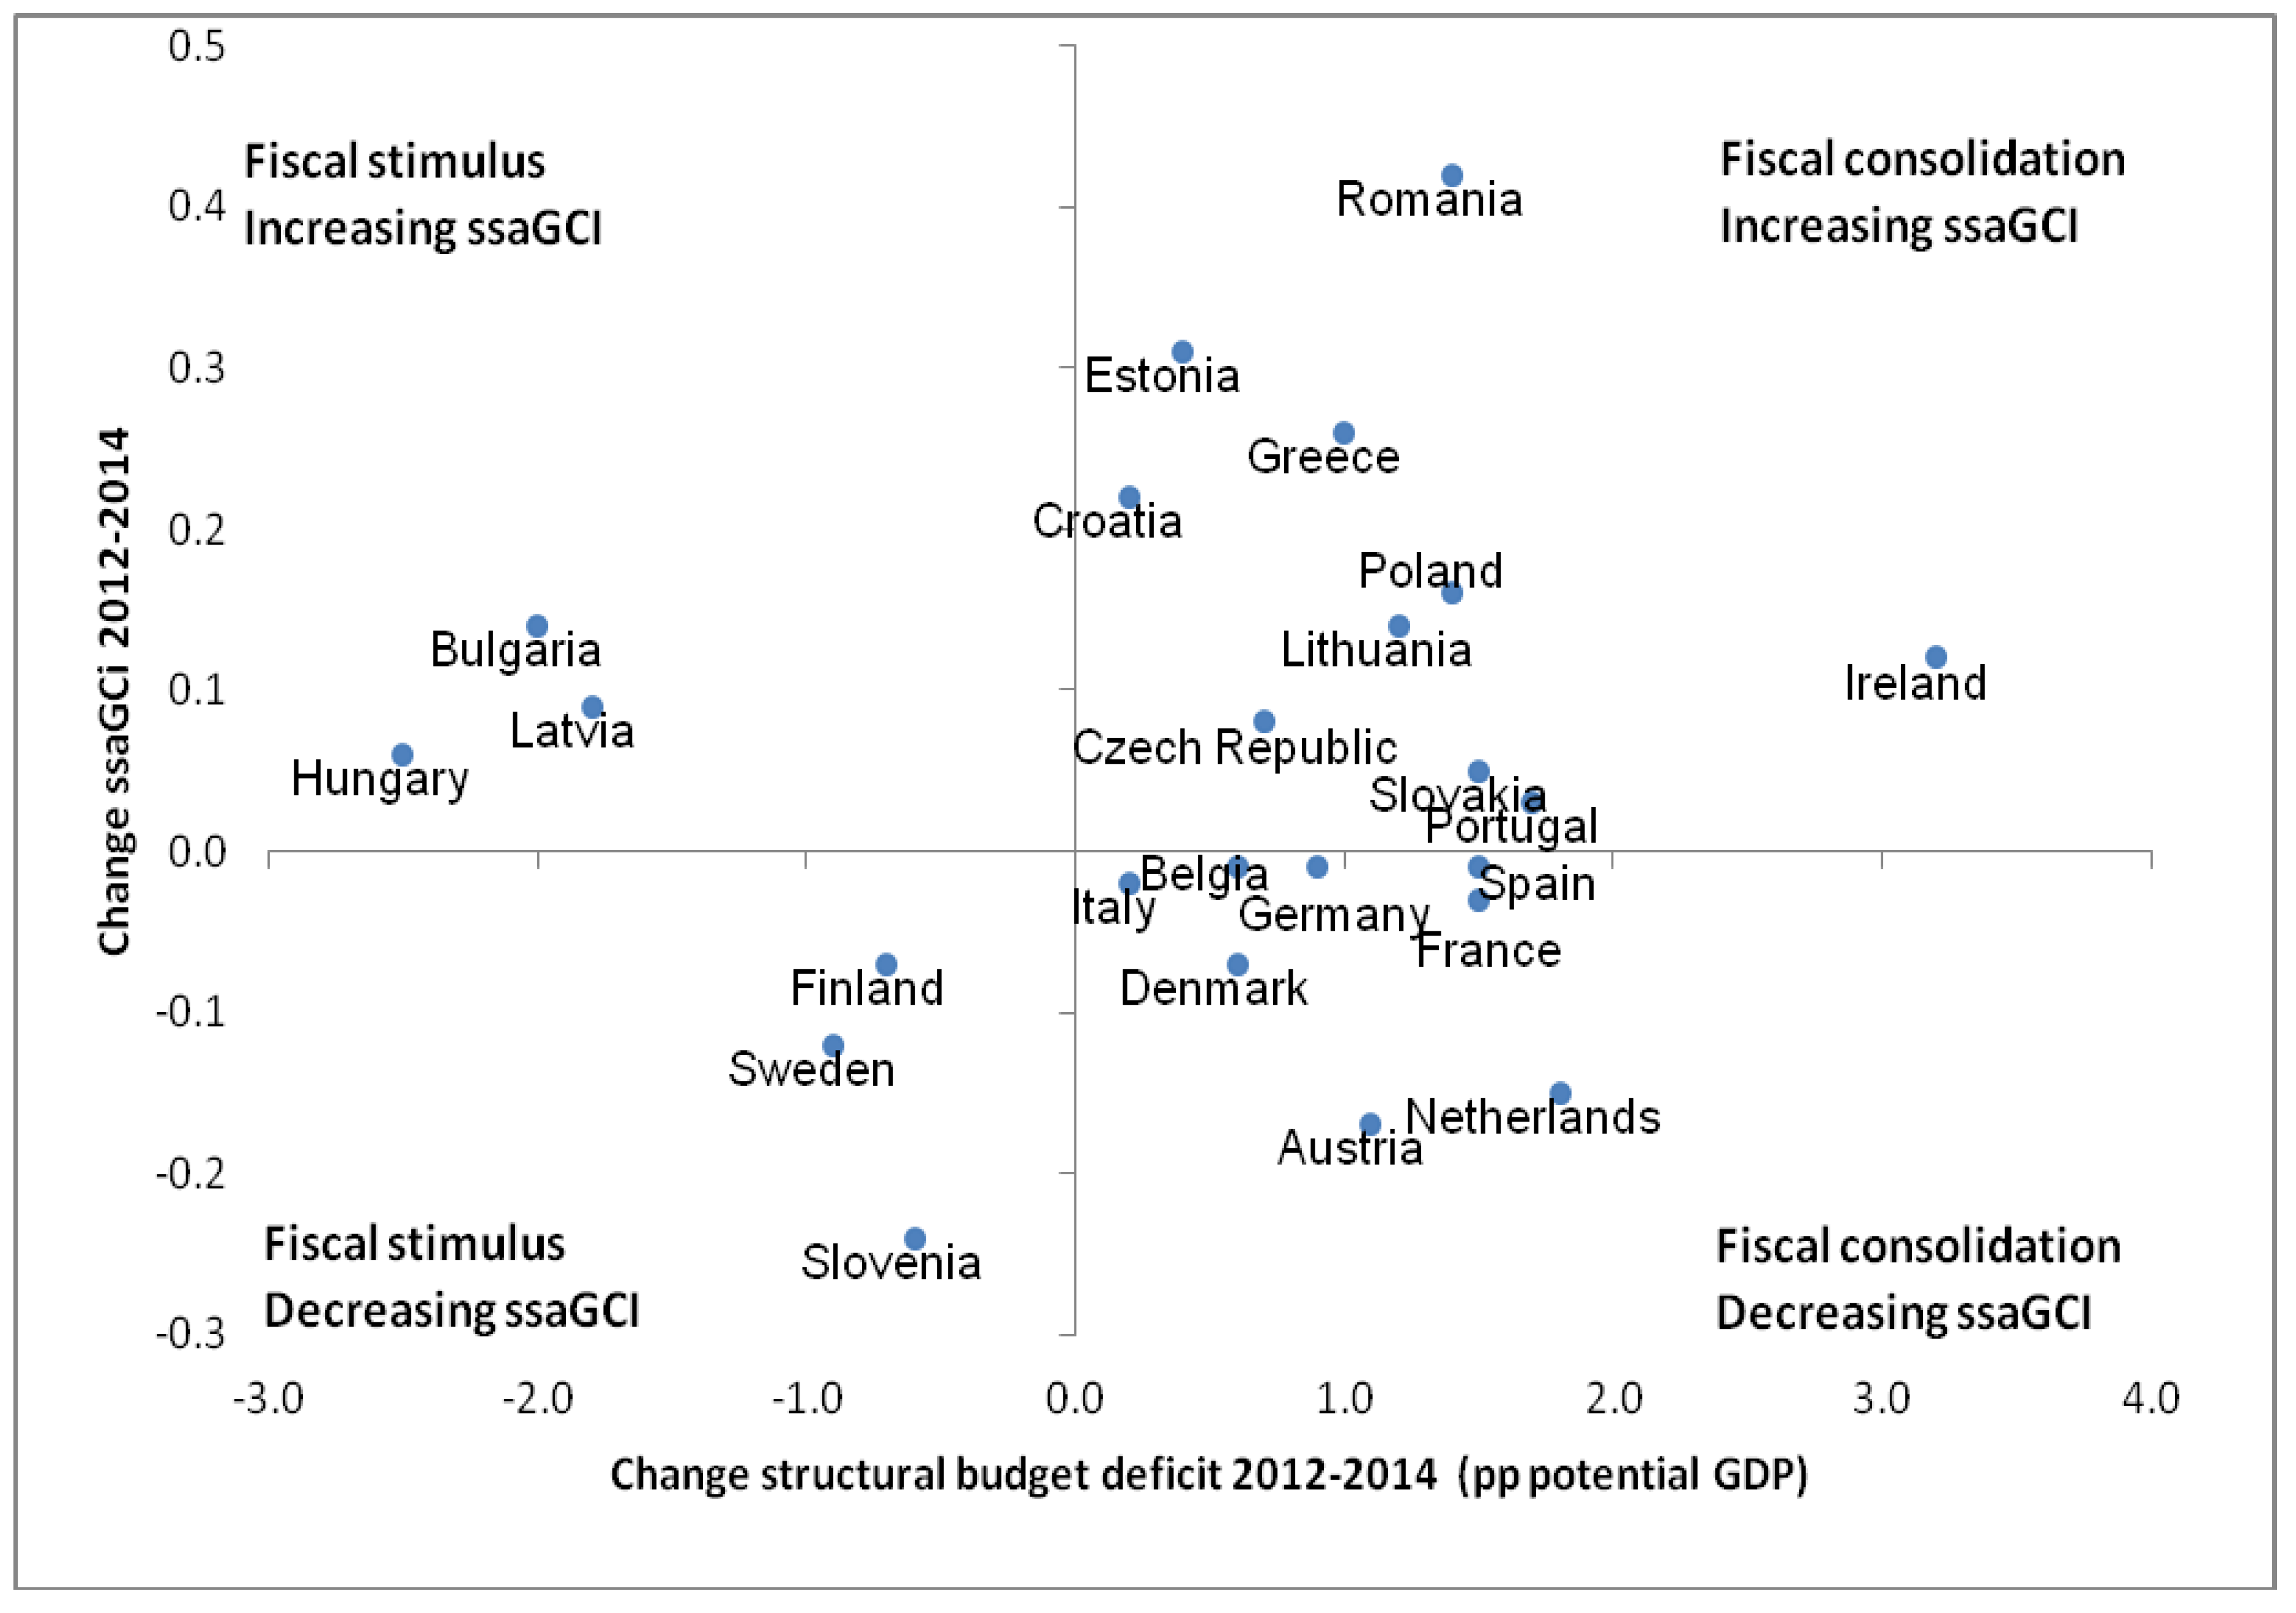
As shown in Figure 1, the results obtained indicate four clusters of countries and four situations. The first situation characterizes the cluster consisting of 10 countries, most in the EU periphery, where fiscal consolidation (reduction of the structural budget deficit) was accompanied by an improvement of the sustainability adjusted Global Competitiveness Index. The second involves a cluster consisting of states in the core Euro area, developed countries that experienced a fiscal consolidation process with a negative impact in the evolution of the ssaGCI indicator. The third incorporates two Nordic countries (Finland and Sweden) and Slovenia where the process noticed show a worsening of the ssaGCI based on a fiscal stimulus for the economy (the share of the structural budget deficit in the potential GDP increased). The countries using the fiscal stimulus and obtaining social improvements of sustainable competitiveness are Bulgaria, Latvia and Hungary (cluster 4).
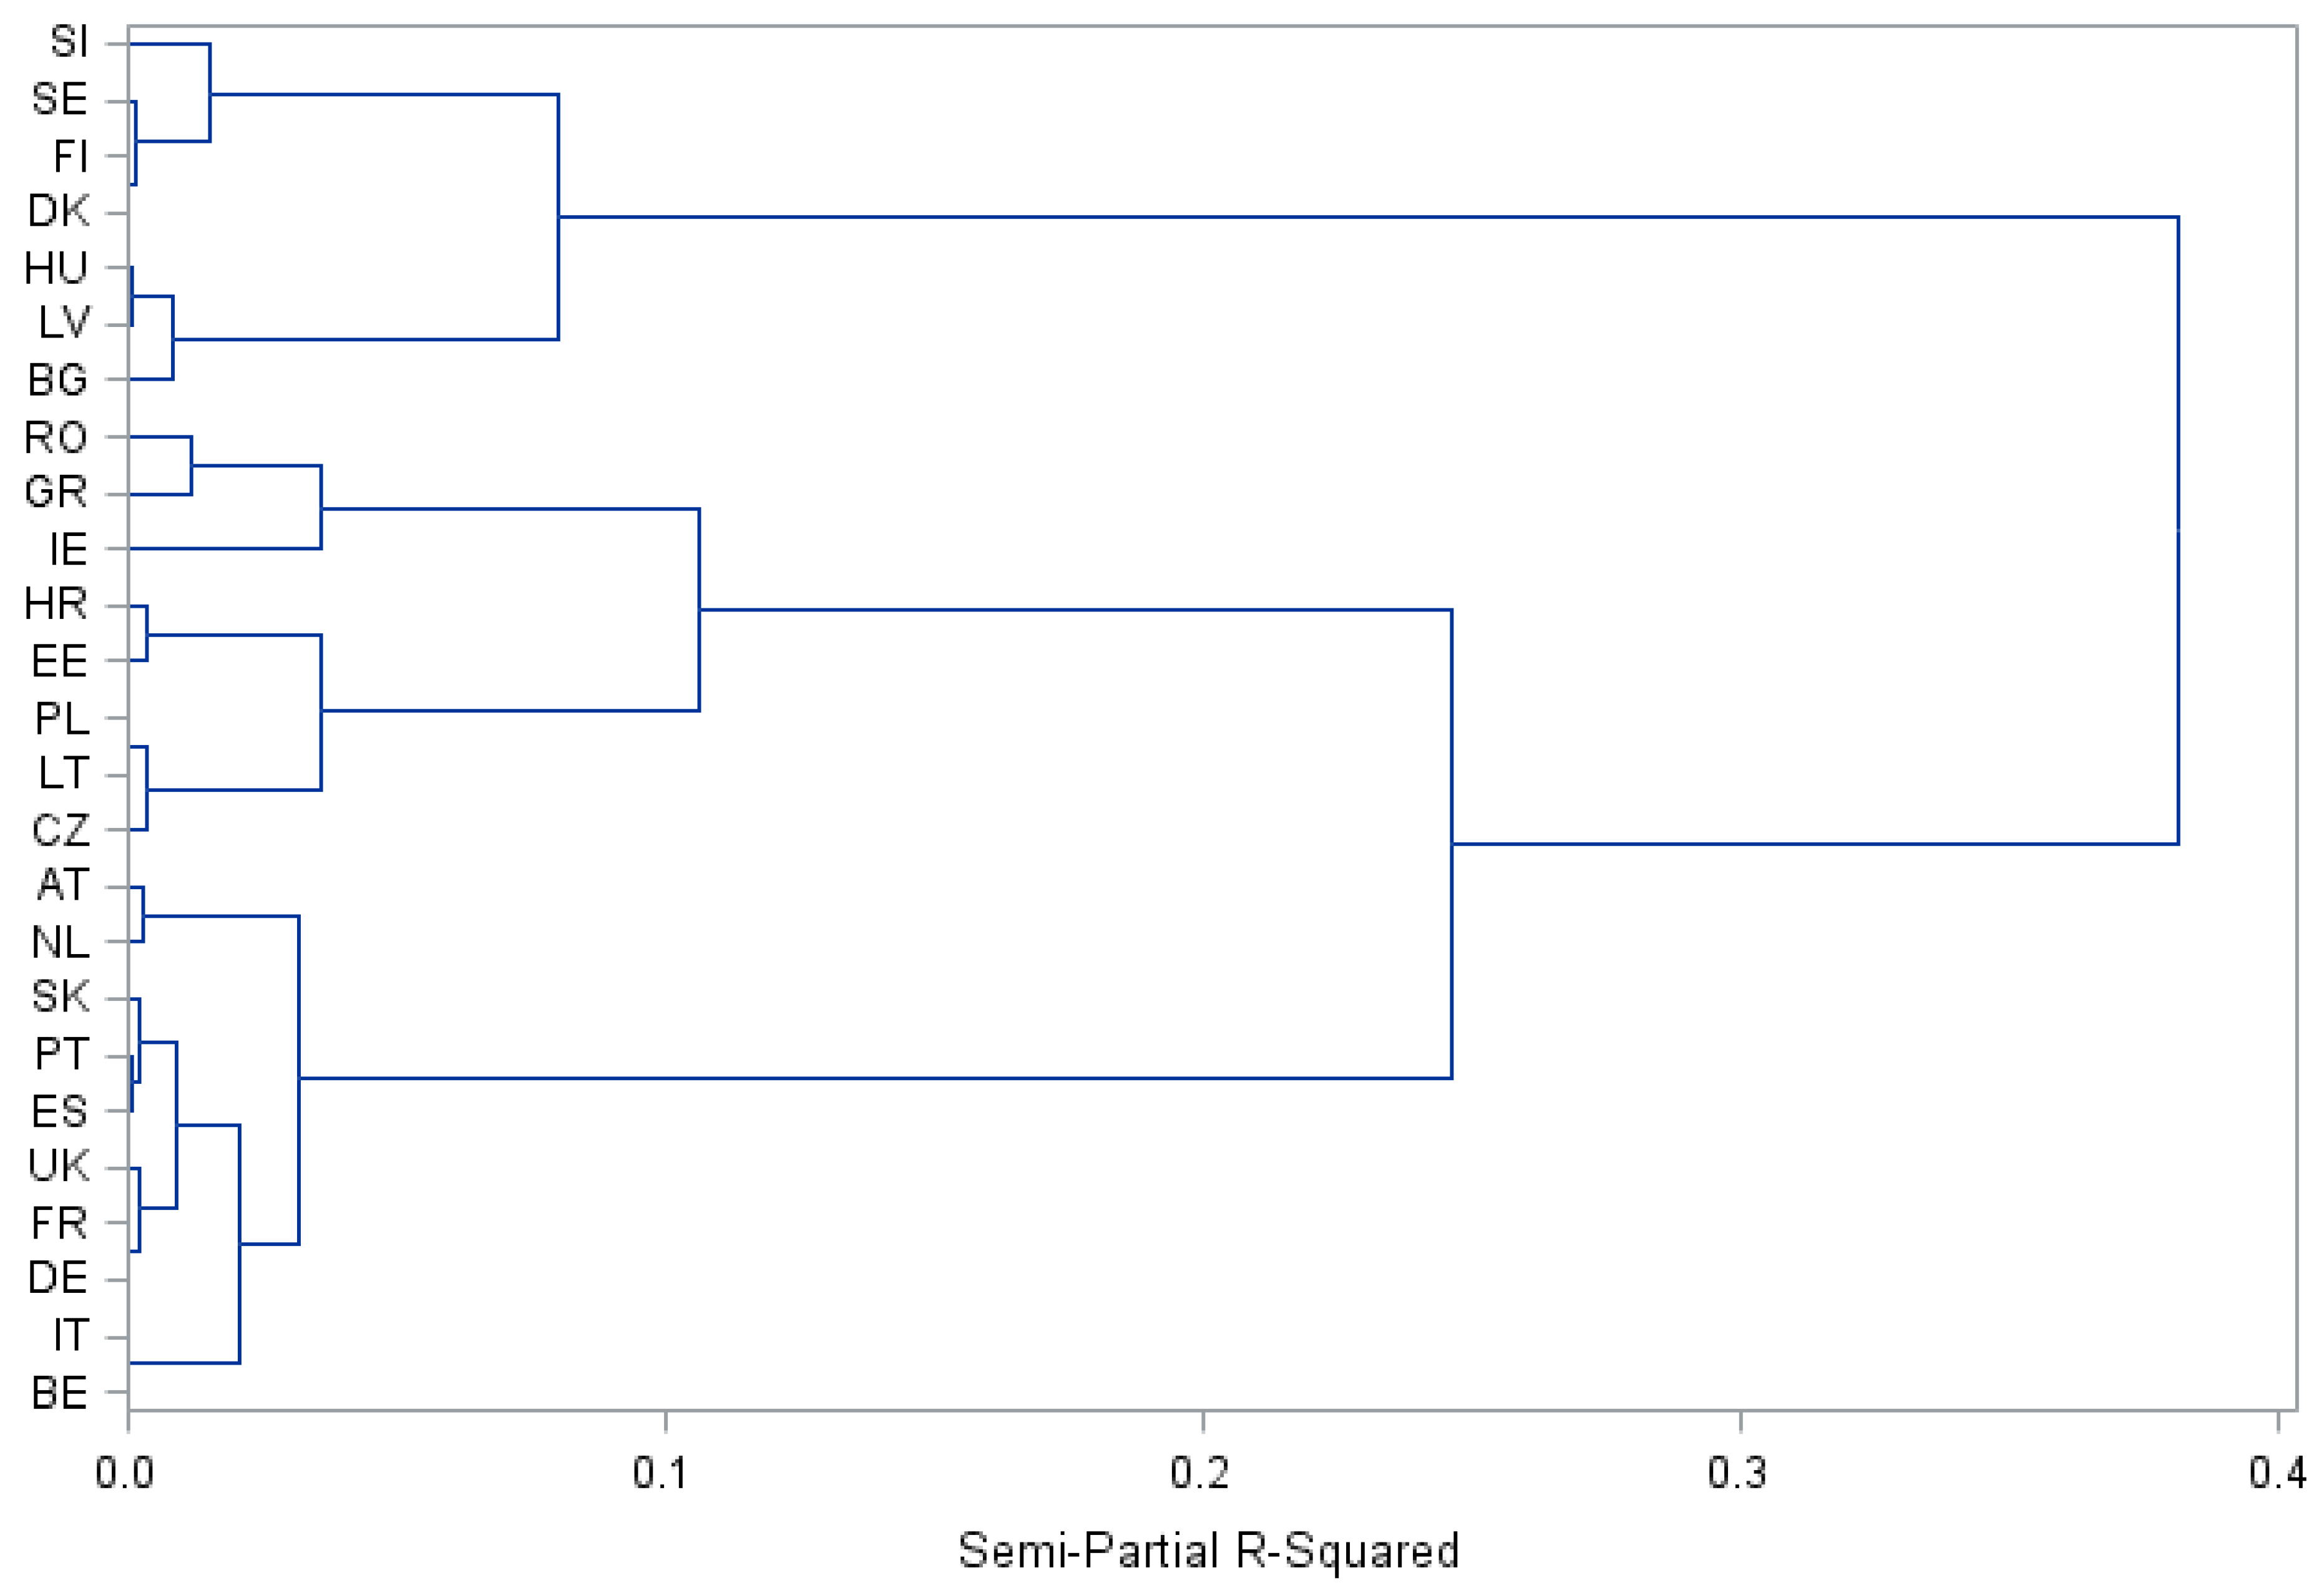
The analysis of clusters based on the absolute change of ssaGCi—absolute chamge of structuralbudgetdeficit (pp potential GDP) using the Ward method leads to a division of the counted countries equivalent to the one above. The Ward method is a procedure used to classify countries in clusters according to macroeconomic specifications. The procedure evaluates the distance between 2 clusters, based on maximizing cluster homogeneity, and k-means is used as a partitioning algorithm. The results obtained on cluster grouping according to the Ward method can be found in Appendix A.
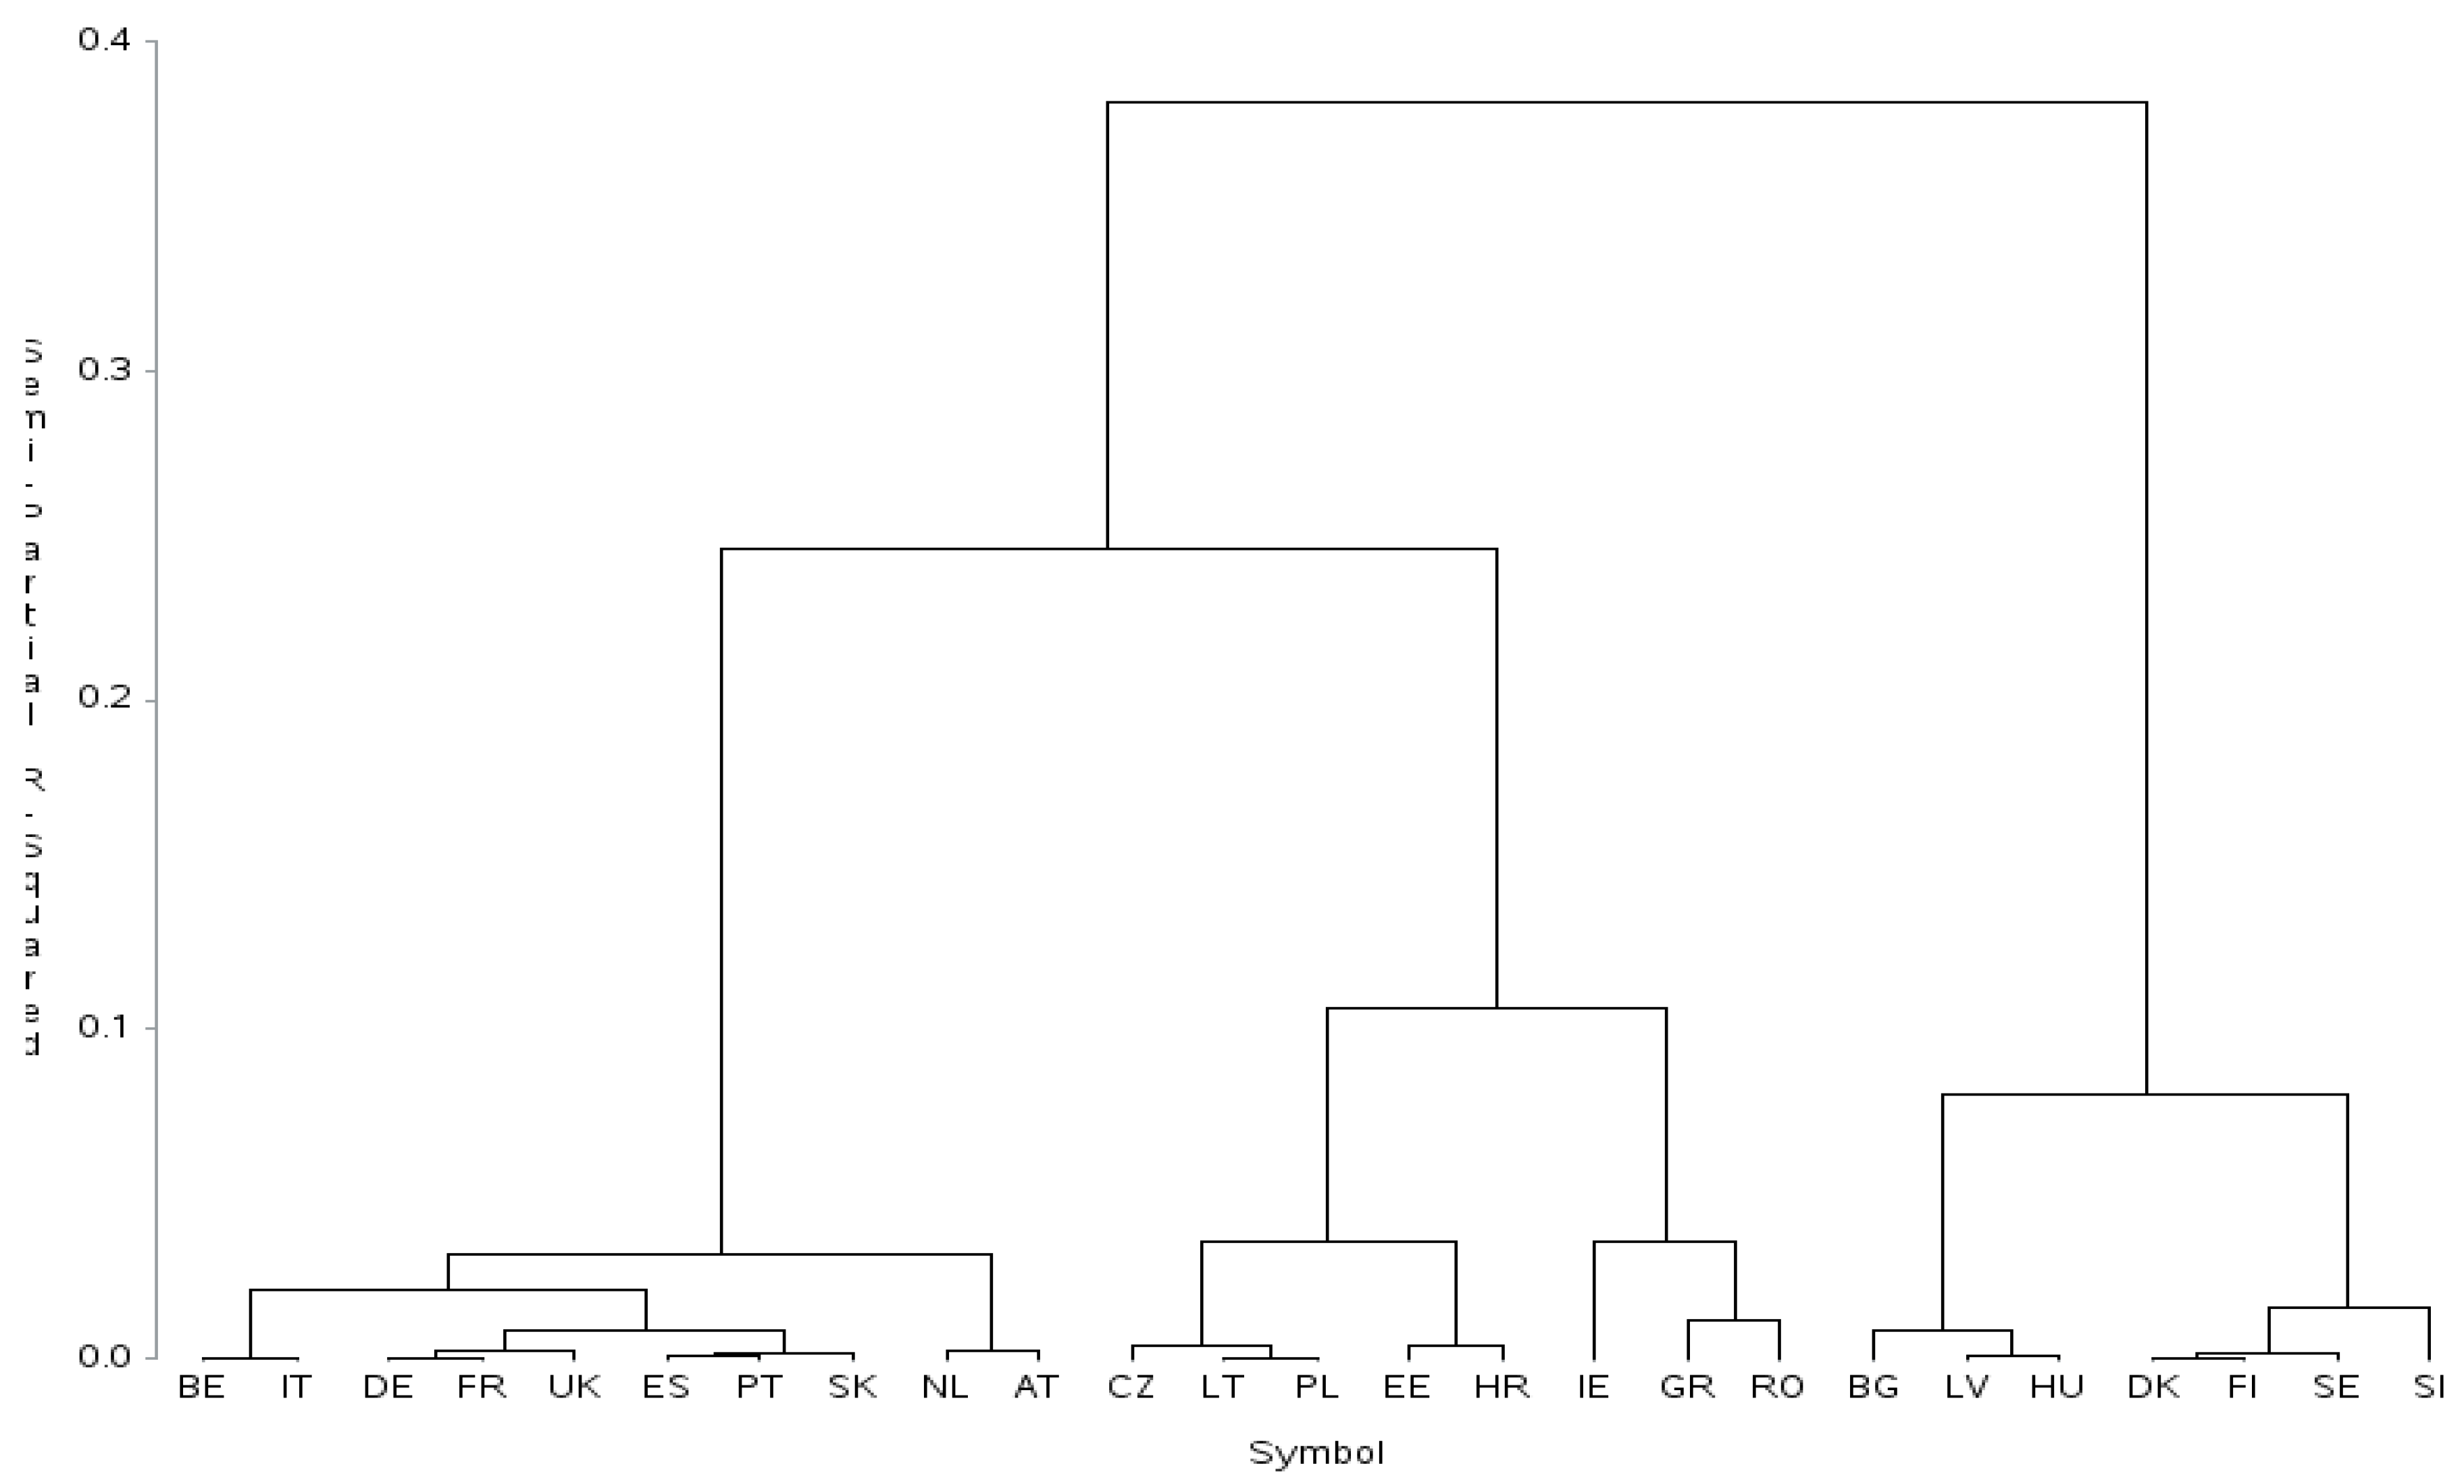
For a better graphical representation, we grouped the 5 clusters obtained by the Ward method into 4 clusters as follows: Cluster 1 (Czech Republic, Lithuania, Poland, Estonia, Croatia, Ireland, Greece, Romania, Slovakia, and Portugal); Cluster 2 (Belgium, Italy, Germany, France, Spain, The Netherlands, Austria, and Denmark); Cluster 3 (Finland, Sweden and Slovenia) and Cluster 4 (Bulgaria, Latvia and Hungary). Cluster 1 represents the aggregation of Cluster 2 and Cluster 3 plus Slovakia and Portugal from Cluster 1 corresponding to the Ward grouping. Cluster 2 comprises the Cluster 1 countries, plus Denmark in Cluster 5 for the Ward group. The resulting Cluster 3 comprises the three remaining countries in Cluster 5 according to the Ward method and Cluster 4 defined above is the equivalent of Cluster 4 defined by the Ward method.
The cluster analysis shows interesting evolution.
In 2012 Romania, Greece, Croatia and Poland had a social climate improper for applying tough structural reforms (the social adjustment coefficient was less than 1, decreasing the GCI level, so we cannot say that competitiveness was socially sustainable). Still, in the analyzed period, Romania, Greece and Croatia improved the indicators taken into account by the World Economic Forum to characterize the social competitiveness, but the social adjustment coefficient of GCI remained below 1 (Table 1). We may notice an increase of GCI in all countries from this cluster and a lower social sustainability adjustment coefficient in 2014 compared to 2012 in the case of Portugal, a stagnation/marginal increase of social sustainability in the case of Ireland, Czech Republic, Lithuania, Slovakia and even Greece, as well as a quite higher focus for a restoration of the social safety net in Romania, Estonia and Croatia.
As for the countries from cluster 2, we can notice the following processes related to the period 2012–2014. In 2012 Italy started from a higher GCI than ssaGCI, which reveals a problematic social climate. Although the social sustainability coefficient still remains less than 1, the situation seems to improve. The figures resulting from the calculation of the GCI adjustment coefficient in terms of social sustainability show a fiscal adjustment (lower share of structural budget deficit in the potential GDP) accompanied by the worsening of ssaGCI after the reduction of GCI and of the sustainability coefficient (the cases of The Netherlands, Belgium, France and Spain), only the reduction of the social sustainability coefficient and the constancy of GCI (the example of Denmark), while in Germany the lower increase of GCI was affected by the marginal decrease of the social sustainability coefficient (Table 2). In Italy, GCI worsened and the social sustainability coefficient improved. In Austria the increase in economic competitiveness did not succeed in significantly affecting the social sustainability, GCI increased and the sustainability coefficient decreased.
All the countries in cluster 3 (Finland, Sweden and Slovenia) had decreases in the economic competitiveness in 2014 compared to 2012. The coefficient showing the social sustainability remained constant in Finland and Sweden and decreased in Slovenia, where the decrease of economic competitiveness was simultaneous with the reduction of the social safety net (Table 3).
The countries composing Cluster 4 reveal the following situation. In 2012, the social sustainability coefficient was less than 1 in Bulgaria and more than 1 in Latvia and Hungary. In 2014 the Global Competitiveness Index improved in Bulgaria and Latvia, but decreased in Hungary. The dynamics of the social competitiveness adjustment coefficient show improvement in Bulgaria and Hungary and decrease in Latvia (Table 4).
The detailed analysis of the results obtained showed quite an interesting evolution. At the top of Figure 1 (quadrants corresponding to clusters 1 and 4) we counted 13 EU countries with the improvement of the ssaGCI. However, by decomposing ssaGCI in GCI evolution and in the GCI evolution, social sustainability adjusted Global Competitiveness Index we can notice that, out of the 13 countries with improvement of ssaGCI (no matter whether they implemented fiscal adjustment or fiscal stimulus programs), 11 countries (Ireland, Estonia, Czech Republic, Lithuania, Poland, Romania, Croatia, Greece, Slovakia, Bulgaria and Hungary) recorded an improvement of ssaGCI with an increased value for the social sustainability adjusted Competitiveness index and two countries (Portugal and Latvia) experienced an improvement of ssaGCI based on the increased economic competitiveness without an improvement of social sustainability adjusted Competitiveness index.
At the bottom of Figure 1 (quadrants 2 and 3) we find 11 EU countries which recorded a worsening of ssaGCI no matter whether they implemented fiscal adjustment programs or not. The analysis of the decomposition of ssaGCI in GCI trend and the evolution of social sustainability adjusted Competitiveness index shows the situation in which eight out of the total of 11 countries recorded decreases/stable social sustainability adjusted Competitiveness index (The Netherlands, Germany, Denmark, Austria, France, Finland, Sweden and Slovenia) and only three countries (Belgium, Spain and Italy) obtaining a marginal improvement in the social sustainability adjusted Competitiveness index.
To conclude, 14 out of a total of 24 EU countries analyzed recorded an improvement of the ssaGCI, while the rest (10 countries) experienced a deterioration of the indicators taken into account by the World Economic Forum to characterize social sustainability.
Given this perspective, it is interesting to analyze what happened, socially, in the cluster 1 countries, if these states were really able to achieve fiscal consolidation along with an improvement of social sustainability. It is also interesting to see how 9 out of 10 countries succeeded implement austerity programs and achieve also an improvement of social sustainability.
4. Did EU Periphery States Really Implement Social-Sustainable Fiscal Adjustment Programs? An Analysis Fot the Cluster 1 Countries
We will make an analysis of the reality of social sustainability improvement for the 10 countries in cluster 1 by using a few relevant indicators: severe material deprivation rate—considered to be the most reliable indicator that measures poverty; Gini coefficient—an indicator frequently used to measure the income polarization and inequality; in-work poverty risk rate, overall unemployment rate and youth unemployment rate.
In terms of material deprivation rate evolution (Table 5), the situation in the Czech Republic shows a decrease in 2009–2011 followed by its worsening in 2012–2014, when it returned to the pre-crisis value. In Estonia we may notice an increase of material deprivation in 2009–2012 followed by a decrease in the past two years. In both Ireland and Greece, we can notice a strong worsening of the material deprivation rate between 2011–2014. Overall, in the countries analyzed, we can notice a worsened situation of the material deprivation in 2014 compared to 2008, the year when the crisis emerged. Better trends are to be found in Poland, Romania and Slovakia, where the material deprivation rate is lower than in pre-crisis years 2007/2008. Portugal and Croatia had mixed evolution. Between 2015 and 2017, a decline in the material deprivation rate is present in the Czech Republic, Ireland, Croatia, Lithuania, Poland, Portugal and Slovakia, while Estonia, Greece and Romania reveal mixed developments. These processes may indicate the lack of social sustainability of the post-crisis economic recovery process.
The income inequality expressed by the evolution of the Gini coefficient (Table 6) shows economic and social polarization. A growing coefficient reveals higher risks of economic, social and political uncertainty and also the possible negative effects on the future economic growth. Except for Slovakia and the Czech Republic, in the analyzed countries we may notice Gini coefficients of over 30 points, which shows relatively uneven societies in terms of income inequality. Compared to 2008, the year when the crisis erupted in the countries, we can notice a deterioration of the income inequality indicator in 2014 in the Czech Republic, Estonia, Ireland, Greece, Lithuania and Slovakia. A decrease of economic polarization may be seen in Poland, Portugal and Romania, countries where the need for fiscal adjustment seemed to have been accompanied by the desire for a consolidation of the social safety net.
Data for 2015–2016 show an increase in economic polarization compared to 2008 in the Czech Republic, Estonia, Greece, Lithuania and Slovakia, thus demonstrating that the post-crisis public policies did not have a strong social equity component. In Ireland, Poland and Portugal the economic recovery was accompanied by a reduction in economic polarization. A special case is Romania, where the year 2015 brought an increase in the value of the Gini index followed by its reduction to below the post-crisis value in 2016.
The economic and financial crisis hit strongly in the processes of job creation, triggering significant increases in the total unemployment rate (Table 7) and especially the youth jobless rate (Table 8). The total unemployment rate in 2014 compared to 2008 was three times higher in Greece and double in Ireland, Lithuania, Croatia and Portugal. Smaller increases were recorded by Romania, the Czech Republic, Estonia and Slovakia.
In 2017, the unemployment rate was near the 2008 level rate in Estonia, Ireland and Portugal and lower than the pre-crisis level in the Czech Republic, Poland, Romania and Slovakia. A higher unemployment rate in the current year compared to the 2008 is noticed in Croatia, Lithuania and especially in Greece.
Data show that the crisis burden fell mostly on young people, youth jobless rate for the under-25 posting incredible values of 52.4% in Greece, 45.5% in Croatia, 34.7% in Portugal or 29.7% in Slovakia in 2014. We also find high values Poland, Romania and Ireland, where one out of four youngsters is unemployed. In 2017, the youth unemployment rate is higher than the 2008 level in most of the countries analyzed, a decrease in this indicator being observed only in the Czech Republic, Poland and Slovakia.
The screening of these indicators reveals mixed evolution, with fiscal adjustment programs focused on restoring the social safety net in Poland, Romania and Slovakia, along with a high deterioration of the social indicators shown by Greece and Ireland.
The 2012–2014 period (in focus throughout the research due to the availability of WEF data on ssaGCI) is characterized by a reversing and compensation of the harsh austerity measures implemented in the first four post-crisis years. Thus, the speed of adjustment was reduced, the so-called “fiscal adjustment fatigue” in cluster 1 European countries was caused by the strong burden on population and companies in the drive to urgently cut budget deficits. It was obvious that, after four harsh austerity years with average or high amplitude, it would seem reasonable to balance the quantitative part of the fiscal adjustment—reduction of budget deficits—with its qualitative part—a higher equity by shifting more burden on the shoulders of those with higher incomes, reducing tax evasion and maintaining the appetite for continued structural reforms through a targeted protection aimed at maintaining a reasonable purchasing power for vulnerable social groups. The 2015–2017 period shows an improvement in the analyzed social indicators.
In fact, European public policymakers have realized the importance of setting a gradual fiscal consolidation that ensures a reasonable quality of public utility services and does not aggravate inequality, poverty and material deprivation problems. The results obtained in our research highlight the need to provide an optimal mix of measures that will lead to both an improvement of the fiscal situation and maintaining a social safety net. Otherwise, the emergence of populist political movements will sacrifice both the objectives of fiscal consolidation and social sustainability.
5. Conclusions
In this study, we analyzed to what extent the fiscal adjustment programs in 24 selected EU countries resulted in increased, social sustainable economic competitiveness, based on the screening of the structural budget deficit and Social sustainability adjusted Global Competitiveness Index, calculated by World Economic Forum. After the implementation of harsh austerity measures in 2008–2011, the fiscal adjustment programs throughout 2012–2014 involved also measures aimed at ensuring social equality, with an obvious purpose of macroeconomic policymakers of shifting from a quantitative fiscal consolidation (to identify where cuts can be made) to a qualitative fiscal consolidation (to cut only the waste)—in other words, a reduction of the structural budget deficit accompanied by improvement of the social sustainability indicators.
Being aware of the need for restoring the social safety net, highly deteriorated during 2008–2011, allowed some countries to continue the fiscal consolidation and reforms at strengthening the financial and budgetary discipline. Reducing the social pressure buys time for the implementation of further structural reforms, including the ones aimed at enhancing sustainable and inclusive economic growth.
As regards the accuracy and the compatibility of our results and conclusions, it is necessary to explain that the evolution of the main macroeconomic and social indicators in the analyzed countries using the cluster method validates the output of our research. Thus, countries that implemented a qualitative fiscal consolidation without damaging the potential of economic growth and their social tissue have had a sustained post-crisis development. Results and conclusions of our research can help the policymakers in the future design of internal or external shock response packages.
Thus, the next step was a socially intelligent fiscal consolidation, with economic measures wisely combined with steps aimed at reducing poverty, social inequality and unemployment. Practically, the speed of fiscal adjustment gradually slowed with the benefits of raising support and the acceptance for implementing reforms by the public/population.
The measures implemented in the past three years, along with public policy programs announced for the next three years, confirm this approach, with fiscal strains in place and greater concern of public policy makers to ensure a socially-sustainable economic recovery and catching up.
The analysis of the fiscal adjustment programs implemented in the EU countries allows us to lie down a few assumptions about designing an “ideal fiscal consolidation program”. Among them we can find: credible adjustment objectives; measure aimed at achieving sustainable economic growth; activation of engines of the endogenous economic growth—investments in research and development, innovation, knowledge, human capital; structural reforms in education, health, agriculture and infrastructure; optimal sequence of the measures in the adjustment program; efficient communication of the need to implement fiscal adjustment measures; the existence of alternative financing scenarios; the adjustment program should be equitable, with burdens proportional to the financial potency; implementation of active measures to create jobs, especially for the youth; a balanced mix between the fiscal and the monetary policy.
Among the measures to be implemented within an “ideal fiscal consolidation program”, we propose a good coordination between monetary, fiscal and revenue policies. As far as fiscal policies are concerned, it is necessary for decision makers to identify “growth friendly” tax increases and/or expenditure cuts that would not dramatically harm the economic potential. Monetary policy measures need to be targeted so as not to strongly distort lending and investment, with specific macroprudential tools in place. Revenue policies must be prioritized towards maintaining/increasing the purchasing power of vulnerable social groups.
European countries that have implemented a mix of measures close to the “ideal fiscal consolidation program” have had only marginal potential GDP cuts and recovered rapidly.
On the other hand, we might add: the increase of the potential GDP by smart measures—investments in energy, IT, industrial clusters, regional business hubs, rural development; the reduction of waste in public spending; firm program for reducing tax evasion and undeclared work; improvement of corporate governance in the state companies; prevention rather than reactive, passive and ex post action; removal of annuities with simultaneous measures for most employees to leave the trap of low wages; closing of the border of EU technological development through investments from structural and cohesion European funds and internal budgetary resources.
An intelligent mix of incentive measures of aggregated supply and demand can, socially, lead to increased sustainable competitiveness in the reviewed countries of the European Union.
Author Contributions
Conceptualization, C.S. and M.M.; Methodology, D.A. and C.S.; Software, D.A.; Validation, A.G.S. and M.M.; Formal Analysis, M.M., A.G.S. and D.A.; Data Curation, A.G.S.; Writing-Original Draft Preparation, A.G.S. and C.S.; Writing-Review & Editing, M.M., C.S. and D.A.
Funding
This research received no external funding.
Conflicts of Interest
The authors declare no conflict of interest.
Appendix A
Analysis of clusters based on correlation ΔssaGCI2014-2012—ΔStructural Deficit (% of GDP) using the Ward method
Cluster Analysis—WARD

Table A1.
The CLUSTER Procedure. Ward’s Minimum Variance Cluster Analysis.
| Eigenvalues of the Covariance Matrix | ||||
|---|---|---|---|---|
| Eigenvalue | Difference | Proportion | Cumulative | |
| 1 | 1.19314057 | 0.38628115 | 0.5966 | 0.5966 |
| 2 | 0.80685943 | 0.4034 | 1.0000 | |
| Root-Mean-Square Total-Sample Standard Deviation | 1 | |||
| Root-Mean-Square Distance Between Observations | 2 | |||
Table A2.
Cluster History.
| No. of Clusters | Clusters Joined | Freq | Semipartial R-Square | R-Square | Approximate Expected R-Square | Cubic Clustering Criterion | Pseudo F Statistic | Pseudo t-Squared | Tie | |
|---|---|---|---|---|---|---|---|---|---|---|
| 24 | BE | IT | 2 | 0.0001 | 1.00 | . | . | 470 | . | |
| 23 | DK | FI | 2 | 0.0001 | 1.00 | . | . | 376 | . | |
| 22 | DE | FR | 2 | 0.0003 | 0.999 | . | . | 255 | . | |
| 21 | LT | PL | 2 | 0.0004 | 0.999 | . | . | 216 | . | |
| 20 | LV | HU | 2 | 0.0006 | 0.999 | . | . | 176 | . | |
| 19 | ES | PT | 2 | 0.0010 | 0.997 | . | . | 132 | . | |
| 18 | CL23 | SE | 3 | 0.0016 | 0.996 | . | . | 99.1 | 10.8 | |
| 17 | CL19 | SK | 3 | 0.0018 | 0.994 | . | . | 83.5 | 1.8 | |
| 16 | CL22 | UK | 3 | 0.0022 | 0.992 | . | . | 72.7 | 7.0 | |
| 15 | NL | AT | 2 | 0.0027 | 0.989 | . | . | 65.0 | . | |
| 14 | EE | HR | 2 | 0.0037 | 0.985 | . | . | 57.2 | . | |
| 13 | CZ | CL21 | 3 | 0.0037 | 0.982 | . | . | 53.6 | 10.2 | |
| 12 | BG | CL20 | 3 | 0.0084 | 0.973 | . | . | 43.0 | 15.0 | |
| 11 | CL16 | CL17 | 6 | 0.0089 | 0.964 | . | . | 37.9 | 6.6 | |
| 10 | GR | RO | 2 | 0.0115 | 0.953 | . | . | 33.6 | . | |
| 9 | CL18 | SI | 4 | 0.0152 | 0.938 | . | . | 30.1 | 17.2 | |
| 8 | CL24 | CL11 | 8 | 0.0207 | 0.917 | . | . | 26.8 | 8.6 | |
| 7 | CL8 | CL15 | 10 | 0.0316 | 0.885 | . | . | 23.2 | 6.7 | |
| 6 | IE | CL10 | 3 | 0.0356 | 0.850 | . | . | 21.5 | 3.1 | |
| 5 | CL13 | CL14 | 5 | 0.0358 | 0.814 | 0.866 | −2.0 | 21.9 | 13.8 | |
| 4 | CL12 | CL9 | 7 | 0.0802 | 0.734 | 0.814 | −2.3 | 19.3 | 15.5 | |
| 3 | CL5 | CL6 | 8 | 0.1063 | 0.627 | 0.725 | −2.2 | 18.5 | 7.0 | |
| 2 | CL7 | CL3 | 18 | 0.2460 | 0.382 | 0.493 | −1.6 | 14.2 | 14.8 | |
| 1 | CL2 | CL4 | 25 | 0.3815 | 0.000 | 0.000 | 0.00 | . | 14.2 | |
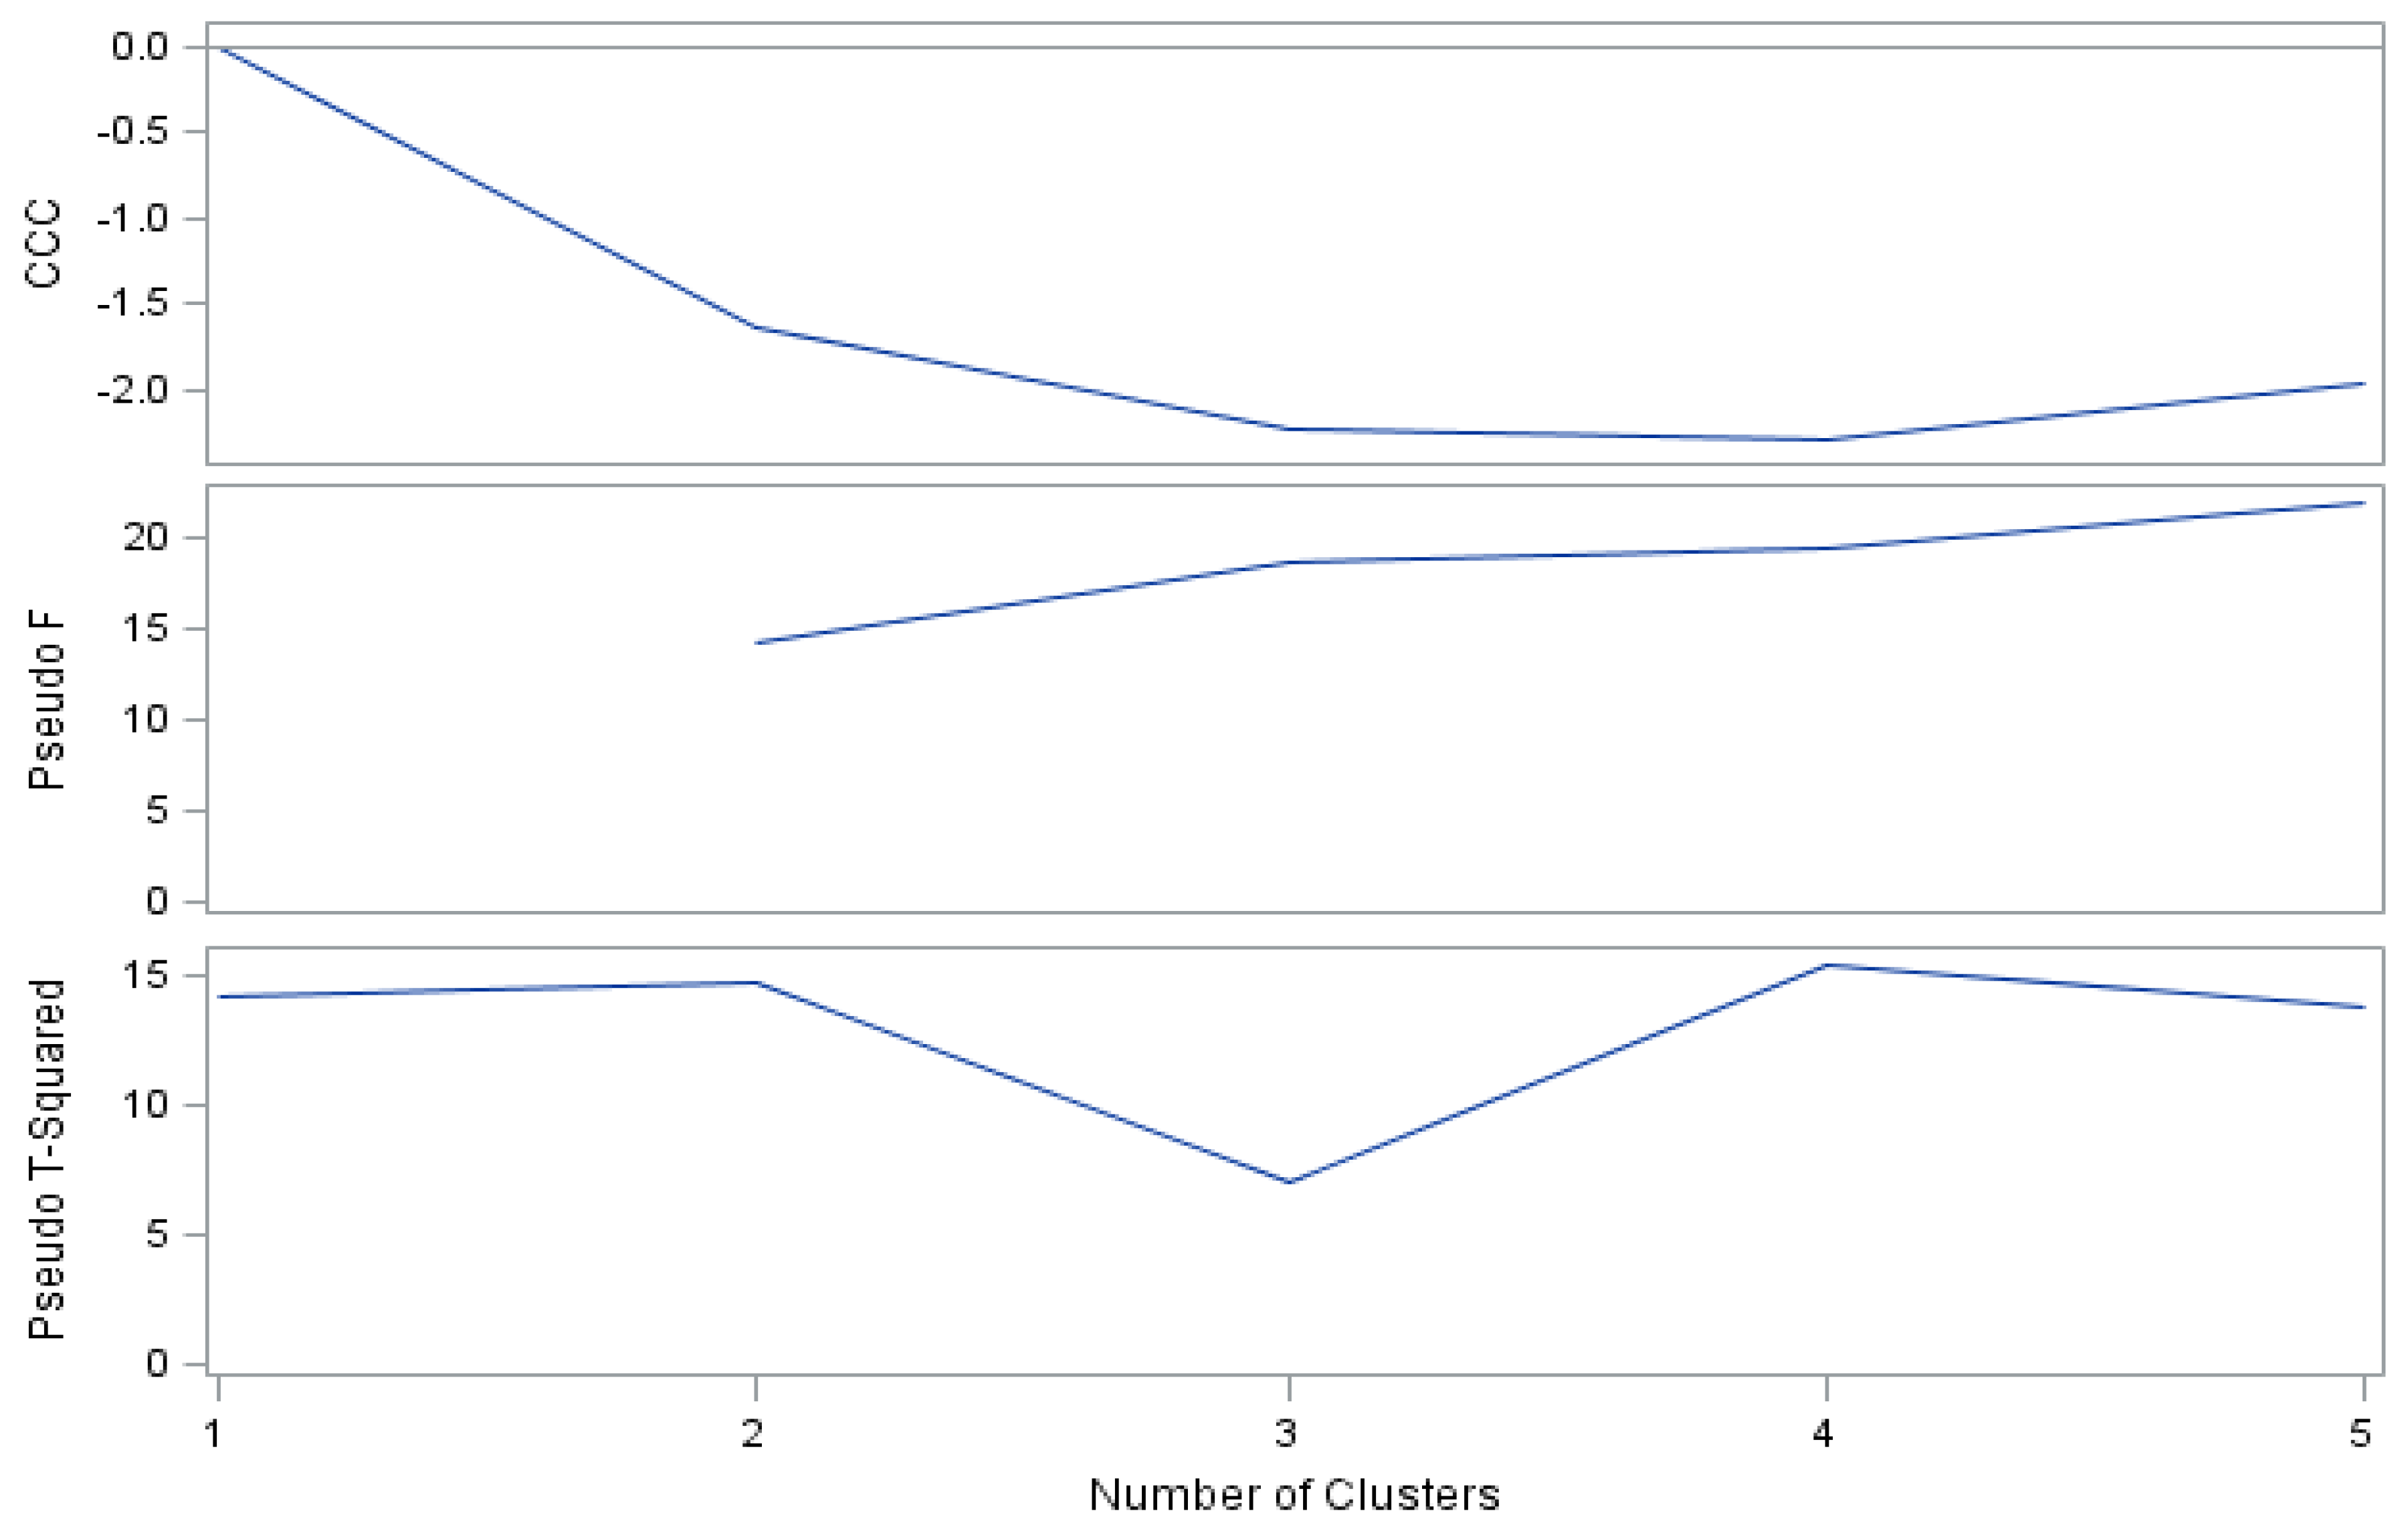
The number of clusters was 5 and was chosen based on a series of criteria: CCC, PseudoF and Pseudo T-squared.
Figure A1.
Criteria for the Number of Clusters.

Figure A2.
Cluster Analysis.

Figure A3.
Ward classification dendrogram.

Table A3.
The clusters obtained are the following.
| →Cluster 1: | →Cluster 4: |
| ○ Belgium(BE) | ○ Bulgaria(BG) |
| ○ Italy(IT) | ○ Latvia(BG) |
| ○ Germany(DE) | ○ Hungary(HU) |
| ○ France(FR) | →Cluster 5: |
| ○ United Kingdom(UK) | ○ Denmark(DK) |
| ○ Spain(ES) | ○ Finland(FI) |
| ○ Portugal(PT) | ○ Sweden(SE) |
| ○ Slovakia(SK) | ○ Slovenia(SI) |
| ○ The Netherlands(NL) | |
| ○ Austria(AT) | |
| →Cluster 2: | |
| ○ Czech Republic(CZ) | |
| ○ Lithuania(LT) | |
| ○ Poland(PL) | |
| ○ Estonia(EE) | |
| ○ Croatia(HR) | |
| →Cluster 3: | |
| ○ Ireland(IE) | |
| ○ Greece(GR) | |
| ○ Romania(RO) |
The Discriminatory Analysis Applied to Ward Results
Table A4.
The DISCRIM Procedure. Classification Summary for Calibration Data: PROIECT.WARD2. Resubstitution Summary using Linear Discriminant Function.
Table A4.
The DISCRIM Procedure. Classification Summary for Calibration Data: PROIECT.WARD2. Resubstitution Summary using Linear Discriminant Function.
| Number of Observations and Percent Classified into CLUSTER | ||||||
|---|---|---|---|---|---|---|
| From CLUSTER | 1 | 2 | 3 | 4 | 5 | Total |
| 1 | 10 | 0 | 0 | 0 | 0 | 10 |
| 100 | 0 | 0 | 0 | 0 | 100 | |
| 2 | 0 | 4 | 0 | 0 | 0 | 4 |
| 0 | 100 | 0 | 0 | 0 | 100 | |
| 3 | 0 | 0 | 5 | 0 | 0 | 5 |
| 0 | 0 | 100 | 0 | 0 | 100 | |
| 4 | 0 | 0 | 0 | 3 | 0 | 3 |
| 0 | 0 | 0 | 100 | 0 | 100 | |
| 5 | 0 | 0 | 0 | 0 | 3 | 3 |
| 0 | 0 | 0 | 0 | 100 | 100 | |
| Total | 10 | 4 | 5 | 3 | 3 | 25 |
| 40 | 16 | 20 | 12 | 12 | 100 | |
| Priors | 0.2 | 0.2 | 0.2 | 0.2 | 0.2 | |
The accuracy of the model is checked by the following table, resulting in a 0% framing error, so 100% accuracy.
Table A5.
Error Count Estimates for CLUSTER.
| Indicators | 1 | 2 | 3 | 4 | 5 | Total |
|---|---|---|---|---|---|---|
| Rate | 0.0000 | 0.0000 | 0.0000 | 0.0000 | 0.0000 | 0.0000 |
| Priors | 0.2000 | 0.2000 | 0.2000 | 0.2000 | 0.2000 |
References
- Keynes, M.J. The General Theory of Employment, Interest and Money; Harcourt Brace & World: Gainesville, FL, USA, 1964. [Google Scholar]
- Blyth, M. Austerity. History of a Dangerous Idea; Tact Publishing House: Cluj Napoca, Romania, 2015. [Google Scholar]
- Wolf, M. Fixing Global Finance; John Hopkins University Press: Baltimore, MD, USA, 2010. [Google Scholar]
- Giavazzi, F.; Pagano, M. Can Severe Fiscal Contractions Be Expansionary? Tales of Two Small European Countries; Working Paper; The National Bureau of Economic Research: Cambridge, MA, USA, 1990; Volume 3372.
- Alesina, A.; Perotti, R. Fiscal Expansions and Fiscal Adjustments in OCDE Countries; NBER Working Paper No. 5214; National Bureau of Economic Research: Cambridge, MA, USA, 1995. [Google Scholar]
- Alberto, A.; Ardagna, S. Tales of Fiscal Adjustment. Econ. Policy 1998, 13, 489–585. [Google Scholar]
- DeLong, B.; Summers, L.H. Fiscal Policy in a Depressed Economy; Working Paper Brookings Paper on Economic Activity; The Brookings Institution: Massachusetts Ave., WA, USA, 2012. [Google Scholar]
- DeLong, B. Spending Cuts to Improve Confidence? No, the Arithmetic Goes the Wrong Way. VoxEu.org 2012. Available online: http://www.voxeu.org/article/spending-cuts-improve-confidence-no-arithmetic-goes-wrong-way (accessed on 12 June 2018).
- European Parliament. Social Dimension of Austerity Measures. Cases of four EU Countries in Receipt of Financial Assistance; European Parliamentary Research Service: Bruxelles, Belgium, 2013; pp. 1–6. [Google Scholar]
- Alesina, A.; Barbiero, O.; Favero, C.; Giavazzi, F.; Paradisi, M. Austerity in 2009–2013; NBER Working Papers No. 20827; National Bureau of Economic Research: Cambridge, MA, USA, 2015.
- Ștefănescu-Mihăilă, R.O. Social Investment, Economic Growth and Labor Market Performance: Case Study—Romania. Sustainability 2015, 7, 2961–2979. [Google Scholar] [CrossRef] [Green Version]
- Lecerf, M. Poverty in the European Union. The Crisis and Its Aftermath; European Parliamentary Research Service: Bruxelles, Belgium, 2016; pp. 1–29. [Google Scholar]
- Djankova, S.; Nikolovab, E.; Zilinskyc, J. The happiness gap in Eastern Europe. J. Comp. Econ. 2016, 44, 108–124. [Google Scholar] [CrossRef]
- Michail, N.A.; Savva, C.S.; Koursaros, D. Size Effects of Fiscal Policy and Business Confidence in the Euro Area. Int. J. Financ. Stud. 2017, 5, 26. [Google Scholar] [CrossRef]
- Rădulescu, M.; Fedajev, A.; Sinisi, C.I.; Popescu, C.; Iacob, S.E. Europe 2020 Implementation as Driver of Economic Performance and Competitiveness. Panel Analysis of CEE Countries. Sustainability 2018, 10, 566. [Google Scholar] [CrossRef]
- Popescu, Gh.; Sima, V.; Nica, E.; Gheorghe, I.G. Measuring Sustainable Competitiveness in Contemporary Economies—Insights from European Economy. Sustainability 2017, 9, 1230. [Google Scholar] [CrossRef]
- Paulusa, A.; Figarib, F.; Sutherlanda, H. The Design of Fiscal Consolidation Measures in the European Union: Distributional Effects and Implications for Macro-Economic Recovery; Oxford Economic Papers; Oxford University Press: Oxford, UK, 2016; pp. 1–23. [Google Scholar]
- Perez, S.A.; Matsaganis, M. The Political Economy of Austerity in Southern Europe. New Political Econ. 2017, 23, 192–207. [Google Scholar] [CrossRef] [Green Version]
- International Monetary Fund. Inequality and Poverty Across Generations in the European Union; IMF Staff Discussion Note; International Monetary Fund: Washington, DC, USA, 2018; Volume 18. [Google Scholar]
- Organisation for Economic Co-Operation and Development. Understanding the Socio-Economic Divide in Europe; OECD Report; Organisation for Economic Co-Operation and Development: Paris, France, 2017. [Google Scholar]
- Kolev, G.; Matthes, J. Smart Fiscal Consolidation. A Strategy for Achieving Sustainable Public Finances and Growth; Working Paper Centre for European Studies: Bruxelles, Belgium, 2018. [Google Scholar]
- Mavridis, S. Greece’s Economic and Social Transformation 2008–2017. Soc. Sci. 2018, 7, 9. [Google Scholar] [CrossRef]
- Felipe, J.; Kumar, U. Unit Labor Costs in Eurozone: The Competitiveness Debate Again; Working Paper Levy Economics Institute of Bard College: New York, NY, USA, 2011; Volume 651. [Google Scholar]
- World Economic Forum. The Global Competitiveness Report 2014–2015. 2014. Available online: http://www.weforum.org/reports/global-competitiveness-report-2014-2015 (accessed on 15 May 2017).
Figure 1.
The relationship between the change of the structural budget deficit share in the potential GDP and the change of the Social Sustainability-Adjusted Global Competitiveness Index (ssaGCI).
Figure 1.
The relationship between the change of the structural budget deficit share in the potential GDP and the change of the Social Sustainability-Adjusted Global Competitiveness Index (ssaGCI).

Table 1.
EU countries which implemented fiscal consolidation and recorded increases in ssaGCI—Cluster 1.
Table 1.
EU countries which implemented fiscal consolidation and recorded increases in ssaGCI—Cluster 1.
| Countries | 2012 | 2014 | ||||
|---|---|---|---|---|---|---|
| GCI | ssaGCI | Coefficient of Social Sustainability Adjustment | GCI | ssaGCI | Coefficient of Social Sustainability Adjustment | |
| Ireland | 4.91 | 5.26 | 1.07 | 4.98 | 5.38 | 1.08 |
| Estonia | 4.64 | 4.82 | 1.04 | 4.71 | 5.13 | 1.09 |
| Portugal | 4.4 | 4.58 | 1.04 | 4.54 | 4.61 | 1.02 |
| Czech Republic | 4.51 | 4.89 | 1.08 | 4.53 | 4.97 | 1.10 |
| Lithuania | 4.41 | 4.52 | 1.02 | 4.51 | 4.66 | 1.03 |
| Poland | 4.46 | 4.32 | 0.97 | 4.48 | 4.48 | 1.00 |
| Romania | 4.07 | 3.71 | 0.91 | 4.3 | 4.13 | 0.96 |
| Croatia | 4.04 | 3.84 | 0.95 | 4.13 | 4.06 | 0.98 |
| Greece | 3.86 | 3.59 | 0.93 | 4.04 | 3.85 | 0.95 |
| Slovakia | 4.14 | 4.18 | 1.01 | 4.15 | 4.23 | 1.02 |
Table 2.
EU countries which implemented fiscal consolidation and recorded worsening in ssaGCI—Cluster 2.
Table 2.
EU countries which implemented fiscal consolidation and recorded worsening in ssaGCI—Cluster 2.
| Countries | 2012 | 2014 | ||||
|---|---|---|---|---|---|---|
| GCI | ssaGCI | Coefficient of Social Sustainability Adjustment | GCI | ssaGCI | Coefficient of Social Sustainability Adjustment | |
| The Netherlands | 5.5 | 6.54 | 1.19 | 5.45 | 6.39 | 1.17 |
| Germany | 5.48 | 6.37 | 1.16 | 5.49 | 6.36 | 1.16 |
| Denmark | 5.29 | 6.21 | 1.17 | 5.29 | 6.14 | 1.16 |
| Austria | 5.22 | 6.17 | 1.18 | 5.29 | 6.14 | 1.16 |
| Belgium | 5.21 | 5.9 | 1.13 | 5.18 | 5.89 | 1.14 |
| France | 5.11 | 5.59 | 1.09 | 5.08 | 5.56 | 1.09 |
| Spain | 4.6 | 4.66 | 1.01 | 4.55 | 4.65 | 1.02 |
| Italy | 4.46 | 4.32 | 0.97 | 4.42 | 4.36 | 0.99 |
Table 3.
EU countries which implemented fiscal consolidation and recorded worsening in ssaGCI—Cluster 3.
Table 3.
EU countries which implemented fiscal consolidation and recorded worsening in ssaGCI—Cluster 3.
| Countries | 2012 | 2014 | ||||
|---|---|---|---|---|---|---|
| GCI | ssaGCI | Coefficient of Social Sustainability Adjustment | GCI | ssaGCI | Coefficient of Social Sustainability Adjustment | |
| Finland | 5.55 | 6.45 | 1.16 | 5.5 | 6.38 | 1.16 |
| Sweden | 5.53 | 6.17 | 1.12 | 5.41 | 6.05 | 1.12 |
| Slovenia | 4.34 | 4.76 | 1.10 | 4.22 | 4.52 | 1.07 |
Table 4.
EU countries which implemented fiscal stimulation programs and recorded improvement in ssaGCI—Cluster 4.
Table 4.
EU countries which implemented fiscal stimulation programs and recorded improvement in ssaGCI—Cluster 4.
| Countries | 2012 | 2014 | ||||
|---|---|---|---|---|---|---|
| GCI | ssaGCI | Coefficient of Social Sustainability Adjustment | GCI | ssaGCI | Coefficient of Social Sustainability Adjustment | |
| Bulgaria | 4.27 | 4.17 | 0.98 | 4.37 | 4.31 | 0.99 |
| Hungary | 4.3 | 4.29 | 1.00 | 4.28 | 4.35 | 1.02 |
| Latvia | 4.35 | 4.55 | 1.05 | 4.5 | 4.64 | 1.03 |
Table 5.
Severe material deprivation rate evolution in selected EU countries.
| Country | 2007 | 2008 | 2009 | 2010 | 2011 | 2012 | 2013 | 2014 | 2015 | 2016 | 2017 |
|---|---|---|---|---|---|---|---|---|---|---|---|
| Czech Republic | 7.4 | 6.8 | 6.1 | 6.2 | 6.1 | 6.6 | 6.6 | 6.7 | 5.6 | 4.8 | 3.7 |
| Estonia | 5.6 | 4.9 | 6.2 | 9.0 | 8.7 | 9.4 | 7.6 | 6.2 | 4.5 | 4.7 | 4.1 |
| Ireland | 4.5 | 5.5 | 6.1 | 5.7 | 7.8 | 9.8 | 9.9 | 8.4 | 7.5 | 6.5 | - |
| Greece | 11.5 | 11.2 | 11.0 | 11.6 | 15.2 | 19.5 | 20.3 | 21.5 | 22.2 | 22.4 | 21.1 |
| Croatia | n.a. | n.a. | n.a. | 14.3 | 15.2 | 15.9 | 14.7 | 13.9 | 13.7 | 12.5 | 10.3 |
| Lithuania | 16.6 | 12.5 | 15.6 | 19.9 | 19.0 | 19.8 | 16.0 | 13.6 | 13.9 | 13.5 | - |
| Poland | 22.3 | 17.7 | 15.0 | 14.2 | 13.0 | 13.5 | 11.9 | 10.4 | 8.1 | 6.7 | - |
| Portugal | 9.6 | 9.7 | 9.1 | 9.0 | 8.3 | 8.6 | 10.9 | 10.6 | 9.6 | 8.4 | 6.9 |
| Romania | 36.5 | 32.7 | 32.1 | 30.5 | 29.5 | 31.1 | 29.8 | 25.9 | 22.7 | 23.8 | - |
| Slovakia | 13.7 | 11.8 | 11.1 | 11.4 | 10.6 | 10.5 | 10.2 | 9.9 | 9.0 | 8.2 | - |
Table 6.
Evolution of Gini coefficient in selected EU countries.
| Country | 2007 | 2008 | 2009 | 2010 | 2011 | 2012 | 2013 | 2014 | 2015 | 2016 |
|---|---|---|---|---|---|---|---|---|---|---|
| Czech Republic | 25.3 | 24.7 | 25.1 | 24.9 | 25.2 | 24.9 | 24.6 | 25.1 | 25.0 | 25.1 |
| Estonia | 33.4 | 30.9 | 31.4 | 31.3 | 31.9 | 32.5 | 32.9 | 35.6 | 34.8 | 32.7 |
| Ireland | 31.3 | 29.9 | 28.8 | 30.7 | 29.8 | 30.5 | 30.7 | 31.1 | 29.8 | 29.5 |
| Greece | 34.3 | 33.4 | 33.1 | 32.9 | 33.5 | 34.3 | 34.4 | 34.5 | 34.2 | 34.3 |
| Croatia | n.a. | n.a. | n.a. | 31.6 | 31.2 | 30.9 | 30.9 | 30.2 | 30.4 | 29.8 |
| Lithuania | 33.8 | 34.5 | 35.9 | 37.0 | 33.0 | 32.0 | 34.6 | 35.0 | 37.9 | 37.0 |
| Poland | 32.2 | 32.0 | 31.4 | 31.1 | 31.1 | 30.9 | 30.7 | 30.8 | 30.6 | 29.8 |
| Portugal | 36.8 | 35.8 | 35.4 | 33.7 | 34.2 | 34.5 | 34.2 | 34.5 | 34.0 | 33.9 |
| Romania | 37.8 | 35.9 | 34.5 | 33.5 | 33.5 | 34.0 | 34.6 | 35.0 | 37.4 | 34.7 |
| Slovakia | 24.5 | 23.7 | 24.8 | 25.9 | 25.7 | 25.3 | 24.2 | 26.1 | 23.7 | 24.3 |
Table 7.
Evolution of annual average rate of unemployment in selected EU countries.
| Country | 2007 | 2008 | 2009 | 2010 | 2011 | 2012 | 2013 | 2014 | 2015 | 2016 | 2017 |
|---|---|---|---|---|---|---|---|---|---|---|---|
| Czech Republic | 5.3 | 4.4 | 6.7 | 7.3 | 6.7 | 7.0 | 7.0 | 6.1 | 5.1 | 4.0 | 2.9 |
| Estonia | 4.6 | 5.5 | 13.5 | 16.7 | 12.3 | 10.0 | 8.6 | 7.4 | 6.2 | 6.8 | 5.8 |
| Ireland | 4.7 | 6.8 | 12.7 | 14.6 | 15.4 | 15.5 | 13.8 | 11.9 | 10.0 | 8.4 | 6.7 |
| Greece | 8.4 | 7.8 | 9.6 | 12.7 | 17.9 | 24.5 | 27.5 | 26.5 | 24.8 | 23.6 | 21.5 |
| Croatia | 9.9 | 8.6 | 9.3 | 11.8 | 13.7 | 15.8 | 17.4 | 17.2 | 16.1 | 13.4 | 11.1 |
| Lithuania | 4.3 | 5.8 | 13.8 | 17.8 | 15.4 | 13.4 | 11.8 | 10.7 | 9.1 | 7.9 | 7.1 |
| Poland | 9.6 | 7.1 | 8.1 | 9.7 | 9.7 | 10.1 | 10.3 | 9.0 | 7.5 | 6.2 | 4.9 |
| Portugal | 9.1 | 8.8 | 10.7 | 12.0 | 12.9 | 15.8 | 16.4 | 14.1 | 12.6 | 11.2 | 9.0 |
| Romania | 6.4 | 5.6 | 6.5 | 7.0 | 7.2 | 6.8 | 7.1 | 6.8 | 6.8 | 5.9 | 4.9 |
| Slovakia | 11.2 | 9.6 | 12.1 | 14.5 | 13.7 | 14.0 | 14.2 | 13.2 | 11.5 | 9.7 | 8.1 |
Table 8.
Evolution of youth jobless rate in selected EU countries.
| Country | 2007 | 2008 | 2009 | 2010 | 2011 | 2012 | 2013 | 2014 | 2015 | 2016 | 2017 |
|---|---|---|---|---|---|---|---|---|---|---|---|
| Czech Republic | 10.7 | 9.9 | 16.6 | 18.3 | 18.1 | 19.5 | 18.9 | 15.9 | 12.6 | 10.5 | 7.9 |
| Estonia | 10.1 | 12.0 | 27.4 | 32.9 | 22.4 | 20.9 | 18.7 | 15.0 | 13.1 | 13.4 | 12.1 |
| Ireland | 9.1 | 13.6 | 24.8 | 28.4 | 29.9 | 31.1 | 27.0 | 23.7 | 20.5 | 17.0 | 14.5 |
| Greece | 22.7 | 21.9 | 25.7 | 33.0 | 44.7 | 55.3 | 58.3 | 52.4 | 49.8 | 47.3 | 43.7 |
| Croatia | 25.2 | 23.6 | 25.4 | 32.3 | 36.6 | 42.2 | 49.9 | 44.9 | 42.3 | 31.8 | 26.4 |
| Lithuania | 8.4 | 13.3 | 29.6 | 35.7 | 32.6 | 26.7 | 21.9 | 19.3 | 16.3 | 14.5 | 13.3 |
| Poland | 21.6 | 17.2 | 20.6 | 23.7 | 25.8 | 26.5 | 27.3 | 23.9 | 20.8 | 17.7 | 14.8 |
| Portugal | 21.4 | 21.6 | 25.3 | 28.2 | 30.2 | 38.0 | 38.1 | 34.7 | 32.0 | 28.2 | 23.8 |
| Romania | 19.3 | 17.6 | 20.0 | 22.1 | 23.9 | 22.6 | 23.7 | 24.0 | 21.7 | 20.6 | 18.3 |
| Slovakia | 20.6 | 19.3 | 27.6 | 33.9 | 33.7 | 34.0 | 33.7 | 29.7 | 26.5 | 22.2 | 18.6 |
© 2018 by the authors. Licensee MDPI, Basel, Switzerland. This article is an open access article distributed under the terms and conditions of the Creative Commons Attribution (CC BY) license (http://creativecommons.org/licenses/by/4.0/).
Share and Cite
MDPI and ACS Style
Socol, C.; Marinas, M.; Socol, A.G.; Armeanu, D. Fiscal Adjustment Programs versus Socially Sustainable Competitiveness in EU Countries. Sustainability 2018, 10, 3390. https://doi.org/10.3390/su10103390
AMA Style
Socol C, Marinas M, Socol AG, Armeanu D. Fiscal Adjustment Programs versus Socially Sustainable Competitiveness in EU Countries. Sustainability. 2018; 10(10):3390. https://doi.org/10.3390/su10103390
Chicago/Turabian StyleSocol, Cristian, Marius Marinas, Aura Gabriela Socol, and Dan Armeanu. 2018. "Fiscal Adjustment Programs versus Socially Sustainable Competitiveness in EU Countries" Sustainability 10, no. 10: 3390. https://doi.org/10.3390/su10103390
Note that from the first issue of 2016, this journal uses article numbers instead of page numbers. See further details here.