Analysis of Regional Disparities in Romania from an Entrepreneurial Perspective
by
Elvira Nica
1,*, 
Violeta Sima
2,
Ileana Gheorghe
2,
Andreea Drugau-Constantin
1 and
Catalina Oana Mirica (Dumitrescu)
1 1
Department of Administration and Public Management, Faculty of Administration and Public Management, Bucharest University of Economic Study, 6 Roman Place, 010374 Bucharest, Romania
2
Business Administration Department, Faculty of Economic Sciences, Petroleum-Gas University of Ploiesti, Blvd. Bucuresti, No. 39, 100680 Ploiesti, Romania
*
Author to whom correspondence should be addressed.
Sustainability 2018, 10(10), 3450; https://doi.org/10.3390/su10103450
Submission received: 17 July 2018
/
Revised: 19 September 2018
/
Accepted: 25 September 2018
/
Published: 27 September 2018
(This article belongs to the Special Issue Towards Resilient Entrepreneurship and Technological Development in Self-Sustainable Economies)
Abstract
:This article proposes a synthetic analysis of the development level of regions in Romania with the concentration/diversification model, using Gini coefficients and Lorenz curve, based on the current statistical indicators. Knowing the degree of concentration and also the influence factors is useful in making decisions and setting regional policy measures. The analysis of regional disparities based on a series of data and indicators provided by The Romanian National Institute of Statistics for 2007–2016. The main findings highlight a deepening of the regional disparities in Romania in 2016 compared with 2007 explained mainly by the fact that the Bucharest–Ilfov region registered an economic development much above the other regions.
1. Introduction
Sustainability is a vast subject with multiple facets that require an integrated approach to the social, economic, environmental, and technological environment. An essential issue of sustainable development is equity [1]. As part of Romania’s national strategy, an essential goal of promoting sustainable development is to have better prepared people to meet the present and future challenges and to act with responsibility towards future generations. Stimulating entrepreneurship can contribute to the sustainable development of society. SMEs are a highly debated topic in the literature, with some pros and cons of the effects of the development of this sector on the economy [2,3,4]. There is a general appreciation of the significant role that entrepreneurship, together with innovation, is playing in increasing economic competitiveness and creating jobs on a global scale. However, the approach of public policies in the field of entrepreneurship differs from one state to another, depending on the economic dynamics, the particularities of the business environment or the regional development objectives. As globalization influences the world economy more and more, entrepreneurship dynamism is considered by researchers, economists, and politicians as a factor contributing to the consolidation of the knowledge-based economy, and to solving social and environmental problems. Entrepreneurial policies are increasingly linked to innovation policies, focusing on the creation of new products and services by harnessing both valences of the knowledge-based economy.
In recent decades, in the EU, support for entrepreneurship has been increasingly active, making economic development policies unthinkable without taking into account the improvement of the entrepreneurial environment, the removal of obstacles or direct support actions. Supplementing and stepping up measures to promote entrepreneurship at all levels (European, national, regional) is an objective assumed in 2008 in the strategic documents of the European Union. Entrepreneurship is one of the leading success factors for the EU 2020 Strategy [5]. Thus, promoting and supporting entrepreneurship is set out in a series of actions aiming at smart growth, industrial policy, research-innovation, or education. Promoting growth and competitiveness of SMEs, while modernizing public administration to improve the business environment, is the central priority of the 2008 Small Business Act (SBA) for Europe Communications and the 2011 Review of the Small Business Act for Europe 7. The two policy papers address the main issues affecting European SMEs throughout their lifecycle, more closely related to innovation, focusing on creating new products and services by capitalizing on both the knowledge-based economy valences.
In the first two years of SBA implementation, the following European institutions highlighted some significant results as follows:
- -
- 100,000 SMEs benefited from the financial instruments of the Innovation and Competitiveness Framework Program (CIP), creating over 100,000 jobs;
- -
- The late payment directive has been adopted and started. It requires public authorities to pay suppliers within 30 days, which should improve the cash flow of businesses;
- -
- In most EU Member States, the time and costs needed to set up an enterprise have considerably reduced by lowering the EU average for a private limited liability company from 12 days and 485 euros in 2007 to 7 days and 399 euros in 2010;
- -
- Enhanced online procedures and consortium bidding opportunities have made participation in public procurement easier for SMEs;
- -
- A European SME Center, which supports SMEs’ access to China’s market, was opened in China.
Romania’s SBA performance is below the EU average. However, Romania excels in entrepreneurship, where it is a leader in the EU. In four other areas, Romania has good results in the EU average. Lower scores were recorded for the environment, the single market, and internationalization. The main challenge is related to poor and declining skills and innovation outcomes. An analysis by the European Commission in 2015 on the priorities of SME policy in Romania was highlighted the following: it was essential to invest more in education and training. More funds were needed to improve training and synchronize education with labor market needs. Even if recent figures on exports were the highest level of all time, more efforts are needed to improve the export capacity of SMEs, for example through support and co-financing services. Better coordination of innovation policies was needed to create synergies between the public sector, institutions, and businesses [6]. Two years later, things looked much better. Romanian SMEs’ value added increased by almost 50% between 2012 and 2016. The micro firms’ sector achieved the best performances, whose value added increased by 86.6%. SME employment grew by almost 4% from 2012 to 2016, with 2.6% growth in 2016.
Regarding the implementation of the Small Business Act for Europe, Romania’s SBA profile presented a mixed picture. While entrepreneurship was the only area where the country scores above the EU average, Romania ranked in line with the EU average for ‘second chance’, ‘responsive administration’, state aid & public procurement, access to finance, and internationalization. Conversely, Romania showed the lowest scores in the EU for the single market, skills and innovation, and environment. During the last two years, a significant number of policy measures were implemented in 9 out of the 10 SBA policy areas, including in areas where performance still scores low, such as skills and innovation. Nevertheless, SME stakeholders stated that the overall progress in implementing the SBA in Romania has been moderate. The main conclusion regarding the SME policy priorities was that further reforms should continue, together with consolidation and enforcement of existing ones, intending to promoting internationalization, fostering innovation and ICT skills, and boosting SMEs’ confidence in e-commerce transactions. Legislation needs to be predictable, with more systemic and consistent use of the SME test. Simplification and modernization of the business environment and faster resolution of insolvency proceedings will help Romanian SMEs to grow and become more competitive and create a more favorable environment for new companies to start up and scale up.
Addressing the complex issues of the entrepreneurial resilience requires the understanding of the transformations of the business environment, both regarding convergence with the European model and of national peculiarities, in the context of achieving a self-sustainable level of the national economy. Therefore, resilient entrepreneurship is essential not only regarding providing added value for the national economy, but also in the broader context of global economic transformations, considering the economic and social contexts. From this perspective, the new economic paradigm requests proper solutions. A high level of insecurity and uncertainty characterizes all current societies, and the transition to a market economy in the case of Romania deepens global issues. Numerous studies [7,8,9,10,11,12] show that among the strengths of successful companies are entrepreneurs’ ability to cope with uncertainty and resilience. Transferring past action schemes to solving present problems is not applicable. Solutions must be crafted, created, imagined, developed here and now, not merely transferred from the past or the experiences of others, and acquisitions of any kind can no longer maintain self-confidence [13].
At the present stage, Romania aims to make progress on the level of entrepreneurial culture. This would stimulate employment by preparing people to initiate business ideas and to deliver them into a sustainable business by improving entrepreneurial skills.
A survey conducted in 2006 at the level of SMEs in Romania showed that 50.69% of entrepreneurs perceived integration into the European Union as a significant opportunity, while 43.04% considered it to have no significant influence, 6.27% even considering it a significant threat [14].
The research regarding the assessment of the role of the EU integration in increasing the entrepreneurial resilience related to Romania has considered the eight development regions which comprise all over the country. This research aimed to assess how Romania’s EU accession increased entrepreneurial performance in the eight macroeconomic development regions, using the concentration analysis.
The topic of entrepreneurial resilience is widely debated in the literature from the point of view of the entrepreneur’s features [12,15,16,17,18]. We have chosen to discuss the resilience of businesses having the situation in Romania in sight.
Certain data are showing that Romania’s accession to the EU has led to changes in the entrepreneurial activity. Thus, in 2018, the European Institute of Romania published a synthetic study on the impact of Romania’s accession to the European Union on the Romanian economy [19]. It presented the benefits of the CIP, which brought EUR 7.6 million to Romania through the Entrepreneurship and Innovation Program. One of the objectives of the CIP programs was to promote and support female entrepreneurship by creating two networks to stimulate women’s activity. Another direction of the CIP was to simplify the procedures for setting up a company by reducing administrative procedures. Romania managed to improve procedures for starting a business: If in 2010 5 procedures, 11 days, and a cost of 4.4% of per capita income were needed; in 2016, 5 procedures, 8 days, and a cost of 2% of per capita income were needed. In 2017, however, the situation was slightly regressing, the number of procedures rising to six, which increased the business start-up period to 12 days as a result of the increase in the time required for VAT registration. However, the cost of opening a business has remained unchanged. Common policies—the Common Agricultural Policy and Cohesion Policy gave essential contributions to raising living standards and boosting economic development, including in rural areas. The measures also encouraged the growth of entrepreneurship in rural areas and the development of activities taking into account the natural and local specificities of the regions. Another effect was to increase entrepreneurship in rural areas, aiming at decoupling the activity from these regions from subsistence agriculture. The opportunities for economic diversification through non-agricultural activities, such as rural tourism, have gained ground over the last 10 years in Romania, facilitated by the free movement of people. The study of Iorio and Corsale, published in 2010 [20], indicated the positive experiences of business entrepreneurs in this field. The new approach to the industrial policy set in the context of the industry, especially small businesses which have suffered from the economic crisis, in addition to the challenges posed by globalization and the need to adjust to a low carbon economy. The initiative focused on creating an environment that supports entrepreneurship and supports competitiveness [21].
This paper aims to analyze the differences in the evolution of newly created enterprises among the eight development regions of Romania, from the point of view of concentration. We were looking for an answer to assess how the Romanian economy and SMEs were able to face new economic challenges to achieve and maintain sustainable performance after the EU accession. The analysis started with the existing conditions, aiming to assess whether and how Romania’s EU accession has stimulated entrepreneurial activity by increasing the firms’ entrepreneurial activity. The aim of our paper is to investigate if, after Romania’s accession to the EU, regional disparities changed, one of the national objectives being to reduce them. However, a problem that remains to be investigated is how these changes are due to EU integration and how the economic crisis affected Romania immediately after its accession. Our research takes account of Romania’s particular features that generate a developing entrepreneurial spirit: a post-communist country with a relatively young democracy, an emerging economy with a high growth rate mainly based on internal consumption, and one of the newest EU Member States.
Firstly, we paid attention to the situation of the companies after the first year of their establishment because in Romania, as elsewhere, companies face high risk in the first year of life.
Secondly, to our knowledge, for Romania, this is the first research examining the situation of SMEs by development regions, and, more than that, a similar approach regarding selected issues was not found in previous studies. Entrepreneurial ecosystem data is not collected systematically in Romania.
The motivation of the research is connected with the need to identify the causes behind the syncope evolution of the SME sector in Romania. With only 2.2 small and medium businesses per 100 inhabitants, Romania is last in the European Union, as data from Eurostat show. The number of SMEs in Romania is half of the EU average, which was in 2015, 4.5 per 100 inhabitants. The number of SMEs is an accurate indicator of the development of a region, given that these firms are the ones that bring oxygen to the economy, supporting the majority of the number of employees in the private sector. Romanian SMEs account only for 14% of revenue, although their share is 96%. In order to analyze the regional disparities from an entrepreneurial perspective, a specific focus on concentration is necessary.
The contribution of the paper to the field of entrepreneurship consists on the one hand in completing the gaps identified in the specialized literature and, on the other, in that it represents a starting point in the analysis of the causes of maintaining the regional disparities.
The endeavor of analyzing the regional disparities in terms of entrepreneurship in Romania is useful both for academics and practitioners in the field. On the one hand, the present paper offers empirical evidence for further comparative studies in at European level for countries with similar conditions, consolidating the role of the analysis not only for the examined country. On the other hand, this study could support the development of entrepreneurial activity by emphasizing practical implications and further lines of action, with specific regional measures.
We have further raised the following questions to address in research:
- What is the evolution of regional disparities in terms of the entrepreneurial activity?
- What is the status of newly created enterprises one year after their establishment before and after Romania’s accession to the EU?
- What implications does Romania’s accession to the EU have with regard to entrepreneurial activity at regional scales?
We examined the differences both in the evolution of the situation of newly created active enterprises after the first year from creation and in the number and the creation rate.
We applied the Gini coefficient and Lorenz curve to measure these differences within development regions at two different moments: 2007, the year when Romania became a member of the European Union and 2016, the last year with collected data. We assume that Romania’s accession to the EU has led to changes in the behavior of entrepreneurs.
The analysis is based on the National Institute of Statistics of Romania system data, which record all the activations and transformations of enterprises’ demography.
2. Materials and Methods
The economic development of the regions decisively determines their general levels of development. Business demography in Romania shows positive evolution. At the level of 2016, SMEs in Romania accounted for 99.91% of all enterprises active in the national economy [22]. A global synthetic characterization of the eight regions’ development level from the point of view of the entrepreneurial activity can be made on the basis of many variables, as follows: GDP per capita, turnover, number of employers, net investment of local units per capita, direct investment per employed population, and the share of workforce employed in SMEs, per total but also for different sectors of activity.
Because in Romania, companies face high risk in the first year of life, this study took into account the company’s state one year after its establishment, namely if the firm after one year of trading is active, inactive, or dissolved. The status of newly created enterprises one year after their establishment, by development regions, is the element considered in the evaluation of the situation of entrepreneurship in Romania. The methodology used in this article is based on the analysis of regional disparities using the coefficients of concentration. Data were retrieved from the National Institute of Statistics of Romania.
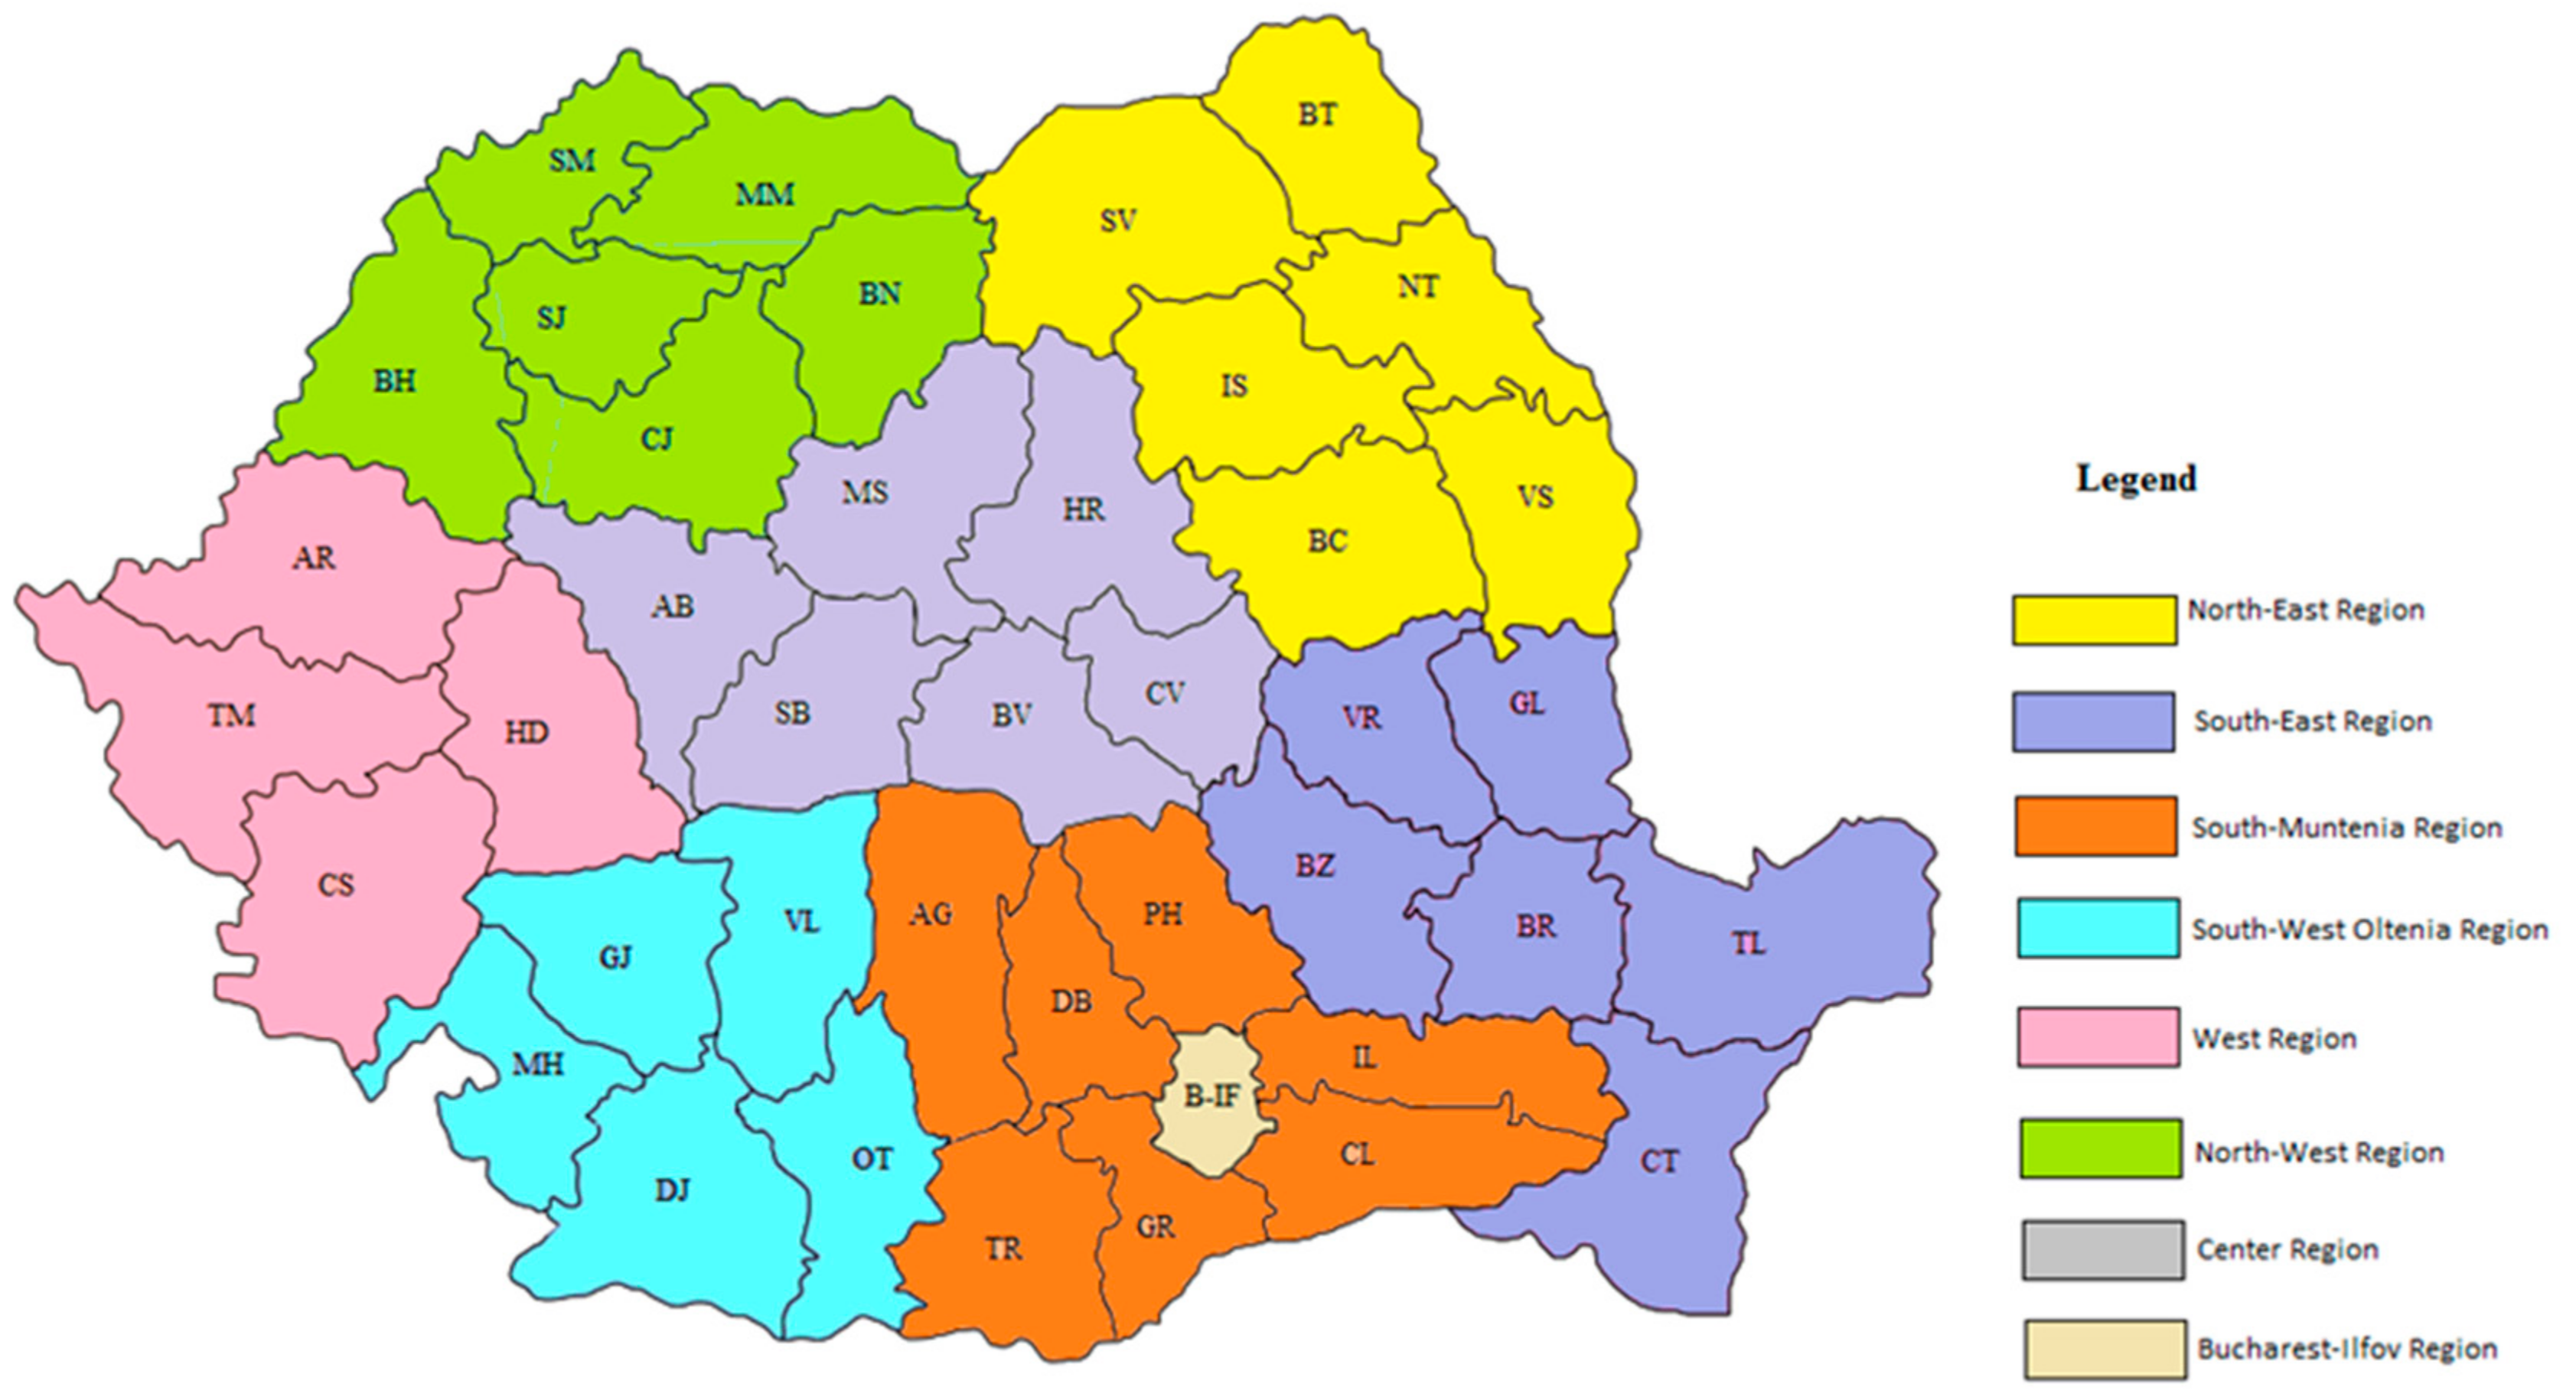
Eight development regions were defined by law by the Romanian Parliament (law no. 151/1998). These are administrative areas that provide a framework for the implementation and evaluation of regional development policy and allow for the collection of specific statistical data following the European regulations issued by EUROSTAT for the second level of NUTS 2 territorial classification existing in the European Union. Table 1 lists the eight economic regions with their county members, and Figure 1 shows the map of the development regions in Romania.
The study of concentration requires a comparative analysis of the structure of the population and the structure of the global values on the same variants of the observed variable. This approach can highlight both the inequalities between structural distributions and the comparison of global values with a limited number of population units. The larger the differences between the two structure distributions, the higher the disparities between the groups of units, meaning that there is a concentration that tends to grow. On the contrary, the lower the differences between the structure distributions, the lower the concentrations (the diversification is higher).
The statistical characterization of the concentration can be achieved by graphical means and by analytical methods: coefficients or concentration indices and the concentration curve. The classical statistical analysis of the concentration involves extracting and quantifying, within a series of historical data, moments, structures of local, regional, national, and global economies, to which specific structural energies (gi2) are allocated, following their evolution in time [23].
The analysis of indicators on the concentration can indicate how far a region is in comparison with the state of uniform and balanced distribution of the results registered at the national level. To assess the structural limits and to know the impact of the structural changes, the Gini index and the Lorenz curve were used.
The Gini index (G) measures concentration in the distribution of a positive random variable. The Gini index was developed as an essential statistical index used in social sciences for measuring concentration in the distribution of a positive random variable.
In the beginning, it was used in economics as a measure of income inequality among individuals or households [24]. Furthermore, the Gini coefficient (GC) has been used to other topics, but mostly within Economics. Later, it was applied to medical sciences to describe concentration in levels of mortality, or in the lifetime, among different socio-economic groups, to evaluate inequality in health, and life expectancy [25,26,27]. GC is a measure of the statistical dispersion used to represent the distribution of a set of values and it is calculated as the mean of the absolute differences between all the pairs of values for a given variable. Theoretically, GC is between 0 and 1. The zero value corresponds to the situation when all cases have equal amounts, the interpretation being of absolute equality, meanings a state of “equity”. The value 1 corresponds to the situation when the measured values are equal to 0 for all the measurements other than one, which corresponds to extreme inequality [28,29].
The relation used to calculate the Gini coefficient is
GC takes values in the range [, 1], where n = number of observations).
The Gini coefficient was designed to measure income inequality in a company. It is usually associated with the Lorenz curve introduced as a plot of wealth concentration and indicates what percentage of accumulated wealth is in possession of a given percentage of the population [30]. In ideal situations, the relationship between wealth and population is 1:1.
The concentration curve is plotted based on coordinate points (pi, qi). The coordinates of these points are
where:
- ; is the absolute cumulative frequency up to the i range;
- —Aggregate values (xi, ni) cumulated up to the i range of the grouping variable;
- pi = the cumulative relative frequencies up to the i range;
Expressed as a percentage, each of the pi and qi coordinates falls within the range of 0 and 100%, and the concentration curve results from the union of points (pi, qi) and it falls into a 100% square.
The analysis of the concentration curves highlights the following:
The concentration curve is placed under the first bisector (diagonal of the Gini square) because of pi > qi or overlaps diagonally when pi = qi (in the case of equipartition). The area determined by the curve and the diagonal is called the surface of concentration.
The degree of concentration is according to the size of the concentration area. Thus, the deviation of the concentration curve from the diagonal of the square is directly proportional to the concentration surface, a large area showing significant differences between the groups and an intense concentration (diversification is the maximum) and vice versa. Concentration is maximal (diversification is minimal) when a single unit of the population holds the entire global value of the analyzed variable—in this case, the concentration curve coincides with two sides of the square.
The concentration curve can be used for concentration analysis, but also as a method of approximating the central values of the distribution, the Gini concentration index or as a qualitative comparison tool for concentration.
Relative to the Lorenz curve, the Gini concentration coefficient can be defined as a ratio of the area between the Lorenz curve of the distribution and the line of perfect equity (y = x) to the area under the uniform distribution line [32].
The Gini index (GI) is the Gini coefficient expressed as a percentage, calculated by multiplying of the Gini coefficient by 100.
The concentration analysis based on the Gini coefficient and the Lorenz curve presented above. The analysis has considered the state of the Romanian enterprises in 2008 and 2016 for each of the eight development region. 2008 was chosen because Romania’s accession to the EU took place in 2007. Also, taking into account the inherent limitations related to available statistical databases, 2016 was chosen for comparison.
3. Results and Discussion
3.1. The Current Situation
A universal statement in the papers that take into account the economic importance of SMEs is that “SMEs are the main driver of economic growth”. Unfortunately, existing studies do not support this. Beck et al. (2003) have shown that the prevalence of SMEs in the market is a feature of economies that have significant economic growth and it is not a cause of these increases [33].
In 2006, less than half of the Romanian patrons believed that the overall economic situation was favorable to business, and a third of them were optimistic about the future evolution of the business environment. In the same survey, more than 40% of the interviewed entrepreneurs appreciated that the overall economic situation in Romania in that period was favorable to business, while one-fifth believed it was hampering to development, and over one-third were declared neutral. Regarding the future evolution of the business environment, nearly two-thirds of the employers felt that the future business environment would be favorable and only 10% thought it would hinder business development [34].
Ten years after joining the EU, Romania’s business environment is still strongly polarized. On the one hand, firms with revenues above €1,000,000 represent the core of the Romanian business environment because although they represent only 4% of the total business environment, these firms account for 84% of the total revenues of all active companies in Romania, 61% of the total number of jobs, and 74% of the tangible fixed assets. These companies have experienced excellent development over the past decade: the consolidated level of revenues, profits, and cash almost doubled, debts are collected faster, and inventories are much more diversified than the average in the business environment. On the contrary, the situation of microenterprises (companies with revenues below €1,000,000) has deteriorated over the last decade: their profitability is lower, the efficiency of employees remains stable at a modest level, the liquidity situation is fragile given the degree of debt coverage the available treasury is very low, the debts are collected later, and stocks are slowly rotating. Polarization by concentrating revenues among large firms reflects the diminishing of the middle layer and the decrease of the overall competitiveness of the active business environment in Romania. The implications for the stable development of the country are unfavorable, as the middle class has the role of dampening shocks during the recession stages of the economic cycle. Specifically, high volatility in the coming period is to be expected, regarding company profitability, job development, consumption, and consumer confidence.
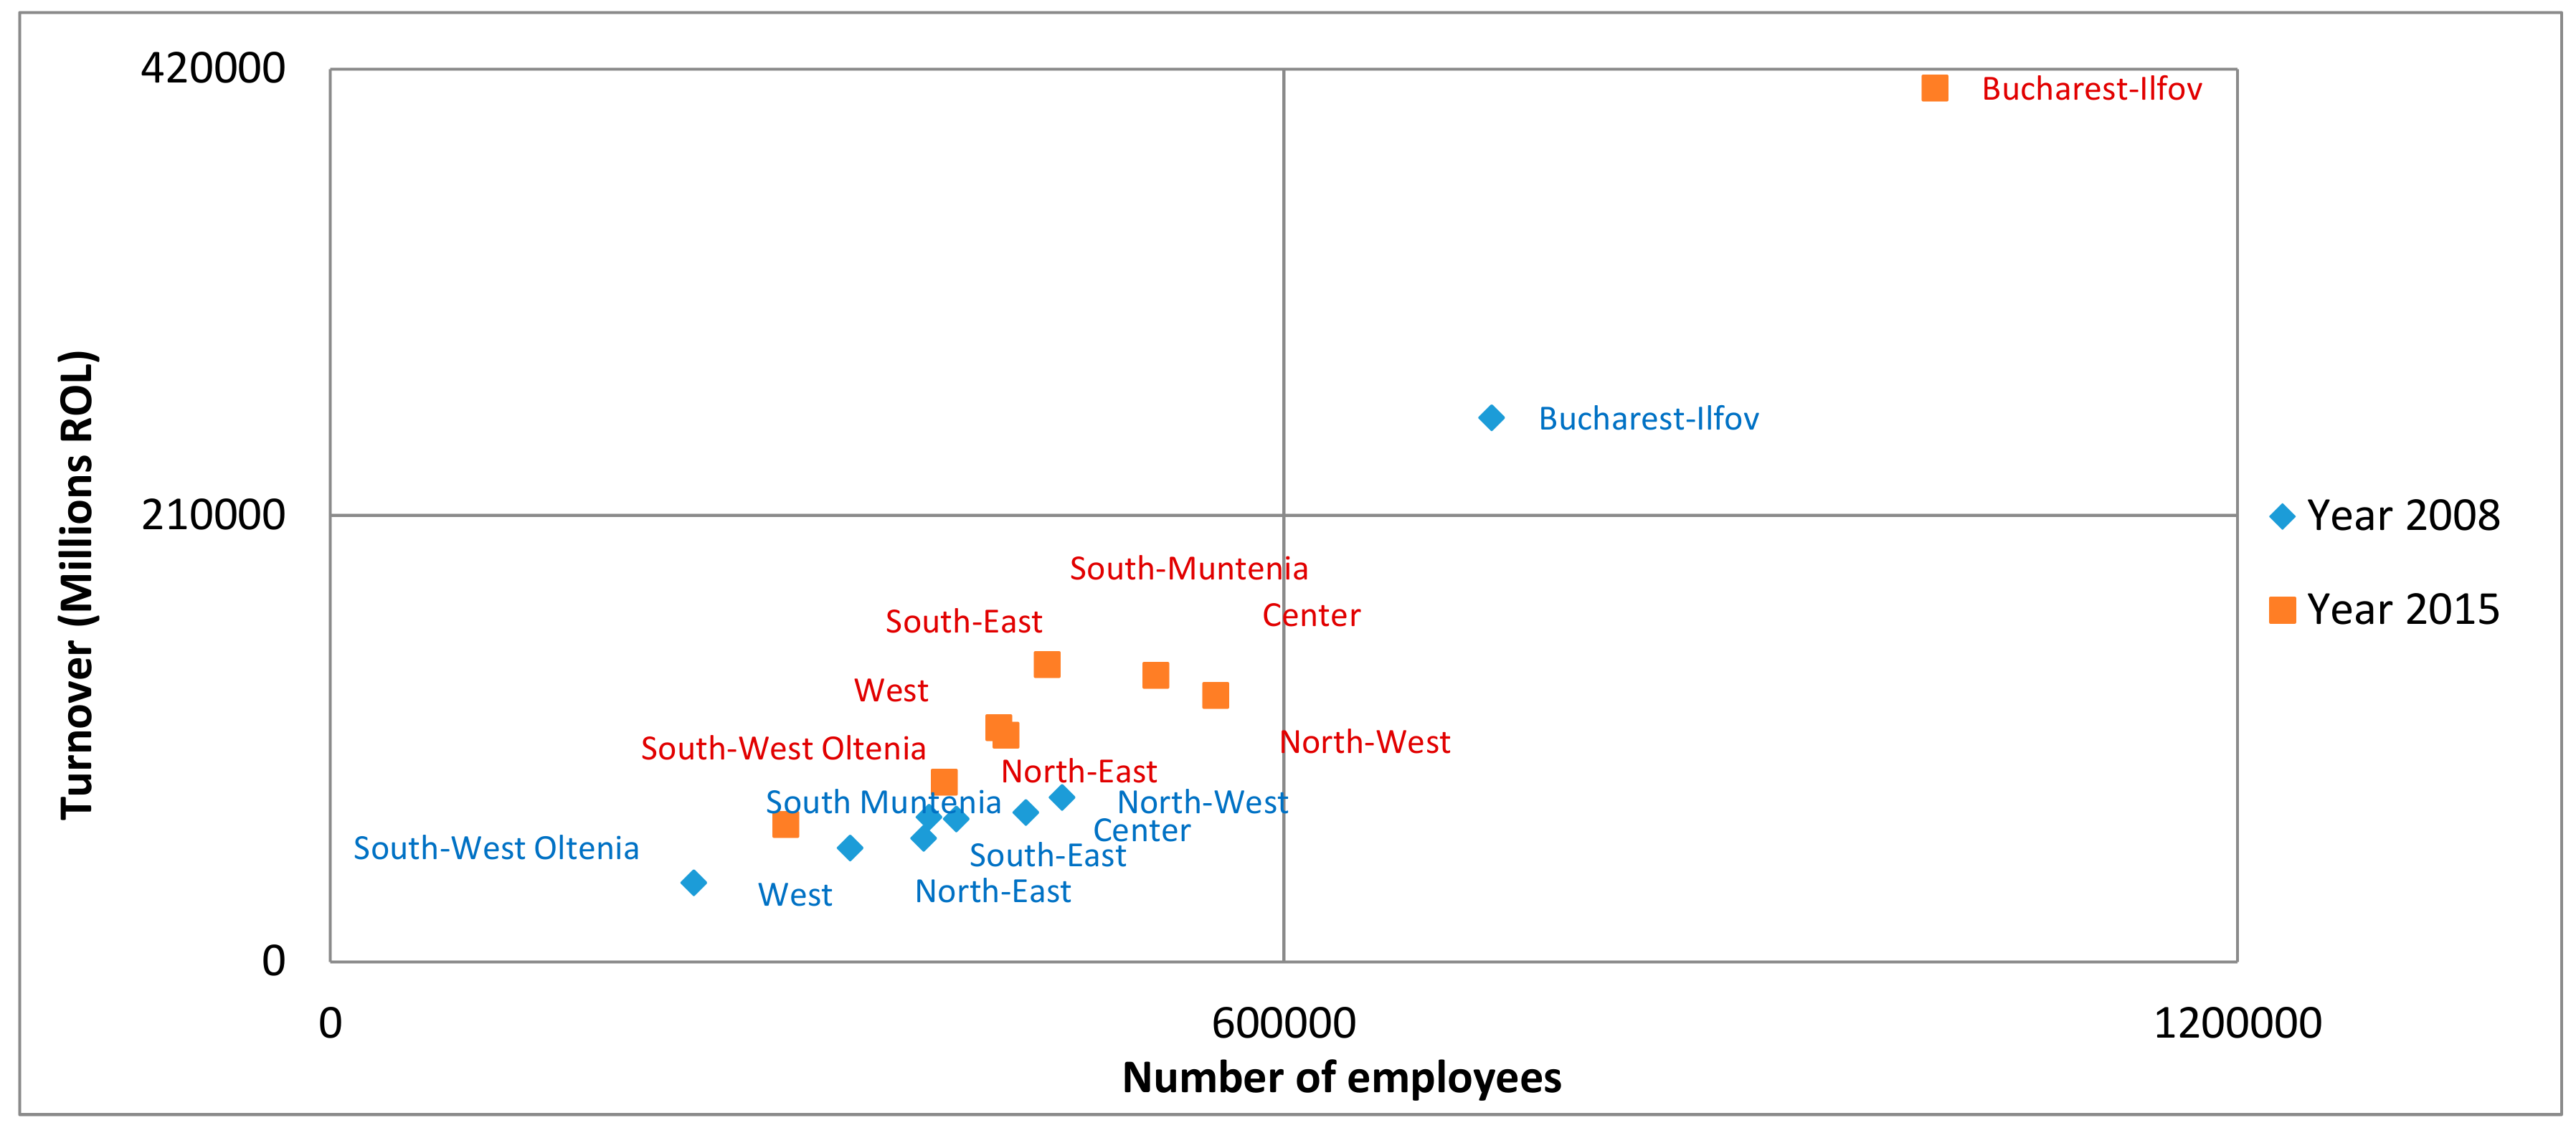
On the other hand, at the regional level, the Bucharest–Ilfov region continues to remain the leader. A graphical representation of the situation of SMEs in the eight regions in relation to turnover and number of employees supports these allegations (Figure 2). Unfortunately, the lack of data has not allowed a detailed analysis in this respect.
In this article, we intend to evaluate whether and how Romania’s EU accession has stimulated entrepreneurial activity by increasing the firms’ resilience. For this purpose, we have used the analyzes and studies conducted both at the national level by the National Commission of Small and Medium-Sized Private Enterprises in Romania, National Bank of Romania and international, by The European Commission, as well as data provided by INS of Romania and Eurostat.
In Romania, the widespread support for EU membership was very high, because the population perceived integration into this structure as a ramp meant to solve both the problem of prosperity and security. The objective of accession has focused national resources and catalyzed reforms in the Romanian economy and society. At the same time, local critics considered that, as a result of joining the EU, Romania became a marketplace, a natural resource provider, and cheap labor for the big players in the EU.
A study [35] published in 2008 by the National Commission of Small and Medium-Sized Private Enterprises in Romania (NCSMSPER), showed that the primary business opportunity for 2007 was penetration into new markets, more than 58% of entrepreneurs felt that this was the viable direction of economic growth, while the domestic market was an opportunity for only about a third of them. In the first year of integration, half of the small domestic enterprises have made a profit, but they have failed to reach even the economic strength of those in the European Union. According to the research, 98% of the small firms achieved a turnover of fewer than two million euros per year. Accession has had some positive effects on SMEs. According to NCSMSPER data, adhesion provided for 43.73% of the companies’ better market access; for 38.54%, the existence of potential better or cheaper suppliers; for 35.35%, improved legislation; for 32.64%, access to structural funds; and for 28.34%, more easy access to new technologies. Although almost 45% of companies admitted that EU membership gave them the opportunity to enter other markets, only 1.99% of companies sold their products to other European countries and another 8.52% of them targeted the EU market for 2008. The managerial level and their economic and financial capacity could explain these figures. Statistical data showed that—in 2007—559,720 SMEs were registered in Romania, accounting for 99.7% of all firms. In 2007, almost 62% of the Romanian SMEs achieved better performances than in the previous year, while only 8% of the companies recorded lower performances than in 2006 [34]. Compared to 2006, the number of small and medium-sized enterprises increased by over 5%, with a polarization of these in Bucharest–Ilfov (23%), North-West (14%), Center (13%), and East (11%). Also, the average number of employees per company rose in all SME categories. Among the difficulties for SMEs generated by Romania’s accession to the EU, after the first year of membership, the most frequently nominated were the intensification of the competition (67.52%), the labor costs (64.25%), the costs of the adaptation to the EU acquis (59.63%), labor migration (54.62%), intensification of controls by state administration representatives (36.31%), stricter consumer protection (32.01%), a more severe legislation environment (29.46%), and the protection of intellectual property (10.35%). Two-thirds of companies appreciated in 2007 that their economic performance was expected to be better in 2008 than in the previous year.
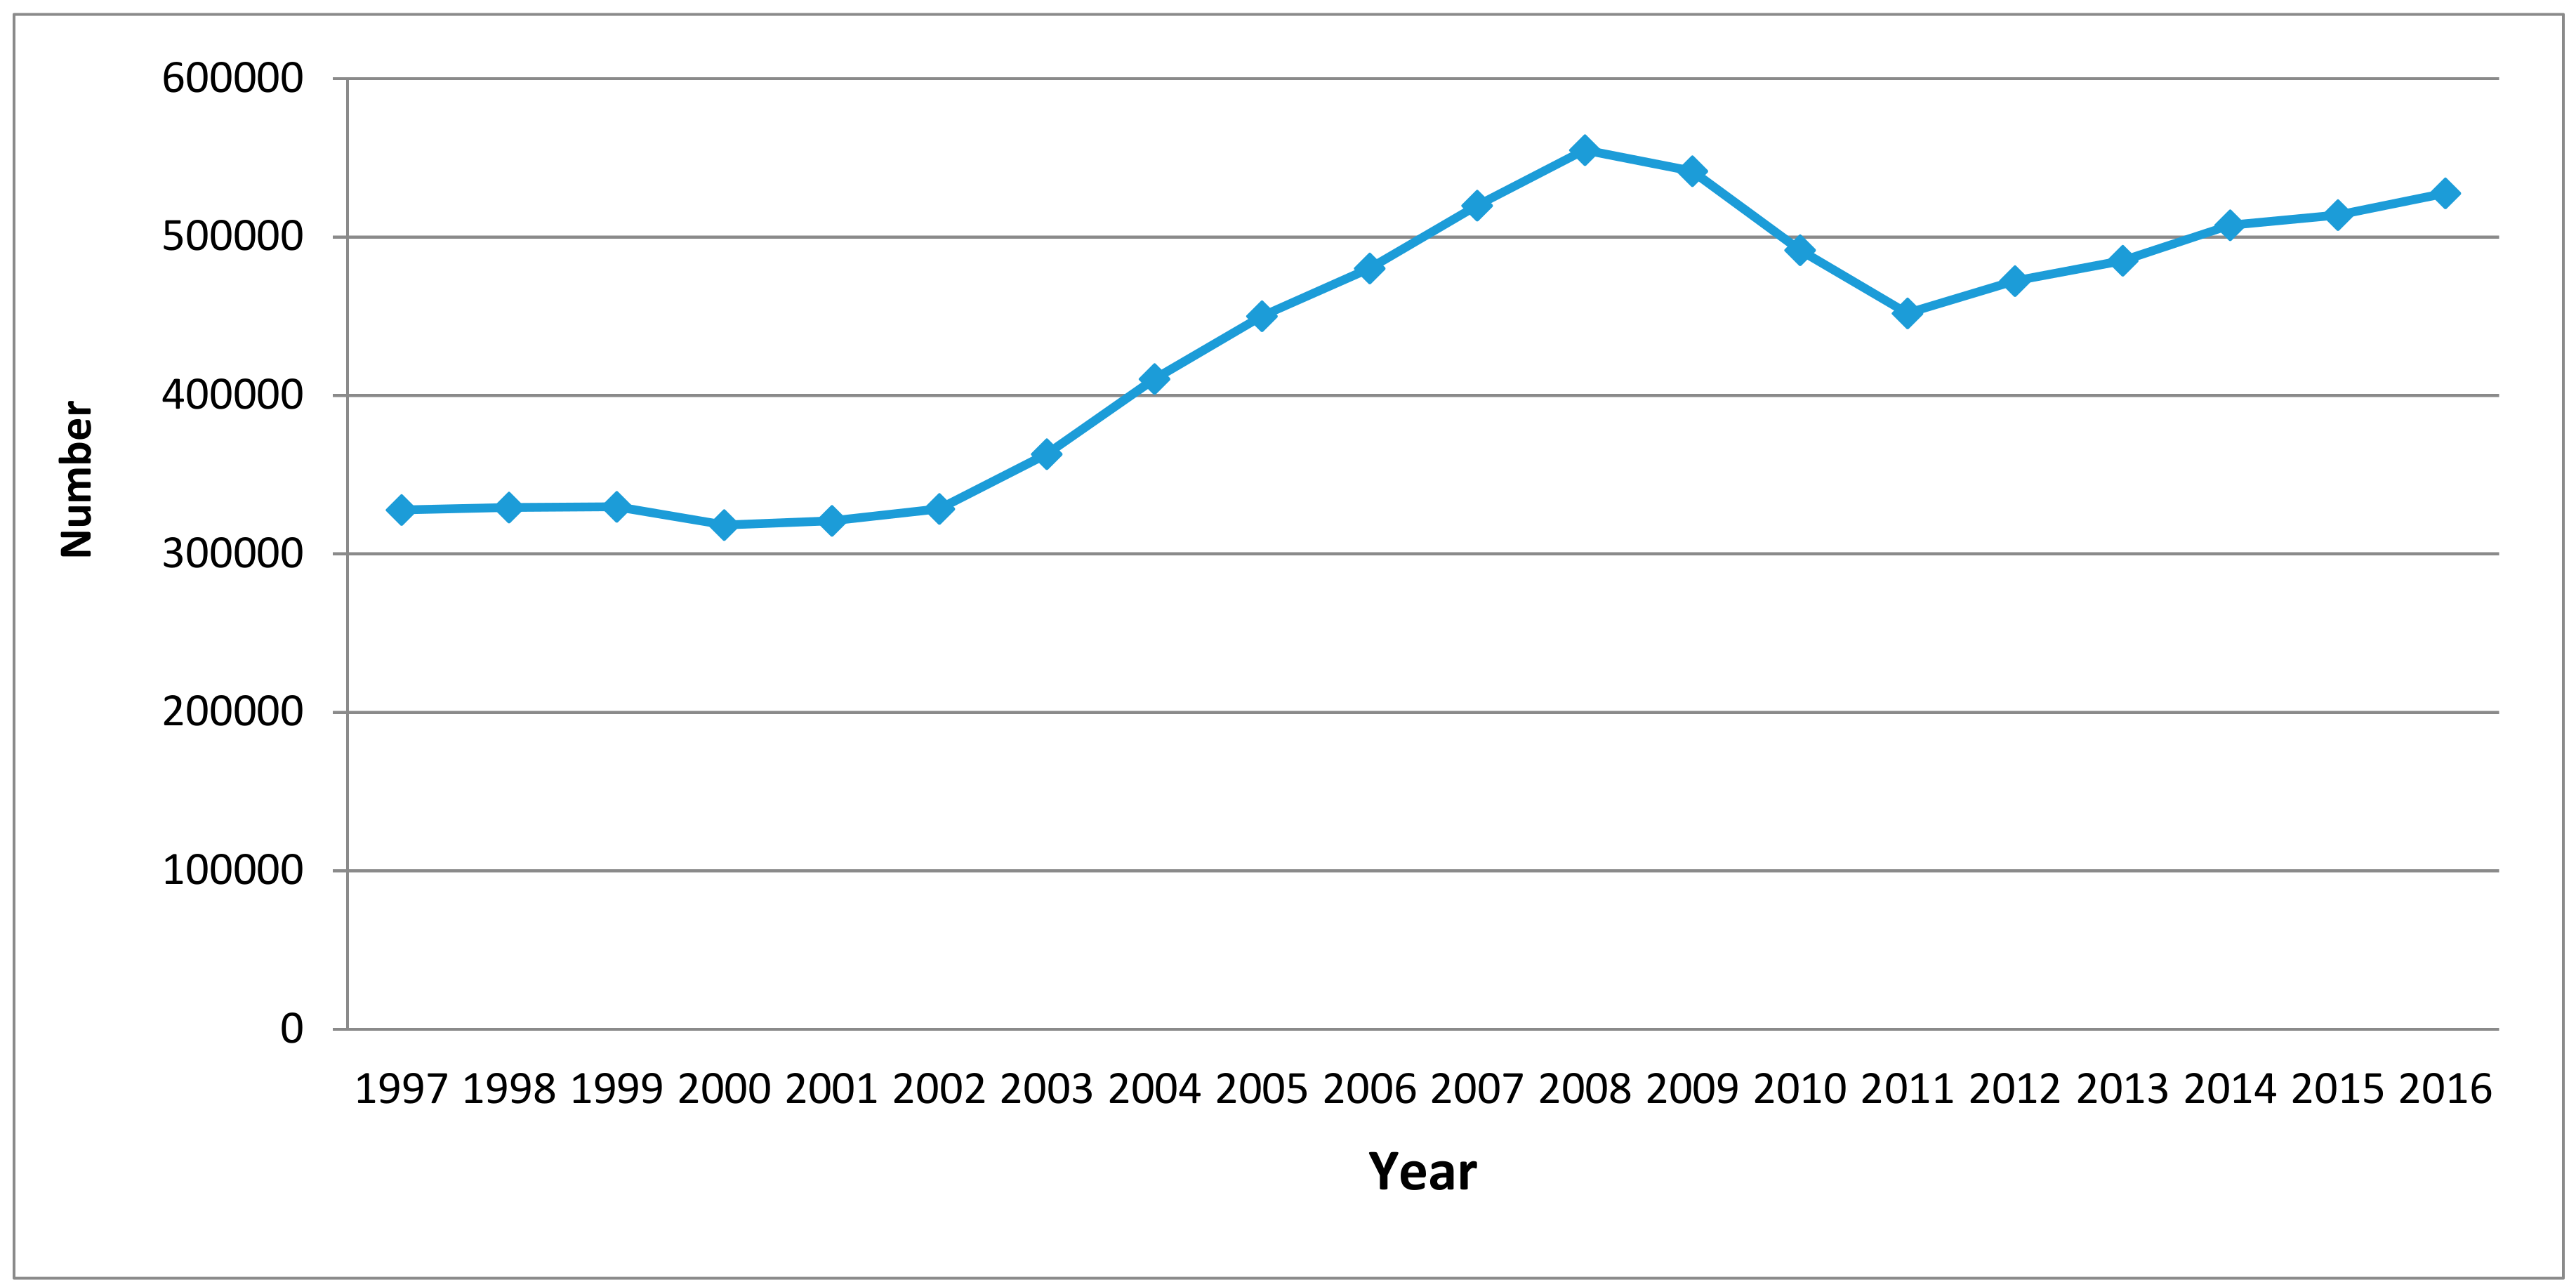
Entrepreneurial activity increased in Romania after 1990. Thus, the number of active companies increased from about 300,000 at the end of 1994 to 554,000 in 2008, followed by a slight decrease until 2011 to 452,000, the situation then beginning to the growth rate is almost constant, until 2016, when it reached nearly 530,000 firms (Figure 3).
In this period, SMEs have come to play a significant role in the economy, compared with corporations, with 58% of the assets and 65% of the employees currently and 53% of the VABs, which have remained constant in the economy the last ten years since joining the EU. At the same time, access to finance for SMEs is difficult, and support for newly established knowledge-based enterprises is at an early stage [36,37,38,39,40].
According to a study published in 2017, in most of the enterprises set up in Romania, 2016 are the micro enterprises, and the region in which they predominate is Bucharest–Ilfov (29.04%), followed by the North-West region (14.04%) and the Center region respectively (10.54%) [40].
Another significant issue is that the average lifespan of a company in Romania is almost 10 years. These figures place Romania below the European average, which is 12.5 years old. From the perspective of annual developments, newly established businesses show a downward trend. Thus, in Romania, 2.8 million firms were created in December 1990 and by February 2017, of which 1.32 million have been radiated in the meantime. Therefore, the survival rate of firms in Romania is 52.7%.
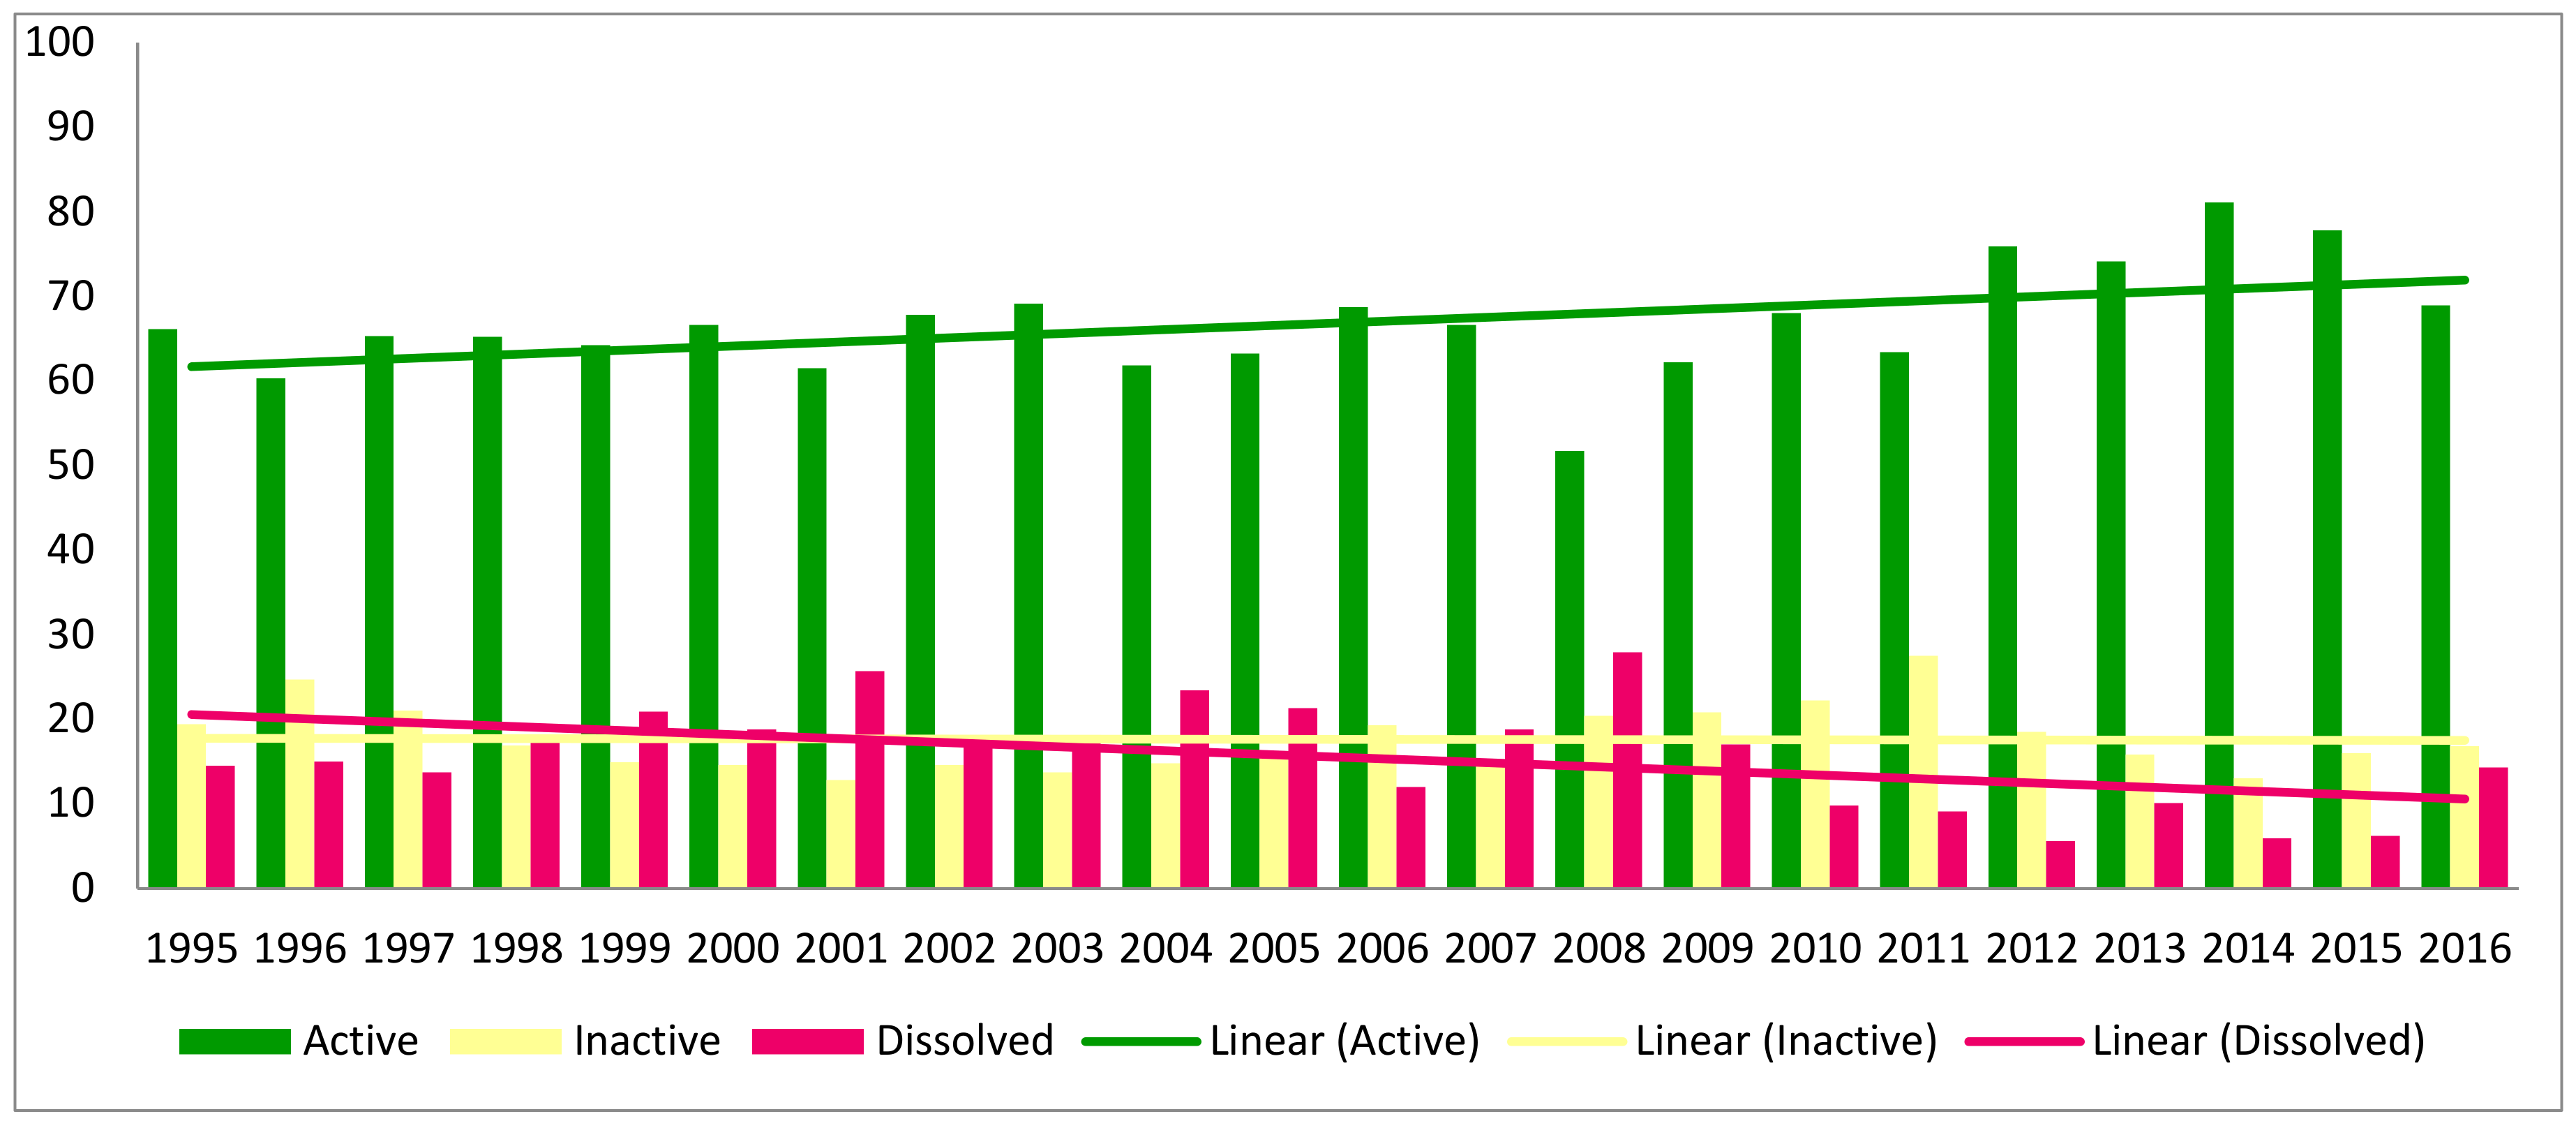
Romania has 23 SMEs per 1000 inhabitants, half of the EU average, standing at the last position, indicating an entrepreneurial spirit still undeveloped. Despite the important increase in the number of firms, the degree of concentration in some economic sectors remained important. The entrepreneurial spirit in Romania is not very high, but even so, many new SMEs are set up every year. Unfortunately, only two-thirds of them manage to stay in activity after one year. Data from the National Institute of Statistics show that the percentage of new firms reported in 1995, when there were 388,180 firms, was over 30% over the past 10 years. The peak was reached in 2008 when the creation rate was 42.4%. A relatively large percentage of newly established firms disappear in their first year of activity. In 2016, the rate was 14.3%, the highest value in the last seven years. It is worth noting that this category registered a maximum in 2008 (27.9%), after which it declined continuously until 2012 when it reached 5.6%. The year 2013 brought a further doubling of the percentages. They followed two years with some stability, with a closure rate of about 6%. The problem is somewhat in the area of active or inactive companies. Only between 60% and 75% remained active one year after setting up, the maximum being in 2014 (81.1%). The 2016 year yielded for this category a significant drop of 10%. The rest—between 15% and 30%—of the total continue to exist, but they are inactive (Figure 4).
The rate of active enterprises after one year of registration remained at about two-thirds from 1995 to 2007. In 2010, the survival rate of enterprises per year was almost 70%, and in 2014 it exceeded 80%. The Central and South-Muntenia regions show the highest rate of the active enterprises one year after their establishment.
It is a fact that the company’s survival rate five years after its establishment is far superior to the one-year survival rate. Thus, according to Eurostat, in the EU, about 80% of the enterprises born in 2014 had survived in 2015. The highest one-year survival rates were recorded for the Swedish business economy—96.7% and the lowest rates were reported in Lithuania at 63.5%. Subsequently, year-on-year survival rates fell gradually in the majority of the countries. As respects the five-year survival rate, data shows that less than half of enterprises born in 2010 were still active in 2015. Therefore, it can be considered that a weakness of using just the one-year survival rates is that the analysis is too rough. However, it could be interesting, moreover, if we consider the fact that the National Trade Register Office data show that half of the companies set up in Romania are bankrupt in less than four years.
Even after joining the EU in 2007, we can speak of three different periods for business in Romania, namely 2007–2008, 2009–2014, and beyond 2014. Thus, firms that were created in 2007 came to the end of the last wave of the economic boom period. The ones set up in 2010 caught the early years of the crisis and had to fight in a much more austere market. Firms set up after 2014 seem to benefit from an improved business environment, but the results are about to emerge.
3.2. Entrepreneurship and GDP Per Capita Levels
There is a functional link between the level of economic development, measured by GDP of a country, and the level and type of entrepreneurial activity. In this regard, it was demonstrated that at low GDP per capita, the share of small enterprises is higher. In the case of high-volume per capita income economies, larger businesses have essential roles in the economy, and the birth rate of new businesses is reduced as the demand for jobs is met in large companies. New businesses create new jobs and contribute to the growth of the economy, stimulating both the labor market and the product market. Not all entrepreneurial initiatives will be successful. In [41], they considered that entrepreneurial failure is a consequence of the following: the entrepreneur does not reach the labor force stage in order for his organization to become profitable or the created business does not survive the first stage and goes bankrupt, also indicating the psychological and social costs of failure. In the view of [42], the different cultures and regions of many countries indicate a geographical concentration of entrepreneurial activities. Entrepreneurial activity can create suitable conditions for the development of new markets and new business opportunities, catalyzing the whole set of economic activities. On the other hand, the intensity and quality of entrepreneurial activity also depend on the demographic, cultural, and institutional characteristics of each country.
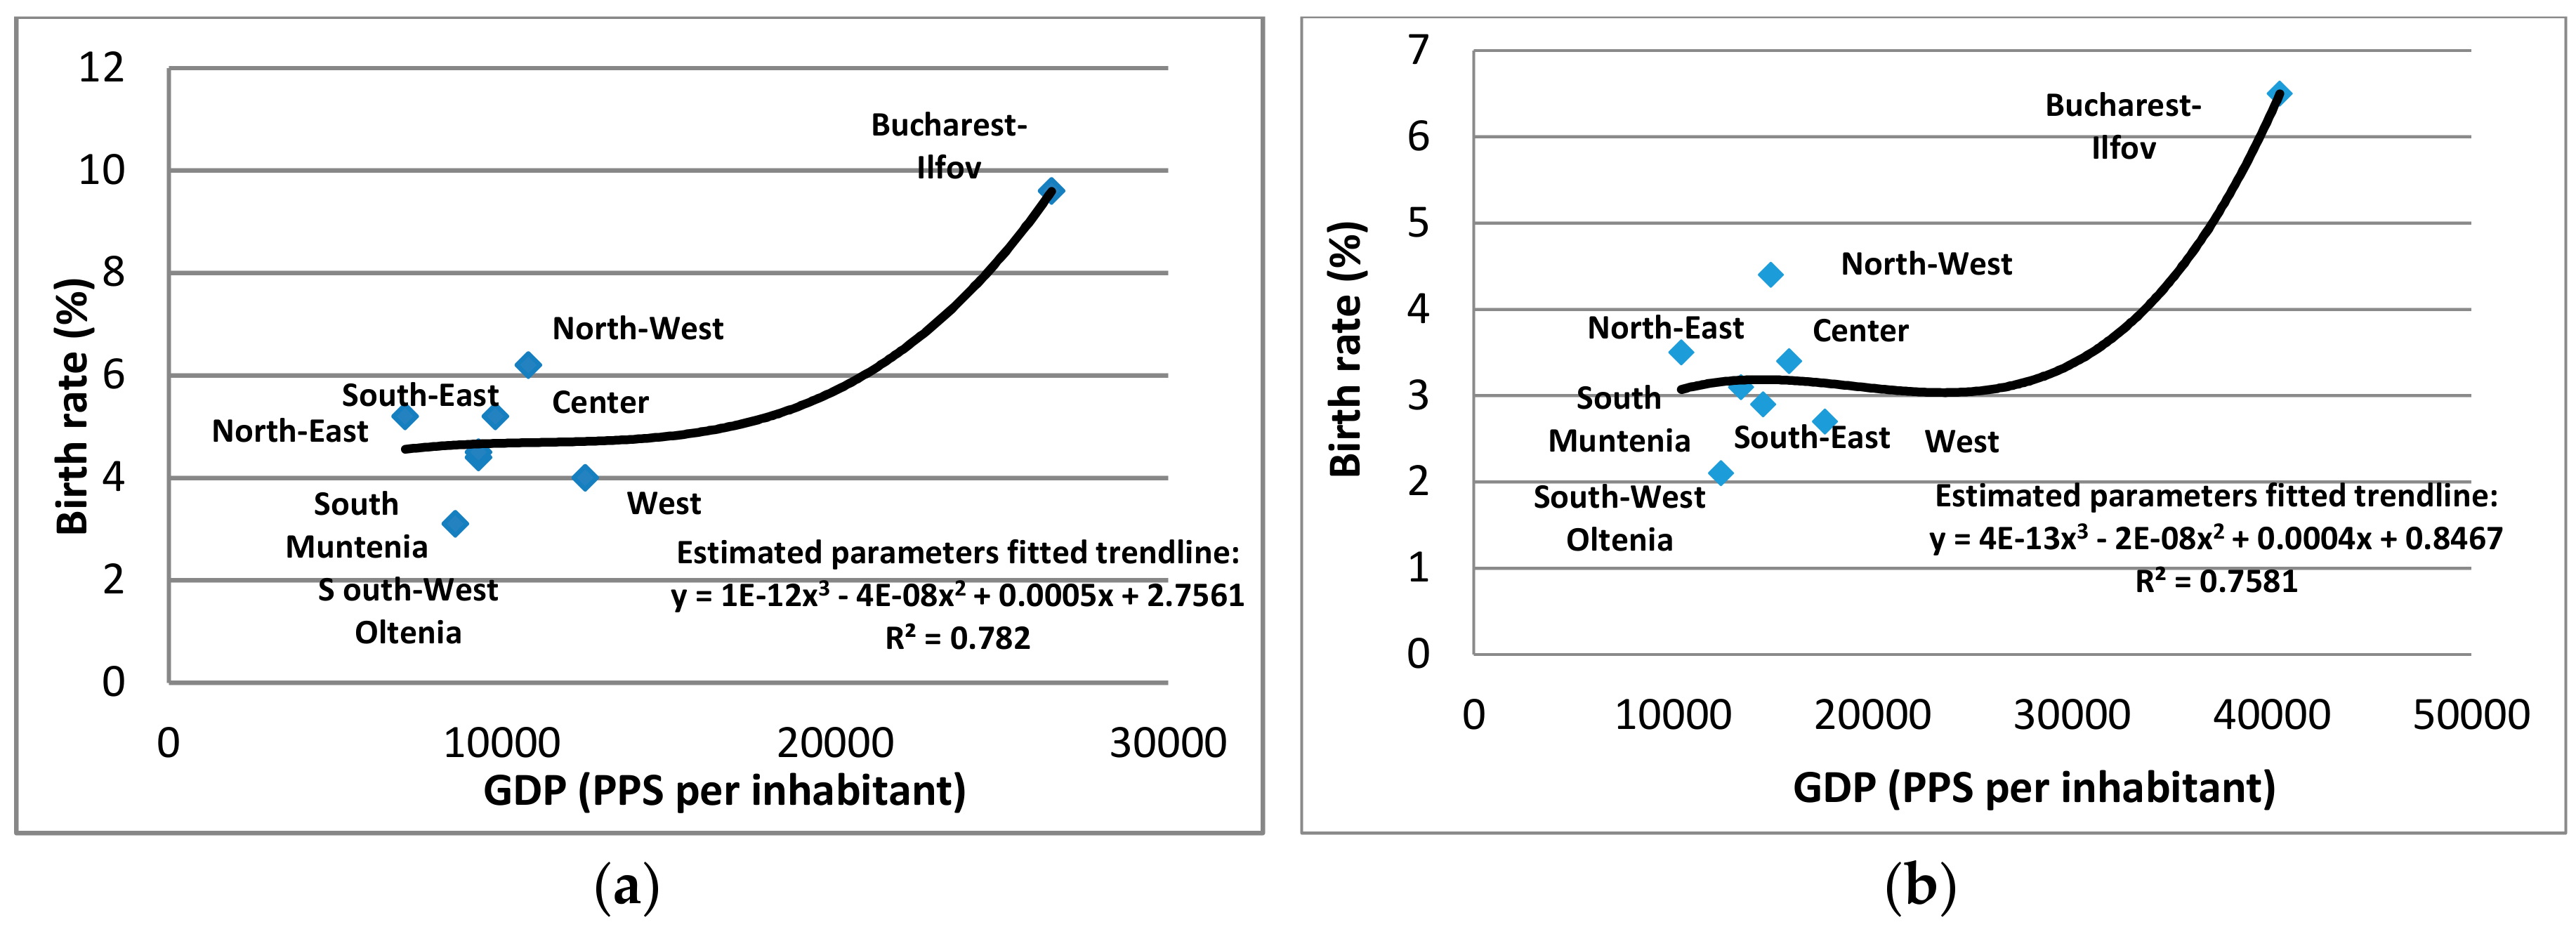
Given the above, to highlight discrepancies between development regions, we considered it appropriate to analyze the relationship between GDP per capita and the birth rate of new businesses. Figure 5 shows that: the start-up business is generally higher in regions with lower GDP levels. The region with the highest level of GDP shows an increase in the entrepreneurial activity effervescence, which suggests a new growth of entrepreneurship as a result of the emergence of new opportunities. This analysis covered two moments of time: 2007 and 2016. From this perspective, some differences are noticeable. On the one hand, the difference between the Bucharest–Ilfov region and the other regions increases and, on the other hand, the differences among the latter ones decrease.
The change in the entrepreneurial behavior of Romanians about the economic growth is confirmed by the Figure 2. Thus, the growth rate of the number of new firms in the period 2011–2016 is significantly lower than in the period 2002–2008.
3.3. Concentration Analysis for the Situation of Firms after the First Year of Activity
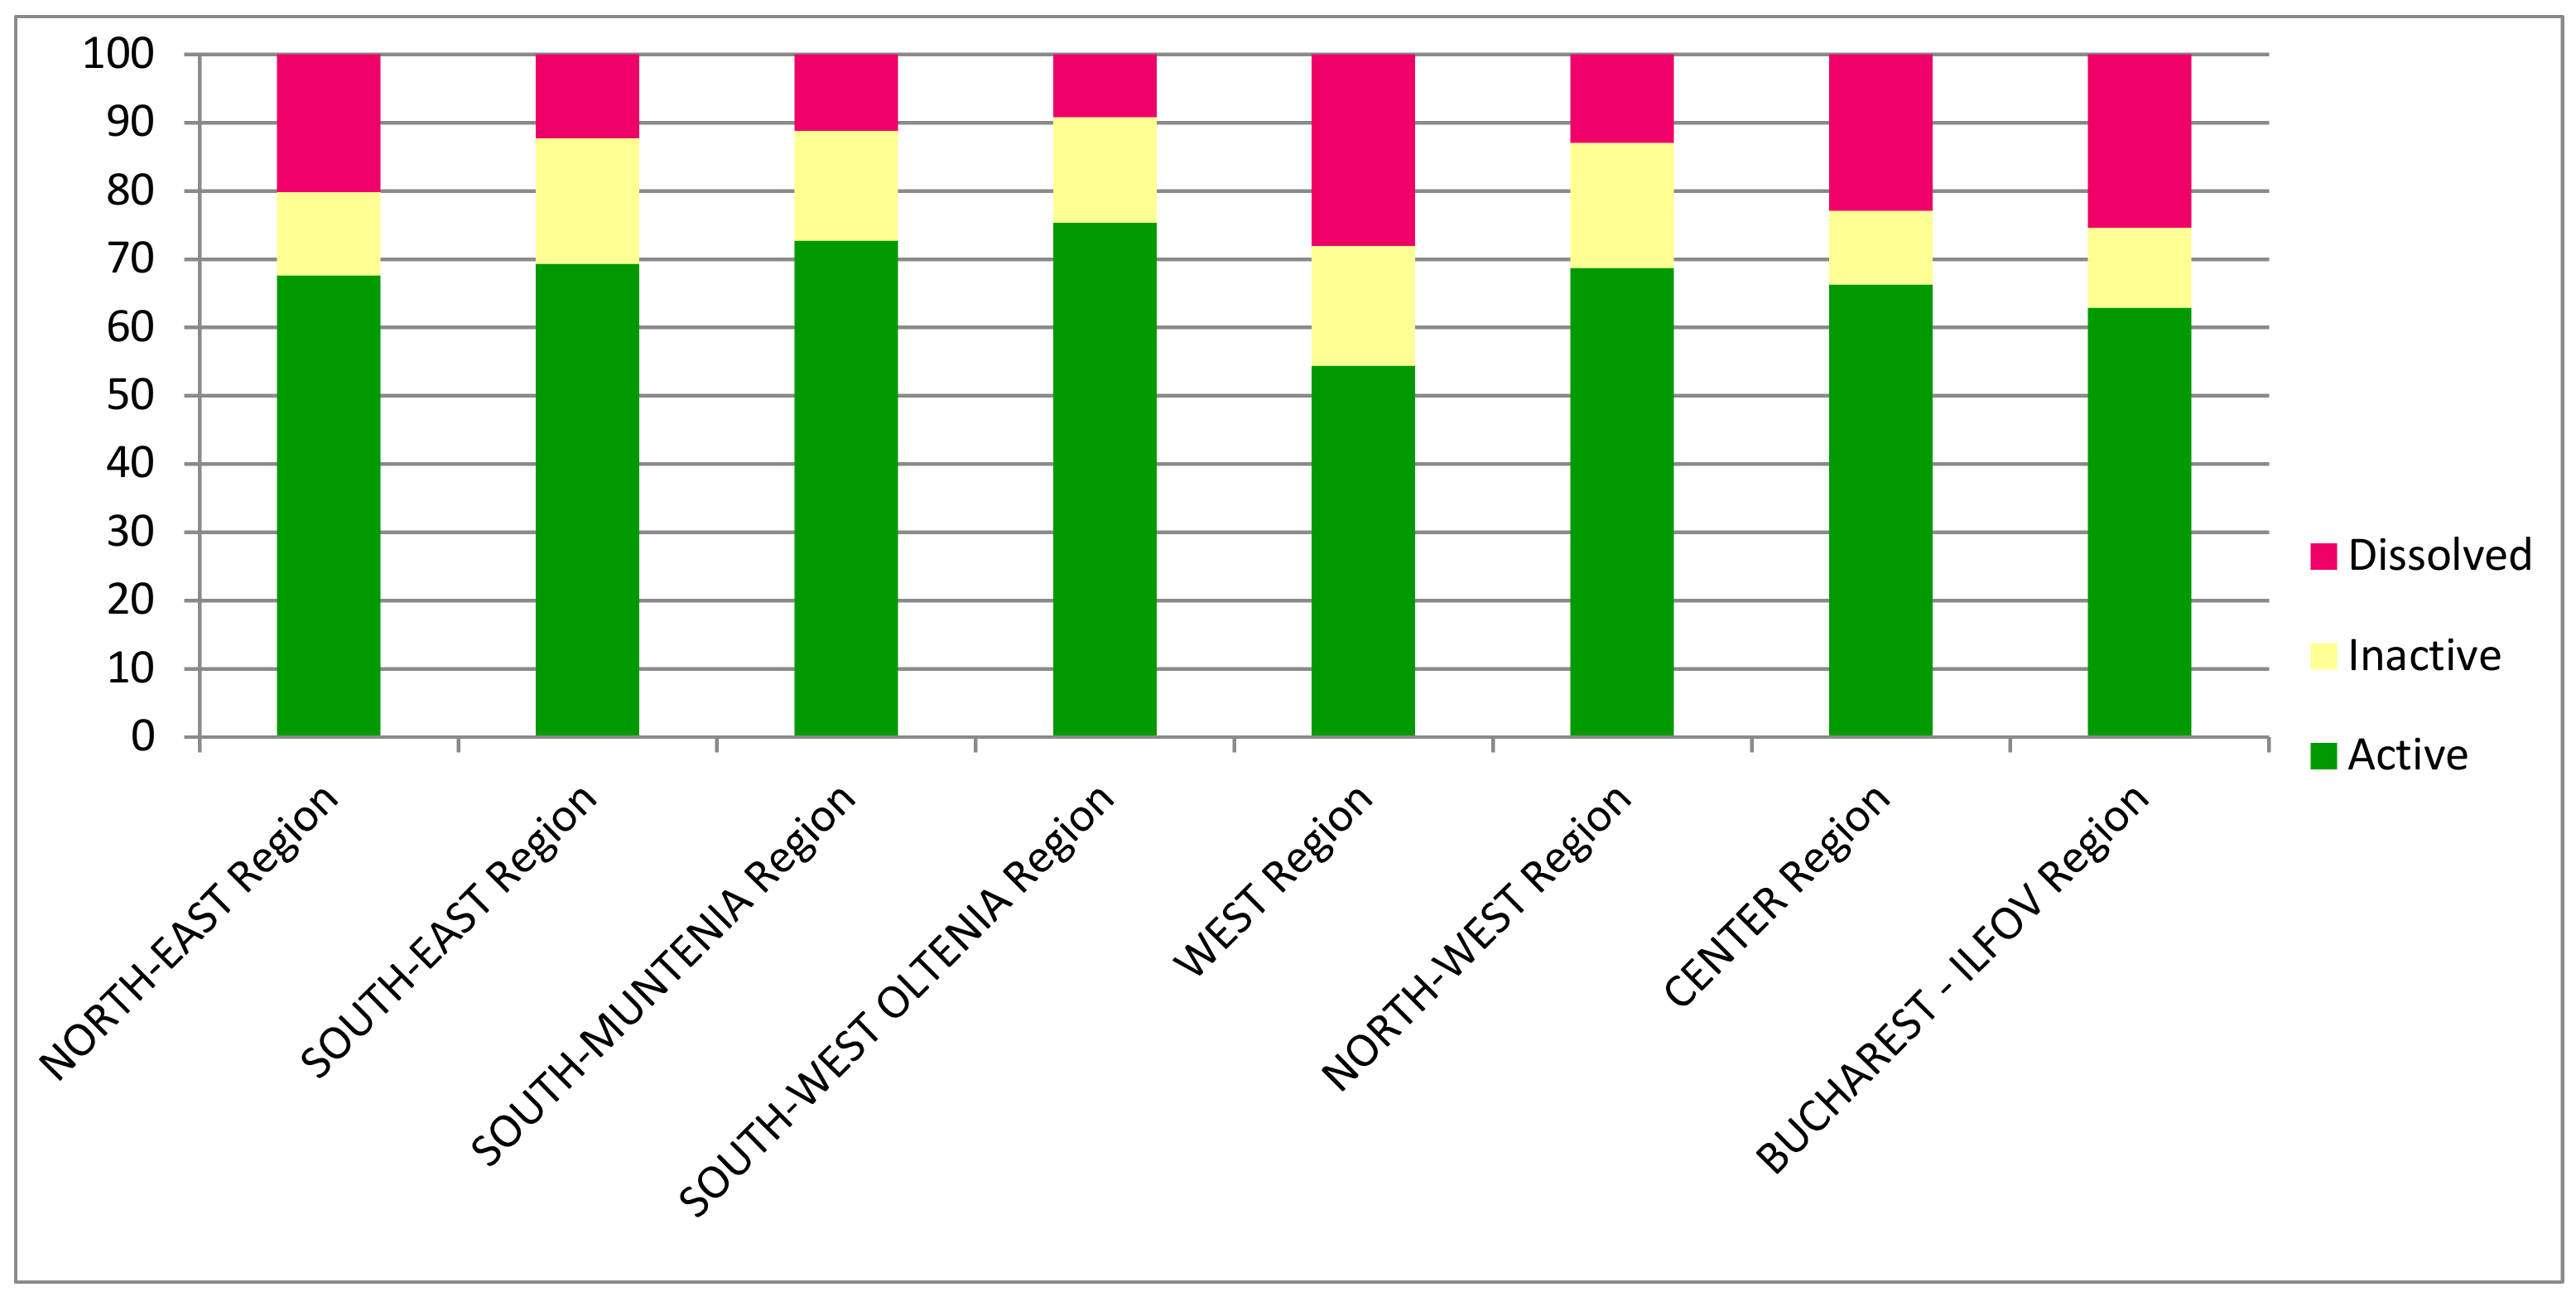
Figure 6 shows that, in 2007, the most significant percentage of enterprises that remained active after the first year of activity appears in the South-West Oltenia region (75.3%) and the lowest in the West region (54.4%), the average of 62.36%. The situation reversed in the case of companies that have been dissolved one year after their establishment: The West Region (28.1%) ranked first. The last position was the South-West Oltenia region (9.2%). In the case of companies that were inactive one year after their birth, the South East region (18.4%) ranked first, and the last position was the Center region (10.8%).
When we analyzed the situation on the number of firms, we calculated the variation coefficients for each of the three categories, and Table 2 presents their values. It is noteworthy that, for the categories of active and inactive enterprises, the values of the coefficient of variation are entirely appropriate, being around 25%. Because the value is less than 35%, we can say that the series is homogeneous, the variation is small, the average is representative. For the category of dissolved enterprises, the coefficient of variation is over 53%, showing a high degree of inhomogeneity.
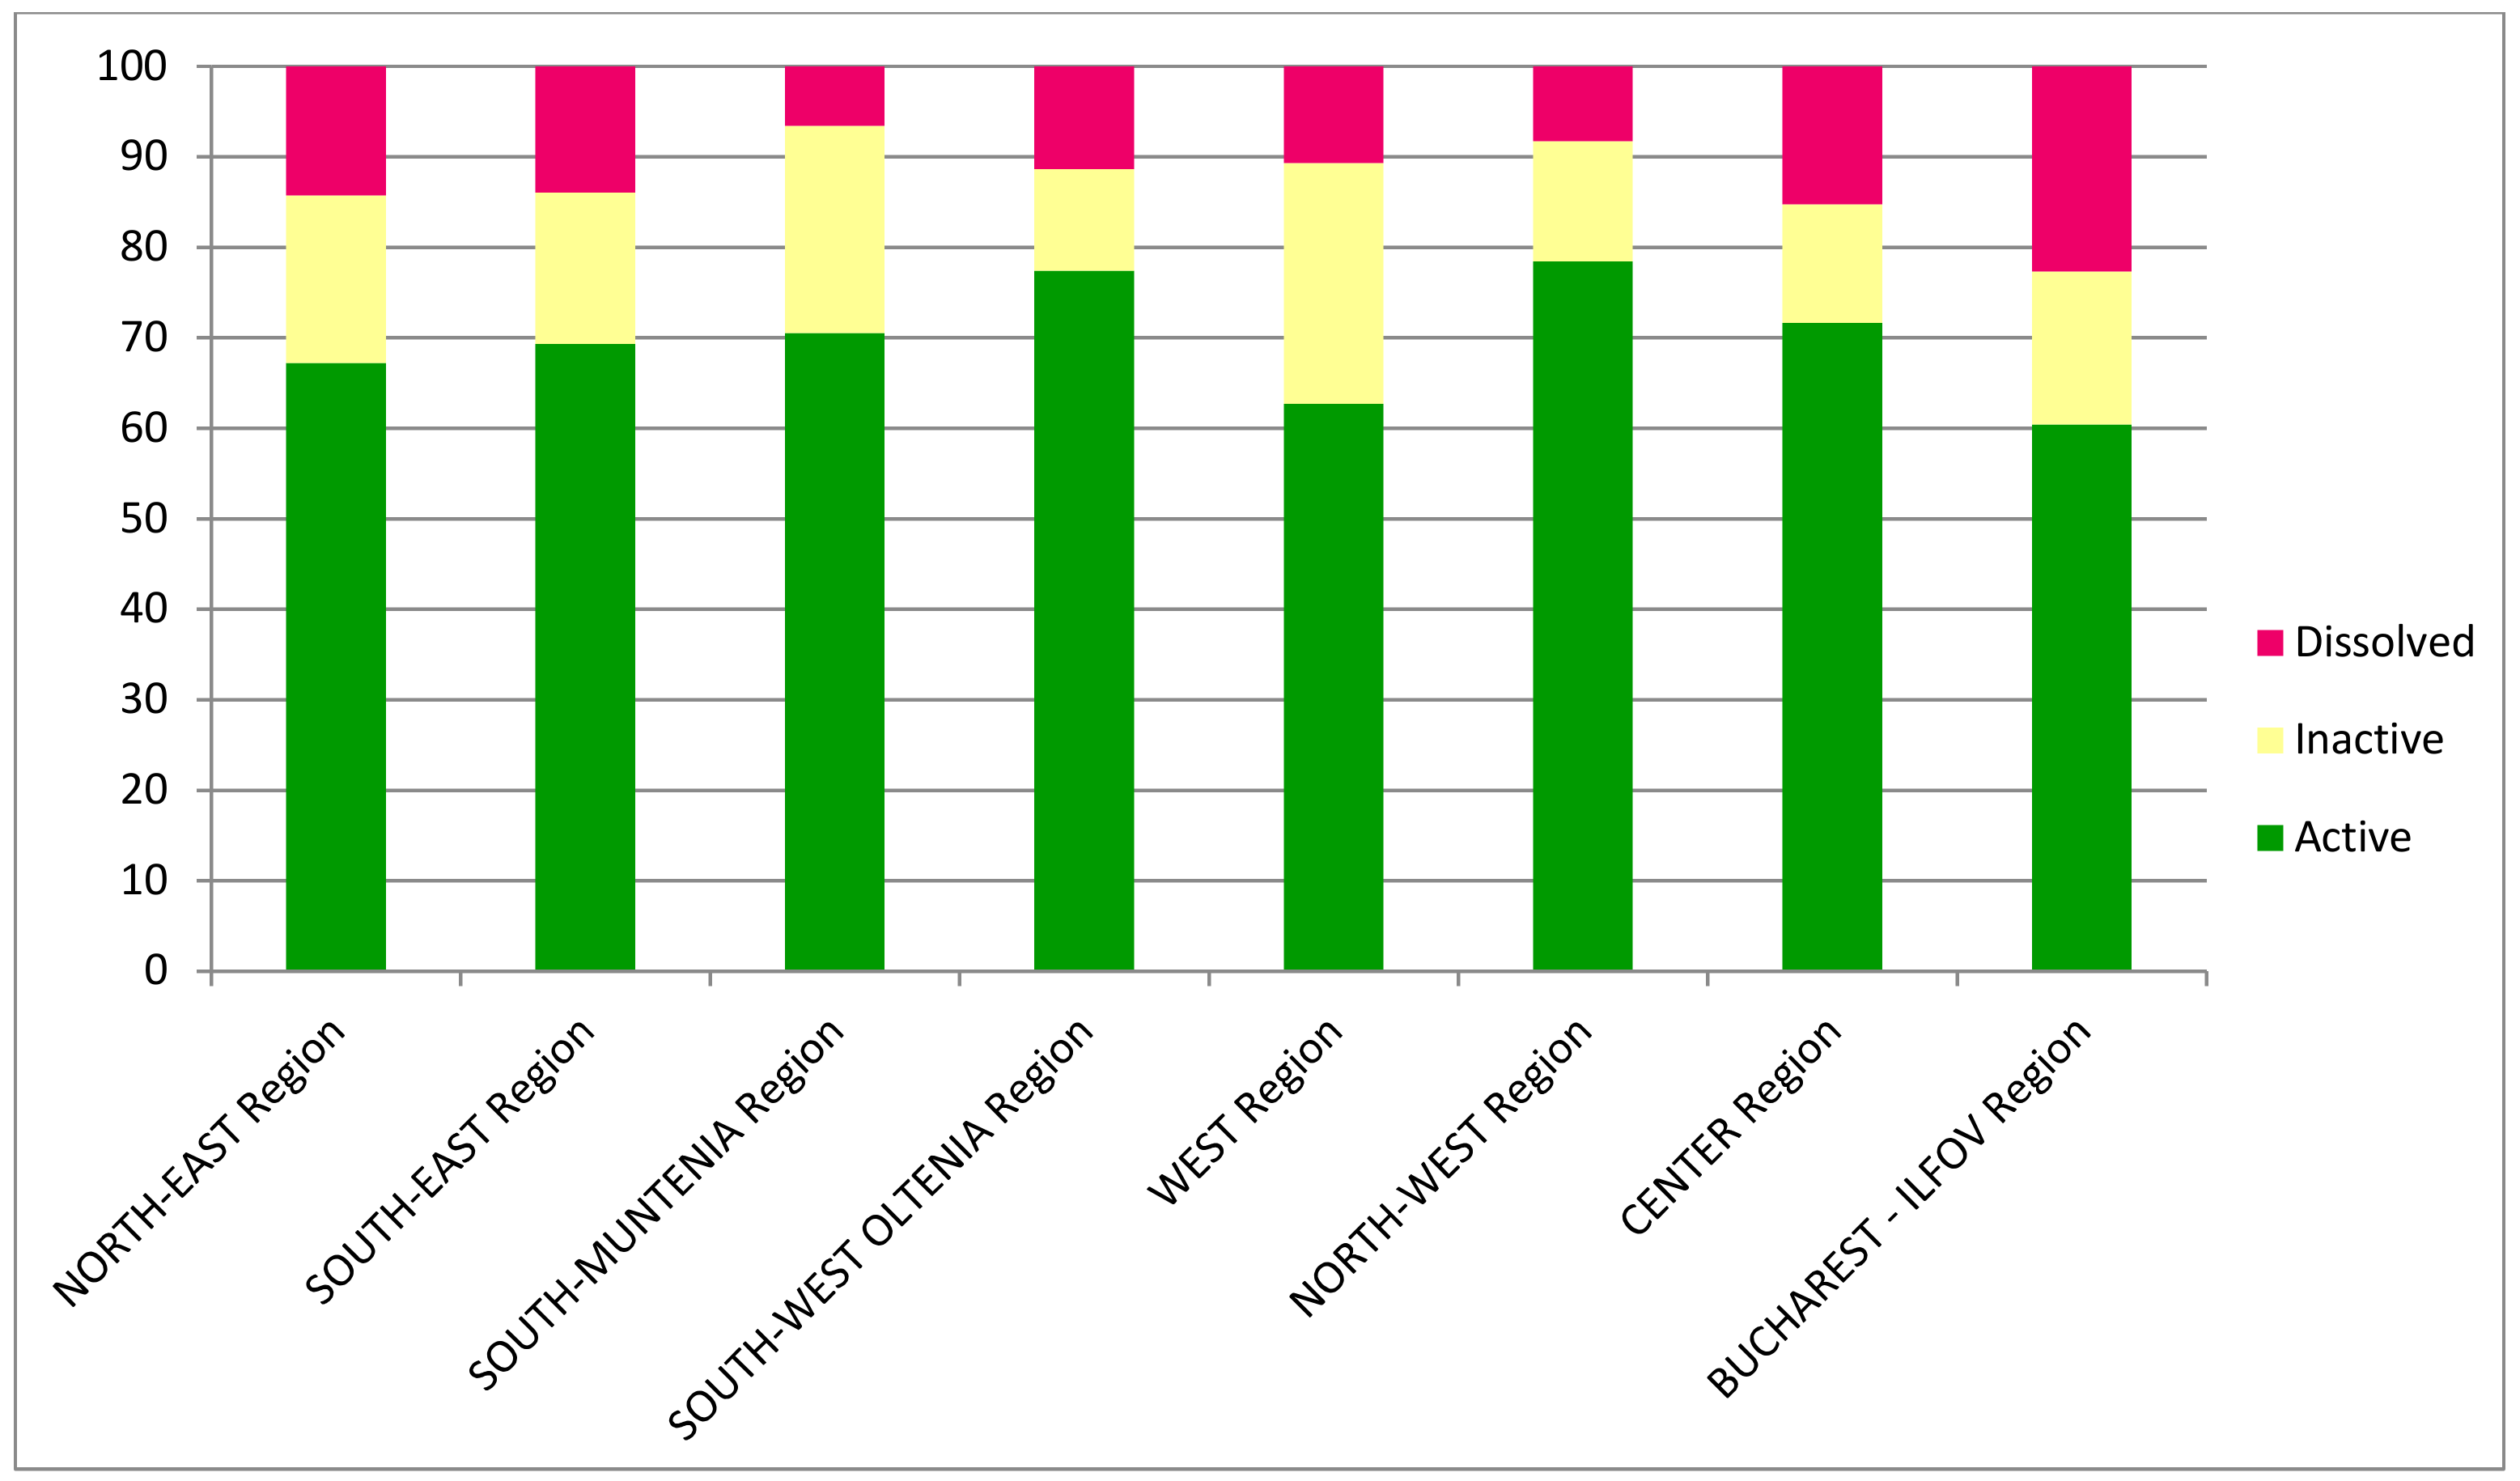
Figure 7 presents the results for the year 2016. Thus, for the category of active enterprises, the North-West region ranks first (78.4%), and in the last place is the Bucharest–Ilfov region (60.4%). The situation was also changing for the category of dissolved enterprises: the Bucharest–Ilfov region (22.7%) ranked first, opposite to the previous category, but South Muntenia region appeared in the last position (6.6%). For the category of inactive enterprises, the West Region ranked first (26.6%), and South-West Oltenia region (11.2%) ranked the last one.
When we analyzed the situation on the number of firms, the situation has changed radically. Thus, the coefficient of variation exceeded 35% for two of the three categories. Thus, in case of the active enterprises one year after the establishment, the value of the coefficient of variation was almost 40% (Table 2), and in the case of the dissolved enterprises at one year after setting up, the value was 79%, showing a significant inhomogeneity. These figures lead us to the conclusion that both these series were inhomogeneous. The coefficient of variation was below 35% for the other category—active enterprises at one year after setting up (Table 2). Therefore, this series can be considered homogeneous. This result could be considered a good one, showing low disparities among the Romanian development regions regarding the share of active enterprises in whole newborn enterprises.
To assess whether there are significant disparities between development regions, we have used the Gini coefficient, which measured the concentration. In this case, we calculated the Gini coefficients for each of the three categories of enterprises determined by their situation after one year of setting up. To assess a possible change following Romania’s accession to the EU, we considered two moments, namely 2007—the year Romania joined the EU and 2016, the last for which there are statistical data centralized at the national level. Generally speaking, the higher the Gini coefficient value, the more uneven the category is.
From the results centralized in Table 3, it is noticeable that for each of the three categories the value of the Gini coefficient increased in 2016 compared to 2007. From the individual evolutions, it can be remarked that the highest an increase in the Gini coefficient was recorded for inactive companies one year after their establishment. Here the growth was almost 43%. For the active enterprises at one year after setting up, Gini’s growth rate was nearly 20%. The smallest increase we noticed in the companies dissolved after a year since their birth, i.e., almost 16%. However, looking at the data in Table 2, it is evident that only for the dissolved companies we can talk about some concentration of them in 2016 because this category is the only one for which the Gini coefficient exceeded 0.3. This situation can be explained by the results of the Bucharest–Ilfov region, where most of the dissolved companies were, both in number and percentage. For active companies, the concentration is the smallest (CG = 0.16), while for inactive companies, CG = 0.21.
Interpreting these results for interregional disparities concluded that in 2016 they have widened compared to 2007. In fact, in 2007, there could be practically no inter-regional disparities for each of the three categories of enterprises. In 2016, things have changed, and even if we talk about a lack of concentration only for dissolved businesses, this has intensified in the other two categories. These figures (Appendix A Table A1) are the effects of unequal economic growth. Thus, on the one hand, economic growth, as measured by GDP, shows imbalances in the sense that, although in both 2007 and 2016 the same two regions were above the average, the Bucharest–Ilfov region and the West Region, the differences they had deepened in 2016, the GDP of the Bucharest–Ilfov region, being almost two and a half times higher than the average. At the end of the list was the North-East Region, the GDP generated here representing 60% of the average in 2007 and respectively 59% in 2016.
On the other hand, the growth rate of the number of new businesses also had, about the same type of evolution, with some small differences. Thus, both in 2007 and 2016, the same two regions were above the average, but the South-West Oltenia region occupied the last place. Moreover, in the case of the regions above the average, the differences compared to this were reduced in 2016 compared to 2007, behavior also explained by economic growth, because of the U-shaped relationship between the level of economic development and the rate of ‘occupational entrepreneurship ‘and a significant U-shaped relationship between early-stage entrepreneurial activity and levels of economic development have been demonstrated. Behavioral entrepreneurship is taken into account in as far as it overlaps with occupational entrepreneurship [43].
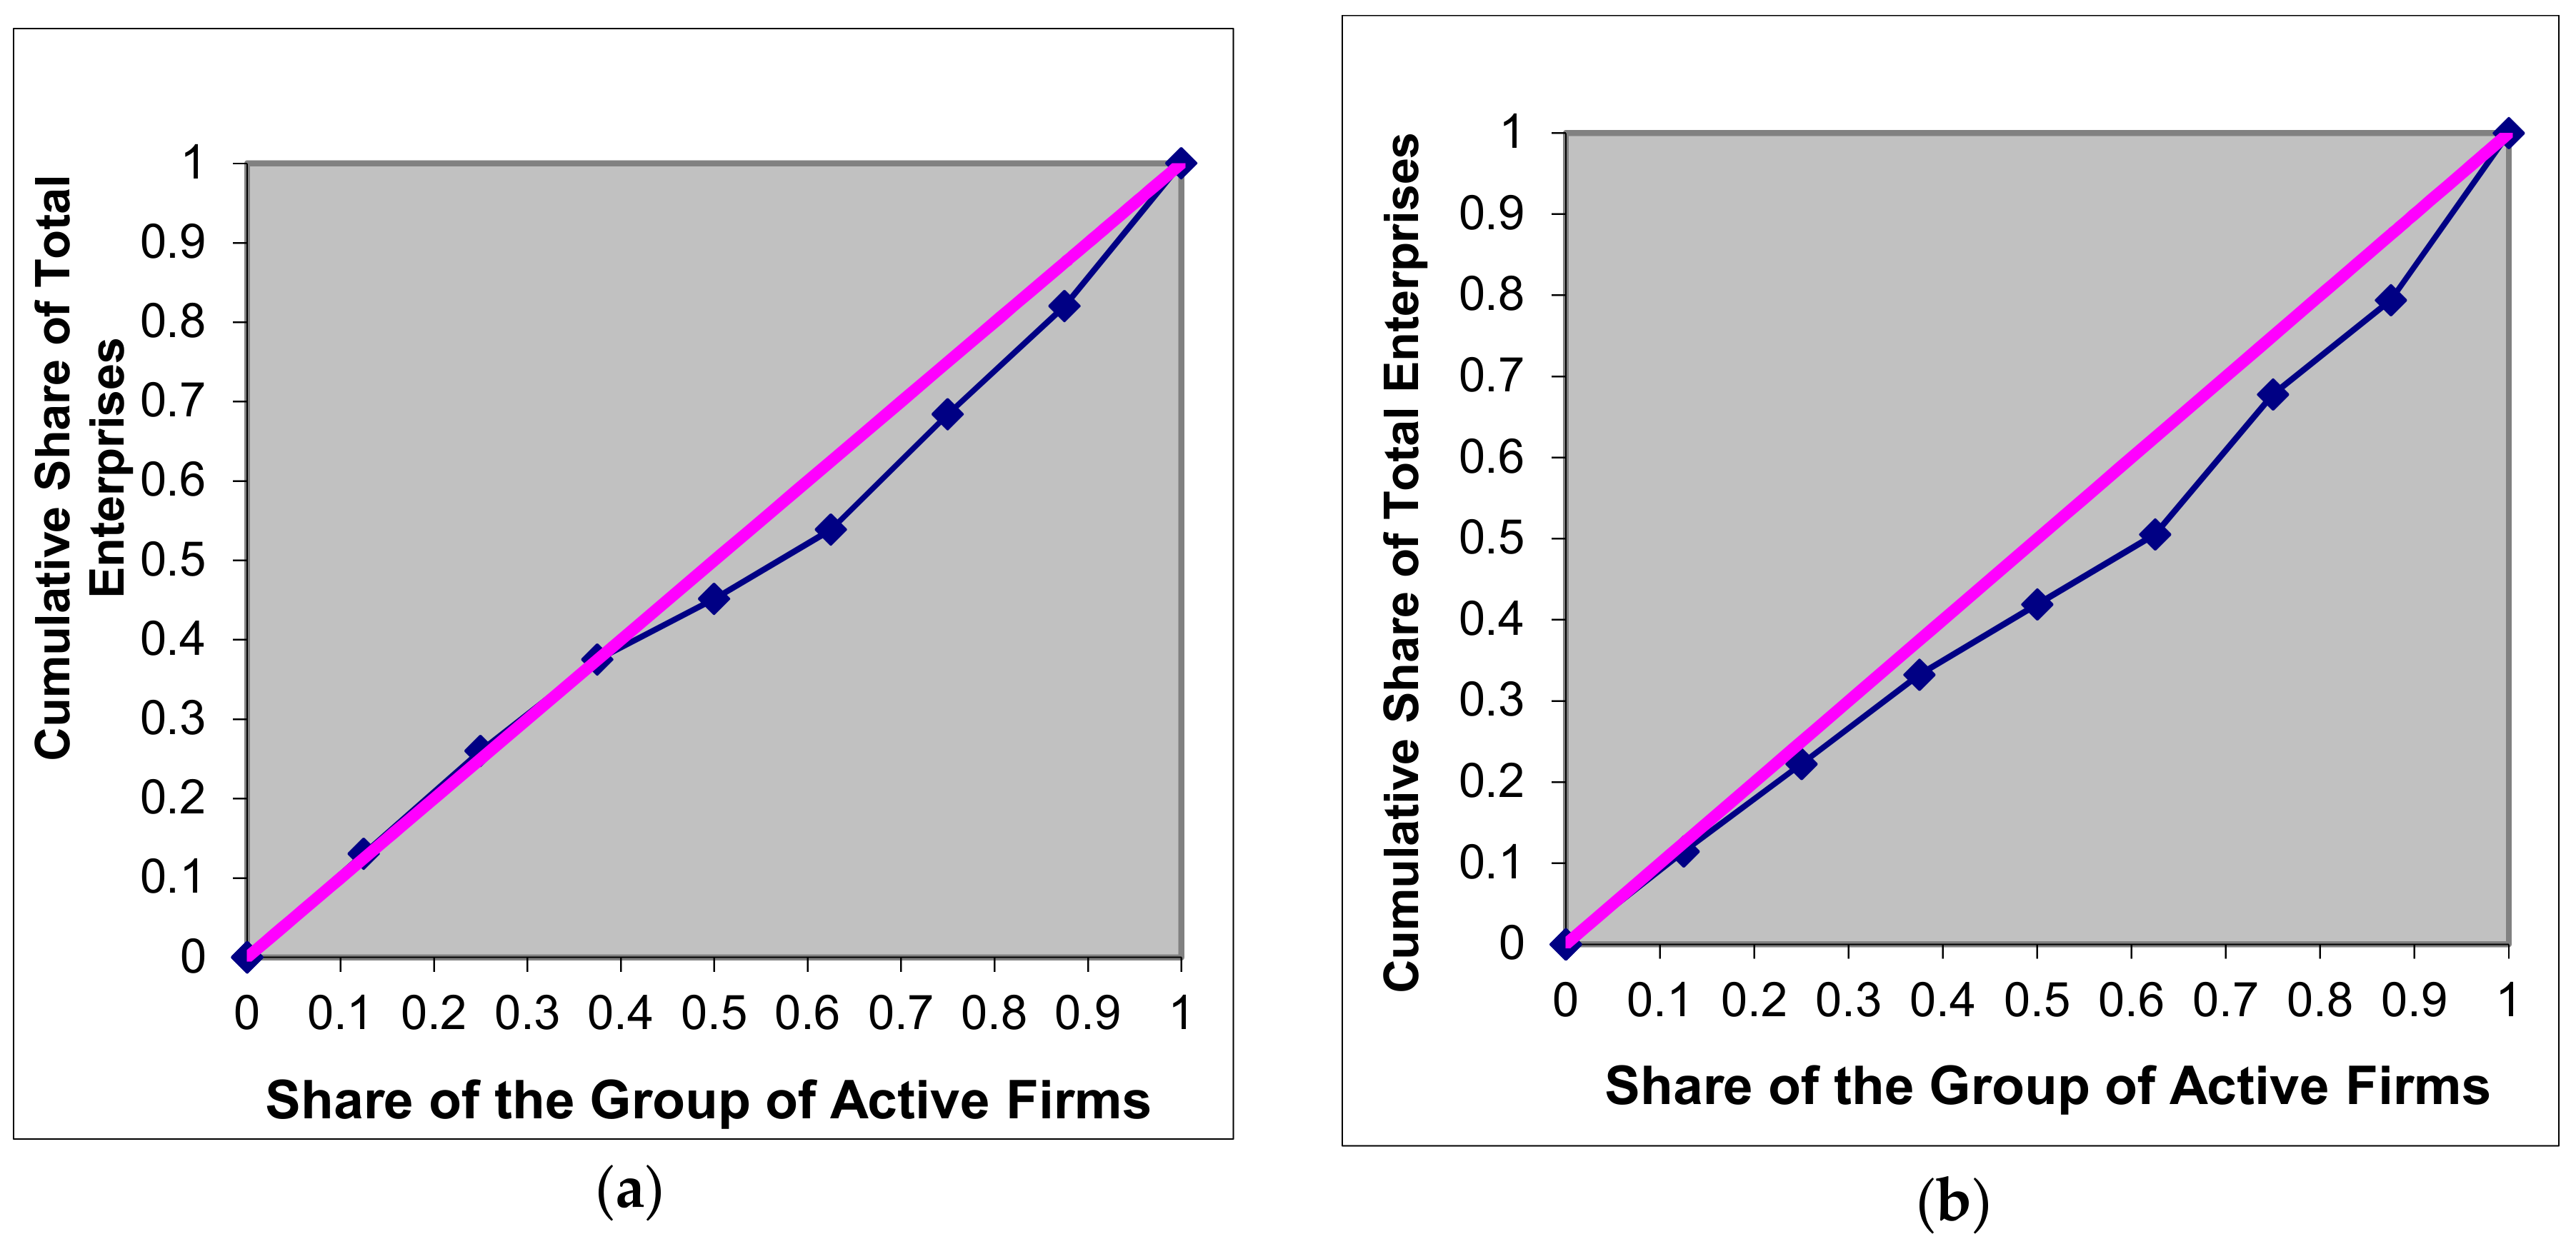
To make the situation clearer, we have also used the Lorenz curve. The Lorenz curve also refers to the concentration problem and is a tool commonly used in economic analysis, as it provides a picture of the process’s intensity, as well as a possibility to quantify the degree of concentration. From the perspective of convergence analysis, concentration indicators provide limited information, and they are defined to express numerical states that are most complementary to convergence, and only if two-dimensional coefficients inspired by the Lorenz curve are used. The advantages of choosing the Lorenz curves are the simplicity of graphic representation and visual clarity.
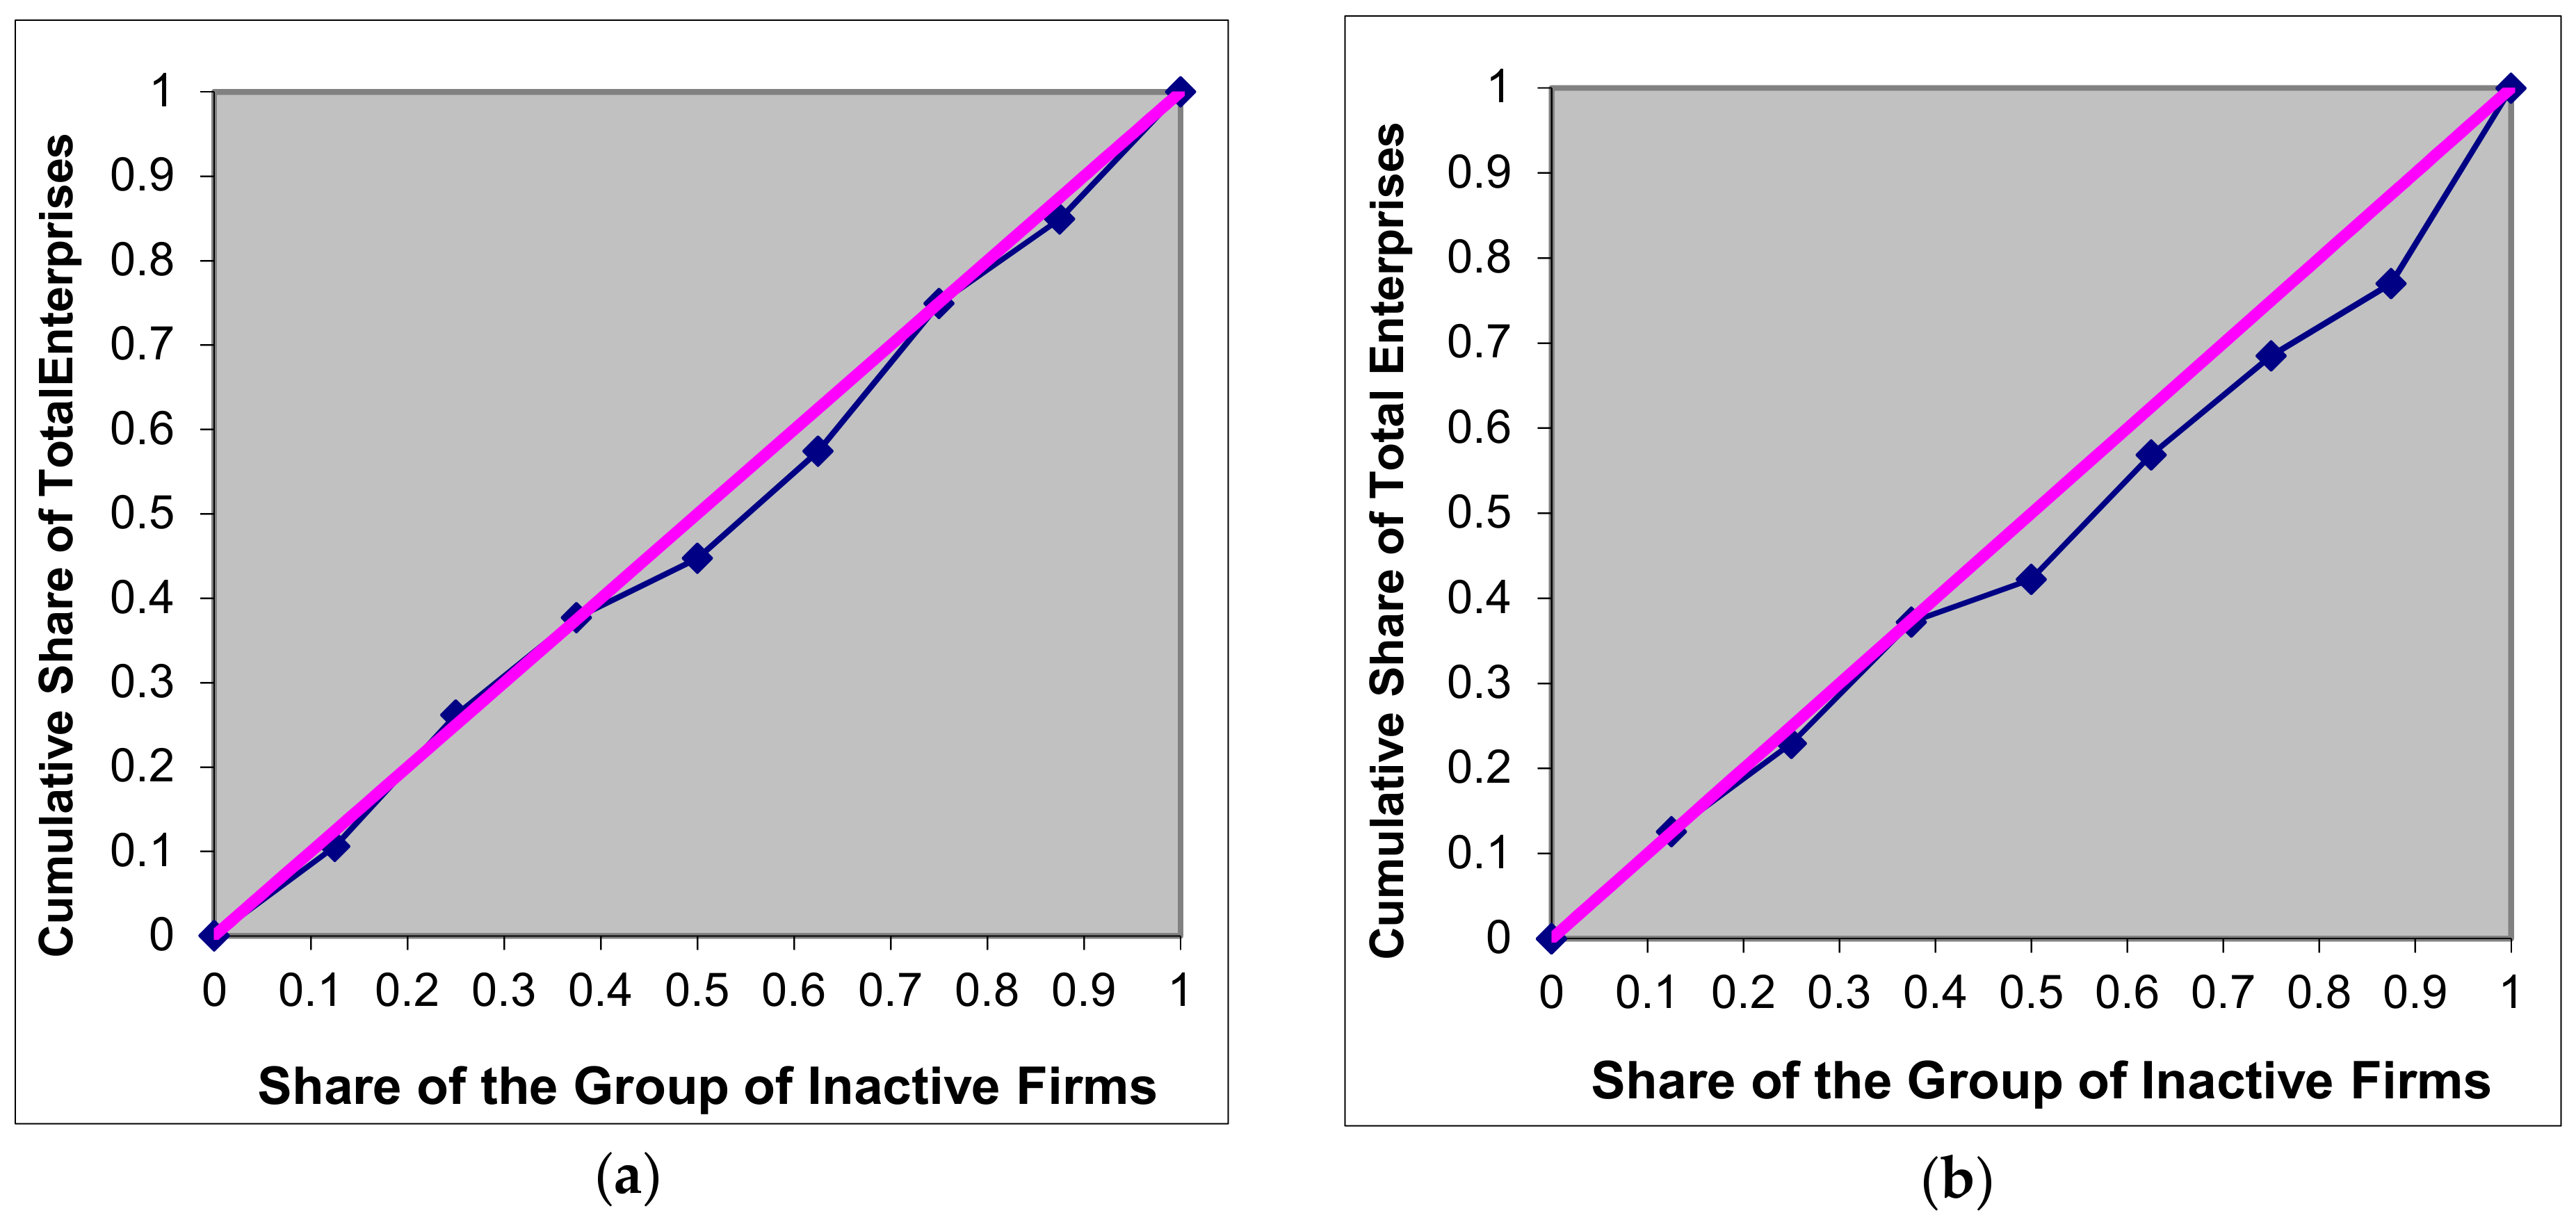
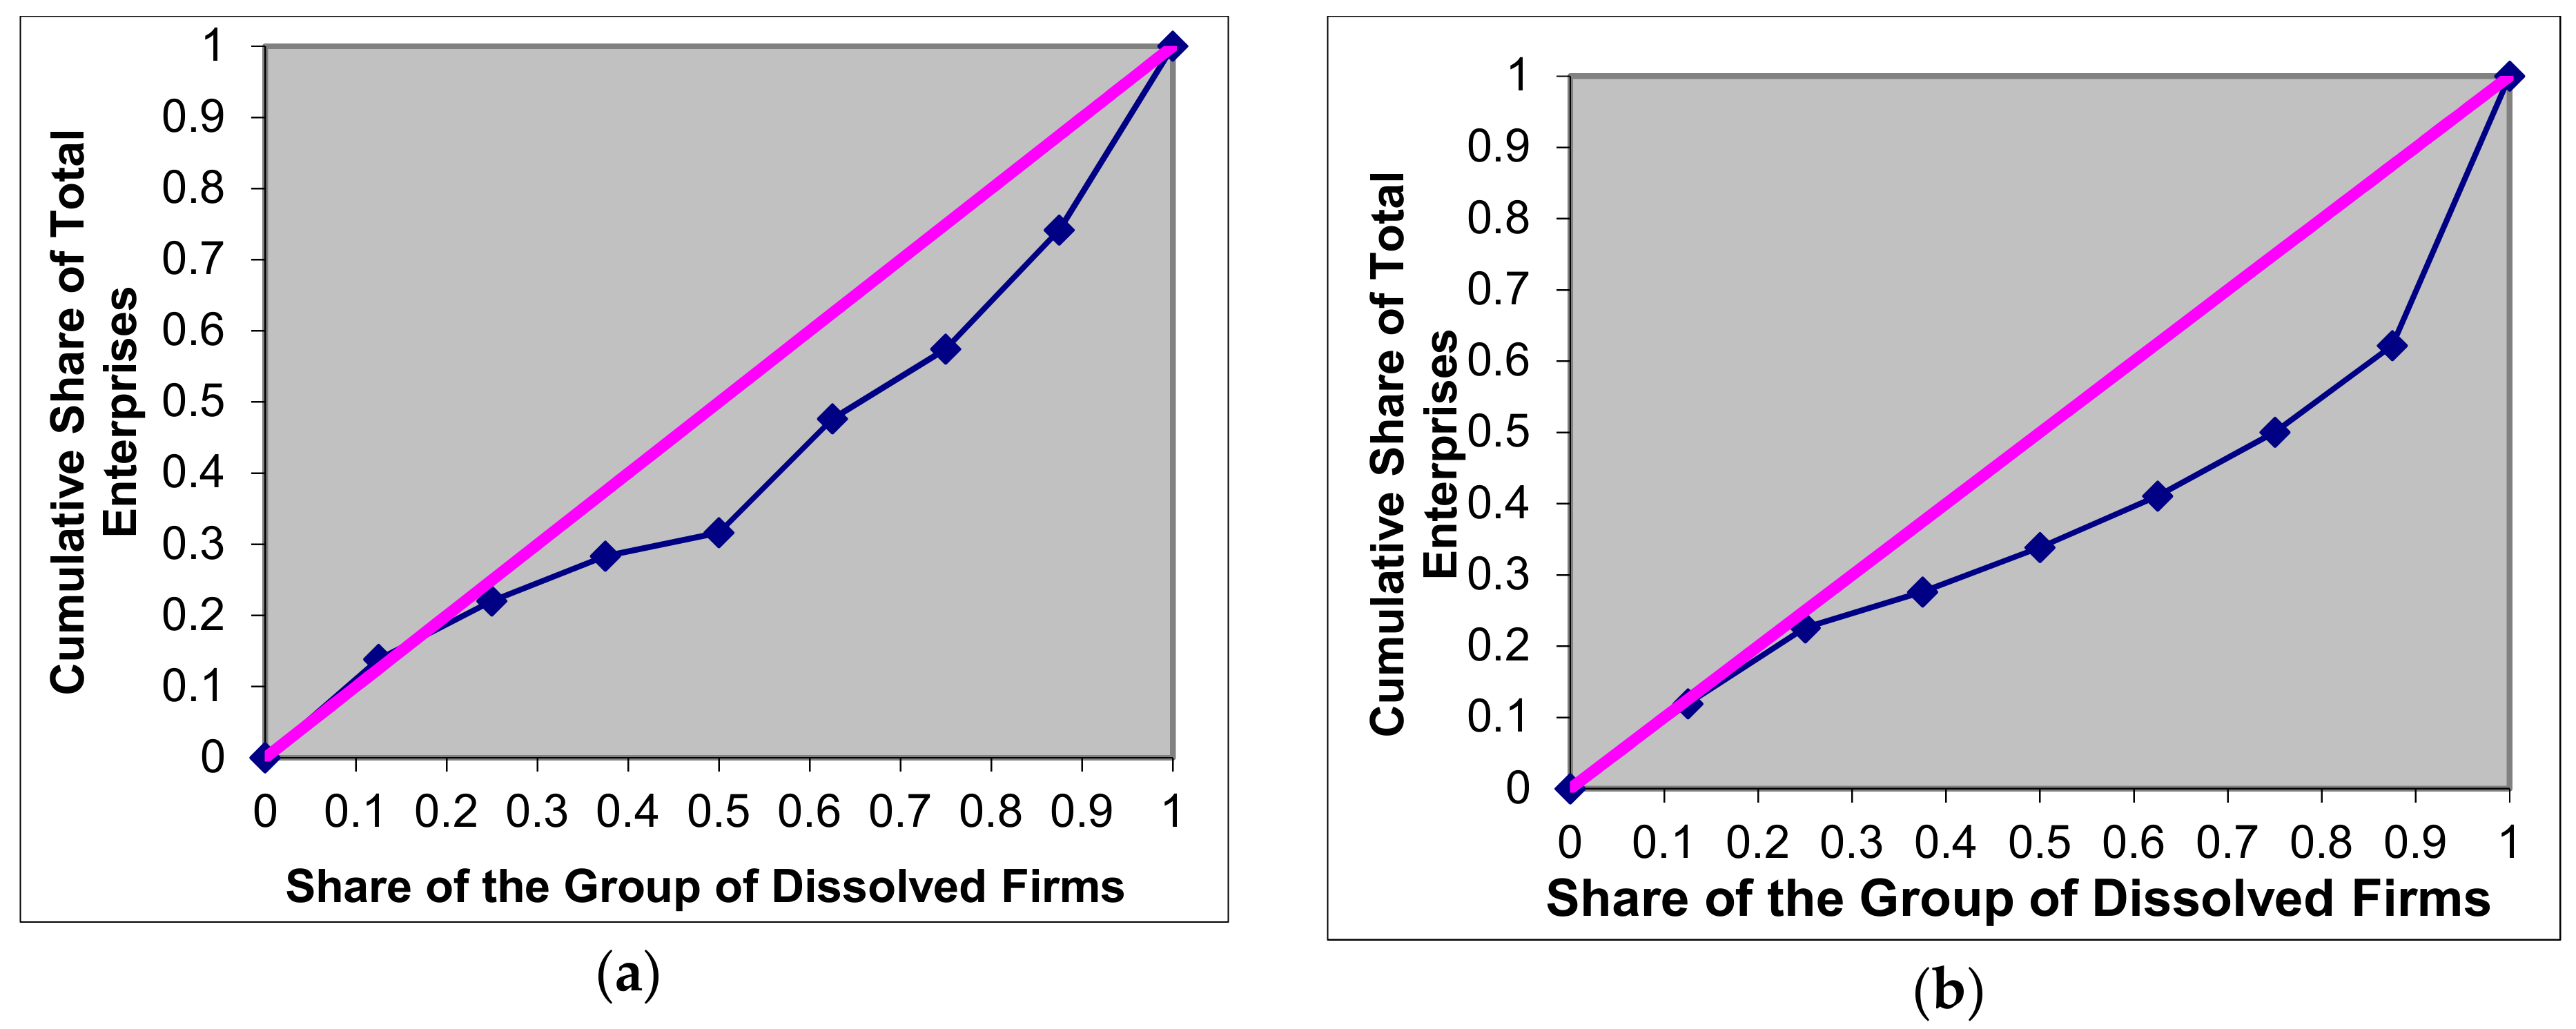
Grouping of companies was made about their situation one year after setting up, namely, active firms, inactive firms, and dissolved firms. The analysis of concentration in some regions was sought in order to highlight regional disparities. The deepening of concentration in 2016 as compared to 2007 becomes more visible. Thus, in Figure 8, Figure 9 and Figure 10, quadrant (a) presents the situations for 2007, and quadrant (b), those for 2016. In all cases, the area corresponding to 2016 is higher than those corresponding to 2007.
4. Conclusions
To the questions addressed in research, the major findings of this paper are:
• The evolution of regional disparities in terms of the entrepreneurial activity.
The analysis of these disparities aimed at identifying existing regional imbalances. Stimulating balanced development means reducing regional development gaps. As a result of the analysis, we can see that there are no significant disparities in the eight analyzed regions, with Gini coefficients showing uniform distributions. From the point of view of the situation of the enterprises one year after their establishment, Romania is a less homogenous country in 2016 than in 2007. From the analyzed situations, there are small, insignificant concentrations even at the level of the eight regions regarding active enterprises and inactive enterprises one year after setting up. On the other hand, we observe some concentration in dissolved companies in 2016 in contrast to 2007. The Bucharest–Ilfov region, the most developed region of the country, both economically and socially, but also the North-West region are those that mainly determined this increase in concentration.
From the perspective of the methodology used to assess the convergence, it is worth pointing out that the methods used allow quantification of relevant aspects of process status, although the indicators result from a static perspective (for a given period). It is necessary to resume calculations for successive periods to assess convergence without excluding the possibility of finding a divergence. To eliminate the limitation of reference to a single variable, the primary recommendation for using the coefficient of variation and the Gini coefficient is to use comparable proportions (weights) [44]. We consider it useful to extend the scope of the indicator, including several economic variables, but also in the social field, so that the findings to be able to refer to multi-level convergence. The comparative analysis of the concentration coefficients obtained for the two successive periods indirectly signals a situation close to what is meant by decreasing convergence. This situation is confirmed by the increase in the level of concentration. Directly, however, the concentration indicators indicate how far we are in the ‘fairness’ state of proportional distribution of the economic results recorded in the eight development regions of Romania. As a result, the utility of concentration ratios for convergence analysis is limited. The Gini coefficient, defined as a two-dimensional indicator, may be useful if a proportional distribution of weights per region on the considered variable torque would, in part, condition the development of the convergence process across the eight regions.
• The status of newly created enterprises one year after their establishment before and after Romania’s accession to the EU.
The share of companies that remained active one year after their establishment increased in the South-West Oltenia, West, North-West, and Center regions. It remained constant in the South-East Region and declined in the other three regions. However, in 2016, most SMEs were registered in Bucharest–Ilfov, with the highest turnover of ROL 232 billion. The North-West Region is the following area according to the number of registered SMEs and with a total turnover of ROL 94 billion. The third place is the center of the country with 76,000 registered SMEs and a turnover of 83 billion lei. The region in which the smallest SMEs were active was the South-West Oltenia, where 49,000 companies reported a total turnover of ROL 35 billion. SMEs register the most significant number of employees in the Bucharest–Ilfov region (836,000 employees); this is followed by the Northwest Region (456,000 employees). The smallest number of employees are in the South-West Oltenia Region (209,000 employees).
• What implications do Romania’s accession to the EU on entrepreneurial activity at the local, and regional scales?
Progress since 2007 is generally above the EU average, except in the areas of skills and innovation, internationalization, environment, and single market. Although a large number of policy measures were implemented, SME stakeholders consider that progress in implementing the SBA has been moderate. Since 2008, Romania has implemented a large number of policy measures addressing all policy areas of the SBA. Despite such an active approach, the overall performance on the SBA areas remains modest due to persisting weaknesses in its implementation. The areas that saw the most important progress were: access to finance, ‘responsive administration’, and state aid and public procurement. The ongoing process of simplifying administrative procedures for businesses needs to continue.
Romania needs to prepare for rising labor costs—an inevitable path that will affect entrepreneurs and companies that still rely on this advantage of our country, as is already beginning to happen. Romania needs permanent efforts to improve the legislative and institutional framework, flexibility and adaptation of the business environment to increase the attractiveness of entrepreneurial activities among citizens and to stimulate the attraction of foreign investors, the development of a favorable environment for research and development, allowing collaboration between business and universities.
At this point, we may assume that maintaining disparities in regional development could be a sign of socio-economic weakness of the region, also resulting in a lower propensity towards foreign investments. This conclusion is supported by the results of a report published in 2017 by the World Bank [45], which focused mainly on the regulations applicable to the business environment in Bulgaria, Romania, and Hungary. What causes these gaps are issues that should be investigated further on, and the analysis could be developed at two levels: the extensive examination refers to enlarging the study by taking into account a higher number of years and cities, not only regions, while the intensive one is about including more methods. These regional analyses can provide concrete examples of how team learning and inter-institutional coordination can contribute to stimulating modernization. The importance of the present study lies in that it is especially relevant for other European countries with NUTS 3 regional characteristics similar to Romanian regions, as in the case of the newest Member States of the European Union, namely Bulgaria, but also in Hungary or Greece.
5. Research Limitations and Future Research Directions
The intentional focus of this article was to better understand the regional disparities in Romania from the point of view of SMEs’ activity. This approach does raise considerations for interpreting the available data and studies.
The lack of reliable data was the major limitation. For this reason, in Figure 2 data for 2007 and 2015 were analyzed, because the data series for 2016 was not yet available. Regional data is also not yet available for a sufficient number of indicators. This reason has made it impossible to carry out a factorial analysis. The changes suggested by Figure 2 create the premise of in-depth analysis in the future using the principal components method. In our opinion, the differences among regions could reflect specific conditions. Identifying these conditions could be used to substantiate development policies.
However, our analysis could be a starting point in evaluating the entrepreneurial environment even for more developed European countries, as new means of exploring the disparities, even more since the economic crisis has changed the social and economic situation and, also, business behavior. In our opinion, a survival analysis could represent further research, because it could offer recognition of the factors that substantially determine the survival of SMEs. The ultimate goal is to understand the trends in the creation of new firms and their evolution in the business environment and the impact of economic shocks on entrepreneurial activity.
Author Contributions
Conceptualization, E.N., V.S., I.G., A.D.-C. and C.O.M.; Methodology, E.N., V.S., I.G., A.D.-C. and C.O.M.; Software, E.N., V.S., I.G., A.D.-C. and C.O.M.; Validation, E.N., V.S., I.G., A.D.-C. and C.O.M.; Formal Analysis, E.N., V.S., I.G., A.D.-C. and C.O.M.; Investigation, E.N., V.S., I.G., A.D.-C. and C.O.M.; Resources, E.N., V.S., I.G., A.D.-C. and C.O.M.; Data Curation, E.N., V.S., I.G., A.D.-C. and C.O.M.; Writing-Original Draft Preparation, E.N., V.S., I.G., A.D.-C. and C.O.M.; Writing-Review & Editing, E.N., V.S., I.G., A.D.-C. and C.O.M.; Visualization, E.N., V.S., I.G., A.D.-C. and C.O.M.; Supervision, E.N., V.S., I.G., A.D.-C. and C.O.M.; Project Administration, E.N., V.S., I.G., A.D.-C. and C.O.M.; Funding Acquisition, E.N., V.S., I.G., A.D.-C. and C.O.M.
Funding
This research received no external funding.
Conflicts of Interest
The authors declare no conflict of interest.
Appendix A

Table A1.
Newly created active enterprises, creation rate, and GDP, by development regions (2006, 2007, 2016)
Table A1.
Newly created active enterprises, creation rate, and GDP, by development regions (2006, 2007, 2016)
| Year | 2006 | 2007 | 2016 | ||||||
|---|---|---|---|---|---|---|---|---|---|
| Development Regions | Number | Percentage | GDP (PPS per Inhabitant) | Number | Percentage | GDP (PPS per Inhabitant) | Number | Percentage | GDP (PPS per Inhabitant) |
| North-East | 18,218 | 4.7 | 6100 | 20,165 | 5.2 | 7100 | 13,675 | 3.5 | 10,400 |
| South-Muntenia | 14,994 | 3.9 | 800 | 17,202 | 4.4 | 9300 | 12,135 | 3.1 | 13,400 |
| South-West Oltenia | 9564 | 2.5 | 7500 | 11,848 | 3.1 | 8600 | 8159 | 2.1 | 12,400 |
| North-West | 20,027 | 5.2 | 9100 | 24,182 | 6.2 | 10,800 | 17,185 | 4.4 | 14,900 |
| West | 15,161 | 3.9 | 10,900 | 15,567 | 4 | 12,500 | 10,481 | 2.7 | 17,600 |
| South-East | 17,705 | 4.6 | 8300 | 17,467 | 4.5 | 9300 | 11,360 | 2.9 | 14,500 |
| Center | 19,419 | 5 | 9500 | 20,170 | 5.2 | 9800 | 13,204 | 3.4 | 15,800 |
| Bucharest–Ilfov | 27,034 | 7 | 21,900 | 37,244 | 9.6 | 26,500 | 25,235 | 6.5 | 40,400 |
| SUM | 141,822 | 36.5 | 9673 | 163,845 | 42.2 | 11,085 | 111,434 | 28.7 | 17,222 |
| MAX | 27,034 | 7 | 21,900 | 37,244 | 9.6 | 26,500 | 25,235 | 6.5 | 40,400 |
| MIN | 9564 | 2.5 | 800 | 11,848 | 3.1 | 7100 | 8159 | 2.1 | 10,400 |
| AMPLITUDE | 17,470 | 4.5 | 21,100 | 25,396 | 6.5 | 19,400 | 17,076 | 4.4 | 30,000 |
| AVERAGE | 17,765.3 | 4.6 | 9263 | 20,481 | 5.3 | 11,738 | 13,929 | 3.6 | 17,425 |
| DEV SQ | 175,691,187.5 | 11.7 | 248,118,750 | 413,404,268 | 27.3 | 266,378,750 | 194,017,114 | 12.9 | 636,255,000 |
| STD DEV | 4686.3 | 1.2 | 5569 | 7189 | 1.8 | 5770 | 4925 | 1.3 | 8918 |
| VAR | 21,961,398.4 | 1.5 | 31,014,844 | 51,675,533 | 3.4 | 33,297,344 | 24,252,139 | 1.6 | 79,531,875 |
| VAR COEF | 26% | 26% | 60% | 35% | 35% | 49% | 35% | 36% | 51% |
Source: Authors computations, based on data retrieved from The Romanian National Institute of Statistics.
References
- Wei, Y.D. Towards equitable and sustainable urban space: Introduction to Special Issue on “Urban Land and Sustainable Development”. Sustainability 2016, 8, 804. [Google Scholar] [CrossRef]
- Carree, M.A.; Thurik, A.R. Small firms and economic growth in Europe. Atl. Econ. J. 1998, 26, 137–146. [Google Scholar] [CrossRef]
- Carree, M.A.; Thurik, A.R. The impact of entrepreneurship on economic growth. In Handbook of Entrepreneurship Research, 2nd ed.; Acs, Z.J., Audretsch, D.B., Eds.; Springer: New York, NY, USA, 2003; Volume 5, pp. 557–594. ISBN 978-1-4419-1190-2. [Google Scholar]
- Audretsch, D.B.; Keilbach, M.C.; Lehmann, E.E. Entrepreneurship and Economic Growth; Oxford University Press: New York, NY, USA, 2006; pp. 12–33. ISBN1 13 978-0-19-518351-1. ISBN2 0-19-51835-7. [Google Scholar]
- Fedajev, A.; Durkalić, D.; Nikolić, R.; Arsić, M. Convergence of EU Countries in Meeting the Europe 2020 Strategy Goals. In Proceedings of the 7th International Symposium on Environmental and Material Flow Management, Bor, Serbia, 3–5 November 2017; Živković, Ž., Mihajlović, I., Eds.; University of Belgrade, Technical Faculty: Bor, Serbia, 2017; pp. 110–120. Available online: https://www.researchgate.net/publication/322577852_CONVERGENCE_OF_EU_COUNTRIES_IN_MEETING_THE_EUROPE_2020_STRATEGY_GOALS (accessed on 14 August 2018).
- 2015 SBA Fact Sheet Romania. Available online: http://ec.europa.eu/DocsRoom/documents/16344/attachments/28/translations/en/renditions/native (accessed on 14 August 2018).
- Ayala, J.C.; Manzano, G. The resilience of the entrepreneur. Influence on the success of the business. A longitudinal analysis. J. Econ. Psychol. 2014, 42, 126–135. [Google Scholar] [CrossRef]
- Markman, G.D.; Baron, R.A. Person–entrepreneurship fit: Why some people are more successful as entrepreneurs than others. Hum. Resour. Manag. Rev. 2003, 13, 281–301. [Google Scholar] [CrossRef]
- Sánchez, J.C. Entrepreneurship as a legitimate field of knowledge. Psicothema 2011, 23, 427–432. [Google Scholar] [PubMed]
- De Vries, H.; Shields, M. Entrepreneurial Resilience: An Analysis of the Resilience Factors in SME Owner-Managers; University of Central Arkansas Working Paper. 2005. Available online: http://sbaer.uca.edu/research/icsb/2005/paper201.pdf (accessed on 26 September 2017).
- Sheffi, Y. The Resilient Enterprise: Overcoming Vulnerability for Competitive Advantage; MIT Press Books: Cambridge, UK, 2005; pp. 24–40. ISBN1 10: 0262195372. ISBN2 13: 9780262195379. [Google Scholar]
- Hedner, T.; Abouzeedan, A.; Klofsten, M. Entrepreneurial resilience. Ann. Innov. Entrep. 2011, 2, 7986. [Google Scholar] [CrossRef]
- Andrei, J.V.; Mieila, M.; Panait, M. The impact and determinants of the energy paradigm on economic growth in European Union. PLoS ONE 2017, 12, e0173282. [Google Scholar] [CrossRef] [PubMed]
- Nicolescu, O.; Nicolescu, C.; Truică, A.-P.; Urîtu, D.; Corcodel, Ş.-F. Carta Albă a IMM-urilor din România. 2016. Available online: http://www.aippimm.ro/files/articles_files/57/6521/carta-alba-a-imm-urilor-din-romania-2016.pdf (accessed on 18 January 2018).
- Altman, E.I. Why businesses fail. J. Bus. Strategy 1983, 3, 15–21. [Google Scholar] [CrossRef]
- Linnenluecke, M.K. Resilience in business and management research: A review of influential publications and a research agenda. Int. J. Manag. Rev. 2017, 19, 4–30. [Google Scholar] [CrossRef]
- Lee, J.; Wang, J. Developing entrepreneurial resilience: Implications for human resource development. Eur. J. Train. Dev. 2017, 41, 519–539. [Google Scholar] [CrossRef]
- Liao, J. Entrepreneurship failures: Key challenges and future directions. In Entrepreneurship: the Way Ahead; Welsch, H.P., Ed.; Routledge: New York, NY, USA, 2004; pp. 133–150. [Google Scholar]
- Albu, L.-L.; Lupu, R.; Călin, A.-C.; Popovici, O.-C. Strategy and Policy Studies (SPOS) 2017, Study No. 1. The Impact of Romania’s Accession to the European Union on the Romanian Economy. Sectorial Analysis (Industry, Agriculture, Services, etc.), pp. 120–121. Available online: http://www.ier.ro/sites/default/files/pdf/SPOS_2017_Studiul%201_FINAL.pdf (accessed on 14 August 2018).
- Iorio, M.; Corsale, A. Rural Tourism and Livelihood Strategies in Romania. J. Rural. Stud. 2010, 26, 152–162. [Google Scholar] [CrossRef]
- Assessment of the Flagship Initiative. An Industrial Policy for the Globalisation Era, Comitetul Regiunilor. 2013. Available online: https://www.google.ro/url?sa=t&rct=j&q=&esrc=s&source=web&cd=1&cad=rja&uact=8&ved=0ahUKEwjCiO2Vjt_YAhUBDuwKHSClDp8QFggqMAA&url=https%3A%2F%2Fportal.cor.europa.eu%2Feurope2020%2FMonitoringFlagships%2FDocuments%2FIndustrial%2520policy%2Fcdr217-2013_00_00_tra_tcd_en.doc&usg=AOvVaw05ACOccVtAEWwYtj6WK8Wo (accessed on 15 August 2018).
- 2016 SBA Fact Sheet Romania. Available online: https://ec.europa.eu/docsroom/documents/29489/attachments/24/translations/en/renditions/pdf (accessed on 15 August 2018).
- Săvoiu, G.; Crăciuneanu, V.; Ţaicu, M. A new method of statistical analysis of markets’ concentration or diversification. Rom. Stat. Rev. 2010, 2, 21–27. [Google Scholar]
- Gini, C.; Ottaviani, G.; Rome, I.C. Memorie di Metodologia Statistica; Pizetti, E., Salvemini, T., Eds.; English Translation in Metron; Libreria Eredi Virgilio Veschi: Rome, Italy, 1955; Volume 63, pp. 33–38. [Google Scholar]
- Cowell, F.A. Measurement of inequality. In Handbook of Income Distribution; Atkinson, A., Bourguignon, F., Eds.; Elsevier: Amsterdam, The Netherlands, 2000; Volume 1, pp. 87–166. ISBN 9780444816313. [Google Scholar]
- Jenkins, S.P. The measurement of economic inequality. In Readings on Economic Inequality; Osberg, L., Ed.; Sharpe ME: Armonk, NY, USA, 1991; pp. 134–151. ISBN 0-87332-528-2. [Google Scholar]
- Sen, A.; Foster, J.A. On Economic Inequality; Clarendon Press: Oxford, UK, 1973; pp. 131–143. ISBN1 13: 978-0198281931. ISBN2 10: 0198281935. [Google Scholar]
- Kendall, M.; Stuart, A.; Ord, J.K.; O’Hagan, A. Kendall’s Advanced Theory of Statistics, Volume 1, Distribution Theory, 6th ed.; Arnold, E., Ed.; Halsted Press: New York, NY, USA, 1994; pp. 39–73. ISBN 978-0-470-66530-5. [Google Scholar]
- Rogerson, P.A. The Gini coefficient of inequality: A new interpretation. Lett. Spat. Resour. Sci. 2013, 6, 109–120. [Google Scholar] [CrossRef]
- Lorenz, M.O. Methods of measuring the concentration of wealth. Publ. Am. Stat. Assoc. 1905, 9, 209–219. [Google Scholar] [CrossRef]
- Isaic-Maniu, A.; Mitruţ, C.; Voineagu, V. Statistica, 2nd ed.; Editura Universitară: Bucharest, Romania, 2003; pp. 189–190. ISBN 973-8499-88-7. [Google Scholar]
- Ayyagari, M.; Beck, T.; Demirguc-Kunt, A. Small and medium enterprises across the globe. Small Bus. Econ. 2007, 29, 415–434. [Google Scholar] [CrossRef]
- Nicolescu, O.; Isaic-Maniu, A.; Nicolescu, C.; Isaic-Maniu, I.; Anghel, F. Carta Alba a IMM-urilor din Romania; Olimp: Bucharest, Romania, 2007; ISBN 978-9731-806068. [Google Scholar]
- Nicolescu, O.; Isaic-Maniu, A.; Isaic-Maniu, I.; Nicolescu, C.; Anghel, F. Carta Alba a IMM-urilor din Romania; Olimp: Bucharest, Romania, 2008. [Google Scholar]
- Country Report Romania 2017, European Comission, Brussels, 22.2.2017 SWD (2017) 88 Final. Available online: https://ec.europa.eu/info/sites/info/files/2017-european-semester-country-report-romania-en.pdf (accessed on 15 August 2018).
- Caiete de studii No. 48, National Bank of Romania, Lazea, V.; August 2017. Available online: http://www.bnr.ro/Caiete-de-studii-484.aspx (accessed on 15 August 2018).
- Raport asupra Stabilităţii Financiare, National Bank of Romania; Year 2, No. III; May 2017. Available online: http://www.bnr.ro/Publicatii-periodice-204.aspx?pid=204 (accessed on 15 August 2018).
- Raport asupra Stabilităţii Financiare, National Bank of Romania, No. XV (1/2018); June 2018. Available online: http://www.bnr.ro/Publicatii-periodice-204.aspx?pid=204 (accessed on 15 August 2018).
- Avdalović, S.M. Impact of firm specific factors on profitability of industrial grinding companies. Econ. Agric. 2018, 65, 493–501. [Google Scholar]
- Negrescu, A. Being a Business Owner in Romania. The Increasing Consumer Spending Determines More and More Entrepreneurs to Start Businesses with Trade-Related Scopes of Activity; a KeysFin’s Barometer, November 2017. Available online: http://www.keysfin.com/EN/#!/Pages/News/NewsDetails&title=patron-in-romania-cresterea-consumului-determina-tot-mai-multi-romani-sa-deschida-afaceri-in-comert (accessed on 25 August 2018).
- Van Praag, C.M. Successful Entrepreneurship: Confronting Economic Theory with Empirical Evidence; Edward Elgar: London, UK, 2005; pp. 154–172. ISBN 978-1-84376-161-0. [Google Scholar]
- Bygrave, W.; Minniti, M. The social dynamics of entrepreneurship. Entrep. Theory Pract. 2000, 24, 25–36. [Google Scholar] [CrossRef]
- Wennekers, S.; Van Stel, A.; Carree, M.; Thurik, R. The relationship between entrepreneurship and economic development: Is it U-shaped? Found. Trends® Entrep. 2010, 6, 167–237. [Google Scholar] [CrossRef]
- Pecican, E.Ş. Econometria Pentru... Economişti: Econometrie-Teorie şi Aplicaţii; Editura Economică: Bucharest, Romania, 2007. [Google Scholar]
- World Bank. Doing Business în Uniunea Europeană 2017: Bulgaria, România șiUngaria; World Bank: Washington, DC, USA, 2017; pp. 4–18. Available online: http://www.doingbusiness.org/content/dam/doingBusiness/media/Subnational-Reports/DB17-EU-Overview-RO.pdf (accessed on 12 September 2018).
Figure 1.
Map of development regions in Romania. Source: Adapted by the authors, based on data retrieved from The Romanian National Institute of Statistics.
Figure 1.
Map of development regions in Romania. Source: Adapted by the authors, based on data retrieved from The Romanian National Institute of Statistics.

Figure 2.
The emplacement of the development regions in the plane of the two considered variables. Source: Authors computations, based on data retrieved from The Romanian National Institute of Statistics.
Figure 2.
The emplacement of the development regions in the plane of the two considered variables. Source: Authors computations, based on data retrieved from The Romanian National Institute of Statistics.

Figure 3.
Evolution of the number of active enterprises in Romania (1997–2016). Source: Authors computations, based on data retrieved from The Romanian National Institute of Statistics.
Figure 3.
Evolution of the number of active enterprises in Romania (1997–2016). Source: Authors computations, based on data retrieved from The Romanian National Institute of Statistics.

Figure 4.
Evolution of the situation of newly created enterprises after the first year from—percentage distribution. Source: Authors computations, based on data retrieved from The Romanian National Institute of Statistics.
Figure 4.
Evolution of the situation of newly created enterprises after the first year from—percentage distribution. Source: Authors computations, based on data retrieved from The Romanian National Institute of Statistics.

Figure 5.
Birth rates for newly created enterprises and GDP per inhabitant—distribution by development regions. (a) Year 2007, (b) Year 2016. Source: Authors computations, based on data retrieved from The Romanian National Institute of Statistics.
Figure 5.
Birth rates for newly created enterprises and GDP per inhabitant—distribution by development regions. (a) Year 2007, (b) Year 2016. Source: Authors computations, based on data retrieved from The Romanian National Institute of Statistics.

Figure 6.
The situation of the firms after the first year of activity in 2007—percentage distribution by regions. Source: Authors computations, based on data retrieved from The Romanian National Institute of Statistics.
Figure 6.
The situation of the firms after the first year of activity in 2007—percentage distribution by regions. Source: Authors computations, based on data retrieved from The Romanian National Institute of Statistics.

Figure 7.
The state of the firms after the first year of activity in 2016—percentage distribution by regions. Source: Authors computations, based on data retrieved from The Romanian National Institute of Statistics.
Figure 7.
The state of the firms after the first year of activity in 2016—percentage distribution by regions. Source: Authors computations, based on data retrieved from The Romanian National Institute of Statistics.

Figure 8.
Concentration of the active firms in the first year of activity—distribution by regions. (a) 2007, (b) 2016.
Figure 8.
Concentration of the active firms in the first year of activity—distribution by regions. (a) 2007, (b) 2016.

Figure 9.
The concentration of the inactive firms in the first year of activity—distribution by regions. (a) 2007, (b) 2016.
Figure 9.
The concentration of the inactive firms in the first year of activity—distribution by regions. (a) 2007, (b) 2016.

Figure 10.
The concentration of the dissolved firms in the first year of activity—distribution by regions. (a) 2007, (b) 2016. Source: Authors computations, based on data retrieved from The Romanian National Institute of Statistics.
Figure 10.
The concentration of the dissolved firms in the first year of activity—distribution by regions. (a) 2007, (b) 2016. Source: Authors computations, based on data retrieved from The Romanian National Institute of Statistics.

Table 1.
Eight development regions and their county members in Romania
| Development Region | Counties |
|---|---|
| North-East Region | Bacau (BC), Botosani (BT), Iaşi (IS), Neamt (NT), Suceava (SV), Vaslui (VS) |
| South-East Region | Braila (BR), Buzau (BZ), Constanta (CT), Galati (GL) Vrancea (VR), Tulcea (TL) |
| South-Muntenia Region | Arges (AG), Calarasi (CL), Dambovita (DB), Giurgiu (GR), Ialomita (IL), Prahova (PH), Teleorman (TR) |
| South-West Oltenia Region | Dolj (DJ), Gorj (GJ), Mehedinti (MH), Olt (OT), Valcea (VL) |
| West Region | Arad (AR), Caras–Severin (CS), Hunedoara (HD), Timis (TM) |
| North-West Region | Bihor (BH), Bistrita-Nasaud (BN), Cluj (CJ), Sălaj (SJ), Satu–Mare (SM), Maramures (MM) |
| Center Region | Alba (AB), Brasov (BV), Covasna (CV), Harghita (HR), Mures (MS), Sibiu (SB) |
| Bucharest–Ilfov Region | Bucuresti (B) and Ilfov (IF) |
Table 2.
Variation coefficients, by development regions (percentage)
| Category of Enterprises | 2007 | 2016 | |
|---|---|---|---|
| Year | |||
| Active | 24.50 | 31.53 | |
| Inactive | 25.48 | 39.48 | |
| Dissolved | 53.53 | 79.03 | |
Source: Authors computations, based on data retrieved from The Romanian National Institute of Statistics.
Table 3.
Values of Gini coefficient (2007, 2016)
| Year | 2007 | 2016 | ||||
|---|---|---|---|---|---|---|
| Status of newly created active enterprises after the first year from creation | Active | Inactive | Dissolved | Active | Inactive | Dissolved |
| Gini coefficient | 0.13500473 | 0.14399988 | 0.296442486 | 0.161710707 | 0.211342085 | 0.343640105 |
Source: Authors computations, based on data retrieved from The Romanian National Institute of Statistics.
© 2018 by the authors. Licensee MDPI, Basel, Switzerland. This article is an open access article distributed under the terms and conditions of the Creative Commons Attribution (CC BY) license (http://creativecommons.org/licenses/by/4.0/).
Share and Cite
MDPI and ACS Style
Nica, E.; Sima, V.; Gheorghe, I.; Drugau-Constantin, A.; Mirica, C.O. Analysis of Regional Disparities in Romania from an Entrepreneurial Perspective. Sustainability 2018, 10, 3450. https://doi.org/10.3390/su10103450
AMA Style
Nica E, Sima V, Gheorghe I, Drugau-Constantin A, Mirica CO. Analysis of Regional Disparities in Romania from an Entrepreneurial Perspective. Sustainability. 2018; 10(10):3450. https://doi.org/10.3390/su10103450
Chicago/Turabian StyleNica, Elvira, Violeta Sima, Ileana Gheorghe, Andreea Drugau-Constantin, and Catalina Oana Mirica (Dumitrescu). 2018. "Analysis of Regional Disparities in Romania from an Entrepreneurial Perspective" Sustainability 10, no. 10: 3450. https://doi.org/10.3390/su10103450
Note that from the first issue of 2016, this journal uses article numbers instead of page numbers. See further details here.