Agricultural Drought Risk Evaluation Based on an Optimized Comprehensive Index System


1
Institute of Management Science, Hohai University, Nanjing 210098, China
2
State Key Laboratory of Hydrology-Water Resources and Hydraulic Engineering, Hohai University, Nanjing 210098, China
*
Author to whom correspondence should be addressed.
Sustainability 2018, 10(10), 3465; https://doi.org/10.3390/su10103465
Submission received: 20 July 2018
/
Revised: 20 September 2018
/
Accepted: 25 September 2018
/
Published: 28 September 2018
(This article belongs to the Special Issue Conflict Analysis and Sustainable Management of Water Resources)
Abstract
:In this study, a new optimized comprehensive drought index system (OCDIS) was developed based on pressure-state-response (PSR) and random forest (RF). Then the pressure, state, response, and integrated agricultural drought risk were evaluated according to the synthetic-weight variable fuzzy set (SW-VFS) model. Finally, the countermeasures in terms of pressure, state, and response were discussed. The proposed index has been implemented in Qujing, Yunnan Province, China. The results showed that of the 10 indices included in the OCDIS, the four most important indices for agricultural drought risk management are reservoir storage capacity, precipitation anomaly percentage, soil moisture, and per capita annual income. The pressure risk and response risk of Malong are relatively higher than other counties. The integrated results indicated that most counties of Quijng have moderate drought risk. The assessment results are consistent with the actual situation of Qujing. The proposed model provides a scientific and objective way to develop the risk index system of agricultural drought. This study can potentially assist government agencies with information on the most important drought impacts and provide the basis for science-informed decision-making.
1. Introduction
Drought is a water shortage phenomenon that affects agricultural production, food safety, social stability, and ecological harmony [1,2]. China is one of the countries most affected by droughts. According to a bulletin from the Chinese government, from 1956 to 2016, the annual average drought-affected area was more than 200,000 km2; the annual average economic loss related to drought was over tens of billions of dollars [3]. With the intensification of global climate change, development of society and economy, and rapid increase of population, the demand for water resources has been continuously increasing over the past years. Hence, the assessment of drought is important for the sustainable development of water resources and the management of grain safety [4]. The grain safety refers to the sufficient, stable food supply, and people can obtain food according to their demands [5]. Drought leads to fluctuations in food production and supply, and then resulting in regional grain safety problem. The study area is one of the most critical crop-producing regions in Yunnan province. From 2009 to 2012, it suffered the most severe drought, which affected more than 4000 km2 of farmland and caused more than 400 million dollars of economic loss [6]. Therefore, drought research in this area is vital to reduce loss and to improve drought relief ability.
Several drought indices have been developed to assess the risk of drought, such as precipitation anomaly percentage, Palmer drought severity index (PDSI) [7], crop moisture index (CMI) [8], standardized precipitation index (SPI) [9], standardized precipitation evapotranspiration index (SPEI) [10], Z-index [11], etc. The PDSI, relying on multi-source data (precipitation, temperature, soil moisture, and evapotranspiration), is one of the most commonly used indices for the severity and extent of drought disasters [12]. However, the calculation of PDSI requires a large number of parameters, and the accuracy of the index is limited in extreme climate conditions [13,14]. The SPI, which is based on historical precipitation data, is another widely used index [15]. It allows drought risk assessment at multi-time scales from 1 month to 48 months, which better reflects the intensity and duration of droughts [8]. Based on SPI, Vicente-Serrano proposed the improved drought index SPEI. The SPEI takes precipitation and evapotranspiration into account, and has become one of the most useful indices for drought management [16].
It is noteworthy that many drought indices only reflect one aspect of drought phenomenon. This may not be sufficient for reliable drought risk assessment. Hence, it is essential to develop comprehensive indices that combine many drought-related parameters to improve evaluation results. Hao et al. [17] proposed a linearly combined drought index (LDI) based on the multivariate ensemble streamflow prediction (MESP). Keyantash et al. [18] developed an aggregate drought index (ADI), including precipitation, evapotranspiration, streamflow, and other physical forms of drought. In the constructed of ADI, the principal component analysis (PCA) was used to aggregate all physical variables of drought into a single time series. Kim et al. [19] applied a Bayesian network to establish a composite drought index, which included SPI, standardized runoff index, and normalized storage volume index. Based on the entropy theory, Rajsekhar et al. [20] developed a multivariate drought index (MDI), which contained precipitation, runoff, evapotranspiration, and soil moisture; Zhu et al. also [21] proposed a hybrid drought index in accordance with entropy. The linear combination, PCA, Bayesian, and the entropy method all assume a linear relationship among drought factors. Therefore, the copulas function has been applied to analyze the drought phenomenon by analyzing the nonlinear relationship between multiple variables [22]. Hao et al. [23] proposed a multivariate standardized drought index (MSDI) using the concept of copulas. The MSDI can forecast the drought disaster as early as SPI and can describe the persistence of drought disaster according to the joint state of both precipitation and soil moisture. Yang et al. [24] also constructed a nonlinear multivariate drought index (NMDI) using copulas. However, copulas highly rely on the assumption that the samples obey a given probability density [25]. With the development of artificial intelligence (AI), the AI algorithms, such as support vector machine (SVM), decision trees (DT), and artificial neural network (ANN) have been widely used [26,27,28]. They can better resolve the non-linearity problems, but, still, have some weakness. For example, the SVM is difficult to resolve the multi-classification problems. The DT is sensitive to missing data and is prone to over-fitting. The ANN is easy to fall into local optimization. Importantly, the contribution of each variable to the total drought risk cannot be effectively estimated by these methods.
The random forest (RF) model proposed by Breiman, is a data-driven model that has many benefits [29]. For example, it is not easy to fall into over-fitting, can handle missing data well, and is capable of measuring the importance of each variable to the total drought risk. The RF model has been extensively used in biomedical [30], environmental science [31], economic management [32], and other fields. These studies prove that random forest can reduce data dimension effectively. The purpose of this study is to construct an optimized comprehensive drought index system (OCDIS) from a number of input variables based on the random forest model. The input variables are determined by the PSR (pressure-state-response) model. The PSR is a cyclical model that is based on the interaction of human and eco-system factors [33]. In this model, climate change and human activities put pressure on the environment and natural resources. Then the state of the environment that results from the pressure prompts humans to take decision or actions to reduce the adverse impact. The response is the actions taken by society. The PSR model answers “what”, “why”, and “how”, the three basic issues of sustainable development. It has been widely used for evaluation of ecological systems and assessment of land quality [34]. Therefore, the input variables of the RF model determined by PSR have comprehensive and systematic characteristics which include natural resource, ecological environment, and social economy. In this study, the input variables of the RF model are named as the original index system of drought risk assessment. The “optimized” originates from the concept of “survival of the fittest” in biology. In the OCDIS, it refers to the indices that are selected based on the contribution to the results. The unimportant indices will be discarded. Hence, the index system constructed in this study is named as optimized comprehensive drought index system. Based on the above knowledge, constructing the OCDIS by combining PSR with RF is an effective solution for drought risk assessment. However, few studies have been conducted in this field. Hence, the focus of this study is to evaluate agricultural drought risk based on the OCDIS.
Drought risk is the probability of drought event and the comprehensive measurement results of adverse effects. It can be expressed as “risk probabilistic” or “risk degree” [1]. Drought is a fuzzy phenomenon, and the assessment of drought risk has the characteristics of fuzziness, randomness, and uncertainness. The variable fuzzy set (VFS) which can describe vague phenomena was used in this study to assess the agricultural drought risk. Considering the difference between data and the contribution of each data to the results, synthetic-weight based on entropy and random forest was developed to determine the weight of VFS, and establish the synthetic-weight variable fuzzy set (SW-VFS) model. Then the pressure, state, response, and comprehensive risk can be calculated based on the SW-VFS model. The motivation of the paper is to construct an optimized comprehensive drought index system (OCDIS); then focus on the established index system and synthetic-weight variable fuzzy set (SW-VFS) model to evaluate the agricultural drought risk (ADR); and finally, analyze the ADR of Qujing.
2. Study Area
Qujing (Figure 1) is in the east of Yunnan province. It covers an area of , with Guizhou province and Guanxi Zhuang Autonomous Region in the east, Wenshan and Honghe in the south, Kunming in the west, and Zhaotong in the north. The city is administratively divided into nine counties, including Qilin, Malong, Luliang, Shizong, Luoping, Fuyuan, Zhanyi, Huize, and Xuanwei. Qujing is the primary grain-producing area in Yunnan province. The annual grain output accounts for more than 14% of the province’s total grain output [35]. Hence, Qujing is known as the “Granary of Eastern Yunnan”. The regional climate of Qujing is dominated by subtropical plateau monsoon climate. The annual average precipitation is approximately 1000 mm, and the mean annual temperature is around 14.5 °C. The precipitation from May to October accounts for more than 80% of the annual precipitation [6]. Recently global climate change, the destruction of the environment, and the uneven spatiotemporal distribution of precipitation have made this city prone to drought. From 1960 to 2009, for almost 30% of the time different levels of drought disasters occurred; from 2009 to 2012, Qujing was affected by the most severe drought, affecting more than 3,000,000 people, with more than 900,000 people having difficulty with drinking water [6]. In recent years, with the development of economy and population, water demand is increasing year by year. The conflict between water supply and water demand, results in frequent drought disasters. Thus, it is essential to assess the agricultural drought risk for the sustainable development of water resource and grain safety.
3. Data and Methods
3.1. Data Sources
The meteorological data (e.g., the precipitation, temperature, soil moisture) were collected from “Meteorological Bureau of Qujing” and “National Meteorological Information Center” (http://data.cma.cn/data/cdcdetail/dataCode/A.0029.0005.html). The water resource data was gathered from “Yunnan Bureau of Hydrology and Water Resources” (http://www.ynswj.gov.cn/news_list.aspx?category_id=142). The socio-economic data, like population, gross domestic production (GDP), agricultural output, and per capita annual income were collected from the statistical yearbooks of Qujing [36]. The cultivated land, grain yield, reservoir storage, sown area, water infrastructure investment, and irrigation area were collected from water conservancy statistical yearbooks of Yunnan [37]. The drought relief expenditure and the drought relief capacity were provided by the Qujing Flood Control and Drought Relief Headquarters. In the collection of data set, the data were checked by the boxplot of SPSS. Then, the suspicious and erroneous data were corrected manually.
3.2. Random Forest
Random forest (RF) is a combination classification method proposed by Breiman. An RF is an ensemble of tree-structured classifiers , where is the independent, identically distributed random vector; is an unpruned tree constructed by CART (Classification and Regression Tree); each casts a unit vote for the most popular class [38]. Suppose the length of the training data is , the number of variables is , then the principle of RF is summarized as follows:
- (1)
- Select a bootstrap sample of size from the training data.
- (2)
- For each bootstrap sample, grow a maximum tree with no further splits. Randomly select () variables out of at each node of the tree; then choose the best split on these variables. The value of is constant during the growth of the forest.
- (3)
- Repeat the above steps until the ensemble of trees is grown up.
- (4)
- Build forest by the grown trees. Each tree casts a unit vote for the most popular class; then the optimal results are obtained. For the classification problem, the decision function is as follows:where is indicator function, is the prediction object, is the number of trees. Then the probability of sample belongs to is as follows:
Suppose the length of training data is , the proximity function is , the average proximity between the case and other cases in class is , the number of cases belongs to the class is , the raw outlier measure for is , then the final outlier measure is as follows:
where and are the median and standard deviation of each raw outlier measure, respectively.
The RF model can measure the importance of variables to help the deciders to identify critical factors in the evaluation problem. It provides two different importance measurement methods: Mean decrease in accuracy (MDA) and mean decrease in GINI (MDG) [39]. MDA measures the importance of variables by calculating the change in prediction accuracy. Usually, the larger the value of the score, the higher the importance of the variable. MDG calculates the average decreases in GINI impurity due to a given variable (when this variable is adopted to construct a split). The larger the average value, the higher the importance of the variable. Generally, the results of MDG are consistent with MDA, but MDG is more robust [40]. Thus, this study adopts MDG to measure the importance of ADR indices. The importance of each index to the total drought risk can be measured by the following equation:
where , , and are the number of indices, classification trees, and nodes, respectively. is the GINI decrease value of the node in the tree that belongs to the index.
3.3. Variable Fuzzy Set
Suppose is a fuzzy concept of the natural events, such as precipitation or temperature. is an element of , denoting the research object. and are attractability of and repellency of , respectively. is the relative membership degree (RMD) of , and is the RMD of . They satisfy , and ranges from 0 to 1 [41].
Let , . For any element , is defined as the variable fuzzy sets (VFS). Suppose and are the attracting sets and respelling sets of , respectively. The point of satisfies . is a random point in the interval . If lies at the left side of , can be calculated as follows:
If lies at the right side of , can be calculated as follows:
In which , usually we set .
Suppose is the sample set of ADR assessment, is the index eigenvalue of the sample , where is the number of the sample set, is the number of indices. Assume the drought grades is , then the RMD , and the non-normalized integrated RMD can be calculated as below,
where , . is the optimal rule parameter, is the distance parameter. is the weight of index. Usually, it is determined by the experts’ evaluation method or the entropy method. In this study, a synthetic-weight is proposed based on information entropy theory and random forest.
Information entropy, the concept of measuring the information produced by data, can reflect the difference between data. It determines the weight of indices based on the carried information. Generally, the more difference between data, the more information produced, and the larger weight of the index. Random forest measures the weight of index depending on the contribution to the results. The greater contribution to the results, the larger the weight of the index. Considering the difference between data and the contribution to the results, this study developed a synthetic weight based on entropy and random forest (see Equation (10)).
where is the weight determined by entropy. is the weight decided by random forest. is the combined weight determined by entropy and random forest. is the coefficient, which ranges from 0 to 1. Considering the difference between data and the contribution to the results, this study sets .
The normalized integrated RMD and the grade characteristic value can be calculated as follows:
where is the normalized RMD degree matrix. Finally, based on the rounding-off method, the corresponding risk levels of agricultural drought can be calculated.
3.4. Drought Risk Assessment Based on OCDIS and SW-VFS
Based on the PSR model, the original index system which includes human actions, environment, and other social-economy factors were established. Then, referring to the concept of “survival of the fittest” in biology, random forest was adopted to measure the importance of each index, and to establish the optimized comprehensive drought index system (OCDIS). Finally, synthetic-weight variable fuzzy set (SW-VFS) model was proposed to assess the drought risk based on OCDIS. The main steps of ADR assessment based on OCDIS and SW-VFS are as follows:
- (1)
- Establish the original index system based on the PSR model.
- (2)
- Preprocess the data and visualize them.
- (3)
- Optimize the parameters of random forest.
- (4)
- Measure the importance of indices and establish the OCDIS based on random forest model.
- (5)
- Optimize the weight of variable fuzzy set model and propose the SW-VFS model.
- (6)
- Calculate the pressure, state, response, and integrated risk of agricultural drought based on SW-VFS model and OCDIS.
The flow of agricultural drought risk based on OCDIS and SW-VFS was shown in Figure 2.
4. Results and Analysis
4.1. Establishment of Original Index System
Drought is a fuzzy phenomenon affected by various factors. The drought index is critically important for agricultural drought risk (ADR) assessment. The scientific index system can describe the frequency, severity, duration, and extent of droughts accurately. The PSR model is a cyclical model that can express the relationship between social, economy, and ecosystem scientifically. The model divides the drought indices into pressure, state, and response of three subsystems. The pressure subsystem represents the source of risk, which can reflect the pressure caused by climate change and human activities. It includes the abnormal precipitation, low soil moisture, high temperature, etc. The state subsystem describes the state or trend of the ecosystem under various pressure. The response subsystem contains the countermeasures or changes taken by humans or the ecosystem under various pressures and states. It includes drought relief expenditure, drought resistance planning, irrigation facilities, etc. Based on the PSR model and field investigation, this study develops the original ADR index system in terms of pressure, state, and response of the three subsystems (see Table 1).
According to the characteristics of each evaluation index, annual average temperature X3, agricultural population density X4, agricultural output value proportion X5, drought rate X9, and sown area ratio X11 are positive indices, of which the larger of the values, the higher of the drought risk; the soil moisture X1, precipitation anomaly percentage X2, per capita annual income X6, gain yield per mu X7, per capita water resources X8, irrigation rate of cultivated land X10, irrigation facilities ratio X12, drought relief expenditure rate X13, disaster relief capacity X14, and reservoir storage capacity X15 are negative indices, of which the larger the values, the lower the drought risk.
Among the indices, some originate from raw data of statistical materials; some are generated based on the calculation of raw data. For example, the precipitation data is collected from “Meteorological Bureau of Qujing”. The precipitation anomaly percentage is calculated based on the precipitation. The irrigation facilities ratio is determined by the area of electromechanical drainage and the area of cultivated land, which are gathered from “Water Conservancy Statistics Yearbook of Yunnan”. The data of reservoir storage capacity is also gathered from “Water Conservancy Statistics Yearbook of Yunnan”. The drought relief expenditure and the disaster relief capacity are provided by the Qujing Flood Control and Drought Relief Headquarters.
4.2. Data Collection and Preprocess
Data selection is the first step for drought risk assessment. Qujing is vulnerable to drought due to seasonal precipitation. It has suffered various levels of droughts (e.g., slight drought, moderate drought, serious drought, and extremely serious drought) from 2000 to 2014 [36]. Hence, this study chooses Qujing from 2000 to 2014 as the research object. For demonstration purposes, the data of Qilin was shown in pressure, state, and response, respectively (See Table 2, Table 3 and Table 4).
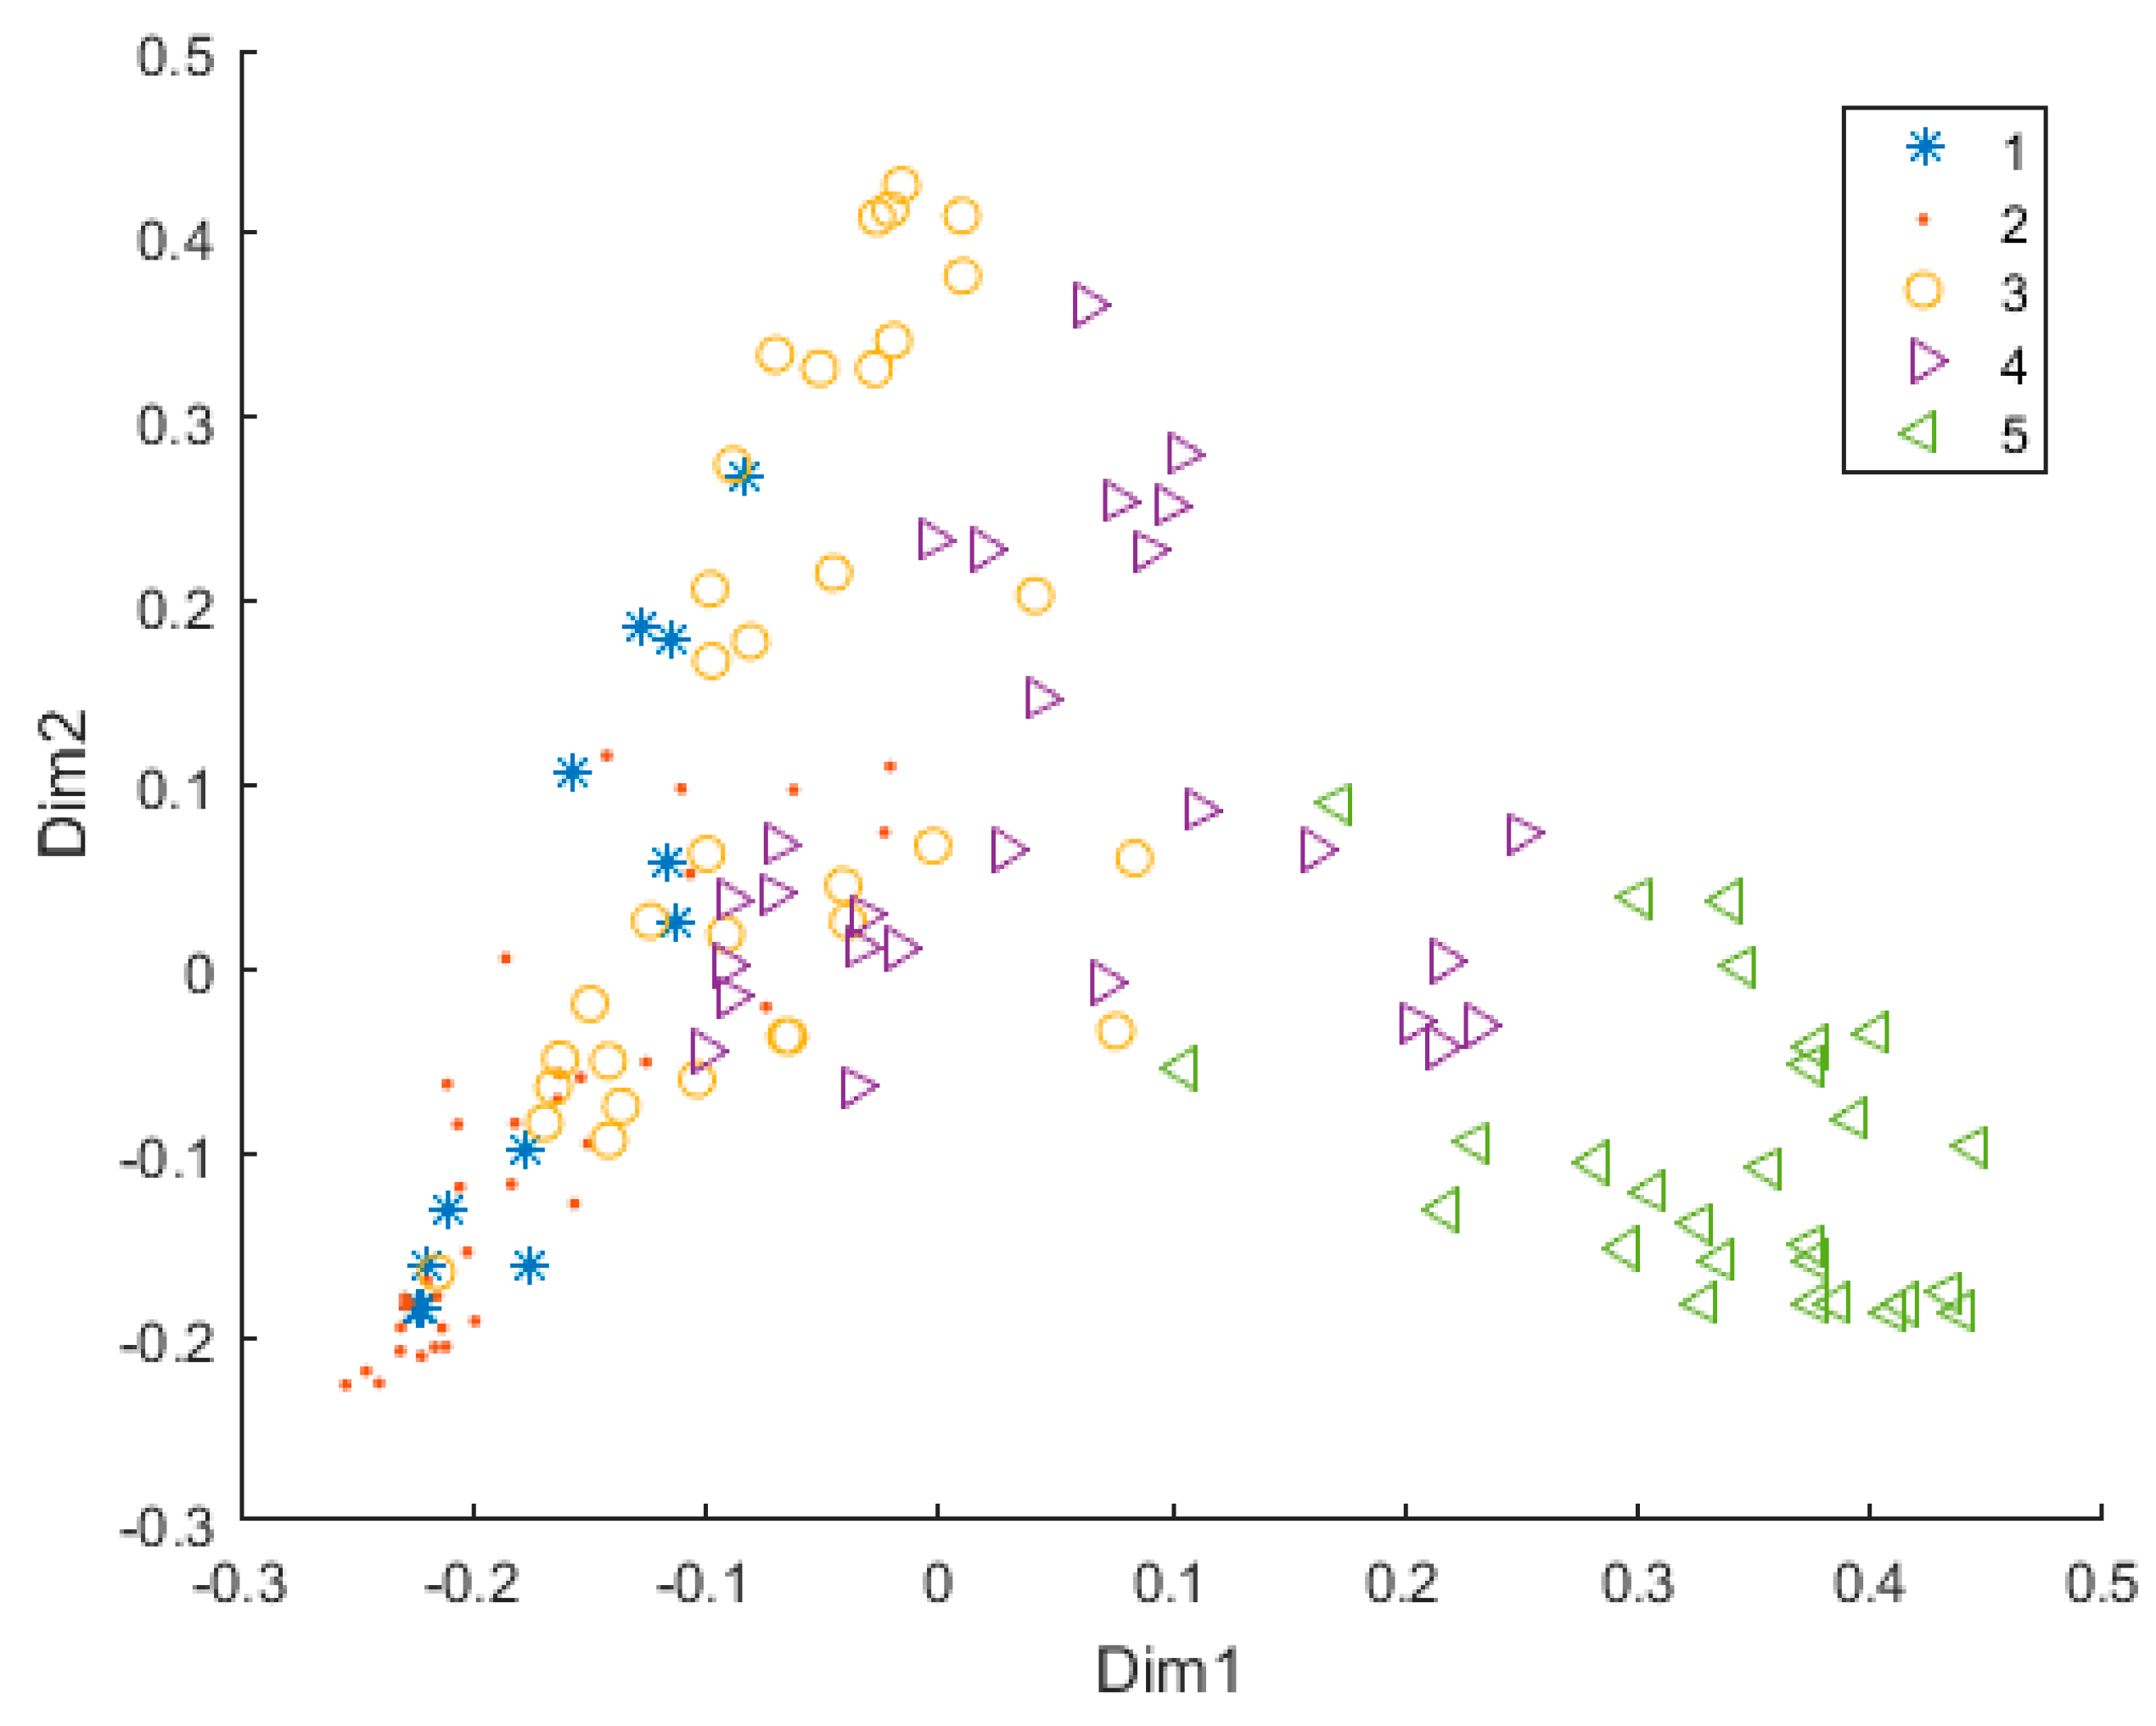
After data collection, it is important to preprocess data and eliminate the abnormal samples. An abnormal sample is distant from other observations. It may indicate an experimental, sampling error or a novelty. It should be understood why the novelty appeared. The error samples will be discarded or replaced with a statistic that is robust to the outlier. In this study, the random forest was adopted to identify abnormal samples. To have a direct understanding of samples, the proximity matrix projection diagram of Qujing from 2000 to 2014 was drawn (see Figure 3).
From Figure 3, the drought data is divided into five levels and relatively clustered in every level. It implies that the abnormal samples are small, i.e., the quality of data is relatively high. However, there are still some samples distant from the corresponding population. These samples may have some problems. In this study, we adopted the outlier measure degrees to identify the abnormal samples. The diagram of outlier measure degrees was shown in Figure 4.
In Figure 4, the X-axis means the serial number of samples and the Y-axis stands for the deviation value between the sample and the mean of the corresponding class. From Figure 4, the majority of the outlier measure degree is below four, i.e., the samples with the outlier degrees more than four have a lower proximity to the other samples in the corresponding class. In this study, those abnormal samples would be eliminated (the samples are Qilin of 2010 and Fuyuan of 2010, respectively). The proximity matrix projection matrix without those abnormal samples is shown in Figure 5.
4.3. Optimization of RF Parameters
There are two hyper-parameters need to optimize when using the RF model. They are the number of decision trees () and the number of chosen indices () when splitting a node. The default value of is 500 and the default value of is the square root of the number of indices [29]. Generally, the larger the number of , the higher the predictive accuracy. However, the return is diminishing once grows up to several hundred. To obtain the optimal value of , we set , and test the OOB (out of bag) errors under different (see Figure 6).
In Figure 6, the X-axis indicates the number of ; the Y-axis represents the value of OOB error. The diagrams show the trend of OOB error under different . From the diagrams, up to , the OOB error tends to stable, i.e., is the optimization value. is optimized by caret and cross-validation. Firstly, this study divided the training data into subsets randomly, then trained the subsets times to obtain evaluation values, and eventually averaged the evaluation values as the performance evaluation criterion. This study set , the repeat times .
4.4. Establishment of OCDIS
Measuring the importance of indices can help the decision makers gain insights into the importance of every index to the total drought risk. The RF model adopts MDA and MDG to measure the importance of indices. Generally, the larger value of MDA or MDG, the more important the index is. The results were shown in Figure 8.
In Figure 8, the X-axis means the value of MDA and MDG and the Y-axis is the name of indices. The higher value of MDA or MDG is, the more important of the index is. From Figure 8, the reservoir storage capacity X15, precipitation anomaly percentage X2, soil moisture X1, and per capita annual income X6 are the four most important indices among the fifteen risk indices. That means that these indices contribute more to the total drought risk. The agricultural population density X14, annual average temperature X3, and disaster relief capacity X14 are less consequential to the total drought risk. The results also show that there is a minor difference between MDG and MDA. However, MDG is more stable than MDA and has a faster calculation speed [40]. Thus, MDG was combined with AUC (area under the ROC curve) to establish the risk index system of OCDIS.
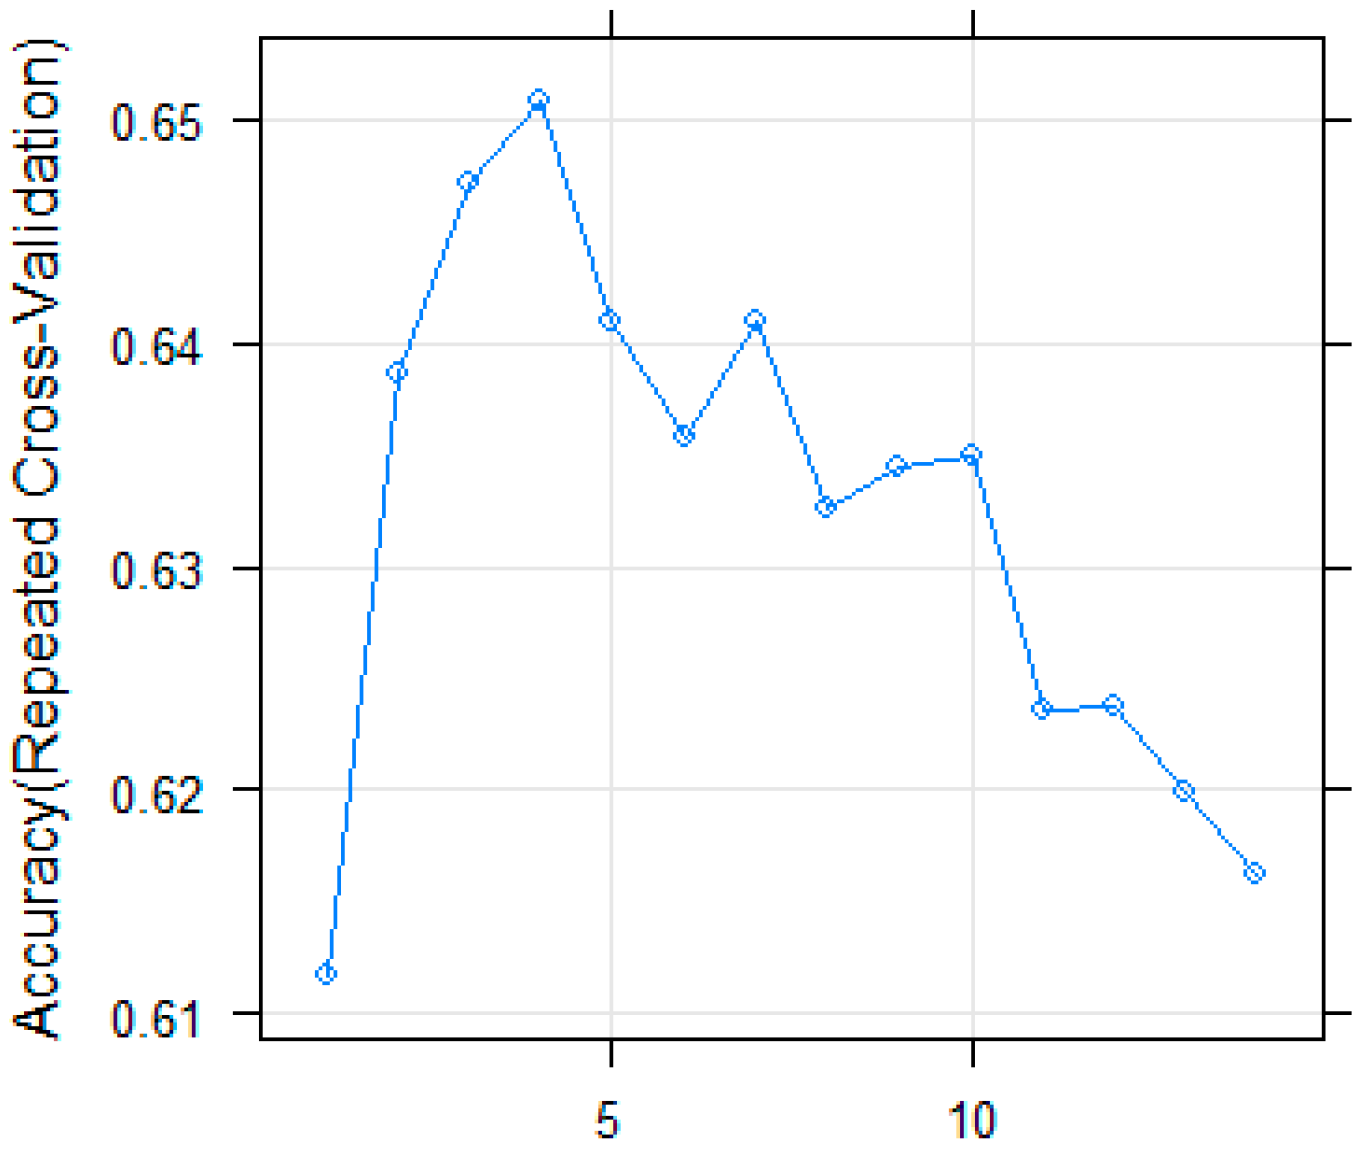
AUC evaluates the accuracy of the RF model by computing the OOB-AUC values under different numbers of variables. Firstly, the indices were sorted based on the MDG measurement results; secondly, a certain proportion of the indices were selected to calculate the OOB-AUC values; finally, the highest OOB-AUC value and the corresponding indices were obtained. In this study, we set and the repeat times . Figure 9 shows the relationship between OOB-AUC and the selected number of indices.
In Figure 9, the X-axis is the number of chosen indices; the Y-axis is an OOB-AUC error. Figure 9 shows the trend of OOB-AUC error under different numbers of indices. From Figure 9, the OOB-AUC has the highest values when the selection number of indices is ten. It means the accuracy assessment results can be obtained by adopting ten indices. The importance of each index to the total drought risk is shown in Figure 10.
In Figure 10, the X-axis is the name of indices and the Y-axis means the importance value of the corresponding index. From Figure 10, the importance of top 10 indices is over 5%, indicating they contribute significantly to drought risk. The total importance of top 10 indices is more than 80%, representing these indices play a decisive role in the final drought risk. Hence, we can assess the drought risk according to the top 10 indices. Thus, the optimized comprehensive drought index system (OCDIS) was developed, which includes soil moisture X1, precipitation anomaly percentage X2, agricultural output value proportion X5, per capita annual income X6, drought rate X9, irrigation rate of cultivated land X10, sown area ratio X11, irrigation facilities ratio X12, drought relief expenditure rate X13, and reservoir storage capacity X15.
4.5. Risk Assessment Based on SW-VFS and OCDIS
The ADR is divided into five grades, namely, lowest risk, lower risk, moderate risk, higher risk, and highest risk [42]. The ranges and grade standards of OCDIS are determined by the historical data of Qujing from 2000 to 2014. For example, the average annual income and drought relief expenditure are estimated by the society and economic development; the sown area and agricultural output are calculated based on the development of agriculture and the climate change.
Based on Table 5, the attracting set , the boundary set , and the point value set were obtained. The was determined by the upper and lower values of the adjoin intervals, respectively. The level I and V of were determined by the left side and right side of the corresponding level of , respectively. The other levels of were determined by the middle values of the corresponding level of . The weight of each index was determined by the synthetic-weight method. The weights are calculated as follows.
is the weight determined by entropy. is the weight decided by random forest. is the combined weight that was calculated by Equation (10). From Table 6, on the basis of the method, the weight of X11 is the largest, suggesting that the difference in X11 is larger than other indices. However, based on the results of , the weight of X11 is only 0.06, which indicates the contribution of X11 is small. Meanwhile, on the basis of , the weight of X15 is the largest, though it is only 0.10 based on the method. Thus, the weight, which considers the difference between data and the contributions to results is more reasonable.
Then, the normalized integrated relative membership degree, and the grade characteristic values were calculated according to Equations (11) and (12). The risk values of agricultural drought risk (ADR) were obtained according to the rounding-off method. Set the optimization parameters . The evaluation results have been achieved in terms of pressure, state, and response, respectively.
The abnormal precipitation, soil moisture, and agricultural economic proportion are the primary inducers of pressure risk. From Figure 11, Qilin and Fuyuan have lower pressure risk while Luliang and Malong have higher pressure risk. The pressure risk is around three in most counties, i.e., the integrated pressure risk of Qujing is moderate. Qujing is one of the major grain-producing cities in Yunnan province. The agricultural output proportion of many counties occupies more than 30% of the GDP. Agriculture is sensitive to precipitation and soil moisture. According to historical data, the soil moisture and precipitation anomaly percentage decrease obviously when drought disasters occur. In 2011’s extremely serious drought, the precipitation of many counties was lower than 30% of the normal level. The low precipitation and low soil moisture resulted in high pressure risk. The pressure risk made the state system abnormal, and then indirectly affected the actions taken by the response system. Recently, with the overexploitation of land resources, the soil water storage capacity decreased obviously. Thus, to reduce the pressure risk, the local government needs to formulate reasonable land use planning and pay attention to the proportion of ecological land. Meanwhile, promoting the development of service industry and advanced manufacturing industry will also reduce the pressure risk.
The state of ADR indicates the vulnerability of the ecosystem and the exposure of property. Generally, the higher the risk of state, the more losses caused when encountering droughts. From Figure 12, the state risk in most areas is lower than three, illustrating the state risk in Qujing is under control. However, the state risk of Xuanwei and Luliang are more than three, which indicate that the potential drought risk is relatively high in the two counties. According to statistical data, Luliang and Xuanwei have lower irrigation proportion and more than 15% of sown area ratio. That means the agricultural production in these two counties is highly reliant on precipitation. Once the precipitation is abnormal, the crop will be affected. The pressure risk and state risk of Luliang are more than three, representing the agricultural drought resistant ability of Luliang is relatively low. Though the per capita annual income increases year by year, the growth rate slows down during the drought-affected years. Meanwhile, affected by abnormal precipitation and lower soil moisture, the drought rate is increased in the drought-affected years. To reduce state risk, the local government can adopt water-saving measures and increase the drought prevention investment.
The response risk is determined by the investment of drought relief, irrigation facilities ratio, and reservoir storage capacity. From Figure 13, the response risk of Luoping is 1.27 times than Qilin. It indicates that Qilin has more effective measures to mitigate the agricultural drought risk than Luoping. In most counties, the response risk is more than three, indicating that the integrated response risk of Qujing is relatively high. According to statistical data, the irrigation facilities ratio in Huize, Fuyuan, Malong, and Luoping is smaller than other counties. In other words, if abnormal precipitation occurs, the irrigation of farmland in those counties will be affected. Although the reservoir storage capacity is over 75% in normal years, it decreases significantly in drought-affected years. For example, in 2011, the reservoir storage capacity was lower than 30% in most counties. The decrease of reservoir storage capacity results in the shortage of water resource and high response risk.
In conclusion, the agricultural drought risk is the comprehensive results of pressure, state, and response. The precipitation is one of the primary sources of water resource, which affects the soil moisture and water supply directly. The high agricultural output proportion and low drought relief investment result in high pressure risk and response risk. According to Figure 11, Figure 12 and Figure 13, the pressure risk and response risk of Malong are relatively higher than other counties. The pressure risk of Fuyuan is lower than other counties while the response risk is higher than other places. The pressure risk, state risk, and response risk of Xuanwei are around three, indicating it will have an increasing agricultural drought risk in the future if no countermeasures are taken.
To make the results more reliable and scientific, this paper changed the parameters and , and then averaged them as the assessment results. The integrated ADR assessment results of Qujing is shown in Table 7.
The risk values are the quantitative expression of the possible consequence of drought disasters during a period. According to the rounding-off method, in this study, we computed the risk levels based on the average values of different parameters combination. II and III in Table 7 represent the lower risk and moderate risk of agricultural drought, which corresponds to Table 5. From Table 7, the agricultural drought risk (ADR) of most areas in Quijng from 2000 to 2014 is moderate. That means Qujing is prone to drought. The integrated ADR in Qilin, Shizong, Zhanyi, and Fuyuan are low, while in Xuanwei, Luliang, Luoping, Malong, and Huize are high. Based on ArcGIS technology, the pressure, state, response, and integrated ADR zoning maps in Qujing are shown in Figure 14.
According to Figure 14, the pressure risk in the east-central, the state risk in Midwest and south, the response risk in Central, are lower than other regions, respectively. The integrated risk in most counties of Qujing is moderate, indicating Qujing is prone to drought. From the distribution, the pressure risk, response risk, and integrated risk of Qilin are lower than other regions. Therefore, the drought prevention and relief measures should have regional applicability. To the lower state risk, but high pressure and response risk areas, the decision makers need to pay more attention to abnormally high temperature and precipitation. It is better to increase the ratio of electromechanical drainage and irrigation, and improve the capacity of reservoir storage in these regions. Due to most places of Qujing experiencing moderate integrated drought level, the government needs to increase efforts for effective drought mitigation, like adjusting the crop-planting structure and improving irrigation and water-saving technology.
4.6. The Countermeasures of Drought Relief
According to the risk zoning maps, the integrated agricultural drought risk level in the most regions of Qujing is moderate. However, the risk levels in the three subsystems have regional characteristics. Therefore, each region should formulate drought prevention and resistance countermeasures according to the actual situation based on the analysis results of the three subsystems.
In the pressure aspect, the risk of many counties is moderate. The pressure risk mainly depends on soil moisture, precipitation, and agricultural output proportion. Generally, the low precipitation easily causes low soil moisture, then affects the growth of crop and results in high-pressure risk. Though the annual precipitation is sufficient in most area of Qujing, the temporal distribution is uneven, which resulting in seasonal drought. Therefore, it is essential to make full use of the wet season precipitation and improve the soil water storage capacity in the high-pressure risk regions. The agricultural output proportion of Malong, Luliang, and Zhanyi is above 30%, indicating that those counties are vulnerable to droughts. Therefore, to reduce the pressure risk, the local government need to formulate reasonable land use planning, pay attention to the proportion of crop-planting and ecological land, and promote the development of the service industry and advanced manufacture industry.
In the state aspect, although the pressure risk of Fuyuan and Qilin is low, the state risk for them is relatively high. The drought-resistant ability and the irrigation ratio are low in these two counties. The decision-makers need to improve the drought prevention and resistance capability to reduce the state risk. The state risk of Luliang and Xuanwei is more than three. According to historical data, the sown area ratios are more than 15%, but the irrigation proportions are relatively low in the two counties. Thus, it is essential to strengthen the research of irrigation management mechanism and encourage farmers to adopt advanced irrigation methods, such as drip irrigation, sprinkler irrigation, and so on. Meanwhile, planting drought-tolerant crops and raising the annual income of farmers through multiple channels will also reduce state risk.
In the response aspect, the risk in most counties is moderate, indicating the drought prevention and resistance investment is insufficient in most counties. According to the statistical data, the irrigation facilities ratios of Luoping, Fuyuan, and Huize are lower than 10%. The government agencies in those counties need to increase the investment in water conservancy infrastructure construction to reduce response risk. Meanwhile, adopting remote sensing, deep learning, and other technologies to monitor the dynamic situation of crops will help farmers change passive drought resistance to proactive drought management. The measures will also effetely reduce the total drought risk.
5. Conclusions
Agricultural drought risk (ADR) is affected by many factors, e.g., precipitation, soil moisture, and reservoir storage capacity. However, the contribution of each factor to the total drought risk is different. The random forest (RF) is a data-driven model that can measure the importance of each factor to the results. The pressure-state-response (PSR) model can reflect the relationship between various factors. Therefore, in this study, an optimized comprehensive index system (OCDIS) was developed based on PSR and RF models. The PSR model was adopted to construct the original index system of agricultural drought risk, i.e., the input variables of RF; the RF model was used to measure the importance of each index, and to develop the OCDIS. Due to the randomness, fuzziness, and uncertainty of agricultural drought risk assessment, the synthetic-weight variable fuzzy set (SW-VFS) model was proposed to assess the pressure, state, response, and integrated risk of agricultural drought based on OCDIS. The weight of SW-VFS model was determined by entropy and random forest. It can reflect the difference between data and the contribution of each index to the risk results.
The agricultural drought risk index system OCDIS and SW-VFS model were applied in Qujing.
The results showed that of the 10 indices included in the OCDIS, the four most important indices for agricultural drought risk management are reservoir storage capacity, precipitation anomaly percentage, soil moisture, and per capita annual income. Thus, the local government can take targeted measures to reduce agricultural drought risk. For example, increasing conservancy investment and establishing an agricultural irrigation system which includes large, medium, and small reservoirs to improve the reservoir storage capacity; protecting forests, vegetation, and wetlands to increase the water storage capacity of soil; formulating agricultural insurance and planting drought-tolerance crops to reduce agricultural drought risk and increase farmers’ income. Then, the SW-VFS model was adopted to assess the pressure, state, response, and integrated risk of agricultural drought in Qujing. According to the assessment results, the pressure risk and response risk of Malong are relatively higher than other places. Though the agricultural output accounts for a relatively high proportion of Malong’s economy, the drought prevention and relief facilities are inadequate. Thus, the local government agency needs to increase the investment in preventing drought risk. The pressure risk of Fuyuan is lower while the response risk is relatively higher than other counties. That is, the environment and ecology condition of Fuyuan is better than other counties. The integrated drought risk results indicated that most areas of Quijng are located in moderate drought risk regions, i.e., Qujing is prone to drought. Therefore, the Qujing government needs to increase the expenditure on water conservancy infrastructure construction. The risk assessment results can provide better decision support for the governments to increase drought relief ability and develop effective mitigation strategies.
Author Contributions
Conceptualization, J.C.; methodology, M.D.; formal analysis, J.C.; investigation, M.D.; data curation, J.H.; writing—original draft preparation, M.D.; writing—review and editing, J.C. and W.N.; funding acquisition, J.C.
Funding
This research was supported by the National Key R&D Program of China (Grant No. 2017YFC0404600), Humanities and Social Sciences Fund of Ministry of Education of China (Grant No. 18YJA630009), the State Key Program of National Nature Science Foundation of China (Grant No. 71433003), National Natural Science Foundation of China (Grant No. 41877526).
Conflicts of Interest
The authors declare no conflict of interest.
References
- Jin, J.L.; Song, Z.Z.; Cui, Y.; Zhou, Y.L.; Jiang, S.M.; He, J. Research progress on the key technologies of drought risk assessment and control. J. Hydraul. Eng. 2016, 47, 398–412. (In Chinese) [Google Scholar]
- Wang, Y.X.; Zhang, L. Impact of the 2011 Southern U.S. Drought on ground-level fine aerosol concentration in summertim. J. Atmos. Sci. 2015, 2015, 1075–1093. [Google Scholar] [CrossRef]
- State Flood Control and Drought Relief Headquarters; Ministry of Water Resources of China. Bulletin of Flood and Drought Disasters in China; China Water & Power Press: Beijing, China, 2016; 96p. (In Chinese)
- Sohrabi, M.M.; Ryu, J.H.; Abatzoglou, J.; Tracy, J. Development of soil moisture drought index to characterize droughts. J. Hydrol. Eng. 2015, 20, 04015025. [Google Scholar] [CrossRef]
- Zhang, G.C. Current situation and prospect of China grain safety. Popul. J. 2005, 3, 37–41. (In Chinese) [Google Scholar]
- Gong, Y.B.; Zhang, J.G.; Liu, G.F. Research on the drought characteristics in Qujing City base on the SPI and R/S analysis. Agric. Res. Arid Areas 2015, 33, 273–277. (In Chinese) [Google Scholar]
- Palmer, W.C. Meteorological Drought; US Department of Commerce Weather Bureau: Washington, DC, USA, 1965.
- Palmer, W.C. Keeping Track of Crop Moisture Conditions, Nationwide: The New Crop Moisture Index. Weatherwise 1968, 21, 156–161. [Google Scholar] [CrossRef]
- Mckee, T.B.; Doesken, N.J.; Kleist, J. The relationship of drought frequency and duration to time scales. In Proceedings of the 8th Conference on Applied Climatology, Anaheim, CA, USA, 17–22 January 1993; pp. 179–184. [Google Scholar]
- Vicente-Serrano, S.M.; Beguería, S.; López-Moreno, J.I. A multiscalar drought index sensitive to global warming: The standardized precipitation evapotranspiration index. J. Clim. 2010, 23, 1696–1718. [Google Scholar] [CrossRef]
- Cao, Y.Q.; Zhang, S.; Fan, S.B. Evolution analysis of spring drought events in Northwest Liaoning based on grade adjustment of Z-Index. Arid Land Geogr. 2017, 40, 10–16. (In Chinese) [Google Scholar]
- Xu, Y.; Wang, L.; Ross, K.W.; Liu, C.; Berry, K. Standardized soil moisture index for drought monitoring based on soil moisture active passive observations and 36 years of north American land data assimilation system data: A case study in the southeast United States. Remote. Sens. 2018, 10, 301. [Google Scholar] [CrossRef]
- Ma, M.; Ren, L.; Singh, V.P.; Tu, X.; Jiang, S.; Liu, Y. Evaluation and application of the SPDI-JDI for droughts in Texas, USA. J. Hydrol. 2015, 521, 34–45. [Google Scholar] [CrossRef]
- Esfahanian, E.; Nejadhashemi, A.P.; Abouali, M.; Adhikari, U.; Zhang, Z.; Daneshvar, F.; Herman, M.R. Development and evaluation of a comprehensive drought index. J. Environ. Manag. 2017, 185, 31–43. [Google Scholar] [CrossRef] [PubMed]
- Tsakiris, G. Drought risk assessment and management. Water Resour. Manag. 2017, 31, 3083–3095. [Google Scholar] [CrossRef]
- Soh, Y.W.; Koo, C.H.; Huang, Y.F.; Fung, K.F. Application of artificial intelligence models for the prediction of standardized precipitation evapotranspiration index (SPEI) at Langat River Basin, Malaysia. Comput. Electron. Agric. 2018, 144, 164–173. [Google Scholar] [CrossRef]
- Hao, Z.C.; Hao, F.H.; Singh, V.P. A general framework for multivariate multi-index drought prediction based on Multivariate Ensemble Streamflow Prediction (MESP). J. Hydrol. 2016, 539, 1–10. [Google Scholar] [CrossRef]
- Keyantash, J.A.; Dracup, J.A. An aggregate drought index: Assessing drought severity based on fluctuations in the hydrologic cycle and surface water storage. Water Resour. Res. 2004, 40, W09304. [Google Scholar] [CrossRef]
- Kim, S.; Parhi, P.; Jun, H.; Lee, J. Evaluation of Drought Severity with a Bayesian Network Analysis of Multiple Drought Indices. J. Water Res. Plan. Manag. 2017, 144, 05017016. [Google Scholar] [CrossRef]
- Rajsekhar, D.; Singh, V.P.; Mishra, A.K. Multivariate drought index: An information theory based approach for integrated drought assessment. J. Hydrol. 2015, 526, 164–182. [Google Scholar] [CrossRef]
- Zhu, J.; Zhou, L.; Huang, S. A hybrid drought index combining meteorological, hydrological, and agricultural information based on the entropy weight theory. Arab. J. Geosci. 2018, 11, 91. [Google Scholar] [CrossRef]
- Hao, Z.C.; Singh, V.P. Drought characterization from a multivariate perspective: A review. J. Hydrol. 2015, 527, 668–678. [Google Scholar] [CrossRef]
- Hao, Z.; AghaKouchak, A. Multivariate standardized drought index: A parametric multi-index model. Adv. Water Resour. 2013, 57, 12–18. [Google Scholar] [CrossRef]
- Yang, J.; Chang, J.X.; Wang, Y.M.; Li, Y.; Hu, H.; Chen, Y.; Huang, Q.; Yao, J. Comprehensive drought characteristics analysis based on a nonlinear multivariate drought index. J. Hydrol. 2018, 557, 651–667. [Google Scholar] [CrossRef]
- Huang, S.Z.; Chang, J.X.; Leng, G.Y.; Huang, Q. Integrated index for drought assessment based on variable fuzzy set theory: A case study in the Yellow River basin, China. J. Hydrol. 2015, 527, 608–618. [Google Scholar] [CrossRef] [Green Version]
- Mokhtarzad, M.; Eskandari, F.; Vanjani, N.; Arabasadi, A. Drought forecasting by ANN, ANFIS, and SVM and comparison of the models. Environ. Earth Sci. 2017, 76, 729. [Google Scholar] [CrossRef]
- Rezaeianzadeh, M.; Stein, A.; Cox, J.P. Drought forecasting using Markov chain model and artificial neural networks. Water. Resour. Manag. 2016, 30, 2245–2259. [Google Scholar] [CrossRef]
- Barua, S.; Perera, B.J.C.; Ng, A.W.M.; Tran, D. Drought forecasting using an aggregated drought index and artificial neural network. J. Water. Clim. Chang. 2010, 1, 193–206. [Google Scholar] [CrossRef]
- Breiman, L. Random forests. Mach. Learn. 2001, 45, 5–32. [Google Scholar] [CrossRef]
- Zhao, W.; Shi, F. A method for Lymph Node Segmentation with scaling features in a random forest model. Curr. Proteomics 2018, 15, 28–134. [Google Scholar] [CrossRef]
- Ouallouche, F.; Lazri, M.; Ameur, S. Improvement of rainfall estimation from MSG data using random forests classification and regression. Atmos. Res. 2018, 211, 62–72. [Google Scholar] [CrossRef]
- Ceh, M.; Kilibarda, M.; Lisec, A.; Bajat, B. Estimating the performance of random forest versus multiple regression for predicting prices of the apartments. ISPRS Int. J. Geo-Inf. 2018, 7, 68. [Google Scholar] [CrossRef]
- Rapport, D.J.; Singh, A. An ecohealth-based framework for state of environment reporting. Ecol. Indic. 2006, 6, 409–428. [Google Scholar] [CrossRef]
- Xie, X.F.; Lv, X.; Liu, R.; Mao, L.; Liu, X. Research on port ecological suitability evaluation index system and evaluation model. Front. Struct. Civ. Eng. 2015, 9, 65–70. [Google Scholar] [CrossRef]
- The Finance Department of Yunnan; The Finance Society of Yunnan. Yunnan Financial Yearbook; China Financial and Economic Publishing House: Beijing, China, 2009. (In Chinese) [Google Scholar]
- Qujing Statistic Department. Qujing Yearbook; Yunnan Publishing Group: Kunming, China, 2000–2014. (In Chinese) [Google Scholar]
- Yunnan Water Conservancy Department. Water Conservancy Statistics Yearbook of Yunnan; Yunnan Water Conservancy Department: Kunming, China, 2000–2014. (In Chinese)
- Wang, Z.L.; Lai, C.G.; Chen, X.H.; Yang, B.; Zhao, S.; Bai, X. Flood hazard risk assessment model based on random forest. J. Hydrol. 2015, 527, 1130–1141. [Google Scholar] [CrossRef]
- Verikas, A.; Gelzinis, A.; Bacauskiene, M. Mining data with random forests: A survey and results of new tests. Pattern Recognit. 2011, 44, 330–349. [Google Scholar] [CrossRef]
- Calle, M.L.; Urrea, V.; Boulesteix, A.L.; Malats, N. AUC-RF: A new strategy for genomic profiling with random forest. Hum. Hered. 2011, 72, 121–132. [Google Scholar] [CrossRef] [PubMed]
- Chen, S.Y.; Guo, Y. Variable fuzzy sets and its application in comprehensive risk evaluation for flood-control engineering system. Fuzzy Optim. Decis. Mak. 2006, 5, 153–162. [Google Scholar]
- Standardization Administration of China. Grades of Meteorological Drought; Standards Press of China: Beijing, China, 2006; pp. 1–28. (In Chinese) [Google Scholar]
Figure 1.
The geographic location of Qujing in Yunnan Province, China.

Figure 2.
The flow diagram of agricultural drought risk (ADR) assessment.

Figure 3.
Proximity matrix projection diagram of Qujing from 2000 to 2014.

Figure 4.
The diagnosis of abnormal samples.

Figure 5.
Proximity matrix projection diagram without abnormal samples.

Figure 6.
The out of bag (OOB) error of different ntree. (a) The OOB error of ntree = 100; (b) The OOB error of ntree = 300; (c) The OOB error of ntree = 500; (d) The OOB error of ntree = 1000.
Figure 6.
The out of bag (OOB) error of different ntree. (a) The OOB error of ntree = 100; (b) The OOB error of ntree = 300; (c) The OOB error of ntree = 500; (d) The OOB error of ntree = 1000.

Figure 7.
The best value of .

Figure 8.
The importance measure of indices based on mean decrease in accuracy (MDA) and MDG.

Figure 9.
OOB- area under the ROC curve (AUC) curve diagram.

Figure 10.
The importance of each index to the total drought risk.

Figure 11.
The pressure assessment of Qujing from 2000 to 2014.

Figure 12.
The state assessment of Qujing from 2000 to 2014.

Figure 13.
The response assessment of Qujing from 2000 to 2014.

Figure 14.
The pressure, state, response, and integrated drought risk zoning maps in Qujing.


Table 1.
Original index system of ADR assessment.
| Index | Meaning | |
|---|---|---|
| Pressure | soil moisture (%, X1) | It reflects the water content of the soil. |
| precipitation anomaly percentage (%, X2) | It reflects the degree of precipitation deviating from the average level. Suppose is the precipitation, is the mean annual precipitation, the value of X2 is calculated by . | |
| annual average temperature (°C, X3) | It means annual mean temperature. | |
| agricultural population density (person/km2, X4) | It is determined by the amount of agricultural population and the region area. | |
| agricultural output value proportion (%, X5) | It reflects the proportion of agriculture output in the gross domestic product (GDP). | |
| State | per capita annual income ($, X6) | It reflects the economic situation in rural areas, which obtained from the regional statistical yearbook. |
| grain yield per mu (kg/mu, X7) | It is determined by crop yields and sown area. | |
| per capita water resources (m3/person, X8) | It is equal to the gross amount of water resource divide by the amount of population. | |
| drought rate (%, X9) | The proportion of the drought area to sown area. | |
| irrigation rate of cultivated land (%, X10) | It is equal to irrigation area divided by cultivated land area. | |
| sown area ratio (%, X11) | The proportion of sown areas to region area. | |
| Response | irrigation facilities ratio (%, X12) | It reflects the electromechanical drainage and irrigation capability. It is the proportion of electromechanical drainage and irrigation area to the cultivated land area. |
| drought relief expenditure rate (%, X13) | The proportion of drought relief expenditure to the gross regional product. | |
| disaster relief capacity (X14) | It refers to the ability of response to drought, which is determined by the expert assessment, which ranges from 0 to 100. | |
| reservoir storage capacity (%, X15) | It reflects the abnormal degree of reservoir water storage. It is the proportion of reservoir storage capacity at the end of the year to annual average reservoir storage capacity. |
Table 2.
The data of the pressure subsystem.
| Year | Soil Moisture (%, X1) | Precipitation Anomaly Percentage (%, X2) | Annual Average Temperature (°C, X3) | Agricultural Population Density (person/km2, X4) | Agricultural Output Value Proportion (%, X5) |
|---|---|---|---|---|---|
| 2000 | 54.54 | −10.58 | 15.0 | 250.52 | 13.201 |
| 2001 | 73.15 | 30.18 | 15.2 | 253.54 | 12.46 |
| 2002 | 63.10 | 8.74 | 15.4 | 255.42 | 12.12 |
| 2003 | 53.45 | −13.47 | 15.8 | 261.28 | 11.45 |
| 2004 | 54.22 | −10.29 | 14.9 | 270.17 | 10.93 |
| 2005 | 53.53 | −7.53 | 15.7 | 270.43 | 10.39 |
| 2006 | 53.37 | −7.85 | 15.9 | 272.29 | 8.52 |
| 2007 | 68.17 | 19.19 | 15.1 | 275.00 | 8.52 |
| 2008 | 66.33 | 15.20 | 15.1 | 255.61 | 9.00 |
| 2009 | 48.36 | −22.19 | 16.0 | 190.08 | 8.66 |
| 2010 | 60.89 | 5.35 | 16.2 | 166.21 | 8.60 |
| 2011 | 50.35 | −40.49 | 15.1 | 166.21 | 8.08 |
| 2012 | 49.85 | −14.42 | 16.2 | 165.85 | 7.72 |
| 2013 | 55.73 | 2.76 | 15.8 | 183.20 | 7.44 |
| 2014 | 67.83 | −6.72 | 16.1 | 163.87 | 7.46 |
Table 3.
The data of the state subsystem.
| Year | Per Capita Annual Income ($, X6) | Grain Yield per mu (kg/mu, X7) | Per Capita Water Resources (m3/person, X8) | Drought Rate (%, X9) | Irrigation Rate of Cultivated Land (%, X10) | Sown Area Ratio (%, X11) |
|---|---|---|---|---|---|---|
| 2000 | 362.03 | 366.50 | 852.43 | 22.17 | 50.23 | 23.69 |
| 2001 | 377.03 | 382.63 | 860.01 | 29.45 | 51.71 | 23.30 |
| 2002 | 408.28 | 380.39 | 823.58 | 32.88 | 53.09 | 22.99 |
| 2003 | 414.22 | 388.40 | 574.95 | 52.86 | 53.73 | 22.94 |
| 2004 | 454.22 | 361.53 | 761.55 | 52.20 | 59.98 | 20.74 |
| 2005 | 501.09 | 378.04 | 700.711 | 37.02 | 61.29 | 20.42 |
| 2006 | 551.25 | 379.00 | 728.53 | 32.58 | 62.92 | 20.08 |
| 2007 | 601.09 | 378.52 | 805.15 | 3.49 | 62.82 | 20.33 |
| 2008 | 709.38 | 376.71 | 762.81 | 10.78 | 62.94 | 20.59 |
| 2009 | 783.91 | 379.82 | 347.19 | 38.89 | 60.16 | 21.54 |
| 2010 | 870.16 | 388.02 | 540.71 | 66.66 | 58.74 | 21.62 |
| 2011 | 1054.22 | 357.88 | 428.05 | 70.49 | 52.68 | 20.56 |
| 2012 | 1268.13 | 398.92 | 601.10 | 66.53 | 58.60 | 25.97 |
| 2013 | 1509.06 | 407.47 | 700.29 | 64.84 | 68.42 | 23.47 |
| 2014 | 1770.78 | 419.8134399 | 756.9501789 | 62.67840000 | 60.38320000 | 20.74820000 |
Table 4.
The data of the response subsystem.
| Year | Irrigation Facilities Ratio (%, X12) | Drought Relief Expenditure Rate (%, X13) | Disaster Relief Capacity (X14) | Reservoir Storage Capacity (%, X15) |
|---|---|---|---|---|
| 2000 | 46.80 | 12.75 | 45 | 92.43 |
| 2001 | 46.23 | 12.47 | 50 | 77.53 |
| 2002 | 45.63 | 14.51 | 55 | 90.34 |
| 2003 | 45.19 | 17.24 | 60 | 80.53 |
| 2004 | 44.77 | 15.86 | 60 | 78.45 |
| 2005 | 44.49 | 18.35 | 65 | 63.24 |
| 2006 | 26.97 | 16.47 | 65 | 48.32 |
| 2007 | 26.30 | 14.65 | 70 | 58.34 |
| 2008 | 25.92 | 10.05 | 40 | 48.34 |
| 2009 | 25.92 | 8.43 | 40 | 21.53 |
| 2010 | 26.46 | 9.70 | 45 | 28.35 |
| 2011 | 46.05 | 14.33 | 50 | 29.35 |
| 2012 | 51.92 | 17.43 | 55 | 63.35 |
| 2013 | 52.08 | 18.23 | 60 | 62.54 |
| 2014 | 48.25 | 19.43 | 60 | 66.74 |
Table 5.
Grade classification of OCDIS.
| Index | I | II | III | IV | V |
|---|---|---|---|---|---|
| Soil moisture (%) | >75 | 64~75 | 58~64 | 50~58 | <50 |
| Precipitation anomaly percentage (%) | >−4 | −12~−4 | −20~−12 | −28~−20 | <−28 |
| Agricultural output value proportion | <10 | 10~30 | 30~40 | 40~60 | >60 |
| Per capita annual income ($) | >820 | 668~820 | 434~668 | 164~434 | <164 |
| Drought rate | <15 | 15~30 | 30~45 | 45~60 | >60 |
| Irrigation rate of cultivated land | >60 | 45~60 | 30~45 | 20~30 | <20 |
| Sown area ratio | <14 | 14~20 | 20~28 | 28~45 | >45 |
| Irrigation facilities ratio | >46 | 24~46 | 16~24 | 5~16 | <5 |
| Drought relief expenditure rate | >18 | 16~18 | 12~16 | 10~12 | <10 |
| Reservoir storage capacity | >75 | 60~75 | 40~60 | 30~40 | <30 |
Table 6.
The weight of OCDIS.
| Index | X1 | X2 | X5 | X6 | X9 | X10 | X11 | X12 | X13 | X15 |
|---|---|---|---|---|---|---|---|---|---|---|
| 0.03 | 0.09 | 0.13 | 0.05 | 0.11 | 0.08 | 0.20 | 0.10 | 0.11 | 0.10 | |
| 0.13 | 0.17 | 0.07 | 0.09 | 0.09 | 0.06 | 0.06 | 0.06 | 0.07 | 0.20 | |
| 0.08 | 0.13 | 0.10 | 0.07 | 0.10 | 0.07 | 0.13 | 0.08 | 0.09 | 0.15 |
Table 7.
Results of ADR assessment of Qujing from 2000 to 2014.
| Area | Average | Level | ||||
|---|---|---|---|---|---|---|
| Qilin | 2.50 | 2.62 | 2.37 | 2.49 | 2.49 | II |
| Malong | 2.84 | 2.85 | 2.67 | 2.65 | 2.75 | III |
| Luliang | 2.97 | 2.98 | 2.96 | 2.96 | 2.97 | III |
| Shizong | 2.69 | 2.72 | 2.60 | 2.58 | 2.65 | III |
| Luoping | 2.87 | 2.84 | 2.82 | 2.73 | 2.82 | III |
| Fuyuan | 2.64 | 2.73 | 2.39 | 2.47 | 2.56 | III |
| Zhanyi | 2.72 | 2.80 | 2.59 | 2.70 | 2.70 | III |
| Huize | 2.95 | 2.88 | 2.93 | 2.77 | 2.88 | III |
| Xuanwei | 3.08 | 3.00 | 3.11 | 2.97 | 3.04 | III |
© 2018 by the authors. Licensee MDPI, Basel, Switzerland. This article is an open access article distributed under the terms and conditions of the Creative Commons Attribution (CC BY) license (http://creativecommons.org/licenses/by/4.0/).
Share and Cite
MDPI and ACS Style
Deng, M.; Chen, J.; Huang, J.; Niu, W. Agricultural Drought Risk Evaluation Based on an Optimized Comprehensive Index System. Sustainability 2018, 10, 3465. https://doi.org/10.3390/su10103465
AMA Style
Deng M, Chen J, Huang J, Niu W. Agricultural Drought Risk Evaluation Based on an Optimized Comprehensive Index System. Sustainability. 2018; 10(10):3465. https://doi.org/10.3390/su10103465
Chicago/Turabian StyleDeng, Menghua, Junfei Chen, Jing Huang, and Wenjuan Niu. 2018. "Agricultural Drought Risk Evaluation Based on an Optimized Comprehensive Index System" Sustainability 10, no. 10: 3465. https://doi.org/10.3390/su10103465
Note that from the first issue of 2016, this journal uses article numbers instead of page numbers. See further details here.