Centralized and Decentralized Approaches to Water Demand Management

1
Department of Systems Design Engineering, University of Waterloo, Waterloo, ON N2L 3G1, Canada
2
Department of Mechanical and Industrial Engineering, Ryerson University, Toronto, ON M5B 2K3, Canada
3
Centre for International Governance Innovation, Waterloo, ON N2L 6C2, Canada
4
Balsillie School of International Affairs, Waterloo, ON N2L 6C2, Canada
*
Author to whom correspondence should be addressed.
Sustainability 2018, 10(10), 3466; https://doi.org/10.3390/su10103466
Submission received: 19 July 2018
/
Revised: 21 September 2018
/
Accepted: 25 September 2018
/
Published: 28 September 2018
(This article belongs to the Special Issue Conflict Analysis and Sustainable Management of Water Resources)
Abstract
:Centralized and decentralized procedures to assess the impacts of water demand management on a water system and its users are investigated and compared. Within the centralized approach, a system-wide optimization technique is firstly utilized to estimate the overall optimal net benefits when the water demand management initiatives are implemented. Cooperative game-theoretic methods are used to fairly redistribute the additional net benefits. In terms of the decentralized perspective, an agent-based modelling framework is adopted to permit each user to make independent decisions on whether to conserve water or consume extra water and how much to conserve or consume by solving individual optimization problems. For comparison purposes, both the centralized and decentralized approaches are applied to a case study reflecting an actual situation in the South Saskatchewan River basin in Alberta, Canada. Both methods provide positive incentives to encourage users to conserve water while maintaining at least the same level of economic benefits such that system-wide productivity is improved. Moreover, the study demonstrates that the centralized method produces greater overall net benefits, but the users may be less motivated to participate.
1. Introduction
Water is a paradox: scarce but often wasted. The supply of water is limited but the demand for water is increasing rapidly. The imbalance between water supply and demand is expected to greatly expand as water demand inexorably increases. Water scarcity has been a critical issue for many regions and has caused numerous water conflicts. Meanwhile, the value of water itself and the many services it provides have not been fully recognized and water has been utilized inefficiently in many places. An improvement in water use efficiency and productivity is widely considered to be the best solution to ensure that future water demand does not exceed water availability, and this requires special attention to the demand side [1,2,3,4,5,6].
The implementation of water demand management (WDM) has a myriad of benefits. For instance, it can defer or even eliminate the construction of new water supply infrastructure, which can be costly. It can improve the social welfare obtained from water utilization by promoting water use efficiency. It can enhance public awareness of the value of water through public participation. It can increase the resilience of human society and ecosystems by reducing water shortage risks. It can support the sustainable development of water resources. However, there are also many barriers hindering the widespread adoption of WDM initiatives. The lack of knowledge and information is one of the key barriers from the viewpoint of water users. The absence of incentives for users discourages them from taking the necessary actions. Moreover, there often exist conflicting objectives during the implementation of water demand management initiatives. For example, a policy aimed at reducing water use in irrigation for utilization for other purposes, such as increasing environmental flows, is beneficial from a resources management perspective in the long term. However, the irrigator may suffer revenue losses because of crop production reductions, and thus be against the policy. Therefore, taking into account each user’s interests and objectives is crucial for a successful implementation of WDM initiatives [7].
The topic of WDM has been extensively studied from technical, social, economic, and legal perspectives [8,9,10,11,12,13,14,15,16]. In general, the implementation of WDM initiatives can be carried out from two different viewpoints: centralized and decentralized perspectives. The centralized perspective normally refers to a command-and-control process in which a central unit collects all necessary information and makes decisions for each user in order to achieve better system performance. All users need to follow the commands of the central unit. Certainly, these orders may involve compensations or side payments to some users so as to achieve fairness and a high acceptance level. On the other hand, the decentralized viewpoint generally stands for a bottom-up procedure in which each user makes individual decisions based on his or her own information and then all individual decisions merge to form the system’s overall performance. The centralized perspective is normally considered more effective in terms of achieving better system performance, but less effective with regards to participation and compliance levels of users. In short, it is more efficient, but sometimes less fair and more difficult to implement.
Both the centralized and decentralized approaches are examined in this paper with respect to a WDM problem. The centralized method involves a system-wide optimization process for estimating the maximum overall net benefits with the implementation of a WDM plan, a modified cooperative reallocation game for distributing additional net benefits to users, and a procedure to negotiate over different cooperative solutions. The decentralized approach is developed based on an agent-based modelling framework that consists of individual optimization for each user to achieve his or her individual objective and a coordination procedure for minimizing the imbalance over individual objectives. The applicability of both approaches is specifically discussed by using an illustrative case study from western Canada having the same input data. The results of the case study using the two methods are analyzed and compared in terms of overall net benefits, individual net benefits, and the corresponding levels of water consumption. In the following sections, a generalized WDM problem is stated and explained first, then the centralized and decentralized approaches are described in detail, and finally an illustrative case study from western Canada is utilized for demonstrating how each approach works in practice and comparing their capabilities.
2. Water Demand Management Problem Statement
WDM aims to promote efficient and productive water use and mainly focuses on consumptive uses. It is argued that the ultimate objective of water utilization is to provide products and services to our society [17]. To operationalize wise WDM, one can consider water productivity (WP) as one of the main indicators of efficient use of water. Then, a generalized WDM problem can be expressed as the problem of measuring how much WP can be improved.
2.1. Modelling Perspectives
Water productivity (WP) is defined as the ratio of benefits gained from water utilization to the amount of water used to produce those benefits [18,19], as expressed by:
Based on the expression of WP in Equation (1), an improvement in water productivity can be achieved in two respects: (1) by increasing benefits produced from water utilization given a certain amount of available water; and (2) by decreasing water input subject to achieving benefits not less than the current ones. These two respects correspond to two modelling principles: increasing benefits produced from water utilization given a certain amount of available water implies maximizing benefits as the main objective subject to constraints on water availability; and decreasing water input subject to achieving benefits not less than the current ones implies minimizing water consumption as the primary target subject to physical requirements and benefit goals constraints. The principle of maximizing benefits as the main objective subject to constraints on water availability is studied in this paper from both centralized and decentralized perspectives.
As mentioned in the Section 1 and illustrated in Table 1, the centralized approach is a top-down management process that searches for a system-wide optimal outcome. It assumes that there exists a “central unit”, such as a watershed manager, who makes decisions for all users and all users willingly obey the “central unit”. The “central unit” also has all of the necessary information needed to make the best decisions. Overall, it considers the WDM problem from a manager’s viewpoint. It possesses many advantages, including: it is economically efficient for the entire system but a proper redistribution of benefits is required to encourage individual users to perform actions; and it is effective for solving simple problems. However, when a problem is complex and involves a large number of variables and nonlinear relationships, it may become difficult to solve using the centralized approach [20,21]. Moreover, it ignores the acceptance level of an individual user, which sometimes may trigger further conflicts. Public participation has an increasingly important role to play in the implementation of WDM. Historically, the centralized approach has been used for solving resource and environmental problems. Concerns regarding this approach, such as high costs and low compliance levels, have been reported [22]. Reducing these burdens would encourage water transfer activities and improve the system’s performance [23]. Consequently, alternatives to traditional “command-and-control” methods, such as decentralized methods, have attracted great attention due to their flexibility, adaptability, and high participation [22,24].
The decentralized approach is considered to be a bottom-up management procedure, and can partially overcome several disadvantages of the centralized approach. For instance, it follows an individual-driven modelling process in which decisions are made by each individual user, and are thereby much more acceptable to users. Moreover, a complex problem can be decomposed into many simpler problems that can be more easily solved. Certainly, the decentralized approach has disadvantages, such as being less efficient. In addition, it needs a proper and effective information exchange mechanism so that each user can update his or her decision according to new information from other users or the system. Without this mechanism, it is very likely that all individual objectives cannot be achieved simultaneously. Therefore, a coordination process can assist the decentralized approach to reduce imbalance over individual objectives.
2.2. Model Objectives
In a water system, such as a basin, there are typically many different types of water uses, such as agricultural production, urban development, and environmental flow requirements. Moreover, there are various kinds of physical hydrological infrastructure, such as reservoirs, dams, rivers, and canals, that assist in operationalizing the system. To mathematically model a WDM problem, assume that a basin is represented by an abstract node-link network G (K, L), where K = {k1, k2, …, km} denotes a set of nodes standing for an array of physical hydrological infrastructure, such as reservoirs or demand sites, and the connections between two nodes k1 and k2 by water conduits can be expressed by a set of links L = {(k1, k2): k1, k2 ∈ K and k1 ≠ k2} [25]. The overall planning period is defined as T = {1, 2, …, t}. Let be the water quantity from node k1 to k2 during time period t.
In this paper, the case with a given volume of available water is considered, for which the problem of maximizing the water productivity (WP) is equivalent to maximizing the benefits produced from water utilization. From a centralized perspective, a system-wide optimization of the overall benefits can be formulated as:
where is an estimation of the benefits produced from water utilization by demand node k during time period t, and refers to the cost of supplying water to node k during time period t. The sum of benefits () minus the sum of costs () of all nodes over all planning periods stands for the system-wide overall net benefits. and refer to the equality and inequality constraints for the problem, respectively, for which examples can be seen in Equations (6)–(9). The symbol of Ω represents the feasible solution space of the optimization problem subject to hydrologic and economic constraints.
From a decentralized perspective, the objective is to maximize each user’s net benefits rather than the system-wide net benefits. Therefore, an individual optimization problem for each user can be expressed as:
where the objective function is the sum of the estimated individual net benefits produced from the water utilization for node k over all planning periods. and refer to the equality and inequality local constraints for the problem for node k, respectively.
It can be seen that both formulations attempt to find the maximum benefits from water utilization, but the centralized optimization formulation considers system-wide overall benefits and the decentralized optimization formulation considers individual benefits. Moreover, the decentralized optimization formulation only considers local constraints for a particular user. Equity is a key criterion and one of the most difficult challenges in addressing social problems because different people have varying interpretations of equity and sometimes conflicting understandings. There are various ways to take equity considerations into account. In this work, an initial allocation is determined by using a method proposed by Wang et al. [25] based on the principles of “monotonicity” and “priority”, which are two key considerations of equity when formulating optimization problems. Moreover, equity issues are inherently considered within the various solution concepts used in cooperative game-theoretic approaches. Another alternative to account for equity is to incorporate it into the constraint set of an optimization model, which has been done in a number of studies [26,27,28,29].
3. Centralized Approach
As mentioned in the Section 1, the centralized approach firstly estimates the maximum overall net benefits of the system with the implementation of a WDM plan, and the essential part is to estimate the capability of each user to produce net benefits with a certain volume of water. Then, additional net benefits are fairly distributed among users by using a modified cooperative reallocation game such that no one will receive less net benefits. With several cooperative solutions, a Nash bargaining process is executed to find a feasible and acceptable final resolution of the distribution of additional net benefits. For simplicity, many physical nodes, such as inflow, outflow, and junction nodes, would not produce any benefits and thus can be exempted from the estimation, and a new set of nodes with economical capability, also called the set of stakeholders, can be defined as N = {1, 2, …, i, …, n}.
3.1. System-Wide Maximum Net Benefits
The estimation of net benefits functions should take into account the diverse characteristics of different use types, and can be expressed in various forms. For example, for an agricultural (AGR) user, its net benefits function is represented by a quadratic function, while the net benefits function for municipal and industrial (MI) users can be derived from a water-price-demand function having a constant price elasticity and choke price. More specifically, the quadratic net benefits function for agricultural users is formulated as:
where , , and represent coefficients derived from a regression model using historical data, and is the cost of water diverted to user i, including water treatment, water distribution, and wastewater treatment costs.
For municipal and industrial (MI) users, an inverse price-demand function with a constant price elasticity, choke price, and efficiency improvement is written as [30]:
where refers to the price of willingness to pay to retrieve water for user i during time period t. is a scale parameter for the water-price-demand function (), and is the price elasticity for user i during period t (). The parameter ρ represents the level of efficiency improvement as a result of the implementation of a WDM plan. and stand for the choke price and the choke quantity, respectively, for user i during period t. A “choke price” is the price beyond which water users may not be willing to pay a higher price and may seek alternative sources [31].
A set of hydrological constraints and policy restrictions have to be taken into account in the optimization. Hydrological constraints mainly consist of water balance equations and capacity limits. Water balance equations are used to describe the flow of water in and out of a system [32], for which a general form of water balance equation for each node during each period can be written as:
where is the storage volume for storage node (reservoir or aquifer) k at the end of period t, and is equal to zero for non-storage nodes; means the water flow from node k1 to k during period t while is the outflow from node k to k2; stands for the water loss during transportation, due to evaporation, leakage, or seepage from node k1 to k during period t; represents the water adjustments at node k during period t as a result of local small tributaries; and is used to denote the water consumed at node k during period t that is needed for economic activities. This equation can be modified appropriately based on the specific type of node it is describing. For example, for non-storage nodes S is equal to zero, and for non-consumptive nodes, can be omitted.
Each link has a maximum capacity. Therefore, a capacity constraint can be written as:
How much water can be diverted to a water user is restricted not only by the maximum demand of that use but also by the capacity limit of conduits for diverting water to that user. Therefore, a constraint for a diversion limit is expressed as:
where represents the maximum demand of node k during period t; and indicates the maximum capacity of a conduit that is used to divert water to node k during period t. The smaller value of these two is the amount of water that can be diverted to that node.
There are some policy restrictions due to social-economic considerations. For example, there is normally a minimum flow requirement for links for the sake of environmental conservation, which can be shown as:
3.2. Modified Cooperative Reallocation
Cooperative game-theoretic approaches are widely used for sharing the additional benefits collectively produced by a group of users [33]. Consider the set of nodes with economical capability N = {1, 2, …, i, …, n}, and let S denote a coalition containing a group of users working cooperatively. Each individual user can be considered as a coalition having the individual user only, while the grand coalition contains all users. In fact, the overall net benefits of every coalition can be estimated by solving the optimization problem given in Equation (2) with additional constraints to restrict water transfer among users within the coalition, while users not within the coalition will retain their initial level of water allocation.
Assume a cooperative game for reallocation of additional net benefits, in which N is the set of stakeholders and v is the characteristic function on N. Let represent the optimal estimated net benefits for coalition S through internal cooperation obtained from solving the optimization problem, for which can be expressed as:
Let a vector x = (x1, x2, …, xi) denote a solution to the cooperative game that describes the net benefits reallocated to each stakeholder, for which the term of stands for the additional net benefits that stakeholder i can receive from participating in a coalition, also called the participation value. A solution x must satisfy the following three conditions [34,35]:
With the implementation of a WDM plan, especially the efficiency improvement incurred by the WDM plan, the overall net benefits for the grand coalition are updated to . Then, the third condition of joint efficiency can be modified to:
Various solution concepts can be used for solving the modified cooperative game, such as the nucleolus and its variations [34,36,37] and the Shapley value [38]. Consequently, the fair distribution of additional net benefits to each stakeholder and its participation value can be obtained. However, each solution concept considers fairness in different ways and produces different results [39,40]. Some stakeholders may prefer one solution over another, while other stakeholders may disagree. To solve this problem, a further negotiation process is proposed.
3.3. Negotiation Process over Cooperative Solutions
The Nash bargaining approach [41,42] is a simple but classic method for sharing utilities, in which players take turns to propose a new utility sharing offer until all players agree or disagree with the offer. The offer that all players accept is an optimal solution for the bargaining problem. In a Nash bargaining model for n players over cooperative solutions, let be the utility share of player i, and the notation stands for player i’s utility at the disagreement point. Assume that there are m solution concepts contained in the set M = {1, 2, …, j, …, m}.
The Nash bargaining solution is the unique solution determined using the following optimization problem:
where the first equality equation implies that the sum of utility shares among all players should be equal to the total sharable utility represented by . The second and third inequalities mean that player i’s utility share should be no less than its utility at the disagreement point denoted by , which is calculated by the minimum value player i can obtain from all solutions, but no more than its maximum utility expressed by , which is represented by the maximum value player i can obtain from all solutions. The last two equations provide the formulations to calculate and , respectively.
4. Decentralized Approach
In terms of the decentralized approach, an agent-based modelling framework is adapted in which a decentralized optimization is proposed for every stakeholder. It is assumed that each stakeholder controls his or her own strategy regarding whether or not to conserve water or consume more water based on her initial allocation of water in order to achieve a better economic return. A positive incentive is given to water conservers to encourage them to implement WDM strategies, whereby this incentive should more than cover the benefit loss from less water consumption. Moreover, a coordination procedure is carried out to minimize the imbalance among various individual objectives.
4.1. Agent-Based Structure
An agent-based model typically contains four main components [43,44]: (a) a set of agents for which each agent has distinguishable attributes; (b) an environment in which agents can interact with both it and other agents; (c) methods that control how agents update their attributes; and (d) an interaction mechanism that describes when, how, and with whom agents interact.
Consider the set of stakeholders N, within which a stakeholder has an economic capability, and can be viewed as a general agent having two attributes: (1) level of water consumption; and (2) level of net benefits represented by net benefits functions [45]. An agent’s decision rules can be described as follows: (a) the agent assesses the net benefits gained from water utilization and the potential compensation or cost value according to a given value of a parameter () received from a coordinator; (b) if the compensation value is greater than the net benefit losses, the agent chooses to conserve water; if the net benefits produced from extra water consumption are more than enough to cover the cost value, then the agent selects to consume more water; otherwise, it retains its initial level of water allocation; (c) the agent decides how much water to conserve or consume by solving an individual optimization problem in which the objective is to maximize its own economic return as expressed in Equation (3). However, its estimation of net benefits should be modified to include the potential incentive values (), which are calculated as:
where reflects the benefit or cost per unit of water conserved or consumed, respectively, for agent i during time period t; and refers to the initial level of water allocation by agent i during time period t. It can be seen that when the level of water consumption () is less than the initial level (), the incentive value is positive, and when , the incentive value is negative and indicates a cost. Therefore, the objective function is modified as:
where the estimation of benefits and costs for each agent is identical to the functions given in Equations (4) and (5).
In addition to the general agents, there are also two other types of agents in this model. One is ecosystem agents and the other is coordinator agents. Ecosystem agents have the attribute of level of water consumption, and they only reactively respond to the actions of general agents. Coordinator agents have two attributes: (1) overall net benefits; and (2) total imbalance value. The overall net benefits are estimated as the sum of the economic returns of all individuals, for which larger is better. The total imbalance value is calculated by summing all of the agents’ incentive values, where less is better. For each given value of a parameter (), the coordinator agent would monitor the level of water consumption and net benefits of individual agents and calculate the system-wide overall net benefits and total imbalance values, then update the value of the parameter until the system-wide net benefits cannot be improved and the total imbalance value cannot be decreased.
The constraints for each optimization problem are similar to the constraints given in Equations (6)–(9). However, only constraints related to a particular agent are used to construct the solution space for that agent. For instance, the water balance constraints given in Equation (6) for an agent at one tributary would not be included in the optimization problem for another agent at a separate tributary if these two agents have no direct connection.
4.2. Coordination Procedure
A set of agents, their attributes, and methods to update their attributes are described in the previous section. The interaction mechanism, through a coordination procedure, is explained in this section. Interactions can take place in a direct or an indirect manner, in which direct interaction indicates information exchange and associated bargaining among agents, while indirect interaction means that a third party, such as a water manager or agency, is involved in the information exchange process as a coordinator.
The coordination procedure starts by checking the satisfaction ratio of the initial level of water allocation by dividing the water allocation by the water demand for each agent. If the initial levels of allocation are already enough for all agents, then there is sufficient water for all and no one requires extra water. If not, then each agent makes decisions individually on whether to conserve water or consume more water and how much to conserve or consume by solving its own optimization problem with a given value of parameter . Next, the coordinator evaluates the overall net benefits, the total imbalance value, and the net benefits increment related to the results in the previous iteration. When the net benefits increment is larger than a threshold, such as one thousandth of the overall net benefits, it means that the overall net benefits can still be improved, and hence the value of the parameter is updated and another iteration of individual optimization is carried out until the overall net benefits cannot be further improved. If the overall net benefits start to decrease after a certain point, then the coordination procedure is immediately terminated. Otherwise, the procedure continues until the minimum total imbalance value is found, provided that the overall net benefits remain constant. After the above two termination criteria are satisfied and the coordination procedure is stopped, the results of water consumption, net benefits, and incentive values for each agent can be determined and analyzed.
5. Case Study and Results
In this section, both the centralized and decentralized approaches described in the previous sections are applied to a case study to investigate the impacts of WDM on a water system and its users. Moreover, the bargaining resolution obtained from using the centralized approach and the decentralized outcome are compared in terms of the overall net benefits, individual net benefits, and levels of water consumption.
5.1. Case Study Description
The South Saskatchewan River basin (SSRB) is located in southern Alberta, Canada. More than half of the province’s population inhabits the SSRB. The demand for water is very high but water supply is limited. The main source of supply is surface water provided by snowmelt from the Rocky Mountains. The need for more agricultural production and industrial products and increasing awareness about environmental protection have caused intense competition for the limited supply of water. As major water users in the region, agricultural users possess about 75% of the licensed water, since the SSRB has a priority-based water rights system in which the principle of “first in time, first in right” is followed. Therefore, earlier licenses are granted priority over licenses issued at a later date, and in some areas new license applications are no longer approved. It is very important to encourage agricultural users to improve their water use efficiency and conserve water for transfer to other municipal and industrial users. Certainly, compensation should be given to them so that they will benefit from conservation.
The SSRB case is simplified into a node-link network, displayed in Figure 1, in which most typical users are considered. Specifically, the network consists of two agricultural (A1 and A2), domestic (D1 and D2), industrial (I1 and I2), general (G1 and G2), inflow (IN1 and IN2), reservoir (R1 and R2), instream flow requirement (S1 and S2), and junction (J1 and J2) nodes, and one outlet (O1) node. Among all users, the agricultural, domestic, industrial, and general users have economic capabilities and hence can produce benefits. Domestic use represents water consumption for residential purposes, while general use means water required for commercial, institutional, and public service facilities. The inflow data of a typical drought year is used for this case. The total annual water supply is about 322 million cubic meters (m3), while the total annual water demand is above 1225 million m3, in which more than half of the demand comes from agriculture (693 million m3), which is required during May to September (the crop-growing season). There are initial storage volumes of 163 and 317 million m3 at the two reservoirs R1 and R2, respectively.
It should be noted that an initial allocation process is carried out by using a priority-based method, proposed by Wang et al. [25], according to the actual situation in the study area for which a priority-based water rights system is in place. The initial allocation results reflect how much water is rightfully under one’s control under the existing legal systems and agreements. Based on the initial allocation, under the centralized approach water transfers among users are performed to achieve the optimal overall net benefits, and within the decentralized method each user makes decisions on whether to conserve water or consume extra water in order to maximize its own net benefits.
Consider a series of modelling scenarios for WDM strategies. Specifically, a set of conservation limits is specified to describe the maximum amount of water that a user can conserve from its initial allocation because of either technological limitations or social restrictions. Both centralized and decentralized approaches are carried out under several scenarios with different percentages, such as 10%, 20%, and 30%, of the initial level of water allocation. A baseline case indicates that all users can conserve 0% of their initial level of water allocation, which, in other words, means no conservation.
5.2. Results, Comparisons, and Discussion
The total net benefits of the basin, as presented in Figure 2, are determined by solving the system-wide optimization problem in the centralized approach (Section 3) and the individual optimization problem in the decentralized procedure (Section 4). As can be seen from the figure, under the baseline case, without conservation and cooperation, the total net benefits are about 800 million dollars; with cooperation, they can reach about 915 million dollars. Along with the increase in the level of conservation, more net benefits can be produced, as demonstrated by both the centralized and decentralized approaches. Moreover, under each scenario at the same level of conservation, the total net benefits estimated by the centralized approach are always larger than those estimated by the decentralized procedure. This observation indicates that the centralized approach performs better than the decentralized approach with respect to economic efficiency. However, the difference between the total net benefits obtained by these two approaches reduces as the level of conservation increases, which suggests that the decentralized approach can also be quite efficient, if not as efficient as the centralized one, with a wider solution space (for example, a larger conservation limit in this case). This finding suggests that a policy-maker may wish to impose the smallest number of restrictions possible, or only the necessary restrictions, on individuals in order to achieve better economic outcomes. Alternatively, the policy-maker may also wish to extensively investigate the impact of each additional restriction on individuals and the system as a whole before imposing it.
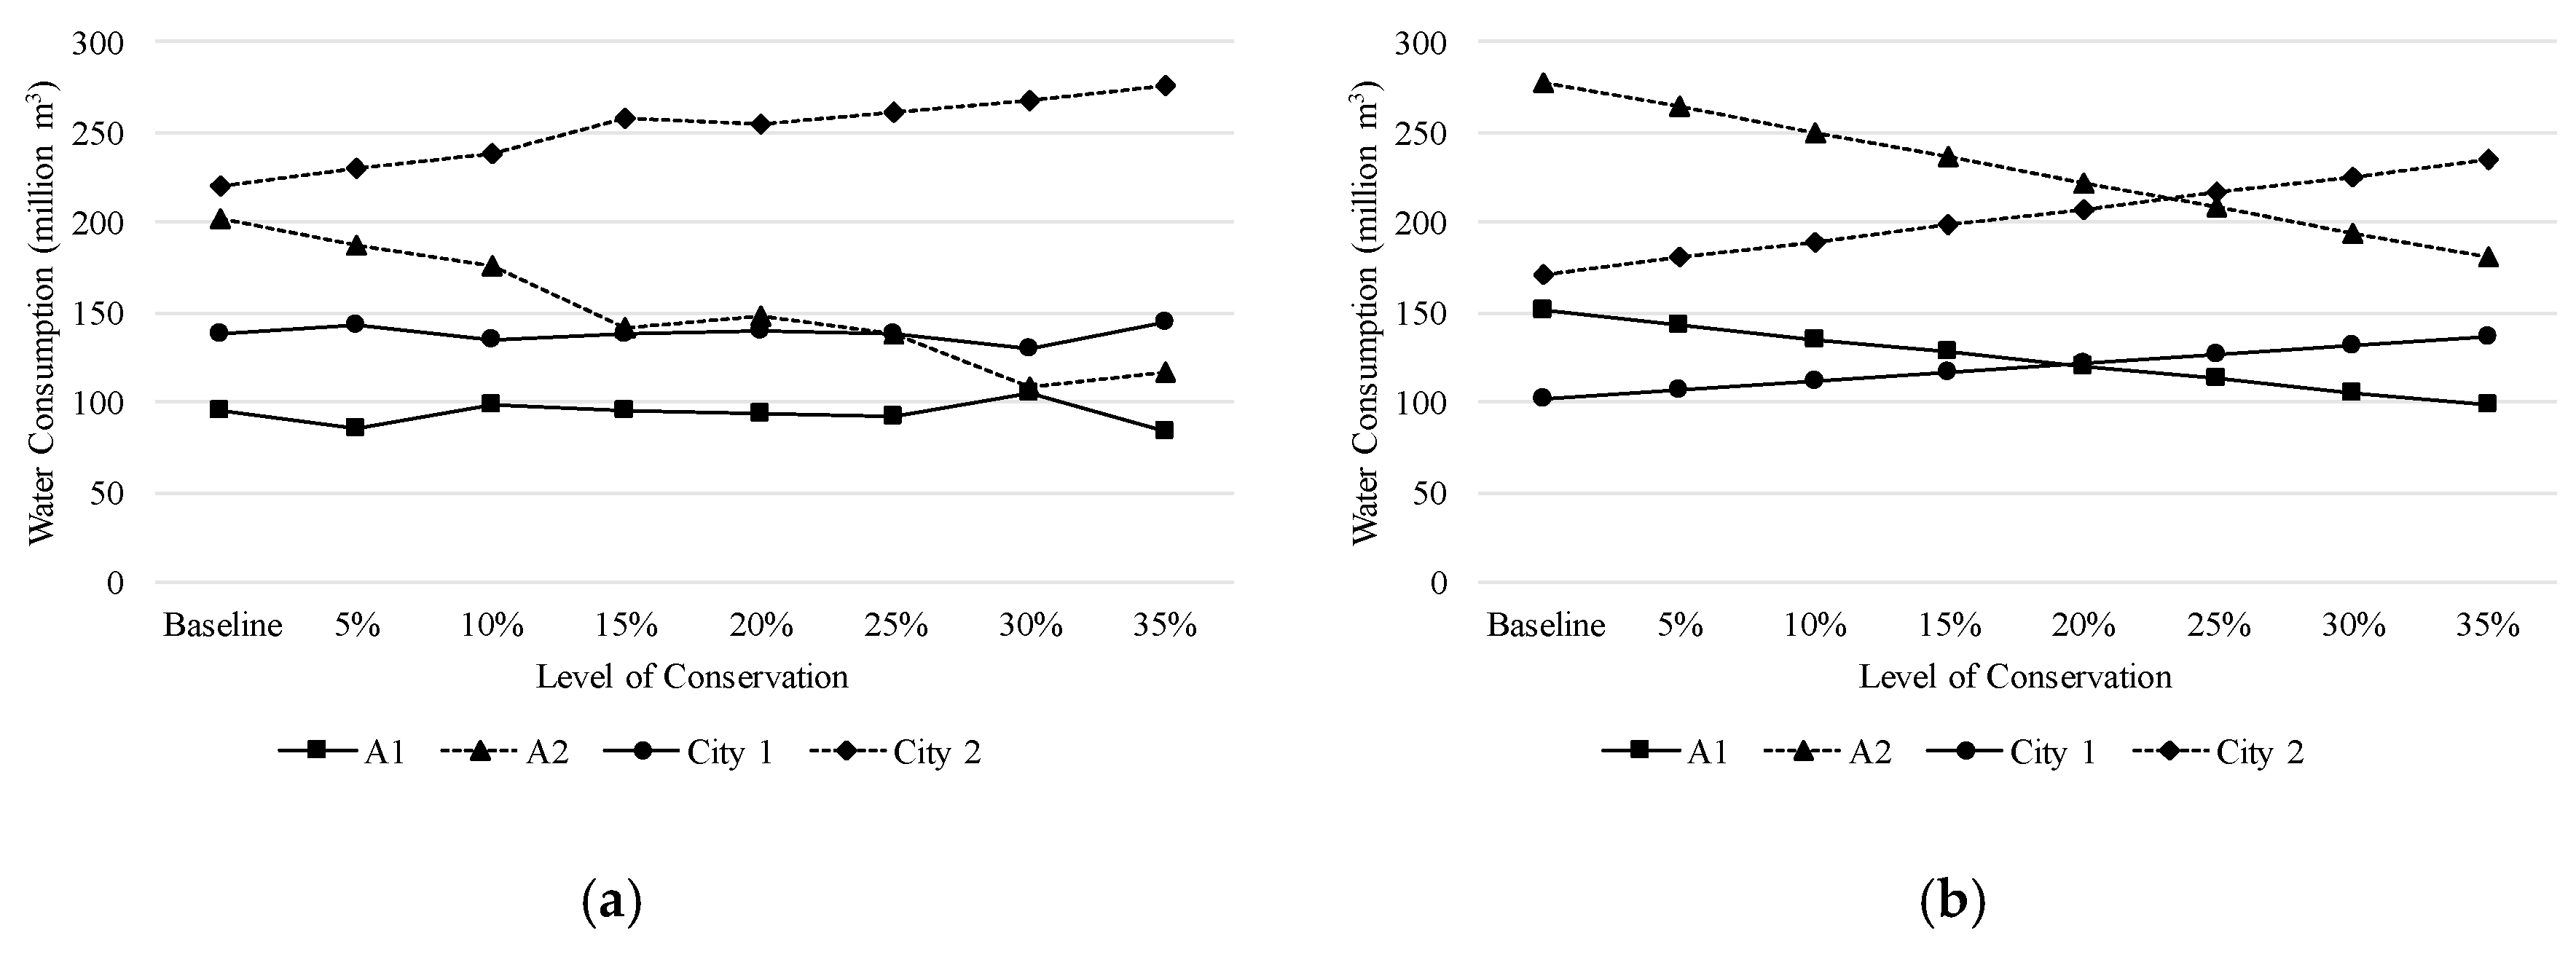
From the perspective of water consumption, the changes in water consumption of each user group under scenarios having different levels of conservation from the centralized approach are shown in Figure 3a, while the changes from the decentralized procedure are displayed in Figure 3b. As can be seen from Figure 3, the results from both the centralized and decentralized approaches indicate that water is transferred from agricultural to city users. Specifically, within Figure 3a, user A2 reduces its level of water consumption along with the increase in the level of conservation, while user City 2’s level of water consumption goes up hand-in-hand with the level of conservation. The water consumption of users A1 and City 1 is relatively stable in response to the change in the level of conservation. Therefore, it can be concluded that the conserved water from A2 is consumed by City 2 as A2 is located upstream within the same tributary. From Figure 3b, it can clearly be seen that A1 and A2’s conserved water is utilized by City 1 and City 2, respectively. It should be mentioned that the levels of water consumption under the baseline scenario from the centralized approach are those having cooperation among all users but without conservation, while those from the decentralized approach constitute the initial allocation without conservation. Hence, there already exists a considerable number of water transfers among users under the baseline scenario from the centralized approach and more than 90% of City 1’s demand is already satisfied. This is one of the reasons why A1 and City 1’s consumption levels are insensitive to the changes in the level of conservation in Figure 3a.
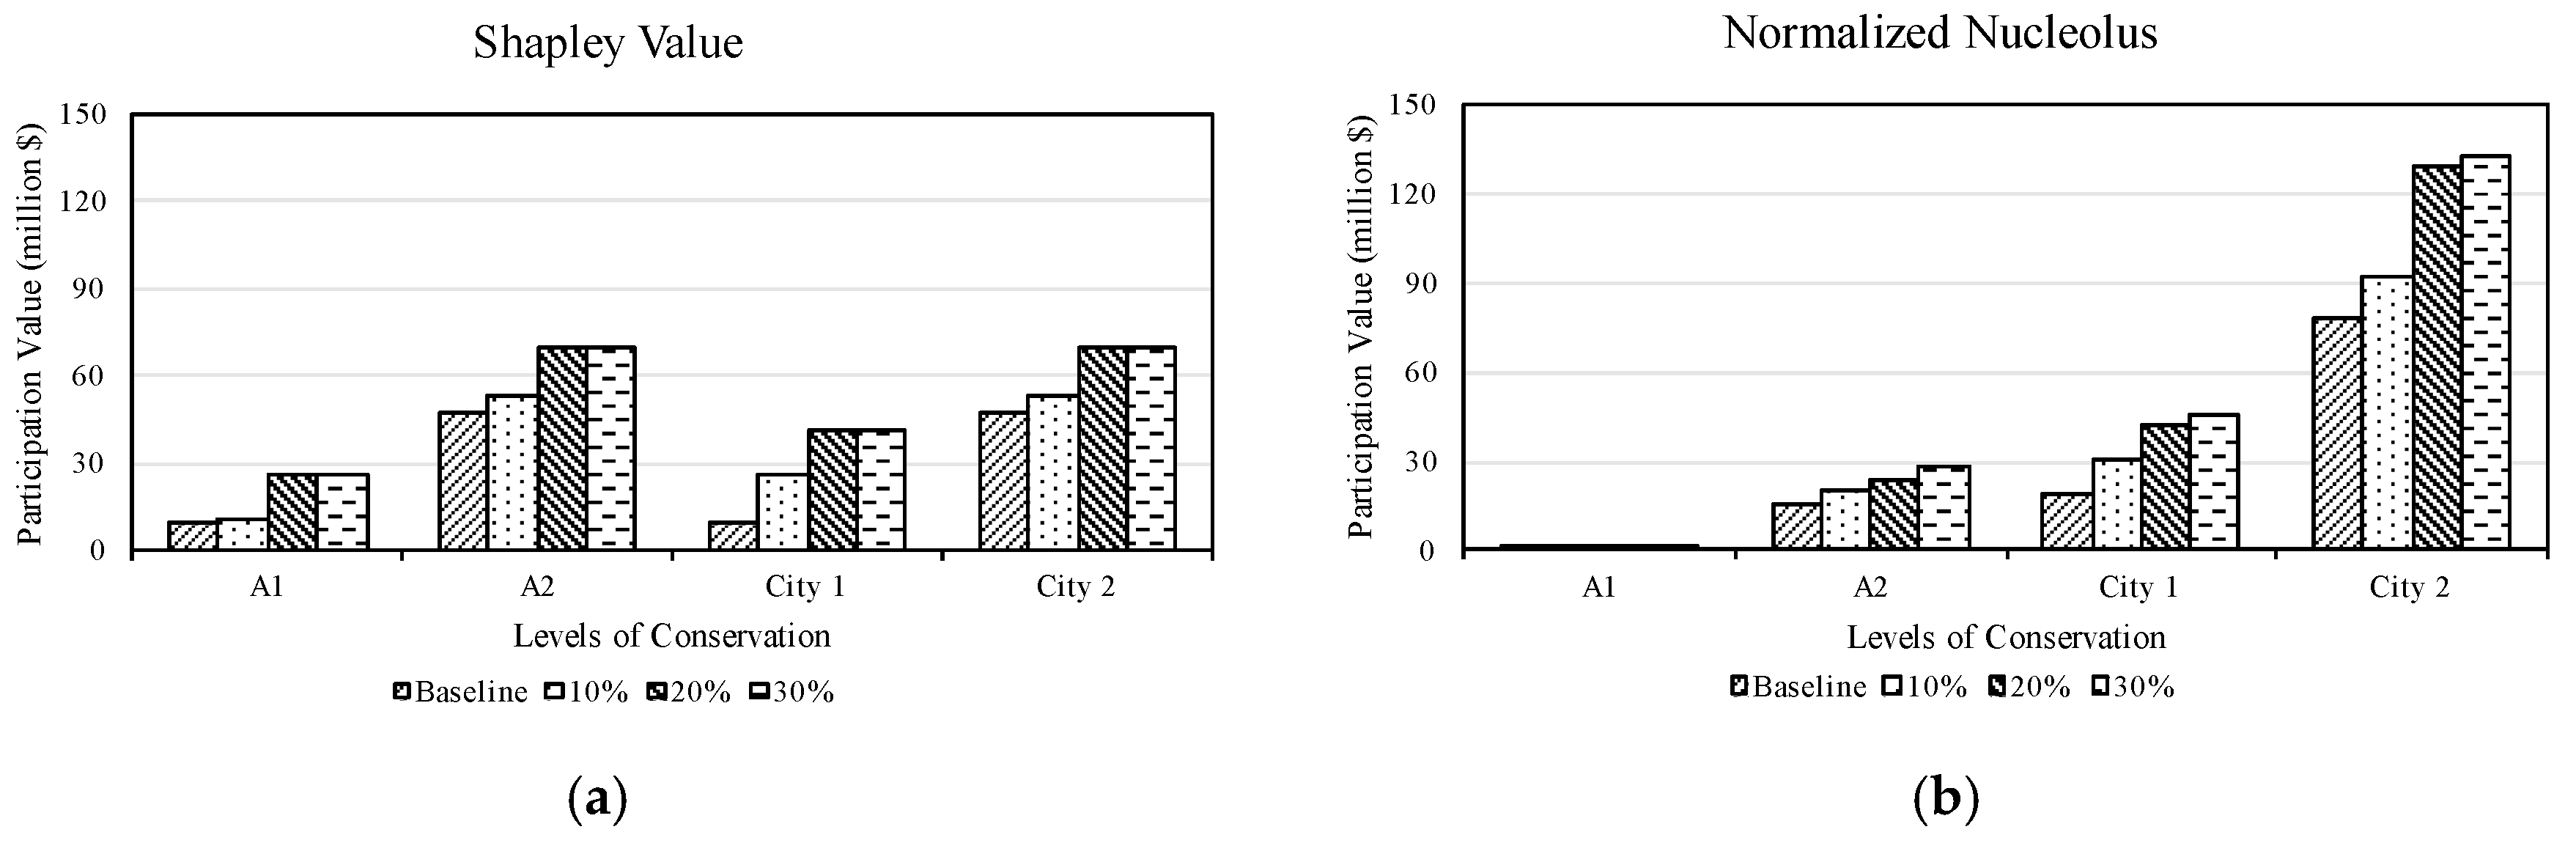
In terms of the additional net benefits (participation values) shared by users under various solution concepts in the modified cooperative reallocation game, Figure 4 presents the results of the Shapley value and normalized nucleolus solution concepts under scenarios with different levels of conservation. It can be commonly observed that the participation value for each user is higher with a greater level of conservation under both solution concepts. However, there is a big difference in the distribution of participation values among users between solution concepts. Specifically, City 2 can expect many more additional net benefits with the solution concept of normalized nucleolus, while the results of the Shapley value are much more preferred by user A2. Therefore, A2 may threaten to leave a coalition if the normalized nucleolus solution is employed. A bargaining process could be helpful to find a feasible and acceptable resolution for all of the users.
Consider a bargaining problem having a 20% conservation level. As can be seen in Figure 2, from the system-wide optimization with a 20% conservation level, the total net benefits are 996 million dollars in comparison to the total net benefits in the baseline scenario for which 800 million dollars are obtained. Hence, there are 196 million dollars of additional net benefits that are shared across the four users, and this is also the total amount of sharable utilities under the Nash bargaining model. Figure 5 shows the solutions obtained from five cooperative solution concepts as well as the bargaining results indicated by the far-right bar of the figure above each user. As can be seen from the figure, the distribution of participation value for a user can be hugely different under various solution concepts. Specifically, user A1 can obtain 36.30 million dollars from the solution concept of nucleolus, but only 0.44 million dollars from the concepts of proportional nucleolus and normalized nucleolus. With the Nash bargaining process, 32.95 million dollars are expected for user A1. It is also interesting to notice that among all users, most of them can expect a value between the minimum and maximum shares among the five cooperative solutions after the bargaining process. However, user City 1’s expected net benefits are equal to those from the proportional nucleolus solution (62.99 million dollars), which is the maximum share among the five cooperative solutions.
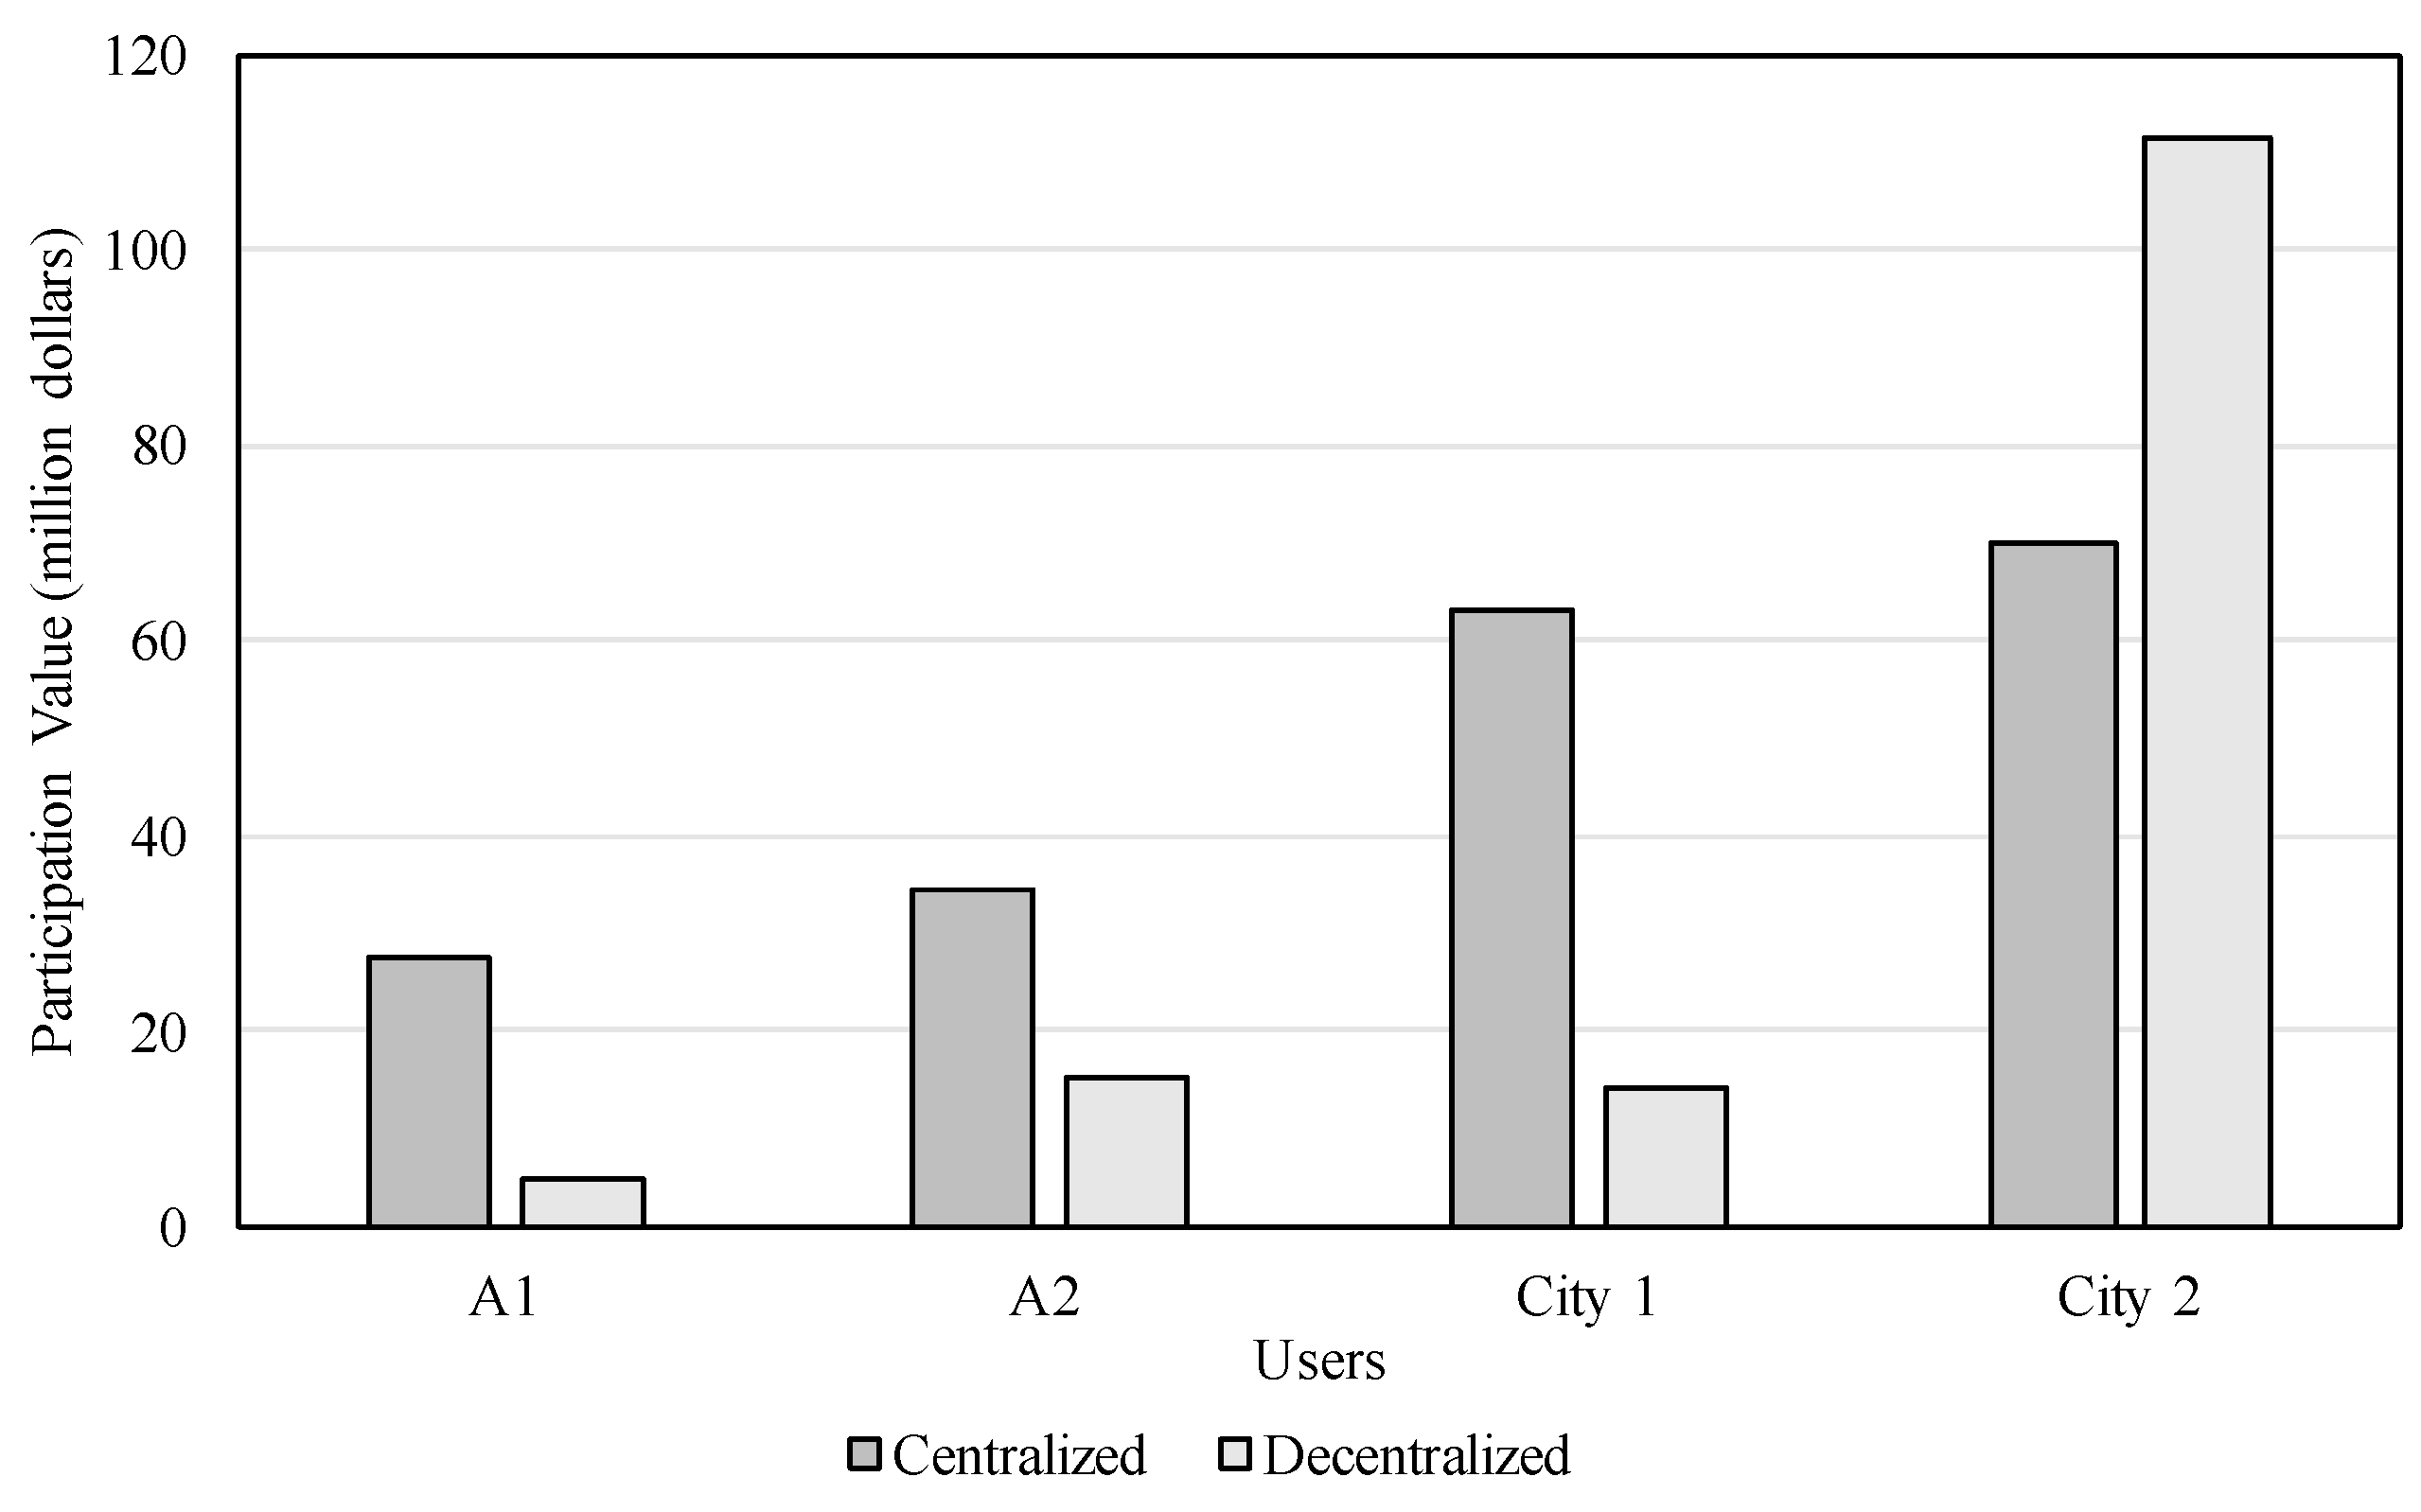
The participation values for each user are positive with both the centralized and decentralized approaches, as can be seen in Figure 6. However, the participation values for the decentralized approach are also generally less than those with the centralized approach, except for City 2, as shown in numbers in Table 2. It is likely that City 2 has a strong economic capability and can thus generate significantly more extra net benefits by consuming extra water. All three of the other users could not expect as many net benefits in the decentralized approach as in the centralized one. One potential reason is that the total net benefits for the system under the decentralized approach are less than those for the centralized approach. As indicated by the far-right column in Table 2, under the scenario of a 20% level of conservation, the difference in total net benefits between the two approaches is about 50 million dollars.
6. Conclusions
People may not voluntarily adopt advanced water-saving technologies to improve their water use efficiency even if these technologies are already well-developed. Positive internal incentives can encourage them to adopt these technologies and change their water use behavior, especially for users in sectors having greater potential for water conservation. How much of an incentive users can expect is investigated in this paper from both the centralized and decentralized perspectives. The findings suggest that both centralized and decentralized approaches can provide a considerable positive incentive to every user participating in the initiatives, and the more they conserve, the greater their economic returns. The results also indicate that the centralized approach is generally superior to the decentralized one by providing greater total net benefits for the system as a whole and also greater net benefits for individual users. However, when a lower number of restrictions is imposed on individuals, the decentralized approach can also achieve better economic efficiency. This may remind policy-makers to carefully and extensively assess the potential impact of a particular regulation before it is introduced. Overall, this paper provides a systematic investigation on what incentives are required and how water users would respond to the incentives for WDM.
In a changing world, uncertainty is playing an increasing role in decision-making problems. The situation studied in this work is considered to be static. However, it can be extended to handle real-time situations by incorporating uncertainty into the model, or by simply running the model again while utilizing an updated set of parameters. This provides a worthwhile direction for future research.
Author Contributions
All three authors equally contributed to this work in developing and refining the methodologies and the case study presented in this paper through numerous discussions. Additionally, Y.X. wrote a draft version of this manuscript and L.F. and K.W.H. revised the manuscript.
Acknowledgments
The authors would like to express their sincere appreciation to the three anonymous reviewers for providing valuable comments, which enhanced the quality of the paper. The authors also would like to thank the Natural Sciences and Engineering Research Council (NSERC) of Canada for its financial support. The first author gratefully acknowledges the China Scholarship Council for providing him with a scholarship to carry out his doctoral studies (No. 201206710003).
Conflicts of Interest
The authors declare no conflict of interest.
References
- Baumann, D.D.; Boland, J.J.; Hanemann, W.M. Urban Water Demand Management and Planning; McGraw-Hill: New York, NY, USA, 1997. [Google Scholar]
- Renzetti, S. The Economics of Water Demands; Kluwer Academic: Boston, MA, USA, 2002. [Google Scholar]
- Gleick, P.H. Global Freshwater Resources: Soft-Path Solutions for the 21st Century. Science 2003, 302, 1524–1528. [Google Scholar] [CrossRef] [PubMed] [Green Version]
- Brooks, D.B. An Operational Definition of Water Demand Management. Int. J. Water Resour. Dev. 2006, 22, 521–528. [Google Scholar] [CrossRef]
- Butler, D.; Memon, F.A. Water Demand Management; IWA Publishing: London, UK, 2006. [Google Scholar]
- Kindler, J. Water Demand Management. In A Review of Selected Hydrology Topics to Support Bank Operations, HEF (Hydrology Expert Facility) Technical Report 1; World Bank: Washington, DC, USA, 2010; pp. 35–49. [Google Scholar]
- Tortajada, C.; Joshi, Y.K. Water Demand Management in Singapore: Involving the Public. Water Resour. Manag. 2013, 27, 2729–2746. [Google Scholar] [CrossRef]
- Tate, D.M. Water Demand Management in Canada: A Review and Assessment. Can. Water Resour. J. 1989, 14, 71–82. [Google Scholar] [CrossRef]
- Savenije, H.H.; Van der Zaag, P. Water as an Economic Good and Demand Management Paradigms with Pitfalls. Water Int. 2002, 27, 98–104. [Google Scholar] [CrossRef]
- What the Experts Think: Understanding Urban Water Demand Management in Canada. Available online: http://www.polisproject.org/files/pub_database/experts.pdf (accessed on 2 September 2015).
- Sharp, L. Water Demand Management in England and Wales: Constructions of the Domestic Water User. J. Environ. Plann. Man. 2006, 49, 869–889. [Google Scholar] [CrossRef]
- Blanke, A.; Rozelle, S.; Lohmar, B.; Wang, J.; Huang, J. Water Saving Technology and Saving Water in China. Agric. Water Manag. 2007, 87, 139–150. [Google Scholar] [CrossRef]
- Olmstead, S.M.; Stavins, R.N. Comparing Price and Nonprice Approaches to Urban Water Conservation. Water Resour. Res. 2009, 45, 1–24. [Google Scholar] [CrossRef]
- Sharma, S.K.; Vairavamoorthy, K. Urban Water Demand Management: Prospects and Challenges for the Developing Countries. Water Environ. J. 2009, 23, 210–218. [Google Scholar] [CrossRef]
- Kampragou, E.; Lekkas, D.F.; Assimacopoulos, D. Water Demand Management: Implementation Principles and Indicative Case Studies. Water Environ. J. 2011, 25, 466–476. [Google Scholar] [CrossRef]
- Smith, N.J.; McDonald, G.W.; Murray, C.F. The Costs and Benefits of Water Demand Management: Evidence from New Zealand. Water Environ. J. 2015, 29, 180–189. [Google Scholar] [CrossRef]
- Gleick, P.H.; Christian-Smith, J.; Cooley, H. Water-Use Efficiency and Productivity: Rethinking the Basin Approach. Water Int. 2011, 36, 784–798. [Google Scholar] [CrossRef]
- Molden, D.; Oweis, T.; Steduto, P.; Bindraban, P.; Hanjra, M.A.; Kijne, J. Improving Agricultural Water Productivity: Between Optimism and Caution. Agric. Water Manag. 2010, 97, 528–535. [Google Scholar] [CrossRef]
- Cai, X.; Molden, D.; Mainuddin, M.; Sharma, B.; Ahmad, M.U.D.; Karimi, P. Producing More Food with Less Water in a Changing World: Assessment of Water Productivity in 10 Major River Basins. Water Int. 2011, 36, 42–62. [Google Scholar] [CrossRef]
- Yang, Y.C.E.; Cai, X.; Stipanović, D.M. A Decentralized Optimization Algorithm for Multiagent System–Based Watershed Management. Water Resour. Res. 2009, 45, 1–18. [Google Scholar] [CrossRef]
- Tedesco, F.; Ocampo-Martinez, C.; Casavola, A.; Puig, V. Centralized and Distributed Command Governor Approaches for Water Supply Systems Management. IEEE Trans. Syst. Man Cybern. Syst. 2016, 48, 586–595. [Google Scholar] [CrossRef]
- Organization for Economic Cooperation and Development (OECD). Alternatives to Traditional Regulation. Available online: https://www.oecd.org/gov/regulatory-policy/42245468.pdf (accessed on 18 September 2018).
- Zhao, J.; Cai, X.; Wang, Z. Comparing Administered and Market-Based Water Allocation Systems Through a Consistent Agent-Based Modeling Framework. J. Environ. Manag. 2013, 123, 120–130. [Google Scholar] [CrossRef] [PubMed]
- Hahn, R.W.; Stavins, R.N. Economic Incentives for Environmental Protection: Integrating Theory and Practice. Am. Econ. Rev. 1992, 82, 464–468. [Google Scholar]
- Wang, L.; Fang, L.; Hipel, K.W. Mathematical Programming Approaches for Modeling Water Rights Allocation. J. Water Res. Plan. Man. 2007, 133, 50–59. [Google Scholar] [CrossRef]
- Brill, E.D.; Liebman, J.C.; ReVelle, C.S. Equity Measures for Exploring Water Quality Management Alternatives. Water Resour. Res. 1976, 12, 845–851. [Google Scholar] [CrossRef]
- Yaron, D.; Ratner, A. Regional Cooperation in the Use of Irrigation Water: Efficiency and Income Distribution. Agric. Econ. 1990, 4, 45–58. [Google Scholar] [CrossRef]
- Onal, H.; Algozin, K.A.; Isik, M.; Hornbaker, R.H. Economically Efficient Watershed Management with Environmental and Income Distribution Goals. J. Environ. Manag. 1998, 53, 241–253. [Google Scholar] [CrossRef]
- Kampas, A.; Mamalis, S. Assessing the Distributional Impacts of Transferable Pollution Permits: The Case of Phosphorus Pollution Management at a River Basin Scale. Agric. Econ. Rev. 2007, 7, 75–86. [Google Scholar]
- Xiao, Y.; Hipel, K.W.; Fang, L. Incorporating Water Demand Management into a Cooperative Water Allocation Framework. Water Resour. Manag. 2016, 30, 2997–3012. [Google Scholar] [CrossRef] [Green Version]
- Mahan, R.C.; Horbulyk, T.M.; Rowse, J.G. Market Mechanisms and the Efficient Allocation of Surface Water Resources in Southern Alberta. Socio-Econ. Plan. Sci. 2002, 36, 25–49. [Google Scholar] [CrossRef]
- Gupta, R.S. Hydrology and Hydraulic Systems, 4th Ed. ed; Waveland Press: Long Grove, IL, USA, 2016. [Google Scholar]
- Wang, L.; Fang, L.; Hipel, K.W. Basin-Wide Cooperative Water Resources Allocation. Eur. J. Oper. Res. 2008, 190, 798–817. [Google Scholar] [CrossRef]
- Young, H.P.; Okada, N.; Hashimoto, T. Cost Allocation in Water Resources Development. Water Resour. Res. 1982, 18, 463–475. [Google Scholar] [CrossRef]
- Tisdell, J.G.; Harrison, S.R. Estimating an Optimal Distribution of Water Entitlements. Water Resour. Res. 1992, 28, 3111–3117. [Google Scholar] [CrossRef]
- Lejano, R.P.; Davos, C.A. Cost Allocation of Multiagency Water Resource Projects: Game-Theoretic Approaches and Case Study. Water Resour. Res. 1995, 31, 1387–1393. [Google Scholar] [CrossRef]
- Owen, G. Game Theory, 3rd ed.; Academic Press: New York, NY, USA, 1995. [Google Scholar]
- Shapley, L.S. A Value for N-Person Games. In Contributions to the Theory of Games; Kuhn, H.W., Tucker, A.W., Eds.; Princeton University Press: Princeton, NY, USA, 1953; pp. 307–317. [Google Scholar]
- Wang, L.; Fang, L.; Hipel, K.W. Water Resources Allocation: A Cooperative Game Theoretic Approach. J. Environ. Inform. 2003, 2, 11–22. [Google Scholar] [CrossRef] [Green Version]
- Hipel, K.W.; Fang, L.; Wang, L. Fair Water Resources Allocation with Application to the South Saskatchewan River Basin. Can. Water Resour. J. 2013, 38, 47–60. [Google Scholar] [CrossRef]
- Nash, J. Two-Person Cooperative Games. Econometrica 1953, 21, 128–140. [Google Scholar] [CrossRef]
- Muthoo, A. Bargaining Theory with Applications; Cambridge University Press: Cambridge, UK, 1999. [Google Scholar]
- Macal, C.M.; North, M.J. Tutorial on Agent-Based Modelling and Simulation. J. Simul. 2010, 4, 151–162. [Google Scholar] [CrossRef]
- Bristow, M.; Fang, L.; Hipel, K.W. Agent-based Modeling of Competitive and Cooperative Behavior under Conflict. IEEE Trans. Syst. Man Cybern. Syst. 2014, 44, 834–850. [Google Scholar] [CrossRef]
- Xiao, Y.; Fang, L.; Hipel, K.W. Agent-Based Modeling Approach to Investigating the Impact of Water Demand Management. J. Water Res. Plan. Manag. 2018, 144, 04018006. [Google Scholar] [CrossRef] [Green Version]
Figure 1.
Network of the case study.
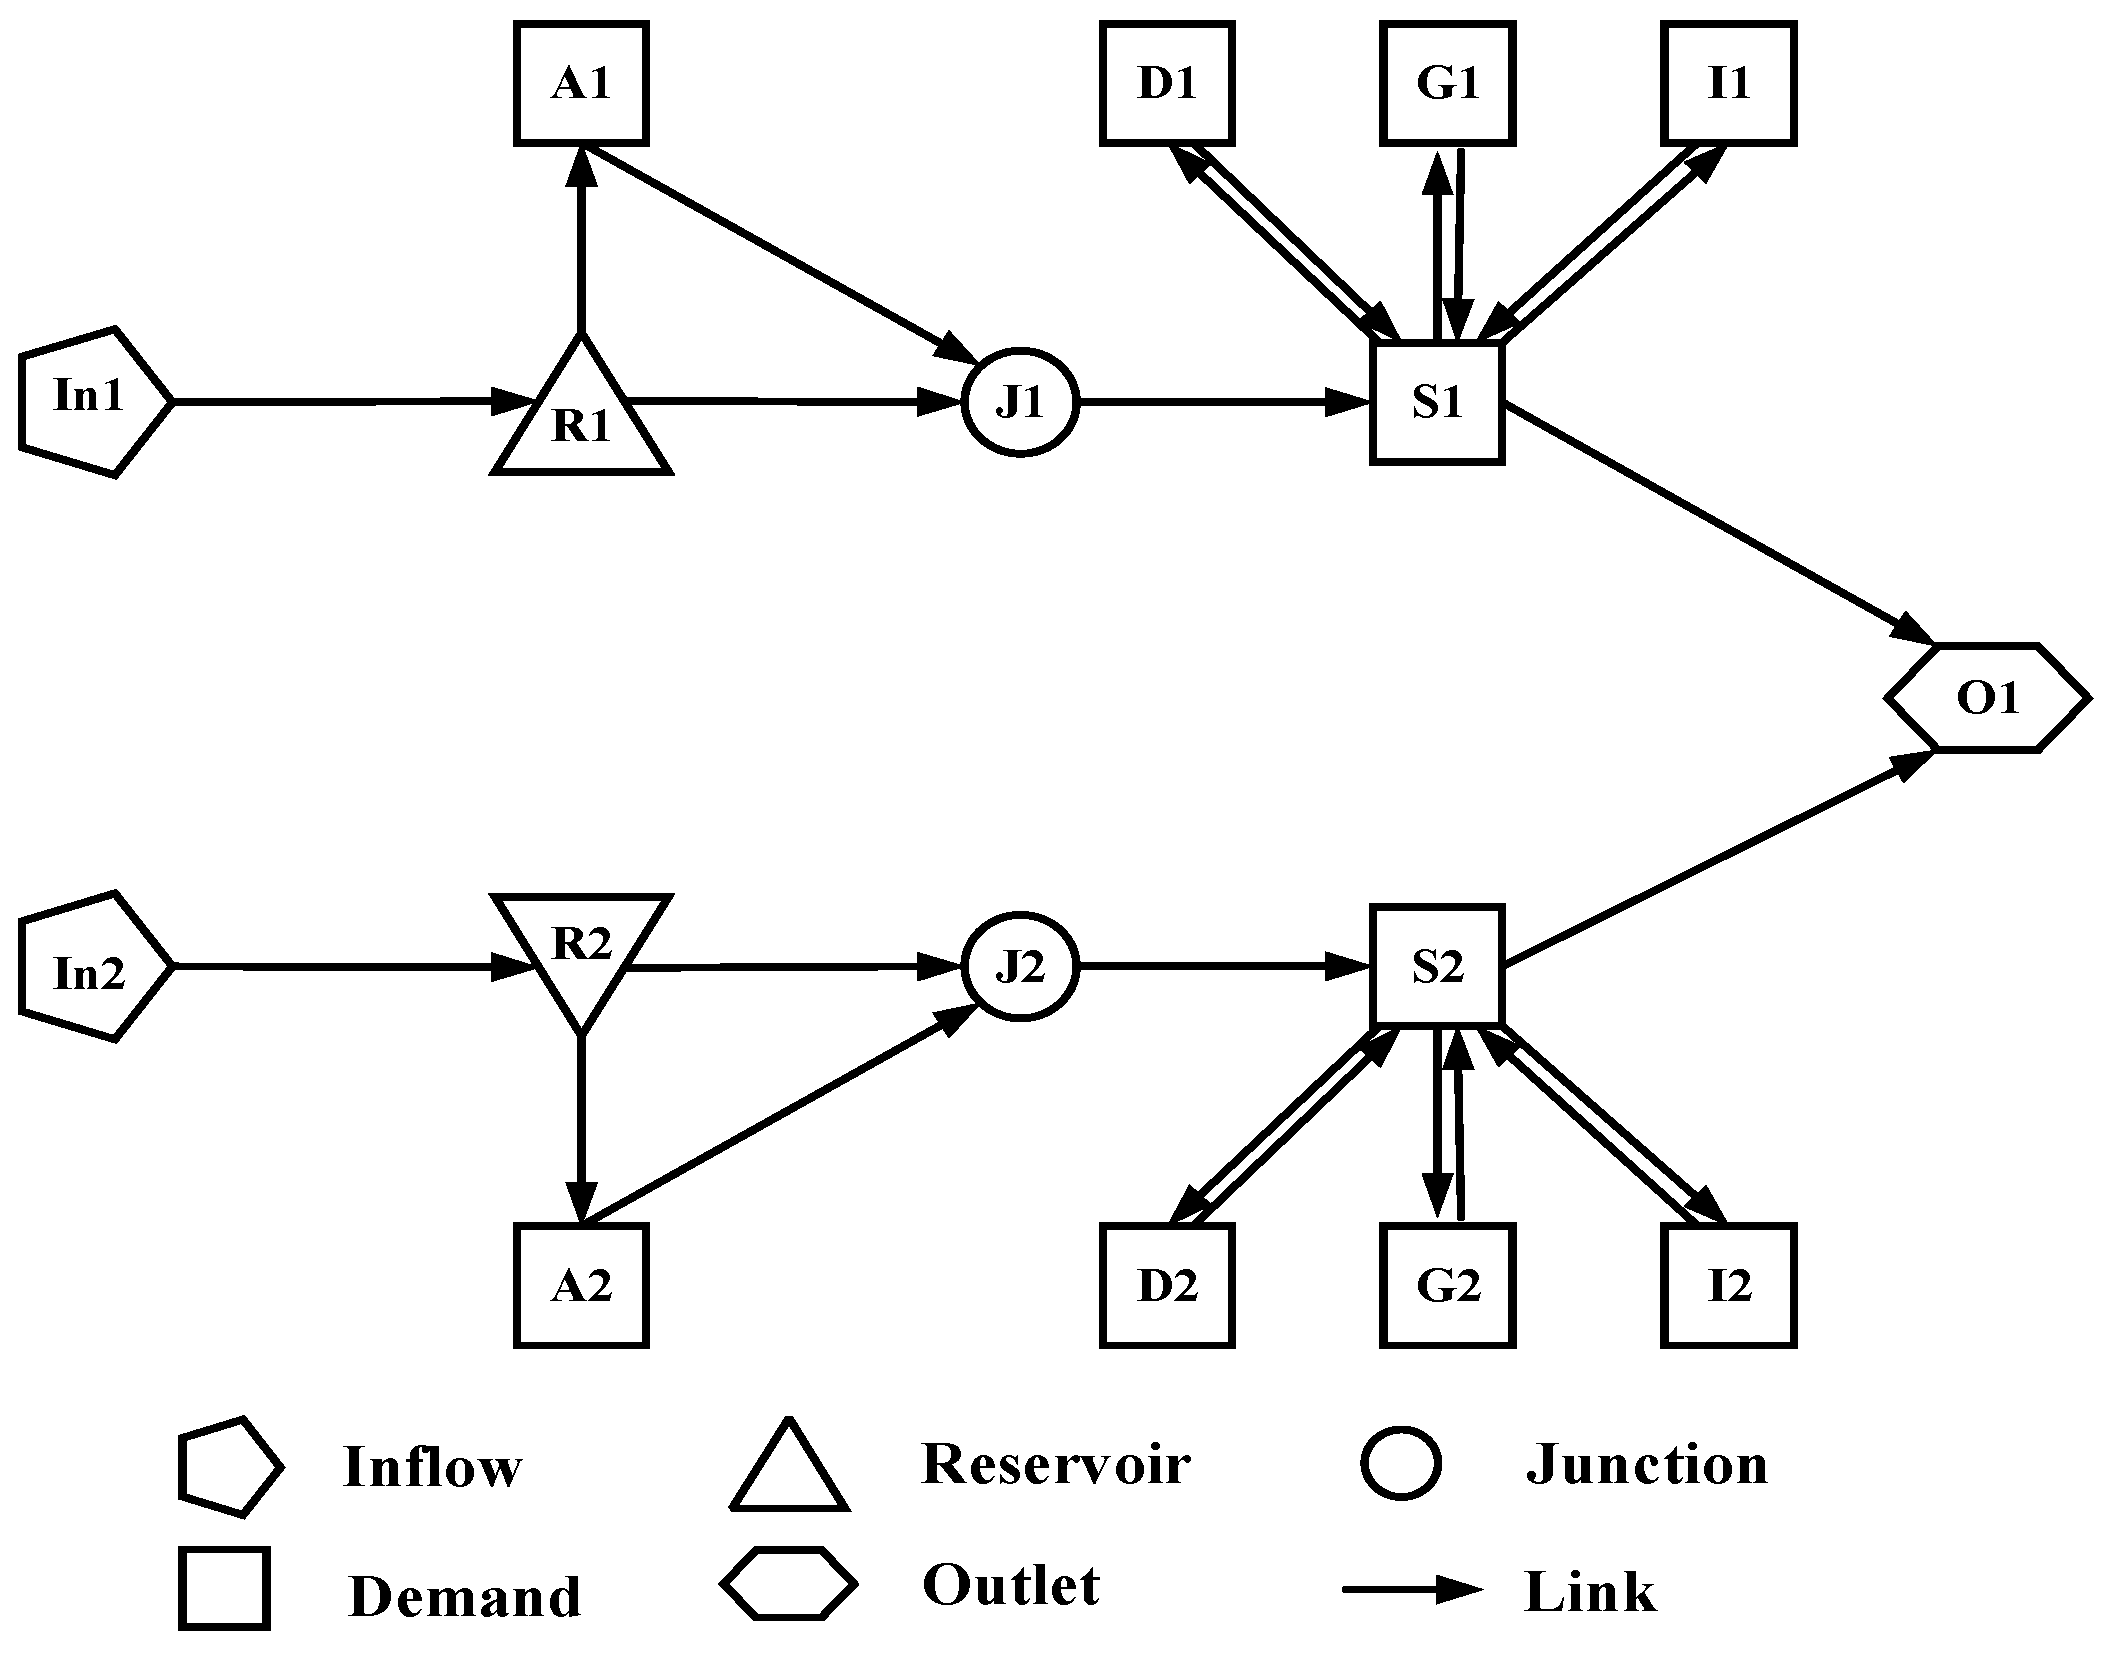
Figure 2.
Comparison of total net benefits from the centralized and decentralized approaches under scenarios of a series of levels of conservation.
Figure 2.
Comparison of total net benefits from the centralized and decentralized approaches under scenarios of a series of levels of conservation.
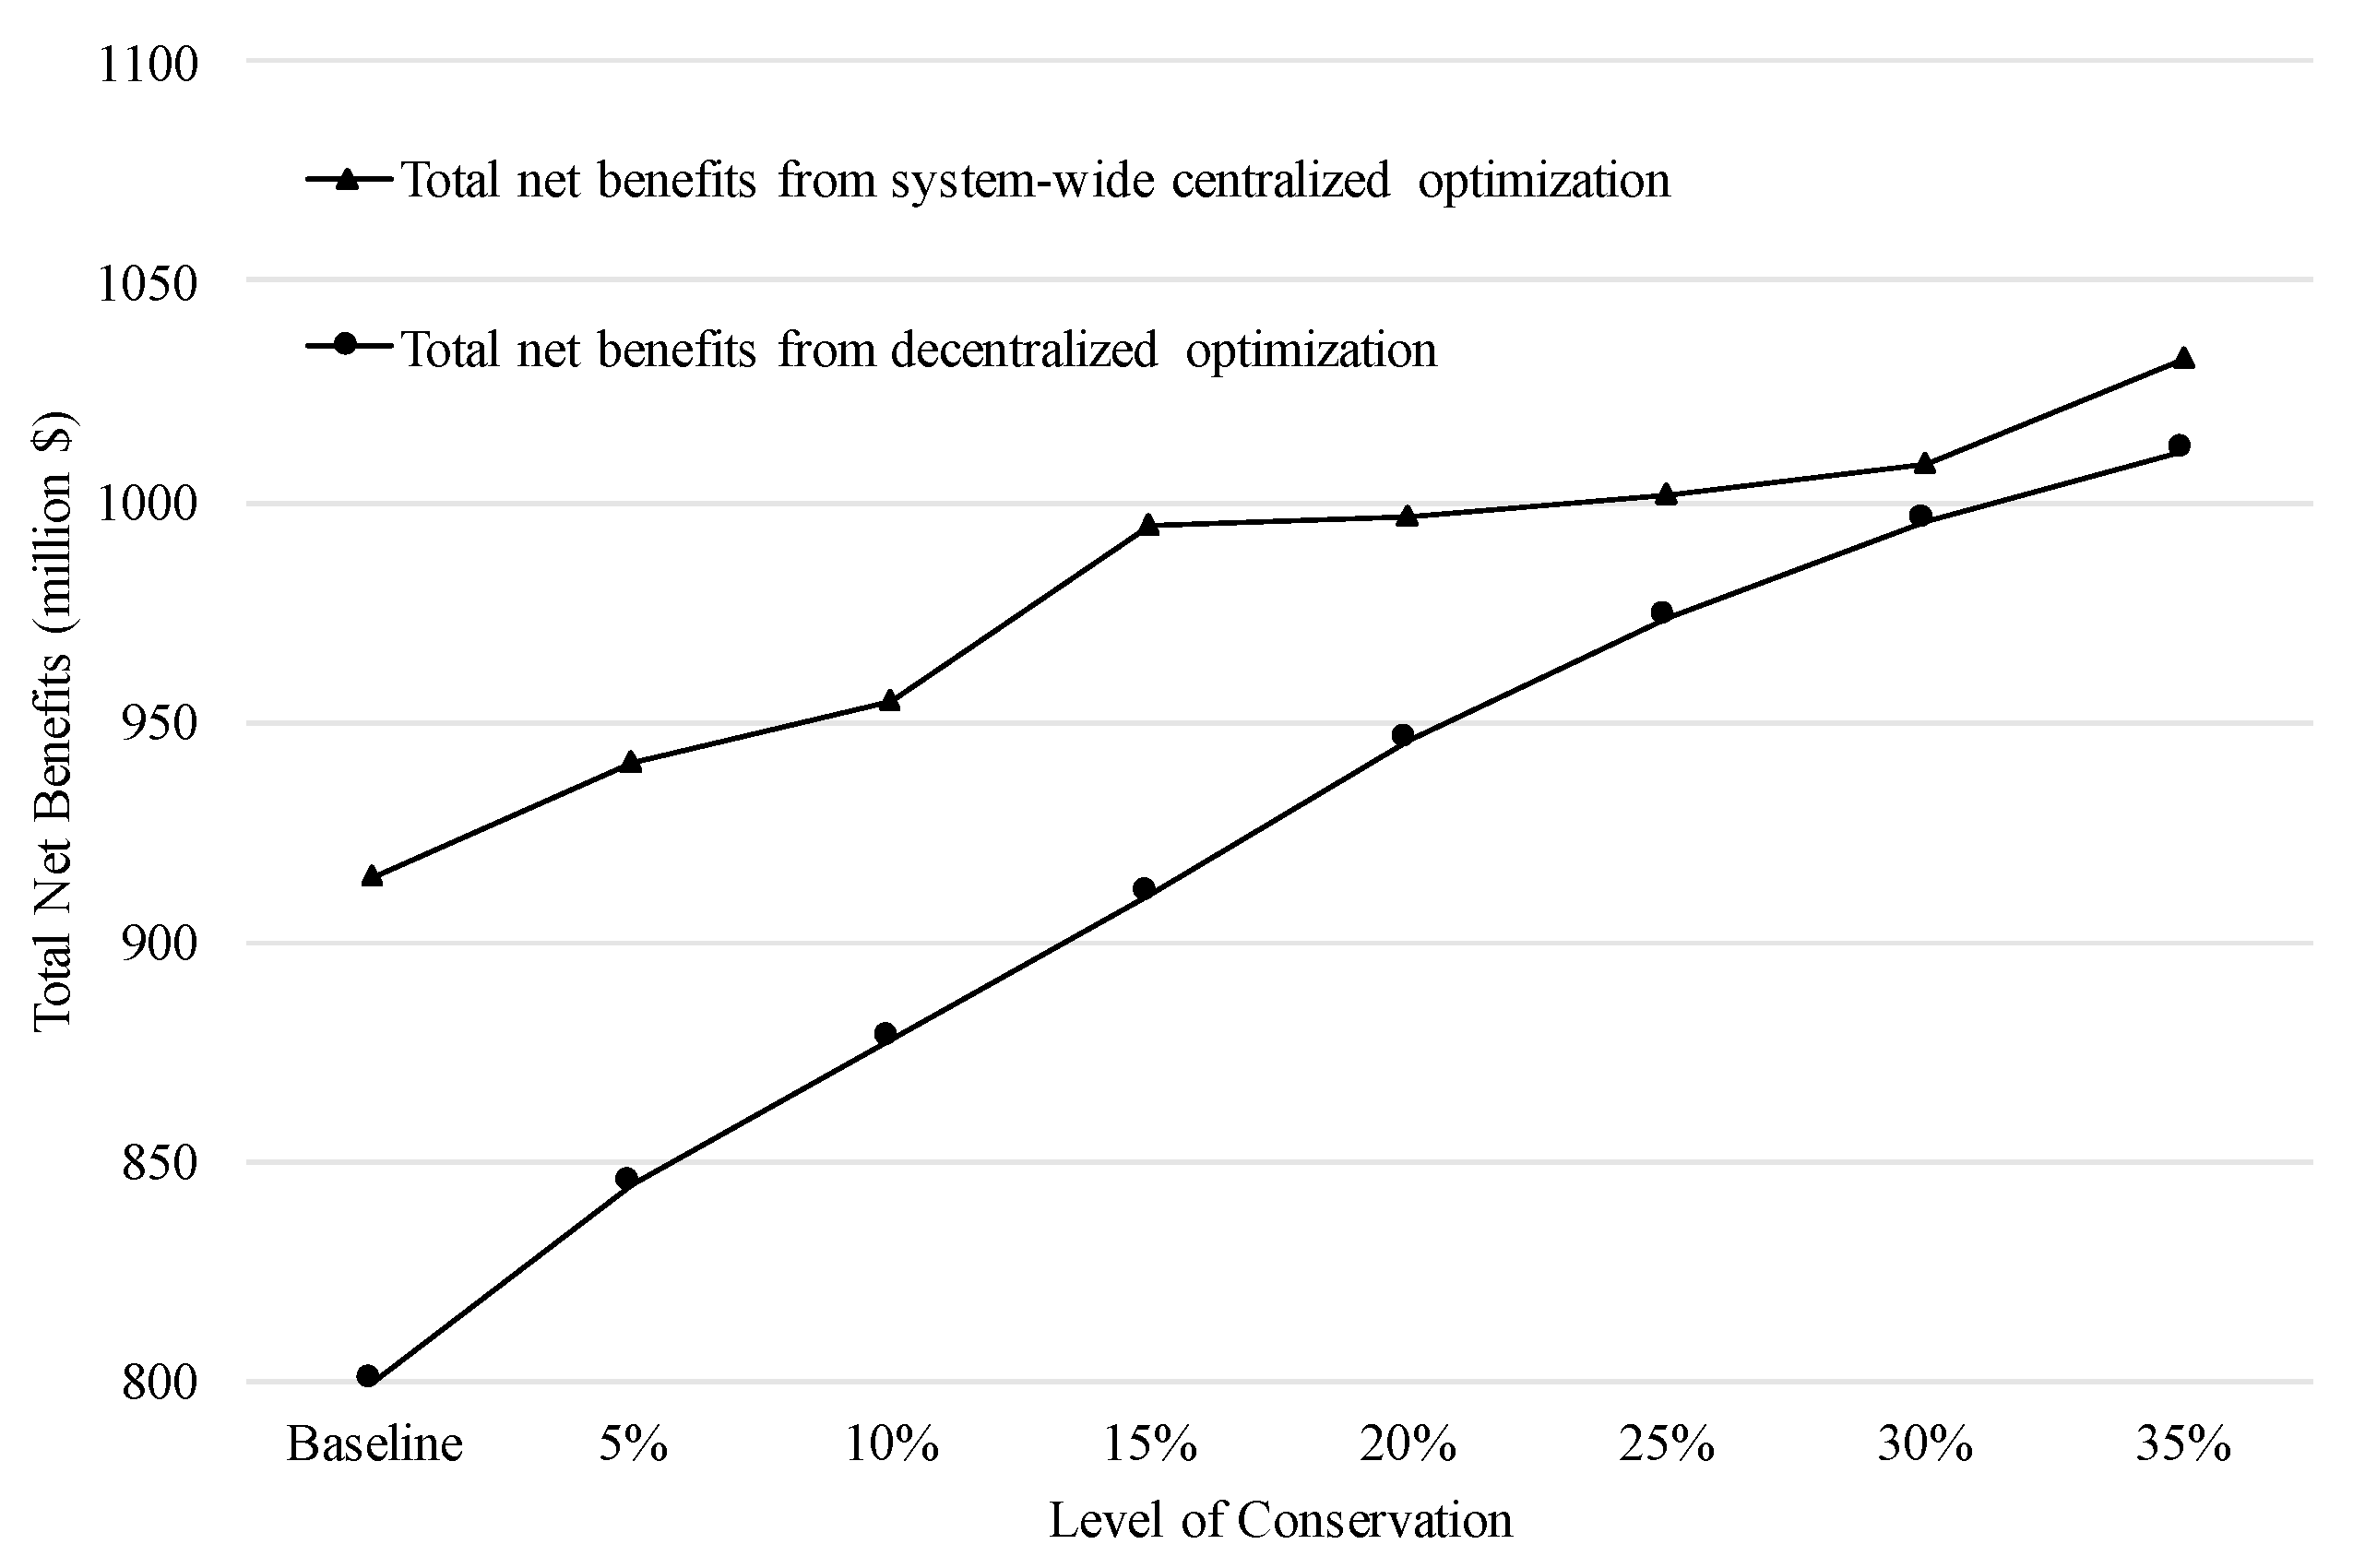
Figure 3.
Water consumption of each user group under scenarios of a series of levels of conservation from the (a) centralized and (b) decentralized approaches.
Figure 3.
Water consumption of each user group under scenarios of a series of levels of conservation from the (a) centralized and (b) decentralized approaches.
Figure 4.
Participation value for each user with the solution concepts of (a) Shapley value and (b) normalized nucleolus under scenarios of different levels of conservation.
Figure 4.
Participation value for each user with the solution concepts of (a) Shapley value and (b) normalized nucleolus under scenarios of different levels of conservation.

Figure 5.
Comparison of bargaining results with five cooperative solutions under the scenario of a 20% level of conservation.
Figure 5.
Comparison of bargaining results with five cooperative solutions under the scenario of a 20% level of conservation.
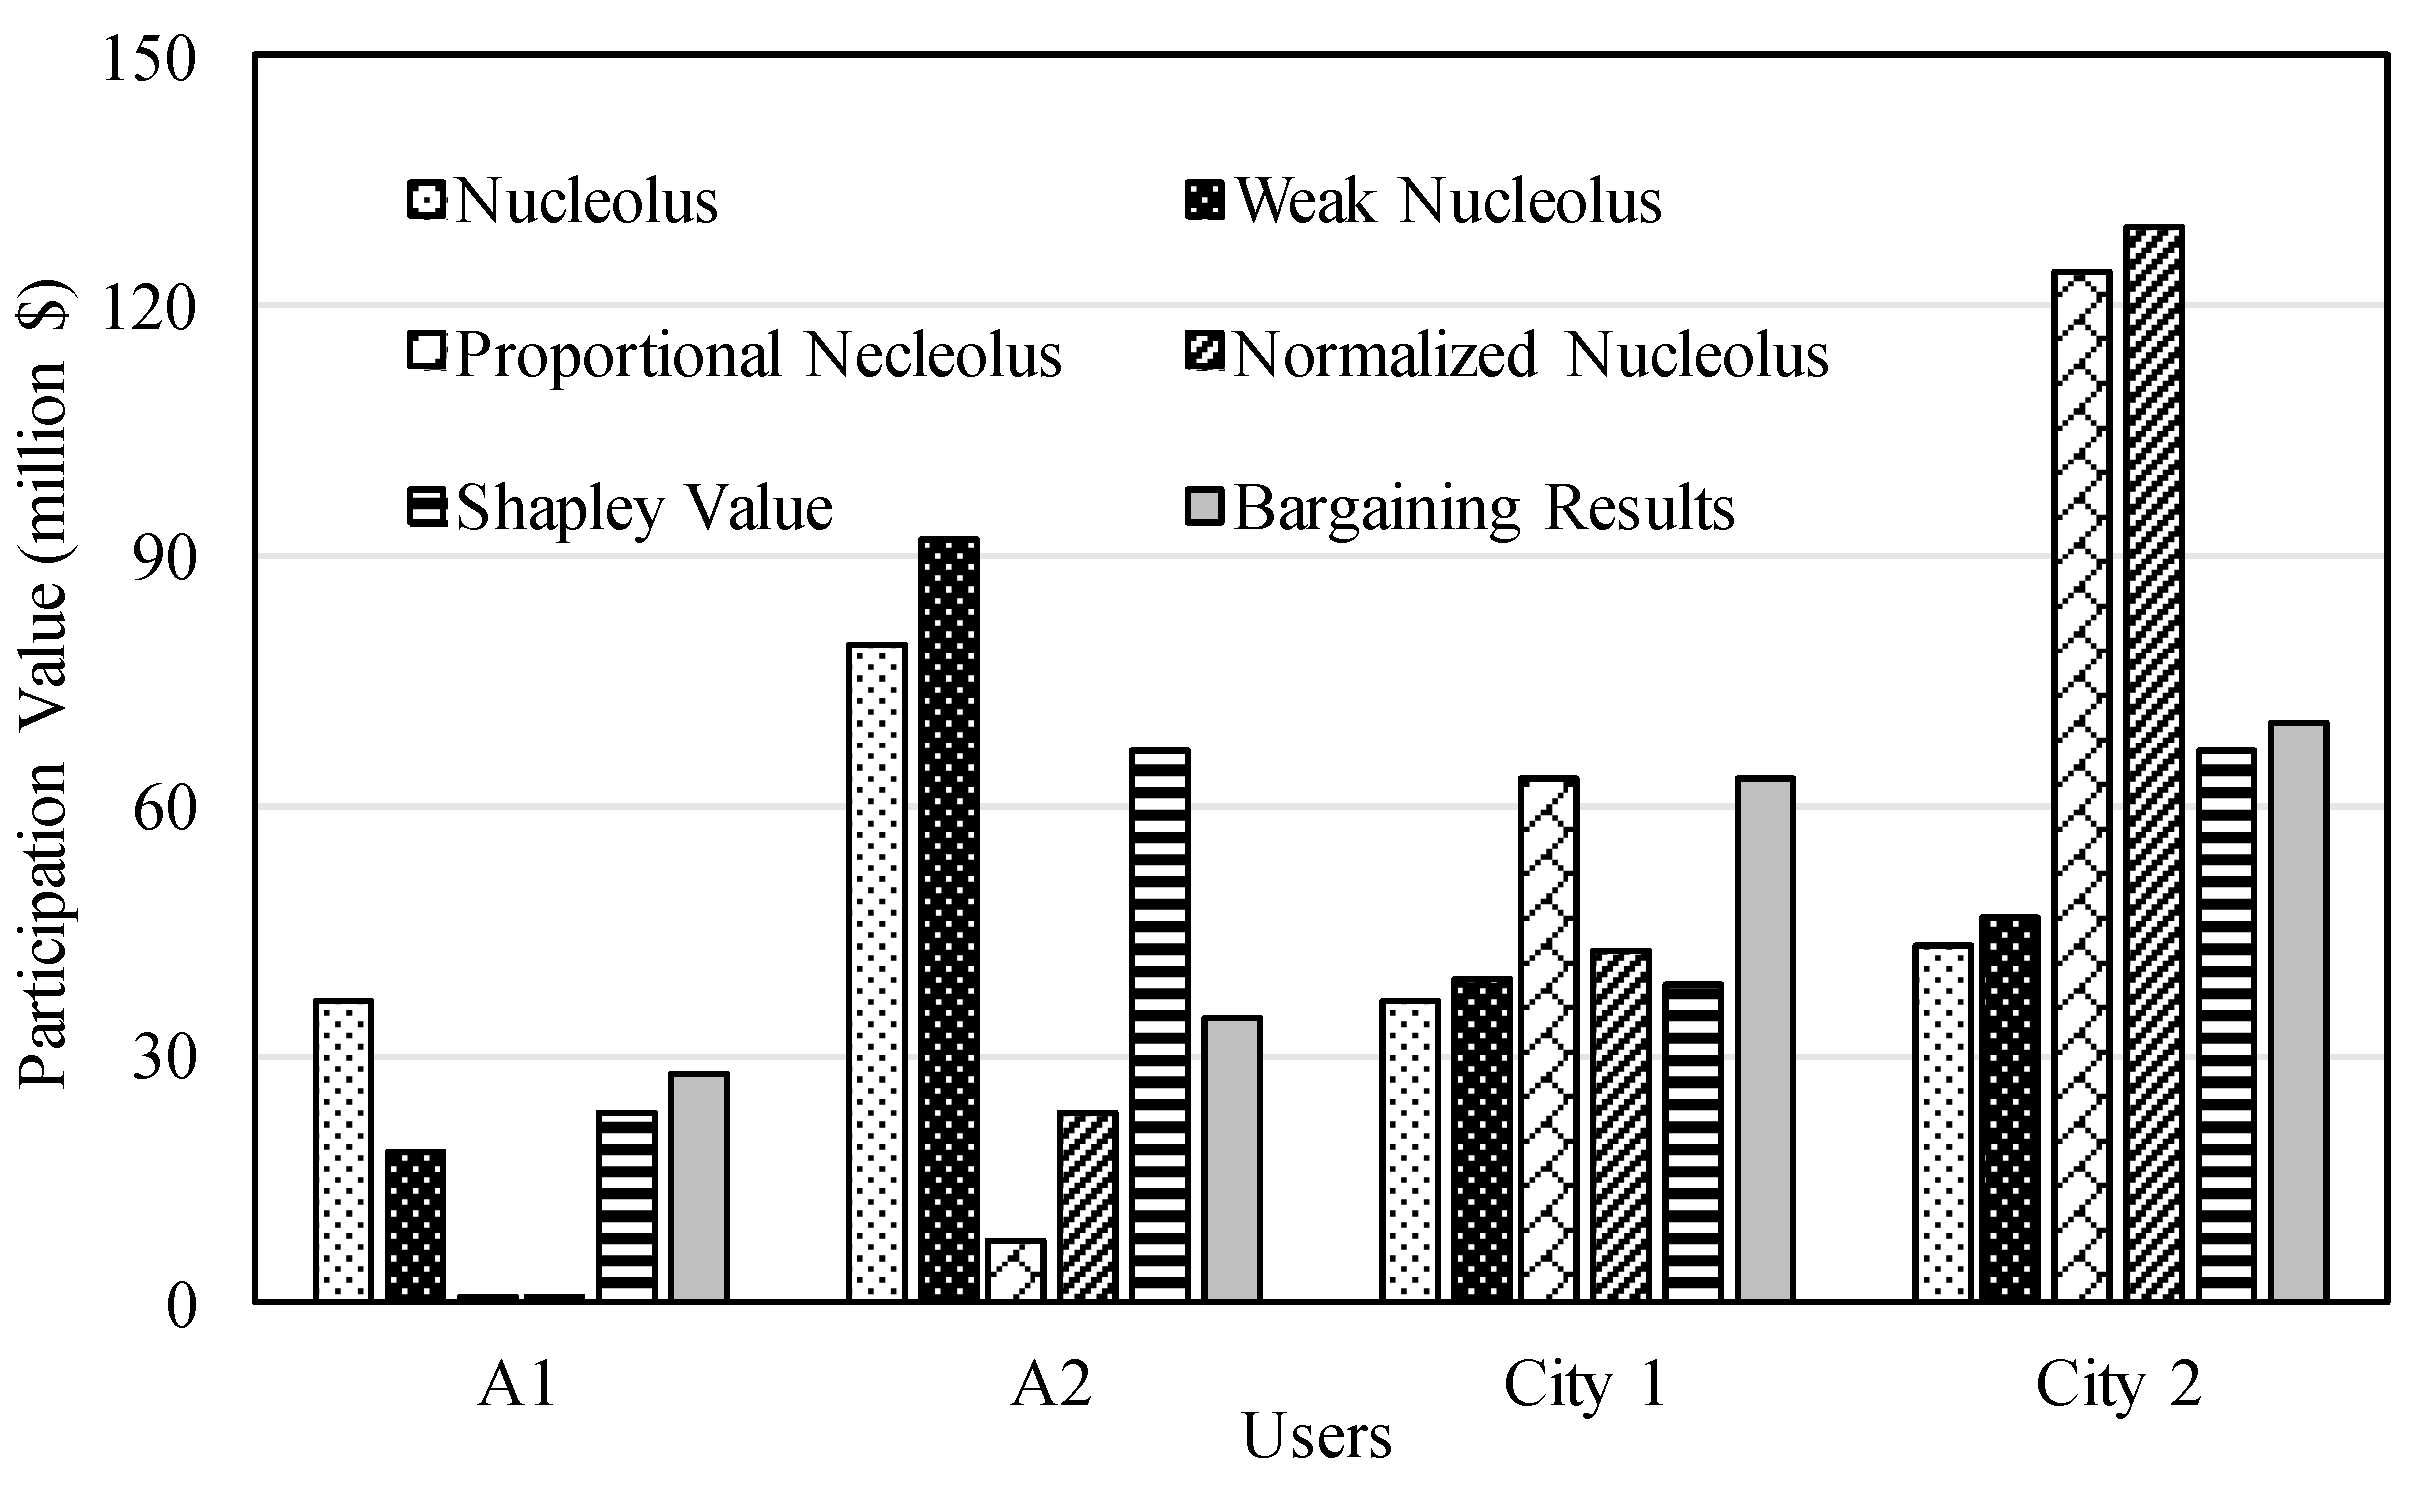
Figure 6.
Comparison of centralized and decentralized results of the participation value for each user under the scenario of a 20% level of conservation.
Figure 6.
Comparison of centralized and decentralized results of the participation value for each user under the scenario of a 20% level of conservation.

Table 1.
Comparison of key characteristics of centralized and decentralized approaches.
| Centralized Approach | Decentralized Approach | |
|---|---|---|
| Decision Process | Top-down Process/Command-and-Control | Bottom-up Procedure |
| Efficiency | More Efficient | Less Efficient |
| Information Exchange | Perfect Information Exchange | Partial Information Exchange |
| Public Participation | Low Participation | High Participation |
Table 2.
Overall net benefits for each user under the scenario of a 20% level of conservation from the centralized and decentralized approaches (million dollars).
Table 2.
Overall net benefits for each user under the scenario of a 20% level of conservation from the centralized and decentralized approaches (million dollars).
| A1 | A2 | City 1 | City 2 | Overall | |
|---|---|---|---|---|---|
| Centralized | 32.95 | 67.99 | 239.13 | 656.30 | 996.36 |
| Decentralized | 10.24 | 48.33 | 190.58 | 696.73 | 945.87 |
© 2018 by the authors. Licensee MDPI, Basel, Switzerland. This article is an open access article distributed under the terms and conditions of the Creative Commons Attribution (CC BY) license (http://creativecommons.org/licenses/by/4.0/).
Share and Cite
MDPI and ACS Style
Xiao, Y.; Fang, L.; Hipel, K.W. Centralized and Decentralized Approaches to Water Demand Management. Sustainability 2018, 10, 3466. https://doi.org/10.3390/su10103466
AMA Style
Xiao Y, Fang L, Hipel KW. Centralized and Decentralized Approaches to Water Demand Management. Sustainability. 2018; 10(10):3466. https://doi.org/10.3390/su10103466
Chicago/Turabian StyleXiao, Yi, Liping Fang, and Keith W. Hipel. 2018. "Centralized and Decentralized Approaches to Water Demand Management" Sustainability 10, no. 10: 3466. https://doi.org/10.3390/su10103466
Note that from the first issue of 2016, this journal uses article numbers instead of page numbers. See further details here.