Carbon Footprint of Milk from Pasture-Based Dairy Farms in Azores, Portugal


1
MARETEC—Marine, Environment and Technology Centre, LARSyS, Instituto Superior Técnico, Universidade de Lisboa, 1049-001 Lisboa, Portugal
2
Terraprima—Serviços Ambientais, Sociedade Unipessoal, Lda., 2135-199 Samora Correia, Portugal
*
Author to whom correspondence should be addressed.
Sustainability 2018, 10(10), 3658; https://doi.org/10.3390/su10103658
Submission received: 5 September 2018
/
Revised: 8 October 2018
/
Accepted: 9 October 2018
/
Published: 12 October 2018
(This article belongs to the Special Issue Livestock Production and Industrial Ecology)
Abstract
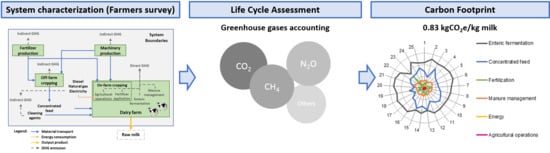
:The dairy sector is a major contributor to greenhouse gas emissions. Pasture-based dairy production is sometimes credited as environmentally friendlier but is less studied than more intensive production systems. Here we characterize and calculate the carbon footprint (CF), using life cycle assessment, of the “Vacas Felizes” pasture-based milk production system, in the Azores archipelago. Impacts were determined for multiple functional units: mass, energy and nutritional content, farm, area and animal. We performed multivariate analysis to assess the contribution of production parameters to the CF. Finally, we performed a literature review to compare these results with other production systems. Results show that emissions from enteric fermentation, concentrated feed production and (organic and mineral) fertilizer application are the three main sources of impact. Milk yield is a key production feature for the determination of emissions. The average CF is 0.83 kg CO2/kg raw milk. At each milk yield level, the farms are approximately homogeneous. Compared with other studies, “Vacas Felizes” milk has a lower CF than 80 (out of 84) published CFs and on average it is approximately 32% lower.
1. Introduction
The agri-food sector is responsible for a high share of global environmental impacts [1]. Livestock production, including feed production, is a major contributor to the world’s total greenhouse gas (GHG) emissions [2,3]. Within the livestock sector, milk production contributes 20% of total emissions. This share has increased by almost 40% in the last three decades and is expected to continue to grow [4].
One method widely used to assess these impacts is Life Cycle Assessment (LCA). This method assesses environmental impacts and resources used throughout the product supply chain [5,6]. LCA has been used in numerous agri-food studies, in order to identify environmental hotspots and possible solutions to mitigate environmental burdens [7,8,9,10]. Some of these studies focused on milk production in different regions of the world [11,12,13,14]. Most of these studies were conducted at farm level, that is, excluding the last phases of the product life (processing, transportation, disposal of packaging materials). These phases of the life cycle typically have a lower contribution to total product GHG emissions [15]. In general, the main sources of impact of agri-food products take place upstream or at the farm, for example, methane (CH4) and nitrogen oxide (N2O) emissions [2], fertilizer production and application [16] and energy use [7].
Milk production studies also assess options for impact reduction. One option in developed countries is to replace typical intensive animal feeding systems with pasture-based systems [17,18,19]. Pasture based-systems reduce concentrated feed consumption [20], which causes high indirect environmental impacts, mostly because cropland production impacts are allocated to feed ingredients [21,22]. In grazing systems for dairy cattle, animals are not confined most or all of the time and can move freely in and between farm pastures. Milk quality is an additional benefit of these systems, as they are reported to improve animal health and benefit milk characteristics by reducing fat content and increasing protein content [23,24]. Nevertheless, the performance of grazed dairy systems is crucially dependent on pasture quality and yield. Low quality pastures require fertilization for yield improvement and energy consumption for their management, which hampers the benefits from reduced life cycle emissions due to feed consumption [25].
The archipelago of Azores, Portugal, is an example of a region where pastures were traditionally used for animal feeding, mainly dairy production [26]. Permanent pastures in Azores are a defining element of a unique ecosystem in Europe. They have potentially higher yields than mainland rainfed pastures, due to their location in the North Atlantic Ocean and volcanic origin of soils, combined with a temperate oceanic climate and high rainfall [27]. The yield of spontaneous Azorean pastures is within the range of 5 and 7 t dry matter (DM)/ha.year, depending of the species. Sown pastures with mix of ryegrass and clovers can increase the yield of spontaneous grasslands by up to 2 t DM/ha.year [28]. Further, there is evidence that pasture-based milk production in Azores contributes to high standards of animal welfare [27]. Dairy cattle farming in the Azores evolved over time without the need for animal housing but this practice was increasingly lost due to the intensification of production. Nevertheless, due to its unique climatic conditions, most milk production in Azores involves some level of grazing.
The milk-producing company Bel Portugal introduced the “Vacas Felizes” (“Happy Cows,” in Portuguese) program, within the “Terra Nostra” brand, in 2016. This program aimed at ensuring the maximization of the positive effects of pasture-based milk from Azores. It involved the establishment of a set of guidelines for suppliers with two specific cornerstone attributes, among others linked to best practices and required conditions to produce milk: (a) maximize the amount of time animals spend on pasture and (b) maximize the fraction of fresh grass in their diet. The benefit of this system for animal welfare was acknowledged by the organization Compassion in World Farming, which granted the “Good Dairy Commendation Award” to the system. However, the environmental impacts of the system remain under-studied. There is no information in the literature regarding how the pastures are managed (e.g., fertilizer application and mechanical operations) and preserved. A GHG emissions assessment of this production system, including an assessment of how to optimize it, is missing. Given the uniqueness of the ecosystem where the program was implemented, Azorean pastures characterization and GHG assessment are welcome, in order to better understand the potential of the system [29].
This paper has four main objectives: (1) to characterize pasture-based milk production under the “Vacas Felizes” program, using data collected from a survey of 25 grazing dairy farms for 2015; (2) to calculate the carbon footprint of this production system, using an LCA approach; (3) to explore hotspots of impact and impact mitigation opportunities, using multivariate regression analysis; and (4) to compare and explain results against other LCA studies for milk production in the literature.
2. Materials and Methods
2.1. Characterization of the Production System in Azores
2.1.1. Study Region
In Portugal, there are many different milk production systems, ranging from the intensive, entirely confined production (typical in Mainland Portugal), to extensive grazing systems (typical in Azores) [30,31]. In the last three decades, milk production in Portugal doubled, reaching 2 million tons of milk in 2015. In Portugal, dairy productivity in 2013 reached a value of 7 tons of milk per cow, which is higher than the European Union average [31]. The dairy sector contributed about 0.6% to the 2015 Portuguese GDP (one third of which due to milk for consumption) [31]. The environmental performance of Portuguese milk production is under-studied, with only one study addressing intensive mainland milk production [32].
The Archipelago of Azores is one of the autonomous regions of Portugal. Azores consists of 9 islands of volcanic origin located in the North Atlantic Ocean, with a total land surface of 2325 km2. The mean annual temperature is 17 °C and rainfall ranges between 1500 and 3000 mm. Despite being less than 3% of the total area of Portugal, more than 30% of national milk production takes place in Azores. Milk also has an important contribution for the regional economy. The dairy sector is responsible for 8.5% of the gross value added in the region [31] and 20% of the milk consumed in Portugal is produced in Azores [33].
2.1.2. Sampled Farms
Between 7 November 2016 and 3 May 2017, the pasture-based dairy production system was characterized using a survey of 25 farmers involved in the “Vacas Felizes” program (approximately half of the farms in the program) from the island of São Miguel (the largest island in the Archipelago, part of the Eastern group of islands, cf. Figure 1). Each farmer was interviewed individually using the survey presented in full in the Supplementary Materials file S1 (in Portuguese). The data collected from the farmers included fertilizers (type and quantity), agricultural operations (type, machinery used and duration), number of cows in the farm, average weight per animal, housing time per day, concentrated feed consumption (type and quantity) and milk production (monthly or yearly production, number of lactations) and composition of the herd, including dry and replacement cows. The replacement rate was calculated dividing the number of steers with 6 months or more by the number of adult cows (milking and dry cows). Emissions were calculated for the totality of the herd regardless of their productive status. Energy, fat and protein content of “Vacas Felizes” milk varies with the farm and was one of the parameters obtained in the survey. Other materials used in the farm were included, namely fossil fuels (gasoline and diesel), natural gas, electricity and cleaning agents. Part of the information provided was based on declarations by farmers (e.g., application of organic fertilizer, number of hours worked in agricultural operations) and for a substantial part of the data additional documental evidence was presented, such as purchase receipts, for example for concentrated feeds, electricity and diesel. For all concentrated feeds ingredients, we collected the labels in order to obtain the lists of ingredients. Other activity data were obtained by the farmer knowledge and records, such fertilizer (inorganic and organic) application, seeds and number of hours of machine. Data was reported for one production year (January to December 2015). Due to anonymity restrictions, we designate each farm using a number between 1 and 25.
2.2. Carbon Footprint
To calculate the carbon footprint (CF), we used the data collected from the 25 farms and performed an LCA approach considering the total amount of GHG emissions associated with the product along the milk supply-chain.
2.2.1. Goal and Scope
The goal of this part of the study was to assess the carbon footprint of “Vacas Felizes” pasture-based milk production in each of the 25 farms sampled. We identify the weaknesses and the strengths of this production system and strategies with the purpose of mitigating the environmental burden. We used an attributional LCA approach [34], compliant with the standardized LCA framework [35,36]. We also followed the recommendations for LCA of ISO 14067:2013 [37] and for dairy products of the International Dairy Federation [38].
This work used a “cradle-to-gate” system boundary, that is, included the raw milk life cycle from the production of inputs until milk leaves the farm and excluding transport or processing of raw milk, as shown in Figure 2. All the materials and processes on-farm were considered, including forage and crop production, energy use, fuel and electricity use, manure and livestock management and associated emissions. Transportation of materials (concentrated feed and inorganic fertilizers) from mainland Portugal were also included. We tested six different Functional Units (FUs) and reference flows: 1 kg of raw milk, 1 L of raw milk, 1 kg of energy corrected milk (ECM) [39], 1 kg of fat and protein corrected milk (FPCM) [40], 1 cow (number of animals), per farm and 1 hectare of farm area.
As the farms are only dedicated to milk production, impacts were fully allocated to the functional units considered. We considered the co-production of steers sold for meat. In studies surveyed for comparison of results (Section 2.3), the average milk allocation factor was 88% (similar to the default of 85% suggested by IDF recommendations [38]). In the absence of economic or physical quantity data for the sales of steers and/or meat, we used the 88% allocation factor. “Vacas Felizes” farms are highly specialized in milk production, which justifies our choice of using a higher factor than recommended by IDF.
2.2.2. Life Cycle Inventory
Activity data used to build the life cycle inventory (LCI) were mainly obtained from the farm survey. The inventory for on-farm emissions from forage cultivation, pastures, manure management and enteric fermentation by cattle was adapted as recommended in the method set up for regionalized inventories by Morais et al. [41]. Considering the best available estimates applicable for the region of Azores, we used national-level data corresponding to the Intergovernmental Panel on Climate Change (IPCC) Tier 2 approach [42] applied in the Portuguese GHG National Inventory Report (NIR) [43] instead of using Tier 1 defaults. Tier 2 values from the NIR [43] are country-specific (i.e., the emission factors are applicable on average for Portugal). Methane emission sources were enteric fermentation and manure management. Nitrous oxide emission sources were inorganic fertilizer application in pastures and croplands, manure application and manure management. Finally, we included CO2 emissions due to urea and lime application. Regarding N2O emissions, we also used the Portuguese GHG NIR [43]. For inorganic fertilizers, we complemented data in the NIR with typical nitrogen content per type of fertilizer valid for fertilizers used in Portugal, using data from ADP [44].
During interviews, farmers provided the labels for all concentrate feeds used. These labels contain the analytical composition and the (unquantified) list of ingredients. When possible, we used this information to determine the amount of each ingredient in the feed. Each analytical analysis parameter (e.g., crude protein) of the concentrated feed is the sum of all nutritional contents of each ingredient weighted by the respective mass fraction in the feed. We thus obtained a system of equations (one for each nutritional component in the analytical composition) where the unknowns are the amount of ingredients in the feed. For the analytical composition of each ingredient we used data from Feedipidea [45]. The system could, nevertheless, only be solved or regressed for feeds where the number of ingredients is respectively equal to or less than the number of analytical composition indicators. For other feeds, the system is underdetermined and cannot be solved. So, we used the average of the cases we could calculate and applied this average to all 25 cases. We used this assumption because the list of ingredients and analytical composition of all feeds used in the 25 farms is quite similar.
Then, the GHG emissions of each ingredient were obtained from the Agribalyse database [46], which adapted data from ecoinvent 2.2 [47]. We also used Agribalyse for emissions associated with electricity production, agricultural operations, materials transportation and production of cleaning agents. To avoid double counting, we calculated the emissions from electricity and fuel production and consumption separately from agricultural operations. For these operations, we consider only the emissions from the production of the machinery needed allocated to the number of hours used. For the emissions from electricity production used in the farms, we updated the electrical mix using the Portuguese production mix for 2015 [48]. Regarding transport distances, we assumed that materials are transported from mainland Portugal to Azores, that is, approximately 1500 km, by boat. Activity data and unit processes selected from databases are shown in full as Supplementary Materials file S2.
2.2.3. Life Cycle Impact Assessment and Interpretation
The impact category selected in this study was global warming potential (GWP) for a time horizon of 100 years. The CF is expressed in kg of carbon dioxide equivalent (CO2e). The characterization model used was the IPCC Fourth Assessment Report [49], where factors to convert N2O and CH4 to CO2e were 25 and 298, respectively. We used the IPCC Fourth Assessment instead of the more recent Fifth Assessment Report [50] in other to compare results with studies in the literature. Most studies available resorted to the Fourth Assessment at the time the work was carried out. The major differences are the characterization factors for CH4 (25 instead of 28) and N2O (298 instead of 265). The LCA was carried out with the assistance of the software application OpenLCA 1.6.
To study how GWP is affected by farm characteristics, we used IBM SPSS 22 to adjust a multiple linear regression model to the data. We performed a multivariate linear regression where the dependent variable was GWP (kg CO2e/kg milk) per farm. The independent variables were concentrated feed (C, kg/milk produced) used, milking cows (MilkC, cow/milk), dry cows (DryC, cow/milk) and heifers (H, heifer/milk). Other potential variables, such as energy consumption at the farm, were omitted from the model for simplicity due to their low contribution to GWP. The multivariate linear regression model was
Considering the values that each variable can take and the regression coefficients αi, we obtained the variation range for each term. This analysis provided an assessment of the relevance of each variable to explain the differences in GWP between farms. For significant variables, we then repeated the multivariate regression with these variables (the stepwise regression method) and performed univariate regression to understand the differences between farms.
To test the effect of milk yield and size of the productive herd on emissions, we performed an additional regression analysis of the CF depending only on milk production (M) and emissions from milking cows (V1). This analysis involves the hypothesis that the contribution of dry cows and heifers for total emissions is small and assumes that milk production captures the effect of fertilization and concentrates (M). Thus, total emissions per farm were approximated using
which can be re-arranged as a univariate equation relating emissions intensity of milk with inverse milk yield,
To plot emissions intensity as a function of milk yield, this equation was re-written as
2.3. Comparison with the Literature
We compared results obtained with a comprehensive literature review of milk production LCA and carbon footprint studies. We considered only peer-reviewed studies, that is, journal and conference proceeding articles and excluded reports, master and PhD thesis and studies conducted by private companies unpublished in journals. We used the search engine Google Scholar and the keywords “Life cycle Assessment”/“Carbon footprint” +” Milk”/“Milk production”/“Dairy.” The search was carried out between 30 September 2016 and 10 November 2017.
We considered only articles between 2005 and 2017, to avoid including studies on production systems with out of date characteristics when compared with this study. We only assessed studies that report GWP (or similar nomenclature, for example, CF, climate change potential). When necessary, we converted GWP results to the characterization model in the IPCC Fourth Assessment Report [49]. We ignored articles were this conversion was necessary but impossible (e.g., because only CO2e results are reported and not discriminated by substance and therefore the conversion of characterization factors is impossible). We chose 1 kg of milk as FU to perform the comparison because it was the most common FU. Therefore, we additionally selected only studies with this FU or if it was possible to convert their results to this FU, to ensure comparability. For example, if the FU of a study was ECM, we only considered that study if it included data on fat and protein content. Regarding system boundaries, we considered only studies that reported “cradle-to-gate” results for comparison with the system boundaries of the present study.
Our assessment was not restricted to pasture-based systems, as we included studies depicting the emissions from milk production in any type of production system. We compared the results obtained for the “Vacas Felizes” production system with impacts for other studies per region (Portugal, Europe and world) and also according with the ratio between concentrated feed consumption and milk yield per cow (R ratio, kg concentrate/kg milk). The R ratio was used as proxy for types of production system on the basis of feed use. We calculated the R ratio for each study in the literature and divided their GWP between equally distributed classes of R ratio.
3. Results
3.1. Characterization of the Production System
Table 1 presents the results of the survey (mean, standard deviation, minimum and maximum of all farms) for the main variables. The complete data from all farms can be assessed in Supplementary Materials file S3. Stocking rate, concentrated feed per animal and milk yield consumption are the characteristics that vary the most. For farm outputs, milk production has the highest variation due to the disparate number of milking cows and their productivity. Milk characteristics, such as fat and protein content, do not vary significantly between farms. Note also that the only breed present in all farms is Holstein Friesian.
3.2. Carbon Footprint Analysis
We started by determining the GWP of concentrated feeds. Out of 83 feeds used in the 25 farms, we were only able to obtain the specific GWP for 3. Table 2 shows the unitary composition, assumed region of production and associated GWP of each ingredient present in the average concentrated feed (in only three concentrated feeds was it possible determine the amount of each ingredient in the feed)—which was used for the feeds with unknown ingredient composition. The GWP of this average feed is 0.64 kg CO2e/kg.
As seen previously, the characteristics of the farms varied considerably within the sample. Due to these differences in farm inputs and outputs, GWP results also vary significantly between farms.
The full breakdown of GWP per source of emissions for each of the 25 farms is shown in S3 of the Supporting Materials files. Table 3 presents the mean, minimum and maximum GWP of the 25 farms for six FUs, namely farm, farm area (ha), cow (number of animals), kg of milk, kg of ECM and kg of FCPM. Enteric fermentation, on average, is the main source of impact, with 46% of the impact on average (33–52%—Figure 3). However, it has the smallest standard deviation as percentage of the mean value (59%) for most FUs. This is because some of the sources are correlated, for example, unit emissions from enteric fermentation per cow are constant for all farms and therefore depend only of the number of cows. In this case, the variation observed in results is justified by the number of cows by farm (the grazing period does not change significantly among farms). The contribution of concentrated feeds has the highest variation between minimum and maximum values (16–37%, average: 27%—Table 3 and Figure 3). Despite the fact that average unit emissions indicated in Table 2 were used for most farms, the variability of feed consumption between farms causes the greatest standard deviation of the mean value (139%). The standard deviations of the other sources range between 62% (manure management: 10–19%, average: 15%) and 6% (cleaning agents) and are connected mostly to variation in usage at each farm. In spite of higher standard deviation, cleaning agents and energy consumption contribute only 4% to the total impact (on average). Energy, agricultural operations and cleaning agents never represent more than 8% of total impact (mean: 5%; min: 1%).
Results for farm-level and farm area FUs have higher between-farm standard deviations (Table 3). These results show that some FUs dilute the variability verified at the level of the source data, that is, when emission from concentrated feed consumption is higher the fertilizer application emission tends to be lower and vice-versa and therefore the final GWP is less variable than the inputs and outputs collected in the survey.
Table 4 presents the multivariate regression results, that is, coefficients value and units and respective p-value, which indicate coefficient significance. From the four independent variables, only concentrated consumption is not statistically significant as explanatory variables of GWP (at 5%). The Repeating the multivariate regression only with milking cows, dry cows and heifers (significant variables), the coefficients did not change significantly. The r-squared in both multivariate regressions is 0.78. Regarding the interval of variance of significant variables, obtained by multiplying the specific parameter by the range of values observed by the variable, milk yield is the variable with highest contribution to the total impact (between 0.17 and 0.55 kg CO2e/kg milk). The second highest contribution is from concentrated feed consumption, which ranges between 0.09 and 0.23 kg CO2e/kg milk.
Figure 4 shows the univariate dependency of the CF on milk yield per cow. We calculate the CF as a function of the inverse of milk yield but present it with milk yield in the x-axis. Therefore, the linear regression was depicted as a curve (represented in yellow). We did not consider farms 3 and 23 in the univariate regression. These farms are outliers as their CFs are 0.2 kg CO2e/kg milk higher above average. The r-squared is 0.59 (considering the two outliers it would drop to 0.44). The regression constant (0.45 kg CO2e/kg milk) can be interpreted as the life cycle emissions that cannot be eliminated by increasing milk yield (mainly from fertilizer application and concentrate use). The regression slope (i.e., the average emissions per additional milk unit) can be interpreted as the penalty for lack of full efficiency of the milking cows (i.e., an efficiency gap). This value (3352 kg CO2e/cow) is similar to the basal emissions of the milking cow (i.e., enteric methane and emissions from manure management), which are about 3872 kg CO2e/cow (considering the average grazing period—ranging between 18 and 21 h per day—for the emissions from manure management).
The most noticeable outliers where the CF is higher than predicted by its current milk yield are farms 3 and 23. Farm 3 has the highest consumption of concentrate feed of all farms (6.5 t/head yearly, or 0.61 kg/kg milk). Farm 23 is also among the highest consumers of concentrate as well as silage. The two farms that have by far the highest milk yield (Farm 10,13) have some of the lowest CFs. Farm 22 is the main outlier with lower emissions than expected given the univariate model for milk yield. Farm 22 has one of the lowest levels of feed consumption (0.36 kg/kg milk), as well as low levels of organic fertilization. The milk yield is highest in the farm 13 and the GWP has the greatest distance (downwards) to the regression line; this farm has the second highest concentrated feed consumption per milking cow (6042 kg/cow—similar consumption to Farm 10) but Farm 13’s milk yield is more than 3000 kg/cow higher (Farm 13: 15,800 kg milk/cow.year; Farm 10: 13,200 kg milk/cow.year) and lower number of dry cows and heifers (Farm 13: 39%; Farm 10: 49%).
3.3. Comparison with the Literature
We found a relatively small number of agri-food LCA studies on cow milk production that met our criteria (25 papers). However, some of those studies included multiple production systems (e.g., [51]), multiple farms/production countries (e.g., [11]) or even comparisons of different production systems in different countries (e.g., [15]). The sample used for comparison thus included 84 individual CFs, collected from the 25 studies. The full list of references, as well as the main production characteristics of the studies (concentrated feed consumption and milk productivity per cow, land area, number of cows and stocking rate) and related impact are included in the S3 file of the Supplementary Materials files.
Only one article was published for milk production in Portugal [32], as also observed by Morais et al. [52] in a revision of LCA studies in Portugal. Castanheira et al. [32] indicate an impact of 1.02 kg CO2e/kg milk, which is 23% higher than the “Vacas Felizes” production system. However, the production system is considerably different. It assumes similar concentrated feed consumption (about 2000 kg/cow), about three quarters of milk yield (~6 t/cow versus ~8 t/cow in our study), half the number of cows (53 cows versus 93 cows) but the main difference is farm area and associated stocking rate. The farm area considered in Castanheira et al. [32] is 20% less than in “Vacas Felizes” farms, while the stocking rate is three times higher. For Europe, we found 50 CFs in 13 studies. The average impact is 1.16 CO2e/kg milk (median 1.09 CO2e/kg milk), which is 40% higher than the “Vacas Felizes” production system. Average concentrated feed consumption and milk yield are lower, about 1600 kg/cow and 7400 kg/cow, respectively. Average land area and number of cows per farm are similar, 80 ha and 109 cows, respectively. However, stocking rate is about 50% higher. Taking into account all 25 studies, the average impact is 1.22 CO2e/kg milk (median 1.05 CO2e/kg milk), which is 50% higher, indicating that non-European production systems tend to have higher impacts. Average concentrated feed consumption and milk yield are similar to the European average and lower than the production system studied (concentrated feed consumption is 1650 kg/cow and milk yield is 7300 kg/cow). Average land area and number of cows are slightly higher than Europe’s average but clearly higher than the production system studied (land area: 86 ha and 123 cows). Regarding stocking rate, the global average is slightly lower than the European average but higher than the stocking rate of the production system studied.
Twenty-one studies (84%) included co-product allocation of the impacts. The average milk allocation factor is about 88% (minimum 63% and maximum 93%). Meat is the main co-product but also crop production (in two studies) and manure export (only one study). Economic allocation was the most used allocation method (about 90% of the studies which considered allocation) and it leads also to a higher allocation of impacts to milk (about 90%). Highly specialized farms in milk production (i.e., co-products are not determinant for the economic viability of farms) as are “Vacas Felizes” farms, had milk allocation factors of approximately 90%.
The heifer replacement rate is absent in a significant number of studies (7 CFs, in 3 studies [53,54,55]). In studies that included this rate in calculations, it was reported as a percentage of the herd and number of animals. In the studies which considered replacement, it ranges between about 5% (in highly specialized farms, for example, Guerci et al. [15]) and 40% of the herd. The replacement rate of the herd in “Vacas Felizes” is about 40%. There is only one exception, farm 3, where the replacement rate is 150% but which also produces cattle for meat. Only 3 studies (13 CFs) report the number of lactations per cow. The average number of lactations per animal in those studies is about 3. The study with the highest number of lactations (more than 3) per animal reports a low CF (average 0.99 kg CO2e/kg) [14]. The same study tested increasing the number of lactations per animal and discovered it led to a reduction in the CF of about 5% [14]. The other two studies report a lower number of lactations per animal (less than 3) [17,56] and higher CFs (average: 1.55 kg CO2e/kg). “Vacas Felizes” cows can have three or four lactations throughout their productive cycle.
Only four cases from four papers had lower CFs than the milk from Azores [12,15,56,57]. The first case is also pasture-based milk production in New Zealand [12], with a CF of 0.80 kg CO2e/kg, similar to “Vacas Felizes” milk. This is a more intensive system, with higher farm area 165 ha (average in this study is 74 ha) and also higher stocking rate, 2.7 cows/ha. In the New Zealand system, the animals eat more concentrated feed (about 6 t/animal/year). The milk yield is significantly lower, about 5000 kg milk/animal. Nevertheless, fertilizer application is almost inexistent. The second case is a very low-intensity production system in Germany [15]. In this farm, concentrated feed quantity per cow during a year is almost negligible. In this system, the animals are almost exclusively fed with grass and the fertilizer application is also almost negligible. This low level of inputs also leads to low milk output (5 t/animal/year). Land area in this farm is 19 ha and stocking rate is 1.1 LU/ha. The third case is an intensive milk production system in Brazil [57], with lower area and number of milking cows, 17 ha and 55 cows but significant higher stocking rate (3.2 cows/ha) and concentrated feed consumption (6 t/animal/year). The milk yield is similar (8000 kg milk/cow.year). The system is based on animal housing, with no inorganic fertilizer application, which leads to low N2O emissions from fertilization. The forth case is a highly intensive 71 ha farm in Canada [56]. The system is based on animal housing, with no inorganic fertilizer application, which leads to low N2O emissions from fertilization. Most of animal feed is produced in the farms and thus concentrated feed consumption is very low considering milk production per cow. Livestock density in this farm is 0.9 LU/ha.
The “Vacas felizes” production system R ratio is 0.28 kg/kg milk. The world average R ratio is 0.25 kg/kg milk, which means that, despite spending the vast majority of each day in the pasture, cows in Azores consume an above-average quantity of feed relative to milk production. Table 5 present an equal distribution of the studies reviewed per class of R ratio (only in 69 studies was it possible to calculate the R ratio). Production systems with extreme R ratios tend to have the highest GWP, while intermediary classes have the lowest GWP. “Vacas Felizes” milk is featured in the ]0.21 –0.37] class, which is the class with the lowest mean CF (1.11 CO2e/kg milk) and lower variation between minimum and maximum values.
4. Discussion
4.1. Main Sources of Impact and Uncertainty
Results show that the “Vacas Felizes” system produces milk with a lower than average CF. In this production system cows graze for almost the entire day (18–21 h per day). In such a system, emissions from excretions and enteric CH4 emissions are an important source of on-farm sources of CO2e (about 50% of the on-farm emissions). Total on-farm emissions (enteric fermentation, manure management, fertilizer application and agricultural operations) represent on average 72% of the total impact (49–92%). The multivariate regression confirmed that the animal emissions (mainly from milking cows) are the main predictor of the CF, which indicates that all farms use approximately the same inputs (concentrated feed and fertilizer), for each milking cow divided by the milk produced. Fertilizer application, energy consumption, agricultural operations and cleaning agents contribute on average only 16% of the total impact. Concentrate feed does contribute significantly to results but its effect is much smaller than the critical effect of yield. Nevertheless, there is evidence that cows are, in some farms, overfed or that pastures may be over-fertilized.
The most important assumption and limitation in this study was the use of national-level Tier 2 emission factors for these key sources of GHG emissions. In particular, we used the IPCC Tier 2 method as applied in the Portuguese GHG NIR [43] to calculate CH4 emissions, nitrogen excretion and ensuing N2O emissions from excreta and manure. This method requires the assumption that national-level emission factors are applicable for Azores and expectably introduce some uncertainty into results for the average of the 25 farms. Ideally, given the importance of direct emissions in the CF of the milk, Tier 3 models specific for these farms and breed of cows should be used instead—a crucial step that we recommend as future work. At this moment, our approach was a simplification necessary due to two main reasons. First, it was necessary for comparison purposes with other studies, as the goal of the paper was not only to calculate the CF of this particular system but also to compare it with other milk production systems. Other LCA studies on milk production rarely resort to Tier 3 modelling and as such this procedure would render this study methodologically incomparable with others. Second, there is an absence of available data for this system. There have been no studies analyzing, for example, pasture intake. The composition of the feed is essential to understand and calculate more accurately the amount of nitrogen excreted and also emissions. Those data should be a priority focus for future research on this system. We illustrate these limitations and their influence on our calculations in the following sub-sections.
4.1.1. Methane Emissions
We assumed a fixed factor for the calculation of enteric CH4 emissions but in reality, these emissions have been shown, for some breeds, to vary with feed and size. Pasture-based feed can help reduce enteric emissions [58], in particular when legumes are present [59]. Milking cows fed with legumes silage (e.g., alfalfa silage) tend to produce up to 16% less milk with up to 14% more enteric CH4 than cows fed with concentrated feed. These effects occur due to their shorter residence time in the rumen when compared with grasses [60,61]. Here, we also did not consider different enteric CH4 emissions according to cow size. Nevertheless, there is evidence that bigger cows emit more because of their higher feed intake requirements [62].
We used the IPCC (2006) [42] method adapted for Portugal [43] to calculate enteric CH4, which is 3% higher than the IPCC default (131.8 kg CH4/cow/year versus 128 kg CH4/cow/year). If we had used the IPCC default for enteric CH4 emissions the average impact would be 0.02 kg CO2e/kg milk lower, that is, 0.82 kg CO2e/kg milk. As characterization model for GWP, we used the IPCC Fourth Assessment report to maintain comparability with most of the literature. If we had used the IPCC Fifth Assessment Report [50] the average impact would be 0.04 kg CO2e/kg milk higher, that is, 0.87 kg CO2e/kg milk, mainly due to the increase in enteric fermentation emissions (due to the CH4 factor increase from 25 to 28), in spite of the significant reduction of the N2O factor (298 to 265), which leads to a reduction in direct GHG emissions from fertilizers application.
As future work, it will be relevant to use improved models for CH4 emissions beyond the IPCC approach, as the results presented here may possibly overestimate enteric emissions from Azorean cows. There are more advanced methods than the IPCC Tier 2 to calculate enteric CH4 depending on feeding strategy (e.g., IPCC method Tier 3 and Moraes et al. [63]). Nevertheless, these models should be applied carefully because CH4 emissions are a function of parameters that vary significantly between (a) pastures systems, such as pasture protein and fiber content; and (b) between animal breeds, such as body weight and metabolic efficiency (even considering the same breed, for example, for Holstein cows, the average weight in this study was 580 kg and for Williams et al. [64] it was 650 kg). Very specific Tier 3 models must be calibrated to farm conditions, meaning that models calibrated for one region should not be applied for others.
4.1.2. Nitrogen Emissions
Moving beyond the use of default or country-specific emission factors for N2O is equally advisable. More detailed modelling choices for the inventory are a better fit to the study region or production system specificities (e.g., terrain characteristics and climatic variables). This procedure can, however, make studies incomparable. For example, we could have replaced our approach of using the IPCC method to calculate N2O from faces and urine during grazing with a Tier 3 model if one was available for the Azores. As, to our knowledge, no such model has been developed, the only alternative would have been to use a model developed for a different region. There are several models frequently used in the literature, as for example for New Zealand [65,66,67]. New Zealand conditions are significantly different from the very specific Azorean climate and topography—two of the main factors influencing these emissions. The average annual precipitation in New Zealand ranges between 600 and 1600 mm [68], while the annual average precipitation in Azores ranges between 1500 and 3000 mm. A straightforward application of this model without any recalibration could provide substantially worse estimates of emissions that are even more uncertain than the simple use of emission factors. The N2O emissions in New Zealand if urine is deposited in low lands are 0.0099 kg N2O-N/kg N urine, while if the urine is deposited in high slope land the emission is 0.0032 kg N2O-N/kg N urine (less than half), according to Kelliher et al. [65]. These values are significantly lower than the IPCC default (0.02 kg N2O-N/kg N excreted). For Azores, it is at the moment unknown which of these estimates would be closer to the truth and for these reasons we opted for using the national-level Tier 2 emission factor.
4.1.3. Nitrogen Excretion
The most important factor influencing N2O emissions from excreta is not even the emission factor. The main contributor to N2O emissions is the amount of nitrogen excreted during the grazing period. Here too we used a nationally applicable Tier 2 excretion factor. We used nitrogen excretion per animal type calculated for cattle breads in Portugal (in Portuguese NIR for 10 different classes) instead of use IPCC default values (49 kg N/head.year for “non-dairy cattle”). The NIR values range between 25 kg N/head.year (for cattle classes with ages lower than 1 year) and 80 kg N/head.year (for adult “non-dairy cattle”).
The use of a per-head factor does not take into account key variables required to assess emissions, including some that we have showed here to be the key to explaining the environmental performance of farms (such as milk yield). Those parameters are, for example, animal feed (quantity, quality and type), animal assimilation and retention. Because the factor is constant per head, emissions are overestimated in farms where cows eat less feed (and have lower milk yield), as those animals are also likely to excrete less nitrogen than expected. On the other end of the farm spectrum, emissions are underestimated for farms where animals eat more feed. Improving the quality of the nitrogen excretion calculation should therefore be a priority in the future, for example using Tier 3 models dependent on the main parameters and variables that influence the quantity and the composition of the excreta.
One way to do so is using process-based models. For example, models based on dynamic energy budget (DEB) theory follow thermodynamic principles and take into account energy uptake, storage and utilization. They can relate, with a strong theoretical basis, feed intake (or its estimation) and the outputs in terms of milk production, excreta and emissions. A different modelling alternative to overcome this issue is to use simpler empirical models. One example of such models was applied in Germany [69]. At the moment, even the application of this model would require data that was not only unavailable to us but is also extremely difficult to collect and uncertain, such as nitrogen intake from pastures. Nitrogen is one of the chemical elements with higher variability in feeds. The nitrogen content of maize grain can range between 0.40% DM and 0.78% DM, for example. For other common concentrated feed ingredients, the variation can be even higher (depending on the ingredient, it can be as low as 0.39% DM or as high as 1.56% DM) [70]. Even more difficult is to know the nitrogen intake from pastures. That would require knowing the pasture intake in DM and also the grass species in the pasture and their respective chemical composition. At the moment, no such data is available—but given its importance, it should be a priority for the future. Pasture productivity is a key parameter to measure. These measurements are relevant for more than assessing the quantity of excreta—they could help farmers estimate the amount of grass available for cows and improve their management of herd feed.
Besides the fact that data for Tier 3 models was unavailable, the main reason to use the default value was to enable comparisons of results with other CFs, which in their majority use the same methodological approach. Producing better, higher tiered emission factors is certainly positive but would introduce a purely methodological difference in the CF calculated that would prevent us from making meaningful comparisons.
4.2. Indirect Sources of Emissions
In spite of the long grazing period (about 20 h per day), concentrated feed production and emissions due to its transportation contribute significantly to the impact of “Vacas Felizes” milk. The effect of concentrated feed consumption on the GWP of the milk is a subject of controversy in the scientific literature. Increased concentrated feed consumption has been proposed as a measure to reduce GHG emissions, as it also increases milk yield [71,72]. Farms with higher milk yield tend to produce low-GWP milk, as emissions are diluted by a larger quantity of output. However, other studies suggested that in some cases increasing milk yield does not necessarily result in reduced GHG emissions per kg of milk [19,73]. In our case, farms that used higher amount of concentrated feed were not necessarily the farms with higher milk yield and tend to lead to higher GHG emission per kg of milk. This result is hampered by high uncertainty regarding the impacts of the concentrate, which is the result of mainly two facts: (a) we did not have access to the full composition of the feeds and (b) the assumptions made for GWP calculation. Regarding the latter, we used GWP data from the Agribalyse database [46] for each ingredient production site and impact. For barley and wheat production we assumed local production and that the French barley and wheat production system are similar with Portuguese production systems. We assumed that palm kernel production is in Malaysia, which is one of the main sources of palm products for concentrated feed production in Portugal [74]. For barley and wheat, we did not consider transport between the production farm and the concentrate production facility. For palm kernel, the database considered sea transportation from Malaysia to France, which is not meaningfully different from transport to Portugal. We also used the Agribalyse database [46] for agricultural operations impact but in this case agricultural operations in Portugal and France can be assumed to be similar. Further, they represent a small weight on the total impact of milk production.
In our study, a short time frame for inventory data (only one year) was considered but we took into account the complete life cycle by considering the replacement animals. In this approach, we are not taking into account inter-year production variability on production characteristics (such milk yield) but we performed an intra-annual assessment. Nevertheless, the introduction of inter-year dynamics is relevant in such cases and future studies on milk production should ideally present a temporally discriminated analysis that extends over the entire life cycle of the animal.
We co-allocated impacts to meat production from steers leaving the system boundary. We used the average milk allocation factor of 88% (similar to the default of 85% suggested by IDF recommendations [38]). Many other studies use the same assumption [12,32,75], while others did not allocate some of the impact to beef calves [17,76,77]. If we had not allocated some of the impact to calves, the impact of “Vacas Felizes” milk would increase to 0.94 kg CO2e/kg milk. We also considered the emissions from the entire herd, including replacement heifers and dry cows. Some of the other studies did not consider herd replacement [53,54,55]. In other studies, focused on highly specialized milk production farms, the replacement rate is less than 10% (e.g., Guerci et al. [15]). The current average “Vacas Felizes” replacement rate is 40%. In spite of this high replacement rate, the effect of including herd replacement increased the CF by less than 15%. The optimum “Vacas Felizes” replacement rate would be about 27%, considering that “Vacas Felizes” cows can have four lactations throughout their productive cycle. We calculated the replacement rate assuming that all heifers in the farm, when the interview to the farmers was conducted, older than six months would be used to replace milking cows, which might not occur (e.g., these animals can be sold). In spite of the low weight of replacement animals in the total CF, reducing the gap between replacement verified and the optimum value represents a future improvement of the production system (which could reduce the CF by up to 5%).
As future work, the downstream stages of the milk life cycle could be included. While it is true that in most studies of milk for consumption a cradle-to-gate system is sufficient to characterize the most important life cycle stages, it is also true that “Vacas Felizes” milk is consumed mainly in Portugal mainland. Transportation from the processing facility in Azores to a storehouse and supermarket in mainland Portugal (about 1500 km sea transport) could be a relevant impact hotspot which is not assessed in our study. Inland transportation of materials to the farm and milk from the farm to processing facility and processing operations could also be relevant.
In this work, we used the average Portuguese electricity mix. What should be corrected in the future is that the electricity production mix for Azores should be obtained and used. Nevertheless, there is limited electricity use in these farms and results are unlikely to change substantially.
Even more important is to introduce new impact indicators in a future study. For agri-food products, impact indicators related with land use are especially relevant [78]. Several regionalized impact models are now available and widely recommended for biodiversity [79,80], biotic production potential [81,82] and other ecosystem services [83]. Freshwater eutrophication should be a priority as well, as fertilizer application is crucial in theses pastures and nitrogen leaching is a pressing environmental issue in Azores, negatively affecting water quality [84,85].
4.3. Take-Aways for Farm Management
The fact that milk yield is the only variable with a very significant (and negative) relationship with the CF does not automatically mean that, to decrease emissions, farmers should strive for improved yields in all farms. “Vacas Felizes” cows already produce above-average milk yields (“Vacas Felizes”: 9000 kg/cow.year; European average: 7000 kg/cow.year [31]). According to Gerber et al. [86] increasing yield is most effective in reducing emissions for yields below 2000 kg/cow.year. Increasing yields further from their current levels, if even possible given the metabolic efficiency of the animals, would require either increased yields in pasture feed (improved grasslands) or additional supplementation with concentrate, which would lead to cows’ size increment. Since that metabolic efficiency of the animals is close to the maximum possible, increment of feed intake would not be completely used to produce more milk but also to maintain the body weight. Increase cows body weight to produce more milk per cow could be an alternative but bigger cows also require higher feed intake. Thus, bigger cows produce more milk (which would lead to a CF reduction) but also produce more enteric methane because their feed intake is higher (which would lead to CF increase). Besides the emissions from the extra inputs, overfed cows or increasing their size to produce more milk produce more enteric methane [62]. There are also important ethical concerns regarding animal welfare related with overexploitation of cows for yield.
An additional potential indirect effect of increased yield would be the effect on the number of lactations, which could be decreased and thus produce an increase in the size of the herd. The number of cow lactations is an indicator of performance, with important influence on milk yield. In the Holstein breed, milk yield tends to decrease when the number of lactations increases from the third lactation [87]. However, a short number of lactations means that the cows must be replaced early on, which increases the average emissions per kg of milk throughout the life of the cow because of the costs with enteric fermentation, manure during grazing and feed in the early-stage non-productive period.
Other additional unmeasured parameters may also influence these results, particularly in the explanation for why some farms produce more than others. For example, animals have different metabolic efficiencies and good quality feed and pasture may be unavailable in some cases (e.g., lower quality grass in high-altitude farms). Andrade et al. [88] studied the Holstein Friesian breed (the same as in “Vacas Felizes” farms) and concluded that milk production can vary by about 500 kg milk/cow.year even for animals of the same age, condition and feed (in the same farm as well). A comprehensive analysis of Azorean pastures could help improve the understanding of the unique conditions provided by North Atlantic Ocean and volcanic-origin soils. Approaches such as coupled carbon and nitrogen mass balances [89,90] could assess GHG soil emissions/sinks that were not considered in this study (such soil organic carbon accumulation), as well as impacts on other environmental topics (e.g., N leaching and contribution to eutrophication). Pasture productivity, as mentioned before, is a key parameter to measure. One option to do so in the future is through direct measures (i.e., destructive methods of biomass estimation) or indirect measures (i.e., process-based models through optimization processes [91,92]). A particular relevant issue that can be optimized using this type of approaches is nitrogen fertilization. In the 25 farmers studied, the nitrogen fertilizer application is significantly high (high precipitation during all year leads to high soil nitrogen losses due nitrogen leaching) and due that a relevant source of N2O emissions. Further, optimizing nitrogen fertilizer application could lead to lower quantities applied without losing the high-yield pastures and through this effect also reduce GHG emissions due to fertilizer application.
Many assumptions used in this study, in their majority, point towards a conservative estimation of Azorean milk environmental performance, our results shown that this grazing dairy system is advantageous when compared with intensive systems in Portugal. But the comparison was made with only one study [32]. This comparison should be expanded but that exercise would require more studies. It is particularly important to compare this pasture-based system with organic dairy systems (both extensive and intensive), as these have been growing in importance during the last decade [93]. Nevertheless, we performed a comprehensive literature review of LCA studies focused on different aspects of milk production. We compared different management practices (e.g., pasture-based systems and systems based on concentrated feed and silage) and regions (e.g., European systems and North American systems). The main challenge in this exercise was to ensure comparability between studies that make different methodological and data choices.
5. Conclusions
The carbon footprint of pasture-based milk production is under-studied in Portugal. This study focused on the “Vacas Felizes” grazing dairy production system in Azores. For each kilogram of milk at farm gate, there was on average a corresponding total GHG emission of 0.83 kg CO2e. “Vacas Felizes” milk is responsible for approximately 32% less emissions than other production systems, independently of the production region.
The results highlight the significant contribution of GHG emissions from cows (enteric fermentation and manure management) and concentrated feed consumption but milk yield was the main explanatory variable for emissions, particularly life cycle emission. Farms with higher milk yield tended to have lower emissions but this study does not prescribe increasing milk yield as an environmental improvement measure. The increase from present levels of milk yield would produce side effects that could break its relationship with GHG emissions. Additionally, data availability limitations prevented us from considering the role of feed intake and milk yield on direct GHG emissions from enteric fermentation and nitrogen excretion. Constant Tier 2 per-head emission factors were used for all farms. In the future, it is important to calculate these emissions also as a function of milk yield, which will require measuring additional data for improved modelling (such as pasture intake).
Supplementary Materials
The following are available online at https://www.mdpi.com/2071-1050/10/10/3658/s1, S1 File: Survey form; S2 File: Activity data and Database data; S3 File: Carbon Footprint results and Comparison with the literature.
Author Contributions
T.G.M. performed the analysis and drafted the manuscript. N.R.R. was in charge of data collection. R.F.M.T. and T.D. conceived the study and provided methodological guidance. All authors contributed towards writing the paper.
Acknowledgments
The authors thank Bel Portugal for financial support to carry out the analysis and logistic support for data collection, particularly Eduardo Vasconcelos and Ana Arruda. This work was also supported by project Animal-Future—Steering Animal Production Systems Towards Sustainable Future, funded by the Horizon 2020 Program of the European Union (SusAn/0001/2016), by project ModelMeat—Modelo de Optimização de Ambiente e Qualidade do Produto para Serviços de Apoio à Competitividade dos Agentes da Fileira da Produção Animal Extensiva, funded by Portugal 2020 (nr. 017630) and by the EU LIFE Programme, through project LIFE Food & Biodiversity (LIFE15 GIE/DE/000737). T. Morais was supported by grant SFRH/BD/115407/2016 and R. Teixeira by grant SFRH/BPD/111730/2015 from Fundação para a Ciência e Tecnologia.
Conflicts of Interest
The authors declare no conflict of interest.
References
- Smith, P.; Martino, D.; Cai, Z.; Gwary, D.; Janzen, H.; Kumar, P.; McCarl, B.; Ogle, S.; O’Mara, F.; Rice, C.; et al. Greenhouse gas mitigation in agriculture. Philos. Trans. R. Soc. Lond. B. Biol. Sci. 2008, 363, 789–813. [Google Scholar] [CrossRef] [PubMed] [Green Version]
- Leip, A.; Weiss, F.; Wassenaar, T.; Perez, I.; Fellmann, T.; Loudjani, P.; Tubiello, F.; Grandgirard, D.; Monni, S.; Biala, K. Evaluation of the Livestock Sector’s Contribution to the EU Greenhouse Gas Emissions (GGELS)—Final Report; European Commission, Joint Research Centre: Ispra, Italy, 2010. [Google Scholar]
- Gerber, P.J.; Steinfeld, H.; Henderson, B.; Mottet, A.; Opio, C.; Dijkman, J.; Falculli, A.; Tempio, G. Tackling Climate Change Through Livestock: A Global Assessment of Emissions and Mitigation Opportunities; FAO: Rome, Italy, 2013; ISBN 9789251079201. [Google Scholar]
- FAO. Environmental Performance of Large Ruminant Supply Chains: Guidelines for Assessment; Livestock Environmental Assessment and Performance Partnership; FAO: Rome, Italy, 2016. [Google Scholar]
- Guinée, J.B. Handbook on life cycle assessment operational guide to the ISO standards. Int. J. Life Cycle Assess. 2002, 7, 311–313. [Google Scholar] [CrossRef]
- Hellweg, S.; Milà i Canals, L. Emerging approaches, challenges and opportunities in life cycle assessment. Science 2014, 344, 1109–1113. [Google Scholar] [CrossRef] [PubMed]
- Roy, P.; Nei, D.; Orikasa, T.; Xu, Q.; Okadome, H.; Nakamura, N.; Shiina, T. A review of life cycle assessment (LCA) on some food products. J. Food Eng. 2009, 90, 1–10. [Google Scholar] [CrossRef]
- Foster, C.; Green, K.; Bleda, M.; Dewik, P. Environmental Impacts of Food Production and Consumption; Final Report; Department for Environment Food and Rural Affairs: Manchester, UK, 2007. [Google Scholar]
- Notarnicola, B.; Hayashi, K.; Curran, M.A.; Huisingh, D. Progress in working towards a more sustainable agri-food industry. J. Clean. Prod. 2012, 28, 1–8. [Google Scholar] [CrossRef]
- Morais, T.G.; Teixeira, R.F.M.; Domingos, T. The effects on greenhouse gas emissions of sustainable intensification of meat production with rainfed sown biodiverse pastures. Sustainability 2018. under revision. [Google Scholar]
- Zucali, M.; Tamburini, A.; Sandrucci, A.; Bava, L. Global warming and mitigation potential of milk and meat production in Lombardy (Italy). J. Clean. Prod. 2017, 153, 474–482. [Google Scholar] [CrossRef]
- Chobtang, J.; Ledgard, S.F.; McLaren, S.J.; Zonderland-Thomassen, M.; Donaghy, D.J. Appraisal of environmental profiles of pasture-based milk production: A case study of dairy farms in the Waikato region, New Zealand. Int. J. Life Cycle Assess. 2016, 21, 311–325. [Google Scholar] [CrossRef]
- Christie, K.M.; Rawnsley, R.P.; Eckard, R.J. A whole farm systems analysis of greenhouse gas emissions of 60 Tasmanian dairy farms. Anim. Feed Sci. Technol. 2011, 166–167, 653–662. [Google Scholar] [CrossRef]
- Schader, C.; Jud, K.; Meier, M.S.; Kuhn, T.; Oehen, B.; Gattinger, A. Quantification of the effectiveness of greenhouse gas mitigation measures in Swiss organic milk production using a life cycle assessment approach. J. Clean. Prod. 2014, 73, 227–235. [Google Scholar] [CrossRef]
- Guerci, M.; Knudsen, M.T.; Bava, L.; Zucali, M.; Schönbach, P.; Kristensen, T. Parameters affecting the environmental impact of a range of dairy farming systems in Denmark, Germany and Italy. J. Clean. Prod. 2013, 54, 133–141. [Google Scholar] [CrossRef]
- Brentrup, F.; Pallière, C. GHG Emissions and Energy Efficiency in European Nitrogen Fertiliser Production and Use. In Proceedings of the International Fertiliser Society, Cambridge, UK, 11 December 2008; International Fertiliser Society: York, UK, 2008; pp. 1–15. [Google Scholar]
- O’Brien, D.; Shalloo, L.; Patton, J.; Buckley, F.; Grainger, C.; Wallace, M. A life cycle assessment of seasonal grass-based and confinement dairy farms. Agric. Syst. 2012, 107, 33–46. [Google Scholar] [CrossRef]
- Lehuger, S.; Gabrielle, B.; Gagnaire, N. Environmental impact of the substitution of imported soybean meal with locally-produced rapeseed meal in dairy cow feed. J. Clean. Prod. 2009, 17, 616–624. [Google Scholar] [CrossRef] [Green Version]
- Chobtang, J.; McLaren, S.J.; Ledgard, S.F.; Donaghy, D.J. Environmental trade-offs associated with intensification methods in a pasture-based dairy system using prospective attributional Life Cycle Assessment. J. Clean. Prod. 2017, 143, 1302–1312. [Google Scholar] [CrossRef]
- Nguyen, T.L.T.; Hermansen, J.E.; Mogensen, L. Environmental consequences of different beef production systems in the EU. J. Clean. Prod. 2010, 18, 756–766. [Google Scholar] [CrossRef]
- Opio, C.; Gerber, P.; Mottet, A.; Falcucci, A.; Tempio, G.; MacLeod, M.; Vellinga, T.; Henderson, B.; Steinfeld, H. Greenhouse Gas Emissions from Ruminant Supply Chains—A Global Life Cycle Assessment; Animal Production and Health Division, Ed.; Food and Agriculture Organization of the United Nations (FAO): Rome, Italy, 2013; ISBN 978-92-5-107945-4. [Google Scholar]
- Weidema, B.P.; Wesnae, M.; Hermansen, J.; Kristensen, I.; Halberg, N. Environmental Improvement Potentials of Meat and Dairy Products; Eder, P., Delgado, L., Eds.; Office for Official Publications of the European Communities: Luxembourg, 2008; Volume 23491. [Google Scholar]
- Bargo, F.; Muller, L.D.; Delahoy, J.E.; Cassidy, T.W. Milk Response to Concentrate Supplementation of High Producing Dairy Cows Grazing at Two Pasture Allowances. J. Dairy Sci. 2002, 85, 1777–1792. [Google Scholar] [CrossRef]
- Hills, J.L.; Wales, W.J.; Dunshea, F.R.; Garcia, S.C.; Roche, J.R. Invited review: An evaluation of the likely effects of individualized feeding of concentrate supplements to pasture-based dairy cows. J. Dairy Sci. 2015, 98, 1363–1401. [Google Scholar] [CrossRef] [PubMed]
- Baldini, C.; Gardoni, D.; Guarino, M. A critical review of the recent evolution of Life Cycle Assessment applied to milk production. J. Clean. Prod. 2017, 140, 421–435. [Google Scholar] [CrossRef]
- Cardoso, P.; Gaspar, C.; Borges, P.A.V.; Amorim, I.R.; Martins, A.F.; Maduro-Dias, F.; Porteiro, J.M.; Silva, L.; Pereira, F. Açores: Um retrato natural. In Azores: A Natural Portrait/Açores: Um Retrato Natural; Cardoso, P., Gaspar, C., Borges, P.A.V., Gabriel, R., Amorim, I.R., Martins, A.F., Maduro-Dias, F., Porteiro, J.M., Silva, L., Pereira, F., Eds.; Ver Açor: Ponta Delgada, Portugal, 2009; p. 235. ISBN 9898123169. [Google Scholar]
- Souto, L.F.; Meneses, J.F.; Bruce, J.M. Prediction of the energy balance and milk production of grazing cows in the Azores for autumn and spring calving. Biosyst. Eng. 2011, 110, 57–65. [Google Scholar] [CrossRef]
- Gomes, A. Performance of Lolium perenne with Trifolium repens, and spontaneous grasses with Trifolium repens, in Azores. In Grassland in a Changing World, Proceedings of the 23rd General Meeting of the European Grassland Federation, Kiel, Germany, 29 August–2 September 2010; Mecke Druck und Verlag: Duderstadt, Germany, 2010; pp. 952–954. [Google Scholar]
- Rodrigues, N.P.P.d.S.C. Influência da fertilizaçao azotada na produção, composição botânica e qualidade de pastagens na Ilha do Faial, Açores. Master’s Thesis, British International Studies Association, Aberystwyth, UK, 2010. [Google Scholar]
- Leitão, L.; Cameira, M.; Pato, R.; Costa, M.; Hortas, M.; D’Eça, P. Estudo de Caracterização do Impacte Ambiental da Produção Intensiva de Leite nas Regiões de Entre Douro e Minho e da Beira Litoral; PAMAF–Medida 4, acção 4.4.; Estudos Estratégicos. Projecto no. 442 992 056; FENALAC–Federação Nacional das Uniões de Cooperativas de Leite e Lacticínios: Valencia, Spain, 2001. [Google Scholar]
- INE Estatísticas da Produção e Consumo de Leite 2015; Instituto Nacional de Estatistica: Lisboa, Portugal, 2015.
- Castanheira, É.G.; Dias, A.C.; Arroja, L.; Amaro, R. The environmental performance of milk production on a typical Portuguese dairy farm. Agric. Syst. 2010, 103, 498–507. [Google Scholar] [CrossRef]
- SREA VAB por CAE—Valor Acrescentado Bruto. Available online: http://srea.azores.gov.pt/Reportserver?%2FRelatoriosVarios%2FMacroeconómicos-Valor+Acrescentado+Bruto&rs:Command=Render (accessed on 29 December 2017).
- Finnveden, G.; Hauschild, M.Z.; Ekvall, T.; Guinée, J.; Heijungs, R.; Hellweg, S.; Koehler, A.; Pennington, D.; Suh, S. Recent developments in Life Cycle Assessment. J. Environ. Manag. 2009, 91, 1–21. [Google Scholar] [CrossRef] [PubMed] [Green Version]
- International Organization for Standardization. ISO 14040 Environmental Management Life Cycle Assessment Principles and Framework; International Organization for Standardization: Geneva, Switzerland, 2006. [Google Scholar]
- International Organization for Standardization. ISO 14044 Environmental Management—Life Cycle Assessment—Requirements and Guidelines; International Organization for Standardization: Geneva, Switzerland, 2006. [Google Scholar]
- International Organization for Standardization. ISO 14067:2013 Greenhouse Gases—Carbon Footprint of Products—Requirements and Guidelines for Quantification and Communication; International Organization for Standardization: Geneva, Switzerland, 2013. [Google Scholar]
- International Dairy Federation (IDF). Bulletin of the IDF N° 479/2015: A Common Carbon Footprint Approach for the Dairy Sector—The IDF Guide to Standard Life Cycle Assessment Methodology; International Dairy Federation (IDF): Brussels, Belgium, 2015. [Google Scholar]
- Sjaunja, L. A Nordic proposal for an energy-corrected milk (ECM) formula. In Proceedings of the 27th Biennial Session of the International Committee for Animal Recording (ICAR), Paris, France, 2–6 July 1990. [Google Scholar]
- International Dairy Federation (IDF). Environmental/Ecological impact of the dairy sector: Literature review on dairy products for an inventory of key issues, list of environmental initiatives and influences on the dairy sector. In Bulletin of the International Dairy Federation 436; International Dairy Federation (IDF): Brussels, Belgium, 2009. [Google Scholar]
- Morais, T.G.; Teixeira, R.F.; Domingos, T. A step toward regionalized scale-consistent agricultural life cycle assessment inventories. Integr. Environ. Assess. Manag. 2017, 13, 939–951. [Google Scholar] [CrossRef] [PubMed]
- The Intergovernmental Panel on Climate Change (IPCC). 2006 IPCC Guidelines for National Greenhouse Gas Inventories. Institute for Global Environmental Strategies (IGES) for the Intergovernmental Panel on Climate Change; IPCC: Kanagawa, Japan, 2006. [Google Scholar]
- APA. Portuguese National Inventory Report on Greenhouse Gases, 1990–2018; Portuguese Environmental Agency (APA): Amadora, Portugal, 2018. [Google Scholar]
- ADP Fichas de Especificação. Available online: http://www.adp-fertilizantes.pt/templates/template5.aspx?M=120&F=23&L=24 (accessed on 25 July 2017).
- INRA; CIRAD; AFZ; FAO. Feedipedia—Animal Feed Resources Information System. Available online: http://www.feedipedia.org/content/feeds?category=13594 (accessed on 25 July 2017).
- ADEME. AGRIBALYSE®: Rapport Méthodologique–Version 1.0; ADEME: Angers, France, 2013. [Google Scholar]
- Frischknecht, R.; Jungbluth, N.; Althaus, H.-J.; Doka, G.; Dones, R.; Heck, T.; Hellweg, S.; Hischier, R.; Nemecek, T.; Rebitzer, G.; et al. The ecoinvent Database: Overview and Methodological Framework. Int. J. Life Cycle Assess. 2005, 10, 3–9. [Google Scholar] [CrossRef]
- REN. Technical Report 2016; Rede Eletrica Nacional: Lisbon, Portugal, 2016. [Google Scholar]
- IPCC. IPCC Fourth Assessment Report. Climate Change 2007. Working Group I: The Physical Science Basis. Available online: http://www.ipcc.ch/publications_and_data/ar4/wg1/en/ch2s2-10-2.html (accessed on 20 May 2006).
- Myhre, G.; Shindell, D.; Bréon, F.-M.; Collins, W.; Fuglestvedt, J.; Huang, J.; Koch, D.; Lamarque, J.-F.; Lee, D.; Mendoza, B.; et al. Anthropogenic and Natural Radiative Forcing. In Climate Change 2013: The Physical Science Basis. Contribution of Working Group I to the Fifth Assessment Report of the Intergovernmental Panel on Climate Change; Cambridge University Press: Cambridge, UK; New York, NY, USA, 2013; pp. 659–740. [Google Scholar] [CrossRef]
- Van der Werf, H.M.G.; Kanyarushoki, C.; Corson, M.S. An operational method for the evaluation of resource use and environmental impacts of dairy farms by life cycle assessment. J. Environ. Manag. 2009, 90, 3643–3652. [Google Scholar] [CrossRef] [PubMed]
- Morais, T.G.; Teixeira, R.F.M.; Domingos, T. Regionalization of agri-food life cycle assessment: A review of studies in Portugal and recommendations for the future. Int. J. Life Cycle Assess. 2016, 21, 875–884. [Google Scholar] [CrossRef]
- Basset-Mens, C.; Ledgard, S.; Carran, A. First Life Cycle Assessment of Milk Production from New Zealand Dairy Farm Systems. In Proceedings of the Australia New Zealand Society for Ecological Economics Conference, Palmerston North, New Zealand, 11–13 December 2005; pp. 258–265. [Google Scholar]
- Basset-Mens, C.; Ledgard, S.; Boyes, M. Eco-efficiency of intensification scenarios for milk production in New Zealand. Ecol. Econ. 2009, 68, 1615–1625. [Google Scholar] [CrossRef]
- Soltanali, H.; Emadi, B.; Rohani, A.; Khojastehpour, M.; Nikkhah, A. Life Cycle Assessment modeling of milk production in Iran. Inf. Process. Agric. 2015, 2, 101–108. [Google Scholar] [CrossRef]
- Mc Geough, E.J.; Little, S.M.; Janzen, H.H.; McAllister, T.A.; McGinn, S.M.; Beauchemin, K. A Life-cycle assessment of greenhouse gas emissions from dairy production in Eastern Canada: A case study. J. Dairy Sci. 2012, 95, 5164–5175. [Google Scholar] [CrossRef] [PubMed]
- De Léis, C.M.; Cherubini, E.; Ruviaro, C.F.; Prudêncio da Silva, V.; do Nascimento Lampert, V.; Spies, A.; Soares, S.R. Carbon footprint of milk production in Brazil: A comparative case study. Int. J. Life Cycle Assess. 2014, 20, 46–60. [Google Scholar] [CrossRef]
- Dall-Orsoletta, A.C.; Almeida, J.G.R.; Carvalho, P.C.F.; Savian, J.V.; Ribeiro-Filho, H.M.N. Ryegrass pasture combined with partial total mixed ration reduces enteric methane emissions and maintains the performance of dairy cows during mid to late lactation. J. Dairy Sci. 2016, 99, 4374–4383. [Google Scholar] [CrossRef] [PubMed]
- Beauchemin, K.A.; Kreuzer, M.; O’Mara, F.; McAllister, T.A. Nutritional management for enteric methane abatement: A review. Aust. J. Exp. Agric. 2008, 48, 21–27. [Google Scholar] [CrossRef]
- Benchaar, C.; Hassanat, F.; Gervais, R.; Chouinard, P.Y.; Petit, H.V.; Massé, D.I. Methane production, digestion, ruminal fermentation, nitrogen balance, and milk production of cows fed corn silage- or barley silage-based diets. J. Dairy Sci. 2014, 97, 961–974. [Google Scholar] [CrossRef] [PubMed]
- Hassanat, F.; Gervais, R.; Julien, C.; Massé, D.I.; Lettat, A.; Chouinard, P.Y.; Petit, H.V.; Benchaar, C. Replacing alfalfa silage with corn silage in dairy cow diets: Effects on enteric methane production, ruminal fermentation, digestion, N balance, and milk production. J. Dairy Sci. 2013, 96, 4553–4567. [Google Scholar] [CrossRef] [PubMed]
- Knapp, J.R.; Laur, G.L.; Vadas, P.A.; Weiss, W.P.; Tricarico, J.M. Invited review: Enteric methane in dairy cattle production: Quantifying the opportunities and impact of reducing emissions. J. Dairy Sci. 2014, 97, 3231–3261. [Google Scholar] [CrossRef] [PubMed]
- Moraes, L.E.; Strathe, A.B.; Fadel, J.G.; Casper, D.P.; Kebreab, E. Prediction of enteric methane emissions from cattle. Glob. Chang. Biol. 2014, 20, 2140–2148. [Google Scholar] [CrossRef] [PubMed] [Green Version]
- Williams, A.G.; Audsley, E.; Sandars, D.L. Determining the Environmental Burdens and Resource Use in the Production of Agricultural and Horticultural Commodities; Main Report. Defra Research Project IS0205; Cranfield University and Defra: Bedford, UK, 2006. [Google Scholar]
- Kelliher, F.M.; Cox, N.; Van Der Weerden, T.J.; De Klein, C.A.M.; Luo, J.; Cameron, K.C.; Di, H.J.; Giltrap, D.; Rys, G. Statistical analysis of nitrous oxide emission factors from pastoral agriculture field trials conducted in New Zealand. Environ. Pollut. 2014, 186, 63–66. [Google Scholar] [CrossRef] [PubMed]
- Saggar, S.; Giltrap, D.L.; Davison, R.; Gibson, R.; de Klein, C.A.; Rollo, M.; Ettema, P.; Rys, G. Estimating direct N2O emissions from sheep, beef, and deer grazed pastures in New Zealand hill country: Accounting for the effect of land slope on the N2O emission factors from urine and dung. Agric. Ecosyst. Environ. 2015, 205, 70–78. [Google Scholar] [CrossRef]
- De Klein, C.A.M.; Barton, L.; Sherlock, R.R.; Li, Z.; Littlejohn, R.P. Estimating a nitrous oxide emission factor for animal urine from some New Zealand pastoral soils. Aust. J. Soil Res. 2003, 41, 381. [Google Scholar] [CrossRef]
- NIWA Overview of New Zealand’s Climate. Available online: https://www.niwa.co.nz/education-and-training/schools/resources/climate/overview (accessed on 3 October 2018).
- Rösemann, C.; Haenel, H.-D.; Dämmgen, U.; Poddey, E.; Freibauer, A.; Wulf, S.; Eurich-Menden, B.; Döhler, H.; Schreiner, C.; Bauer, B.; et al. Calculations of Gaseous and Particulate Emissions from German Agriculture 1990–2011; Report on Methods and Data (RMD) Submission 2013; Thünen Report, No. 1; IDEAS: Sharjah, UAE, 2013. [Google Scholar]
- Energy Research Centre of the Netherlands Phyllis2—Database for Biomass and Waste. Available online: Https://www.ecn.nl/phyllis2 (accessed on 3 October 2018).
- Lovett, D.K.; Shalloo, L.; Dillon, P.; O’Mara, F.P. A systems approach to quantify greenhouse gas fluxes from pastoral dairy production as affected by management regime. Agric. Syst. 2006, 88, 156–179. [Google Scholar] [CrossRef]
- Zehetmeier, M.; Baudracco, J.; Hoffmann, H.; Heißenhuber, A. Does increasing milk yield per cow reduce greenhouse gas emissions? A system approach. Animal 2012, 6, 154–166. [Google Scholar] [CrossRef] [PubMed]
- Kristensen, T.; Mogensen, L.; Knudsen, M.T.; Hermansen, J.E. Effect of production system and farming strategy on greenhouse gas emissions from commercial dairy farms in a life cycle approach. Livest. Sci. 2011, 140, 136–148. [Google Scholar] [CrossRef]
- IACA. Anuário 2016; Associação Portuguesa dos Industriais de Alimentos Compostos Para Animais: Lisbon, Portugal, 2016. [Google Scholar]
- Yan, M.-J.; Humphreys, J.; Holden, N.M. Life cycle assessment of milk production from commercial dairy farms: The influence of management tactics. J. Dairy Sci. 2013, 96, 4112–4124. [Google Scholar] [CrossRef] [PubMed]
- Thomassen, M.A.; Dalgaard, R.; Heijungs, R.; De Boer, I. Attributional and consequential LCA of milk production. Int. J. Life Cycle Assess. 2008, 13, 339–349. [Google Scholar] [CrossRef] [Green Version]
- Bartl, K.; Gómez, C.A.; Nemecek, T. Life cycle assessment of milk produced in two smallholder dairy systems in the highlands and the coast of Peru. J. Clean. Prod. 2011, 19, 1494–1505. [Google Scholar] [CrossRef]
- Teixeira, R.F.M.; Morais, T.G.; Domingos, T. A practical comparison of regionalized land use and biodiversity life cycle impact assessment models using livestock production as a case study. Sustainabilty 2018. under revision. [Google Scholar]
- Chaudhary, A.; Brooks, T.M. Land Use Intensity-specific Global Characterization Factors to Assess Product Biodiversity Footprints. Environ. Sci. Technol. 2018. [Google Scholar] [CrossRef] [PubMed]
- Chaudhary, A.; Verones, F.; de Baan, L.; Hellweg, S. Quantifying Land Use Impacts on Biodiversity: Combining Species-Area Models and Vulnerability Indicators. Environ. Sci. Technol. 2015, 49, 9987–9995. [Google Scholar] [CrossRef] [PubMed]
- Morais, T.G.; Domingos, T.; Teixeira, R.F.M. A spatially explicit life cycle assessment midpoint indicator for soil quality in the European Union using soil organic carbon. Int. J. Life Cycle Assess. 2016, 21, 1076–1091. [Google Scholar] [CrossRef]
- Teixeira, R.F.M.; Morais, T.G.; Domingos, T. Consolidating regionalized global characterization factors for soil organic carbon depletion due to land occupation and transformation. Environ. Sci. Technol. 2018. [Google Scholar] [CrossRef] [PubMed]
- Cao, V.; Margni, M.; Favis, B.D.; Deschênes, L. Aggregated indicator to assess land use impacts in life cycle assessment (LCA) based on the economic value of ecosystem services. J. Clean. Prod. 2015, 94, 56–66. [Google Scholar] [CrossRef]
- Virgílio Cruz, J.; Silva, M.O.; Dias, M.I.; Isabel Prudêncio, M. Groundwater composition and pollution due to agricultural practices at Sete Cidades volcano (Azores, Portugal). Appl. Geochem. 2013, 29, 162–173. [Google Scholar] [CrossRef]
- Melo, A.; Cruz, J.V.; Coutinho, R. River water composition in volcanic islands: Characterization and main hydrogeochemical processes in São Miguel island (Azores, Portugal). Comunicações Geológicas 2014, 101, 693–696. [Google Scholar]
- Gerber, P.; Vellinga, T.; Opio, C.; Steinfeld, H. Productivity gains and greenhouse gas emissions intensity in dairy systems. Livest. Sci. 2011, 139, 100–108. [Google Scholar] [CrossRef]
- Vijayakumar, M.; Park, J.H.; Ki, K.S.; Lim, D.H.; Kim, S.B.; Park, S.M.; Jeong, H.Y.; Park, B.Y.; Kim, T. The effect of lactation number, stage, length, and milking frequency on milk yield in Korean Holstein dairy cows using automatic milking system. Asian-Australas. J. Anim. Sci. 2017, 30, 1093–1098. [Google Scholar] [CrossRef] [PubMed] [Green Version]
- Andrade, S.C.N. Desempenho produtivo e reprodutivo de vacas Holstein-Frísia em comparação com os respectivos cruzamentos com vermelha sueca e Montbéliarde. Master’s Thesis, Instituto Superior de Agronomia, Lisbon, Portugal, 2013. [Google Scholar]
- Teixeira, R.F.M.; Barão, L.; Morais, T.G.; Domingos, T. Determining Estimating the greenhouse gas balance of natural and sown pastures using a carbon and nitrogen mass balance approach. Sustainability 2018. under revision. [Google Scholar]
- Del Prado, A.; Brown, L.; Schulte, R.; Ryan, M.; Scholefield, D. Principles of Development of a Mass Balance N Cycle Model for Temperate Grasslands: An Irish Case Study. Nutr. Cycl. Agroecosyst. 2006, 74, 115–131. [Google Scholar] [CrossRef]
- Morais, T.G.; Teixeira, R.F.M.; Rodrigues, N.R.; Domingos, T. Characterizing livestock production in Portuguese sown rainfed grasslands: Applying the inverse approach to a process-based model. Sustainability 2018. under revision. [Google Scholar]
- Ali, I.; Cawkwell, F.; Green, S.; Dwyer, N. Application of statistical and machine learning models for grassland yield estimation based on a hypertemporal satellite remote sensing time series. In Proceedings of the IEEE Geoscience and Remote Sensing Symposium, Beijing, China, 13–18 July 2014; pp. 5060–5063. [Google Scholar]
- INE. Estatísticas do Ambiente 2016; Instituto Nacional de Estatistica: Lisboa, Portugal, 2017. [Google Scholar]
Figure 1.
Geographical location of the Azores islands (Portugal).

Figure 2.
Dairy production system boundaries and respective GHG sources. GHG: greenhouse gas.

Figure 3.
Contribution (%) by farm (1–25) of each source of the carbon footprint. Each tick mark represents 20% of the total footprint per farm.
Figure 3.
Contribution (%) by farm (1–25) of each source of the carbon footprint. Each tick mark represents 20% of the total footprint per farm.

Figure 4.
Graphical representation of carbon footprint (kg CO2e/kg milk) as function of milk yield (kg milk/cow.year—inverse of milking cows per milk produced. Linear regression of milking cows per milk produced in yellow but as horizontal axis is the inverse of the variable used the linear regression is transformed into a curve.


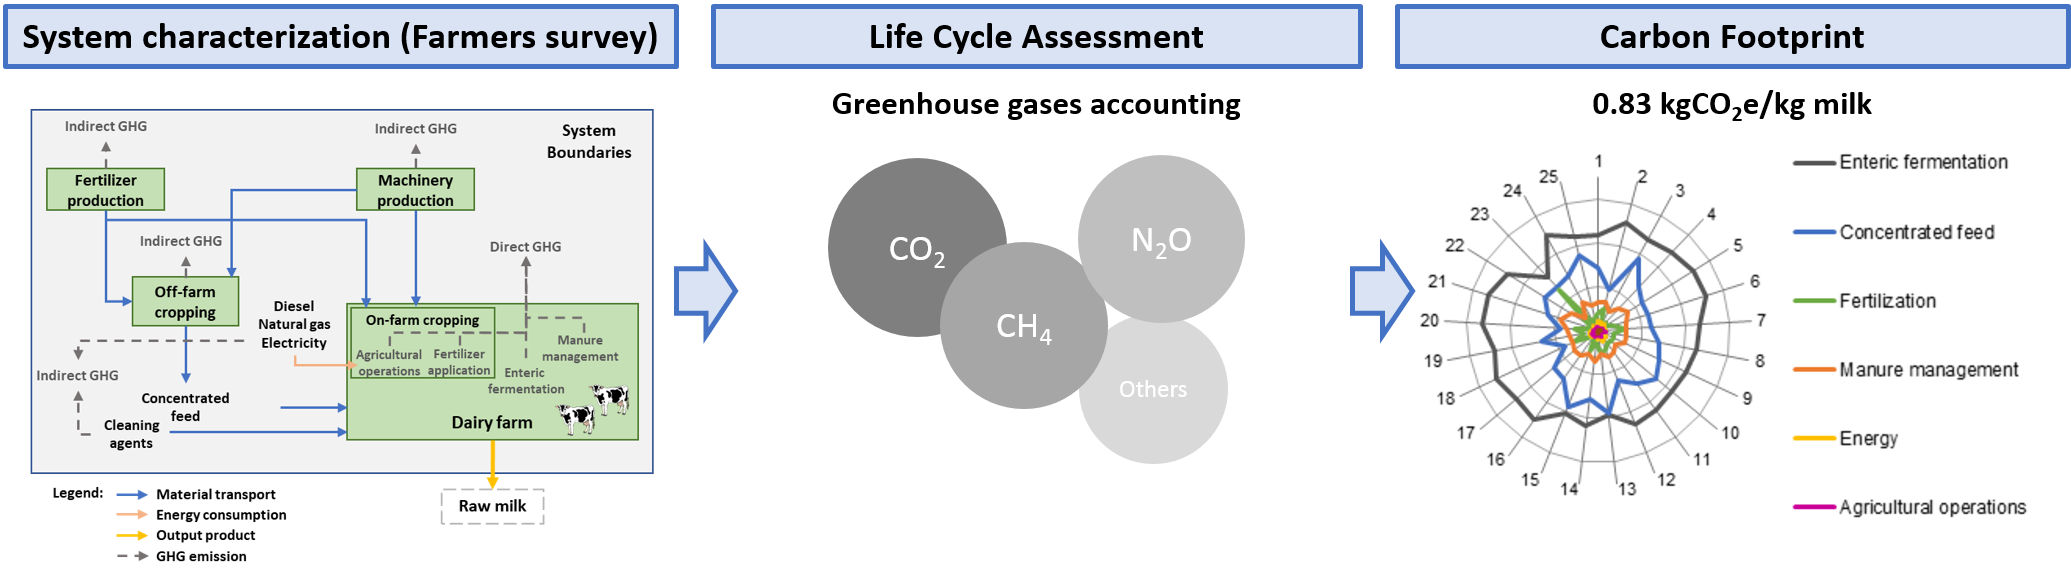
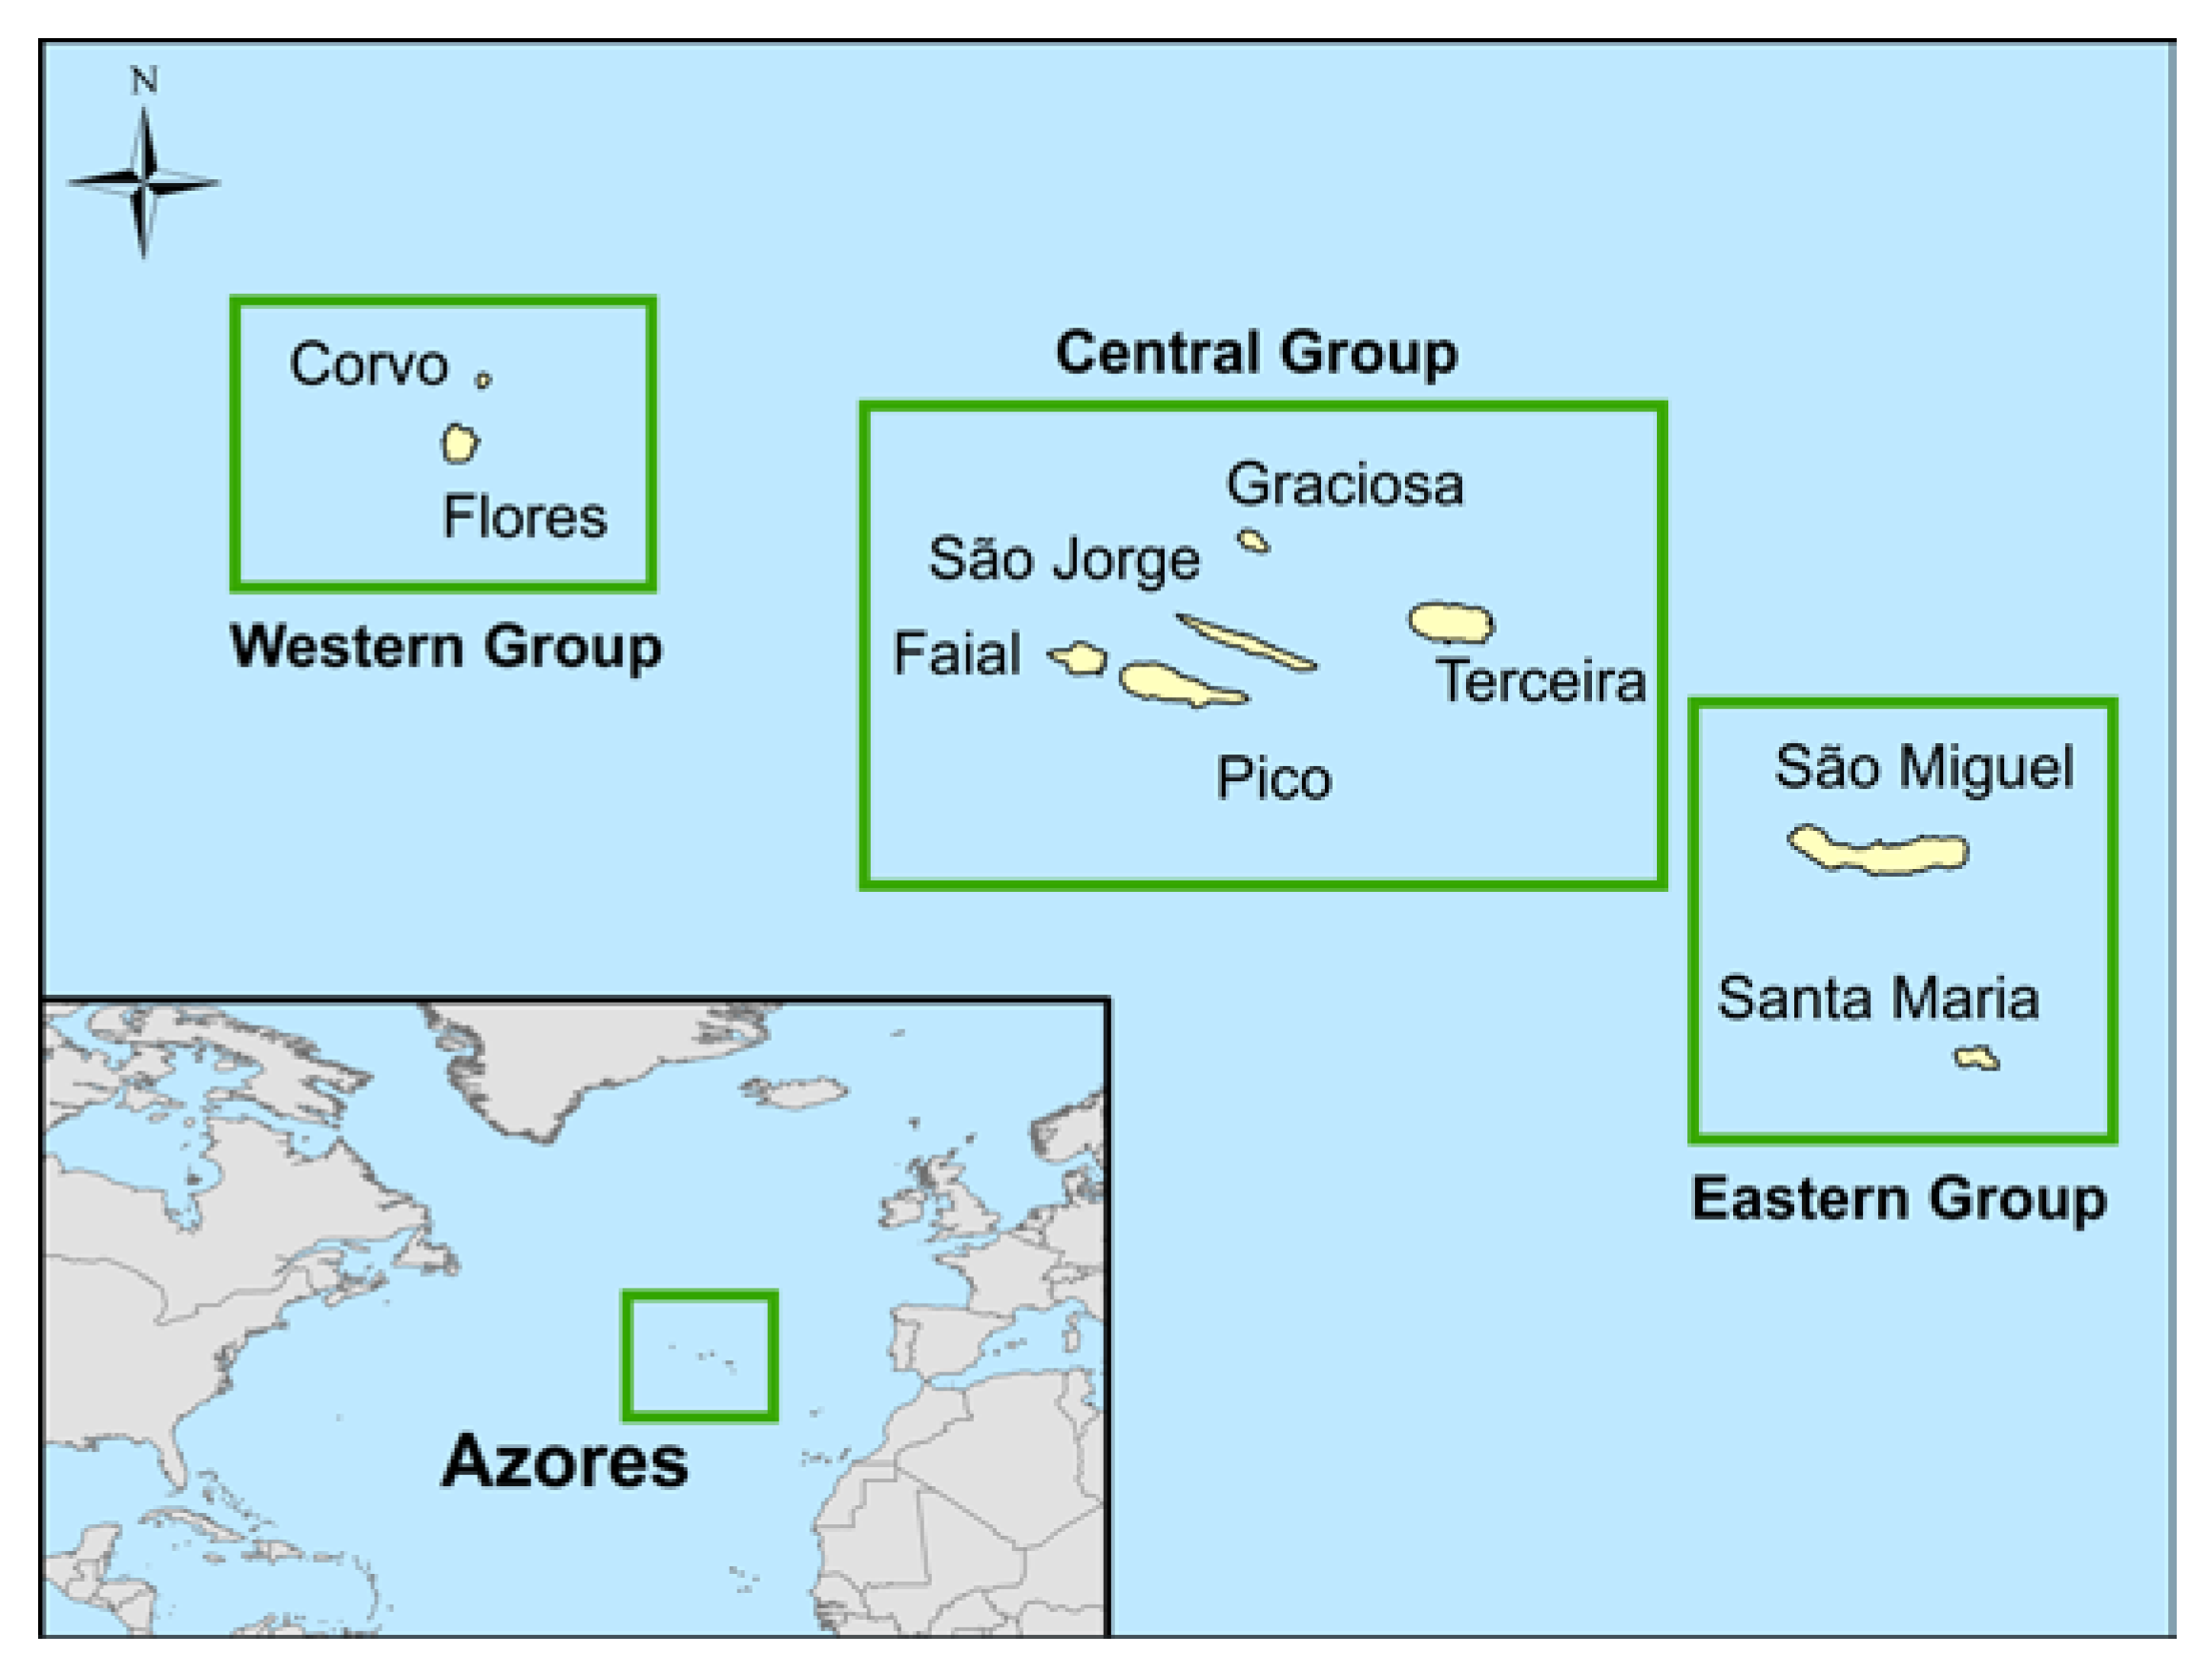
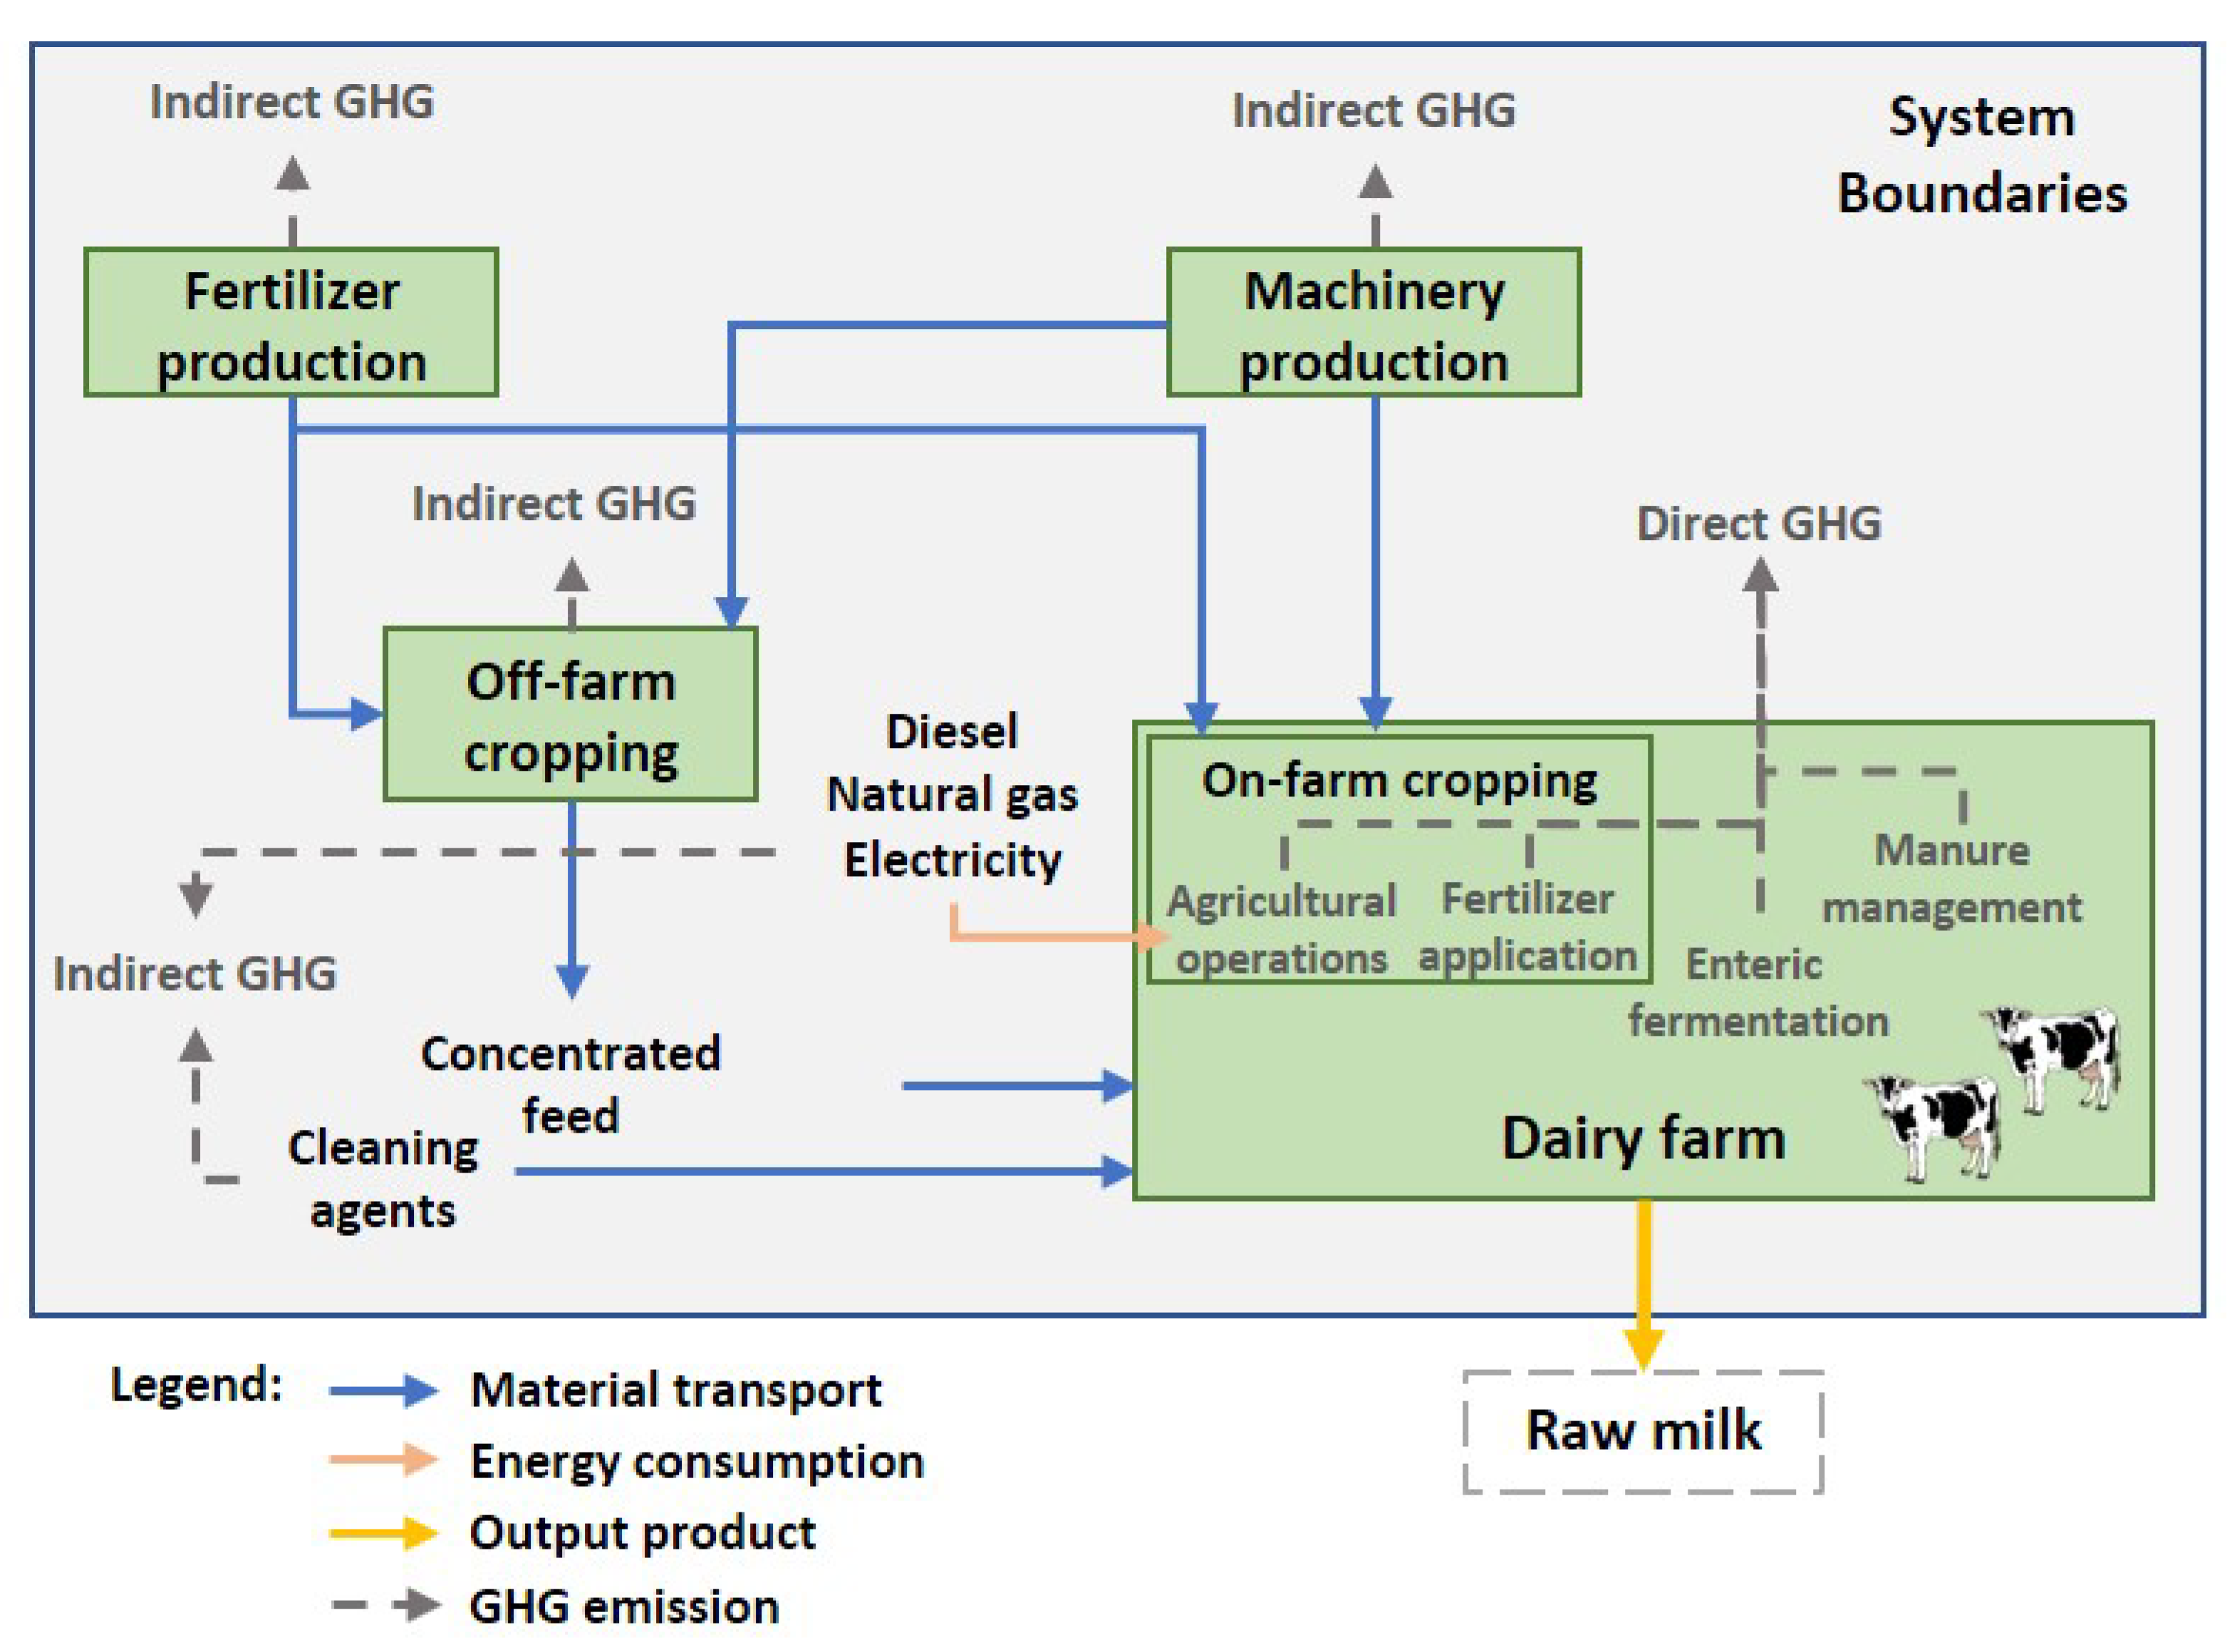
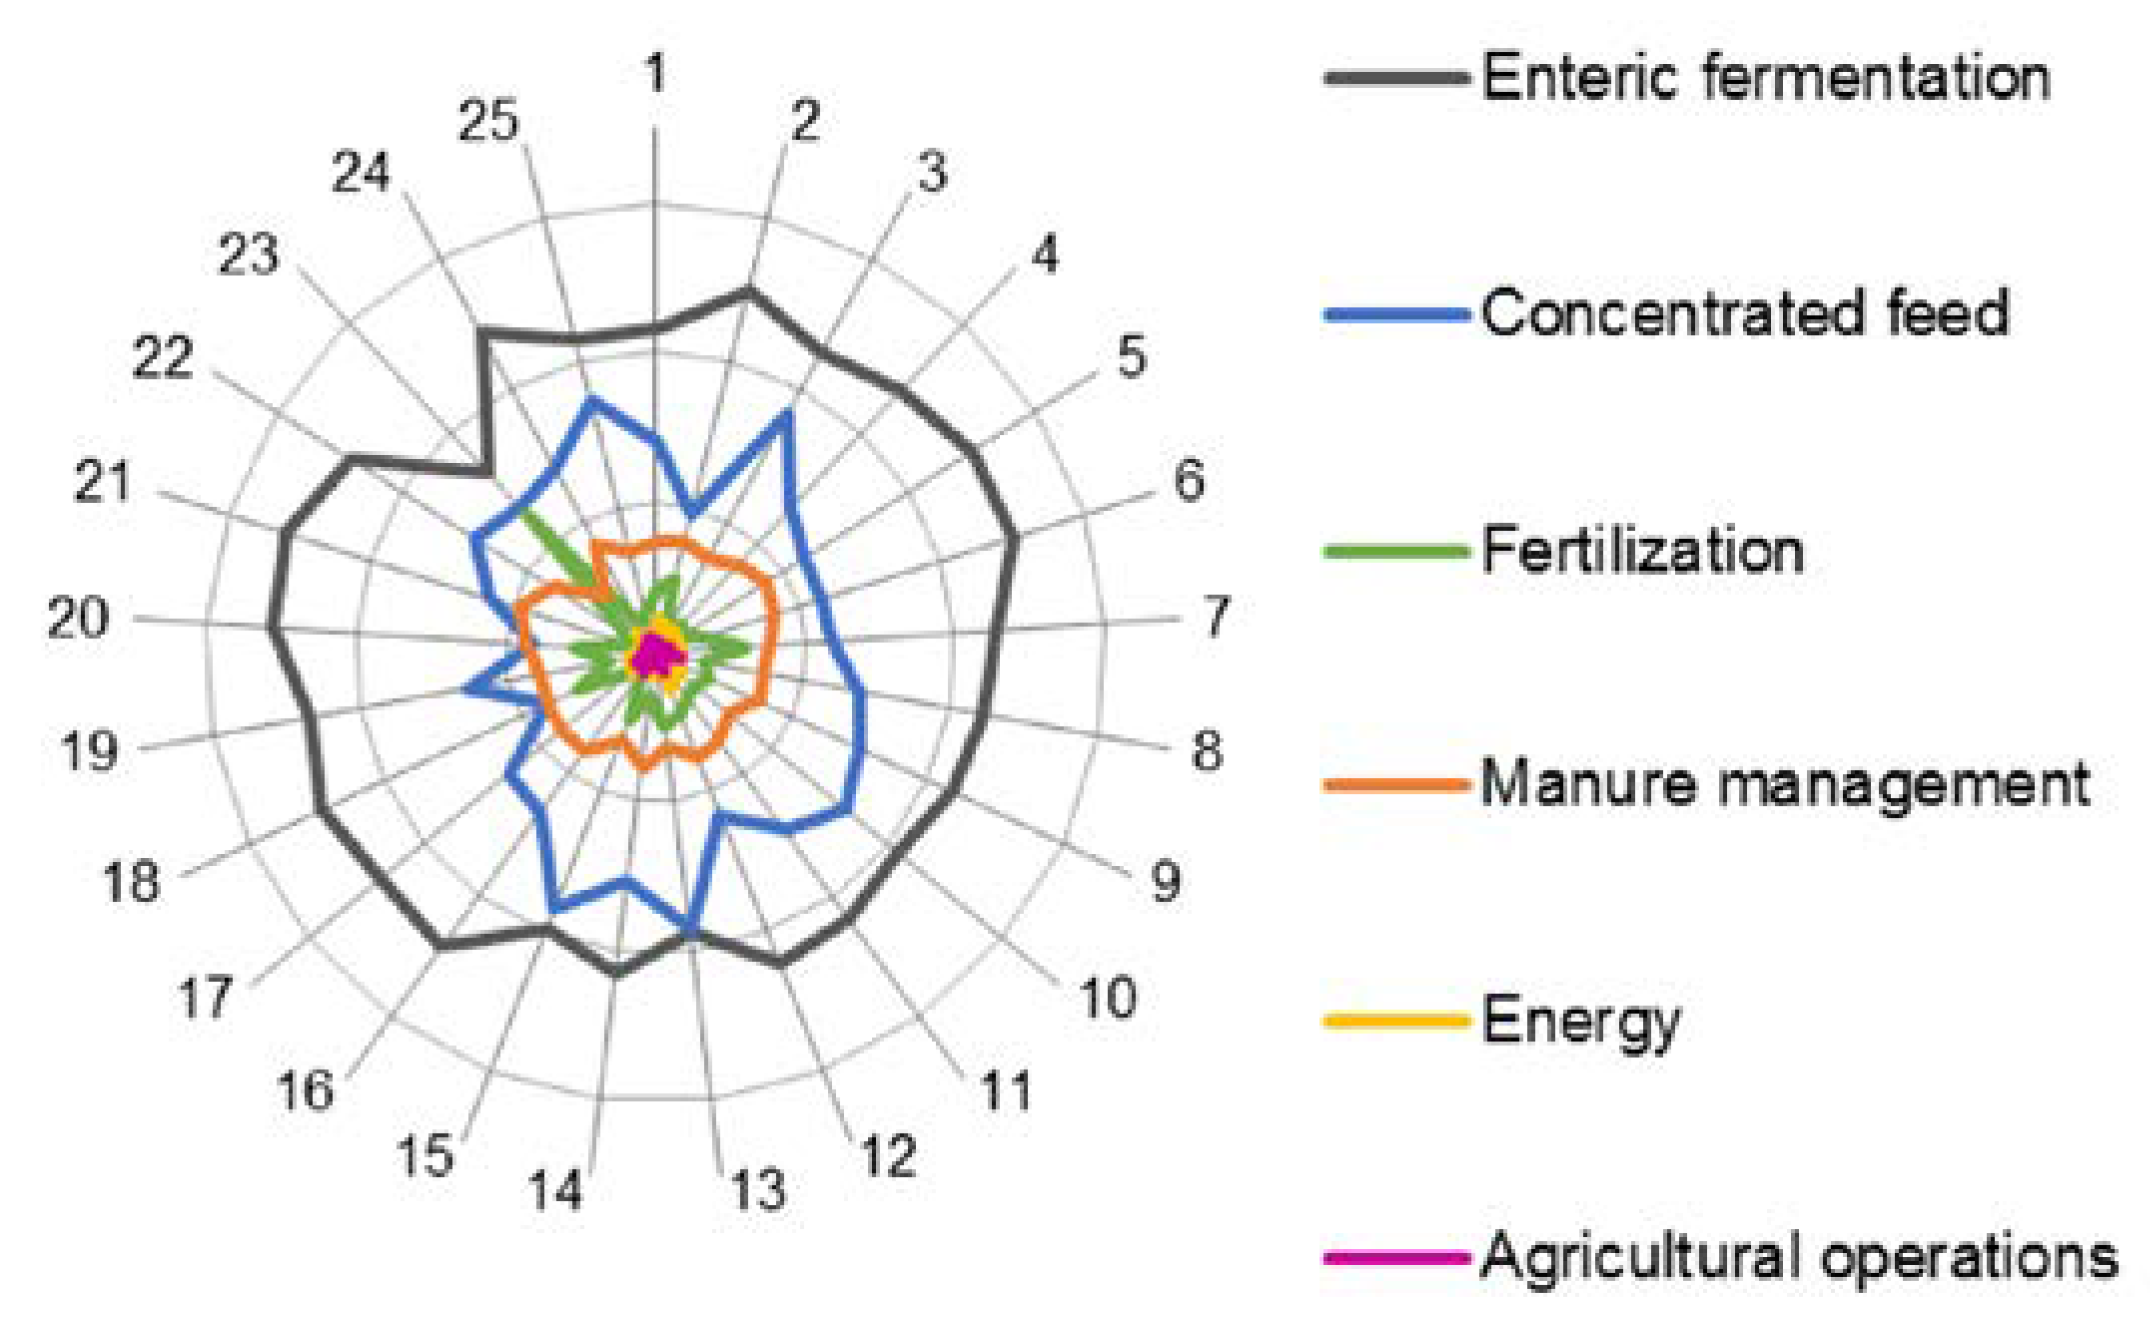
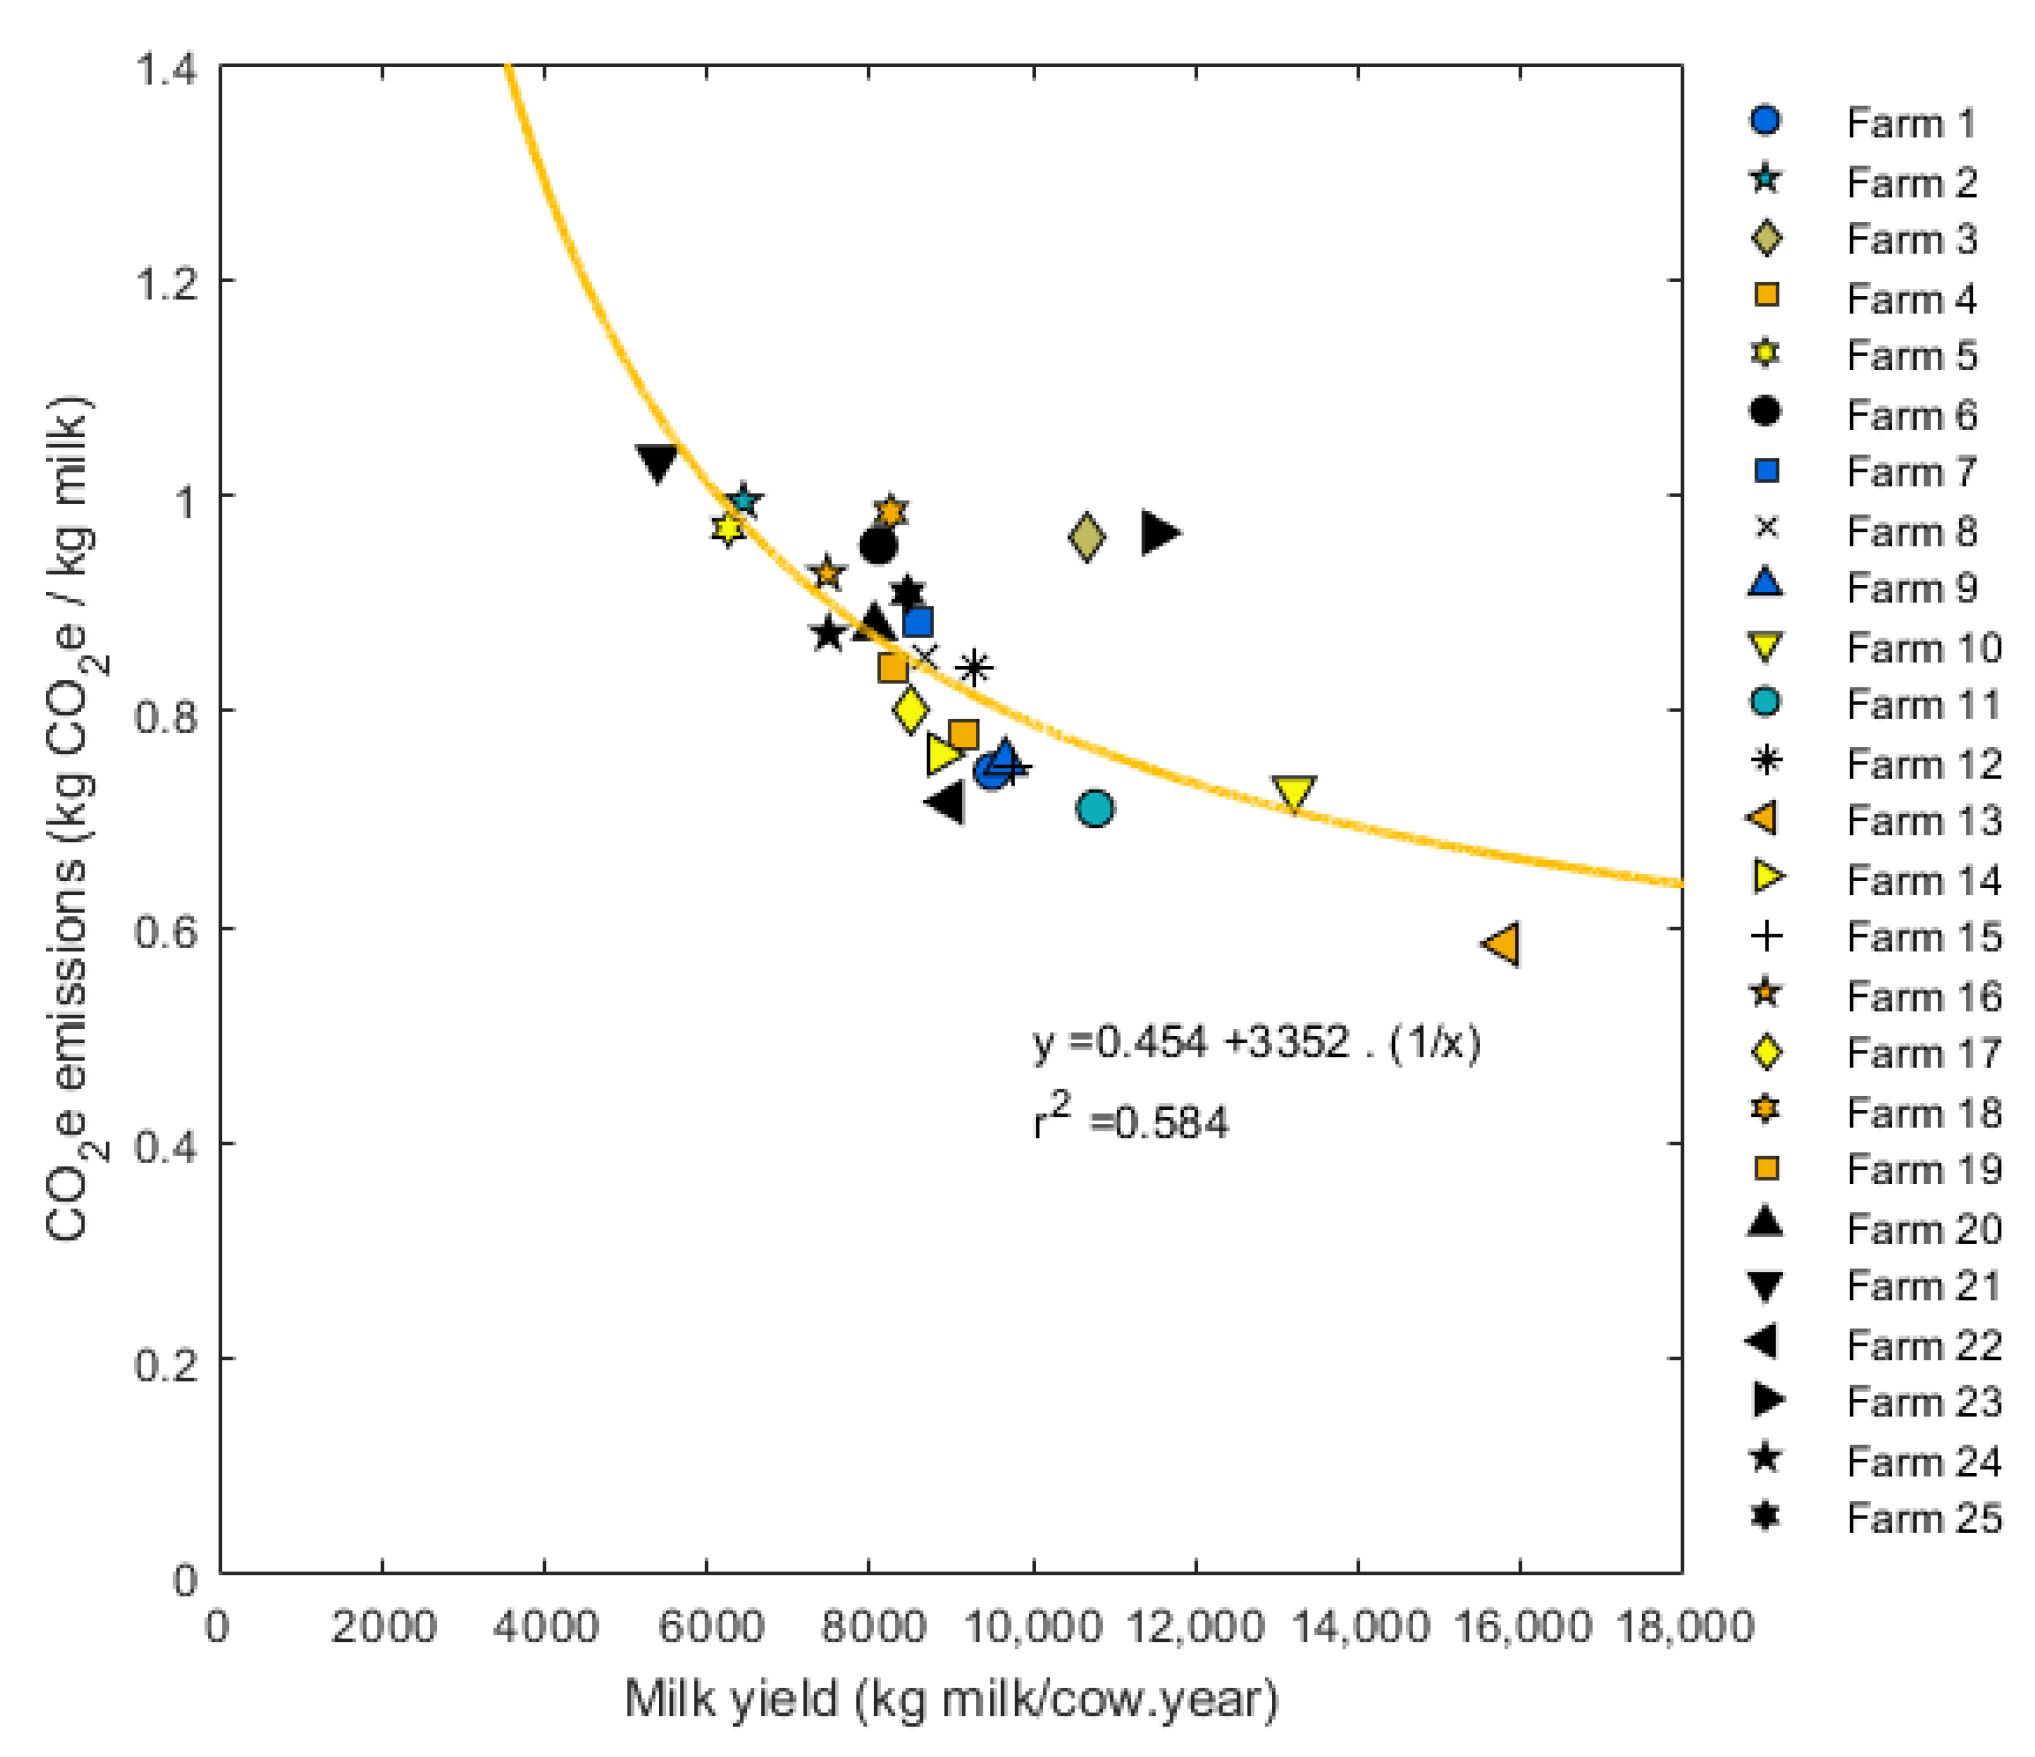
Table 1.
“Vacas Felizes” production system characterization (mean, standard deviation, min and max value).
Table 1.
“Vacas Felizes” production system characterization (mean, standard deviation, min and max value).
| Unit | Mean | Standard Deviation | Min | Max | ||
|---|---|---|---|---|---|---|
| General farms traits | Area | ha | 74 | 83 | 15 | 342 |
| Total milking cows | number | 95 | 62 | 40 | 297 | |
| Total dry cows | number | 14 | 15 | 4 | 75 | |
| Total heifers | number | 56 | 110 | 0 | 567 | |
| Total other animal classes | number | 28 | 16 | 6 | 63 | |
| Stocking rate (milking cows) | cow/ha | 1.82 | 0.96 | 0.72 | 4.63 | |
| Replacement rate | % | 40 | 12 | 15 | 151 | |
| Milk yield | kg milk/cow.year | 9088 | 2083 | 5398 | 15,800 | |
| Agricultural operations | h/ha | 7 | 4 | 2 | 15 | |
| Farm inputs | Inorganic Fertilizer | kg N/ha | 663 | 288 | 163 | 1643 |
| Organic fertilizer | kg N/ha | 329 | 208 | 0 | 805 | |
| Fossil energy | kg | 14,078 | 15,197 | 490 | 76,939 | |
| Electricity | kWh | 22,886 | 22,024 | 0 | 83,251 | |
| Concentrated feed | kg/cow | 3636 | 1118 | 2034 | 6523 | |
| Cleaning agents | kg | 1118 | 1116 | 50 | 4757 | |
| Farm output | Milk production | kg | 861,883 | 626,957 | 322,185 | 3,170,128 |
| Protein content | % | 3.18 | 0.09 | 3.01 | 3.41 | |
| Fat content | % | 3.68 | 0.27 | 3.05 | 4.07 |
Table 2.
Unitary composition of average concentrated feed and CO2e emissions of each ingredient.
| Ingredient | Production Region | Percentage | Emission (kg CO2e/kg Ingredient) |
|---|---|---|---|
| Barley grain | France | 62 | 0.57 |
| Olive bagasse | France | 18 | 0.62 |
| Palm bagasse | Malaysia | 10 | 1.25 |
| Wheat bran | France | 5 | 0.47 |
| Calcium carbonate | Europe | 3 | 0.4 |
| Monocalcium phosphate | Europe | 1 | 0.5 |
| Chloride sodium | Europe | 1 | 0.4 |
Table 3.
Carbon Footprint (CF) of dairy farms per source (kg CO2e/source/farm) and for five functional units (kg CO2e/FU).
Table 3.
Carbon Footprint (CF) of dairy farms per source (kg CO2e/source/farm) and for five functional units (kg CO2e/FU).
| Source | Unit | Mean | Standard Deviation | Min | Max | |
|---|---|---|---|---|---|---|
| CF per source | Enteric fermentation | kg CO2e | 377,022 | 296,974 | 153,887 | 1,589,401 |
| Concentrated feed | 239,591 | 237,455 | 53,397 | 1,272,907 | ||
| Fertilization | 61,518 | 53,344 | 15,450 | 211,154 | ||
| Manure during grazing | 123,884 | 93,005 | 54,497 | 496,768 | ||
| Agricultural operations | 11,472 | 7477 | 3252 | 38,150 | ||
| Energy | 20,781 | 17,291 | 2959 | 69,996 | ||
| Cleaning products | 10 | 10 | 0 | 43 | ||
| Functional Unit (FU) | ||||||
| CF per FU | Farm | kg CO2e/FU | 1,136,056 | 671,696 | 282,943 | 3,045,093 |
| Farm area (ha) | 12,351 | 6,973 | 4996 | 27,351 | ||
| Cows | 7893 | 1480 | 5580 | 11,115 | ||
| kg milk | 0.83 | 0.13 | 0.58 | 1.03 | ||
| kg ECM | 0.93 | 0.14 | 0.63 | 1.17 | ||
| kg FPCM | 0.89 | 0.13 | 0.60 | 1.13 |
Table 4.
Multivariate linear regression coefficients and p-values (r-squared: 0.78). * Significant at the 5% level.
Table 4.
Multivariate linear regression coefficients and p-values (r-squared: 0.78). * Significant at the 5% level.
| Multivariate Regression (All Variables) | Multivariate Regression (Most Significant Variables) | ||||
|---|---|---|---|---|---|
| Parameter | Coefficient | Unit | p-Value | Coefficient | p-Value |
| Constant | 3.76 × 10⁻¹ | kg CO2e/kg milk | 0.001 * | 4.03 × 10⁻¹ | 0.000 * |
| Concentrated feed | 7.07 × 10⁻² | kg CO2e/kg conc. feed | 0.686 | - | - |
| Milking cows | 2.70 × 10³ | kg CO2e/cow | 0.000 * | 2.67 × 10³ | 0.000 * |
| Dry cows | 3.88 × 10³ | kg CO2e/cow | 0.034 * | 3.94 × 10³ | 0.028 * |
| Heifers | 1.21 × 10³ | kg CO2e/heifer | 0.007 * | 1.26 × 10⁻² | 0.003 * |
Table 5.
Mean Carbon Footprint (CF) per concentrated feed consumption coefficient class. * R = concentrated feed (kg/cow.year)/milk yield (kg milk/cow.year).
Table 5.
Mean Carbon Footprint (CF) per concentrated feed consumption coefficient class. * R = concentrated feed (kg/cow.year)/milk yield (kg milk/cow.year).
| R Ratio * | Number of Studies | CF (kg CO2e/kg Milk) | |||
|---|---|---|---|---|---|
| Mean | Standard Deviation | Min | Max | ||
| [0–0.11] | 17 | 1.16 | 0.31 | 0.89 | 1.81 |
| ]0.11–0.21] | 17 | 0.90 | 0.12 | 0.79 | 1.13 |
| ]0.21–0.37] | 17 | 1.08 | 0.05 | 0.99 | 1.11 |
| ]0.37–1.31] | 18 | 1.33 | 0.56 | 0.56 | 1.96 |
© 2018 by the authors. Licensee MDPI, Basel, Switzerland. This article is an open access article distributed under the terms and conditions of the Creative Commons Attribution (CC BY) license (http://creativecommons.org/licenses/by/4.0/).
Share and Cite
MDPI and ACS Style
Morais, T.G.; Teixeira, R.F.M.; Rodrigues, N.R.; Domingos, T. Carbon Footprint of Milk from Pasture-Based Dairy Farms in Azores, Portugal. Sustainability 2018, 10, 3658. https://doi.org/10.3390/su10103658
AMA Style
Morais TG, Teixeira RFM, Rodrigues NR, Domingos T. Carbon Footprint of Milk from Pasture-Based Dairy Farms in Azores, Portugal. Sustainability. 2018; 10(10):3658. https://doi.org/10.3390/su10103658
Chicago/Turabian StyleMorais, Tiago G., Ricardo F. M. Teixeira, Nuno R. Rodrigues, and Tiago Domingos. 2018. "Carbon Footprint of Milk from Pasture-Based Dairy Farms in Azores, Portugal" Sustainability 10, no. 10: 3658. https://doi.org/10.3390/su10103658
Note that from the first issue of 2016, this journal uses article numbers instead of page numbers. See further details here.