Evaluation and Prediction of City Sustainability Using MCDM and Stochastic Simulation Methods


1
School of Business Administration, Northeastern University, Shenyang 110167, China
2
Northeastern Evaluation Center, Northeastern University, Shenyang 110167, China
3
School of Economics & Management, Nanchang University, Nanchang 330031, China
*
Author to whom correspondence should be addressed.
Sustainability 2018, 10(10), 3771; https://doi.org/10.3390/su10103771
Submission received: 14 September 2018
/
Revised: 13 October 2018
/
Accepted: 15 October 2018
/
Published: 18 October 2018
Abstract
:City sustainability is an important issue in the urbanization process. In this paper, the sustainability of 14 cities in Liaoning province in China is evaluated and predicted. The process of evaluating city sustainability is viewed as a multi-criteria decision-making problem. A simple additive weighting method is used for aggregating the normalized sustainability criteria data, built based on the three-pillar model and the associated weights. The results indicate that although the sustainability of the cities in Liaoning province is not perfect, the cities show better development momentum. For example, only two cities’ (Shenyang and Dalian) average performance scores in 2010–2016 were over 0.5, but all the cities’ sustainability improved in 2016 compared to 2010. We develop a stochastic simulation procedure used for predicting a city’s sustainability in future years. Many prediction results were obtained, including the maximum, minimum, and average performance scores of the cities, the pairwise priority matrix representing the ratio of one city outperforming another, and the ranking of cities’ sustainability with probabilities. The prediction results indicate various degrees of increase for almost all the cities’ sustainability in the future, which is consistent with the judgment of better development momentum determined from the evaluation results. Moreover, the cities of Dandong, Panjin may exceed Shenyang, Dalian, and rank in the top among all the cities in future years.
1. Introduction
In China, about 58.52% of urban inhabitants lived in cities as of 2017 [1]. City sustainability has become an important issue in the urbanization process. Many studies have focused on city sustainability in many fields [2,3,4,5,6,7,8]. Evaluating the sustainable performance of cities is an important research branch of city sustainability, since it can act as a framework for better decision-making for all undertakings, such as policies, plans, and programs, as well as physical undertakings [9].
For sustainability evaluation, the selection of sustainable criteria is a key factor influencing the sustainability performance of cities. In applications, the three-pole or three-pillar model, either explicitly or tacitly brings together the environment, economy, and society subsystems [10], and is a widely used framework given its simplicity and easy understanding. The three-pillar model is applied to cities, which are usually a complex organism with three key subsystems: society, economy, and environment. Sustainable development of cities is supposed to be the harmonious and all-round development of these three subsystems, among which environmental sustainability serves as the basis, economic sustainability the guarantee, and social sustainability the ultimate goal [11]. Zinatizadeh et al. evaluated the sustainability of Kermanshah in Iran from the aspects of economic growth, society and welfare, and environmental protection using the improved full permutation polygon synthetic indicator (IFPPSI) [12]. The IFPPSI was designed by considering the upper and lower limits and critical values of all criteria. By doing this, we can directly determine the level of each criterion and the distance between the present level and the critical, upper, and lower levels [13]. Zhang et al. selected the three-pillar model to construct the sustainability criteria used for assessing the sustainable performance of 13 cites in Jiangsu, China [14]. Lu et al. investigated the sustainability of resource-based cities in Northeastern China by using a set of economic, social, and environmental criteria [15]. Ravetz developed an integrated assessment framework by considering the index factors of environment, economy, and society to investigate integrated planning for long-term sustainable development in Greater Manchester, U.K. [16].
As sustainability criteria are often selected from different subsystems and there are many criteria, the evaluation of city sustainability can be viewed as a multi-criteria decision making (MCDM) problem. The basic MCDM process involves aggregating multiple criteria using a certain approach to produce a comprehensive value representing the overall performance of an alternative, which is the basis of the selection of the optimal alternative. Similarly, an overall sustainability score for each alternative (city) is obtained by integrating the relative importance (weights) of the criteria and the performance values of the alternatives for each criterion, on which the ranking of alternatives or the selection of the optimal alternative is based. Many weighting methods have been adopted for sustainability evaluation, including the commonly used analytical hierarchy process (AHP) method and its extensions [17,18,19,20], calculating the weight using the pairwise comparison judgment of any two criteria provided by experts, the entropy method [21,22,23,24], the grey approach [25,26], equal weighting method [27,28,29], and others, such as those developed for considering the interaction phenomena among criteria [14,30,31]. In terms of aggregation models, simple additive weighting (SAW) [32] is a simple and commonly used method [33] that integrates the criteria values and the weights associated with using a linear function. Many other aggregation methods have been used in sustainability investigations, such as the weighted geometric average (WGA) method [34], aggregating the criteria values by a multiplication operator, the exponential weighted mean function [35], the order preference by similarity to ideal situation (TOPSIS) method [36,37], and others [13,38].
In this paper, we examine city sustainability from the weak sustainability perspective, so we selected the equal weighting method and the SAW method as the main evaluation techniques. Weak sustainability is measured without considering the relationship, interaction, compensation, or trade-offs between criteria. Conversely, strong sustainability is a more restrictive approach in which compensation and trade-offs between criteria are strictly limited. The strong sustainability approach is guaranteed, for example, with the use of Preference Ranking Organization Method for Enrichment Evaluation (PROMETHEE) [39], PROMETHEE for Sustainability Assessment (PROSA) [40], ELECTRE [41], or the Dominance-Based Rough Set Approach (DRSA) [42]. In addition to sustainability evaluation, the prediction of city sustainability in the future is important, to provide more information, such as the trend in sustainability for long-term plans and management.
However, predicting sustainability is challenging, as various dynamics and uncertainty exist in the future development of city sustainability. In this case, the stochastic simulation method is an important approach since it can be used for obtaining a statistical prediction result through large-scale and sufficient samplings of the uncertain environment. For example, Han et al. simulated future land use scenarios of Beijing from 2010 to 2020 [43]. Cannavo et al. estimated the effect of large quantities of organic matter on the soil hydrodynamic properties of reconstituted urban soil during a 10-year period by simulating the daily soil water content and water drainage in the soil profile [44]. Tian et al. used the Monte Carlo stochastic method to forecast the financial sustainability of a basic pension based on predictions for the population of China, and found that the imbalance in basic pension will occur in 2026 [45]. Many other methods have been developed for sustainability prediction. For example, Zinatizadeh et al. used simple linear regression and three-time series data (1996, 2006, and 2016) to predict the synthetic sustainability of Kermanshah in 2026 [12]. Masduqi et al. predicted the sustainability of rural water supply systems in Indonesia using the structural equation modeling method [46]. In this paper, we predict city sustainable development using the Monte Carlo stochastic simulation method. Notably, this study is only a preliminary work, as in the prediction, the assumption is that of a linear progression of city sustainability, which is the continuation of a trend line. With the linear assumption, we primarily monitored the future development of city sustainability by maintaining current development trends. However, in real-world practice, the limitation of the linear assumption is obvious, as the development of any system (including cities) is fraught with uncertainty and change. For example, we know city sustainability may also behave in a non-linear fashion, subject to exponential growth, or tipping points giving way to collapse, or oscillation, depending on the underlying dynamics. These problems will be considered in future work.
A city pursuing all-round development, especially of the economic, social, and environmental subsystems, can be viewed as pursuing sustainable development. The old industrial cities in Northeastern China are continuing to decline in terms of their all-round development compared with other cities in China. The Communist Party of China (CPC) Central Committee and the State Council jointly launched an important policy document entitled “Certain Opinions Regarding the Comprehensive Revival of Old Industrial Bases Including the Northeast” in 2016 [14,47], pointing out the necessity of sustainable development of cities in Northeastern China. Liaoning is a key region in Northeastern China, which has jurisdiction over 14 prefecture-level cities. In this paper, we focus on the sustainable development of the cities in Liaoning province, aiming at providing technology and policy reference for promoting the sustainability of the cities. We developed our research from two aspects: sustainability evaluation and prediction. The evaluation was performed by considering the sustainable performance of cities in 2011–2016. The evaluation results help us to understand the sustainable development level and dynamic state of the cities more clearly. We predict the sustainable development of the 14 prefecture-level cities in the future years. As mentioned above, various prediction results are provided as a reference for long-term plans and management.
2. Materials and Methods
2.1. Study Area
Liaoning province is a coastal province that lies between longitudes 118°53′ E and 125°46′ N, and between latitudes 38°43′ N and 43°26′ E, located in Northeastern China. Its total area is 148,400 km2. Liaoning had 43,689,000 inhabitants in 2017. In 2016, the population growth rate was 1.0%. The gross regional domestic product was 23,942,000 million yuan in 2017, which is 4.2% higher than that in 2016.
Liaoning is across the river from North Korea and faces Japan and South Korea across the sea. It is a showcase of Northeastern China’s opening up and Eastern Inner Mongolia autonomous region in China. There are 14 prefecture-level cities located in Liaoning province, with two sub-provincial cities: Shenyang and Dalian. The provincial capital is Shenyang. The locations of the cities are shown in Figure 1, and the brief profiles of these 14 cities are shown in Table 1.
2.2. Index System
City sustainability is supposed to be the harmonious and all-round development of the three city subsystems: economy, society, and environment. Economic sustainability serves as the guarantee, environmental sustainability as the basis, and social sustainability as the ultimate goal [11]. An appropriate index system is necessary for city sustainability evaluation, which may directly influence the evaluation results. In this study, a total of 21 criteria were selected to construct the index system by the combined consideration of the three subsystems with the conditions of the cities in Liaoning province and the references in the literature [11,14,15,48]. The specific index system is shown in Table 2.
Economic sustainability should not only consider the quantity of economic growth, but also the quality of economic development. We should also pay attention to the industrial structure because the revival of the old industrial bases, including the cities in Liaoning province, stresses the optimization of the economic structure. As one of the important indexes of economic sustainability, C1 can directly reflect the development level of the economy of an individual city; C2 shows the development of the service industry and the industrial structure; C3 reveals the economic efficiency of industrial enterprises; C4 reflects people’s consumption level and purchasing power of social commodities [11]; C5 and C6 were selected to reflect the level of economic openness of an individual city; and C7 was chosen to reflect the capability of enlarging reproduction and readjusting the economic structure.
With respect to social sustainability, it is important to increase the population of cities, improve the quality of human life, raise the level of human health, guarantee people’s equality, job opportunities, old age life, among others. For the indexes of the social subsystem, C8 represents the trend and speed of natural population growth within an urban region; C9 indicates the state of employment and social stability; C10 reflects the urban-rural gap, which was selected as bridging the gap has been a historic task in China; C11 directly represents the quality of human life; C12 and C13 show the current situation of people’s health care and social insurance, respectively; and C14 shows the degree of traffic, which ensures communication and transportation of social and economic activities [11].
On the environmental sustainability level, more attention should be paid to environmental protection and the control of resource waste and environmental pollution, since many environmental problems have been caused by the rapid development of the economy. Pursuing harmonious development between economy and environment is a basic policy that requires long-term adherence by the Chinese government. In Table 2, C15 shows the funding used for environmental protection; C16 indicates the situation of green cover within a city region; C17, C18, and C19 reveal the discharge level of water and two types of air pollutants caused by industrial development, respectively; C20 shows the status of solid waste disposal; and C21 reflects the action of land greening, which is one of the main methods used to expand forest resources, improve ecological environment, and increase carbon sequestration.
2.3. Study Methods
2.3.1. Research Framework
The primary purpose of the paper was to first evaluate the sustainability of the cities in Liaoning province to understand the development level and dynamic state of the cities’ sustainability in the years 2011 to 2016 more clearly. Then, we developed the sustainability prediction by combining the dynamic performance in the previous year with the Monte Carlo stochastic simulation method. To achieve this, the following framework is proposed, as shown in Figure 2, where the key methods are described in the following subsections.
2.3.2. Evaluation Methods
Without loss of generality, let () denote the actual performance value of the alternative on criterion in the year . Before completing the evaluation, we needed to first transform the criteria values into a uniform scale. Many normalization methods have been developed [49,50]. In order to improve the comparability of the evaluation scores in different years and facilitate the comparative analysis of the prediction results, we extended the mean range normalization to a dynamic situation using the following equations:
where is the normalized valued of the , is the maximum value on criterion across different years, and is the minimum criterion value.
We used the simple additive weighting method to aggregate the normalized criteria values and the associated weights. Let represent the sustainability evaluation score of the alternative in the year . Then,
where is the weight associated with criterion , such that and .
In order to monitor cities’ sustainable development over consecutive years, including the prediction years, we needed to improve the comparability of the evaluation scores in different years. In this case, the criteria weights should be consistent in different years to guarantee the final evaluation score is a representation of the comprehensive sustainability measurement with respect to various measurement criteria. Therefore, we selected the equal weighting method, since it assigns all the criteria the same weights, such that .
2.3.3. Stochastic Prediction
This study of city sustainability prediction is a continuation of the evaluation provided above, since we assumed that the trend in sustainable development of different criteria would be similar to the previous years. In this case, we wanted to monitor the cities’ future development by maintaining current development trends. For a certain alternative , we estimated its possible performance interval with respect to criterion based on the dynamic change in the associated criterion values in the previous years.
Taking year as the base, we calculated the growth rate of the performance value of the alternative (city) of criterion in the following years, as follows:
where is the growth rate of year compared to .
Based on the criterion value in year and the maximum/minimum growth rate across different years, we calculated the possible performance interval of the alternative (city) of the criterion in the future years, as:
With the interval criteria values, we used the Monte Carlo stochastic simulation technique to predict the cities’ sustainability, including their possible development space and the ranking of the cities’ sustainability with probability. The stochastic simulation process is summarized as follows.
Step 1: Set variables. Set a variable N with an initial value of zero representing the total number of times the simulation will be run. Define with initial values zero used for storing the maximum, the minimum, and the sum of the sustainability prediction scores of alternative , respectively. Let the dimensional matrix represent the pairwise priority matrix of cities’ sustainability that also has the initial elements set to zero. In addition, set another dimensional matrix with its initial elements set to zero that is used for the temporary storage of the values of the pairwise priority matrix in each iteration of the simulation.
Step 2: Extract random data and the normalization. Randomly extract the data from the interval criteria values . Then, normalize these random data, denoted as , based on the normalized values of the previous years. Motivated by the interpolation method [51], we propose the following method:
where is the normalized value of the random criterion value .
Step 3: Calculate the sustainability score. Integrate the normalized random criterion value using Equation (3) to obtain the sustainability prediction value, denoted as , representing the sustainability score of alternative . Let . If , let . Or if , let .
Step 4: Calculate the pairwise priority matrix. Set the two types of counting variables as and () having the initial values of zero, which will be used for counting the frequency of one alternative (city) outperforming another. For example, if , let . Additionally, if , set . Then, calculate the priority ratio of alternative to as .
Step 5: Terminate the simulation. If the average deviation between the matrix and satisfies the loop termination condition , where is a small enough positive number (such as 0.001), terminate the simulation. Otherwise, let and . Then, restart the simulation process from Step 2.
With the values of , we predicted the possible sustainable development space of alternative , such as , and the average development level, such as . Moreover, using the pairwise priority matrix , we obtained the ranking of alternatives (cities). Use the variable to count the number of that are superior to all the other alternatives, such that,
where is a counting function, indicating the number of cities satisfying the condition “”.
For any two alternatives (cities) and , if , . In the case of , if , ; if , ; or if , , where “” represents “outperform”, and “” indicates “a draw” [52].
3. Results
3.1. Evaluation Results
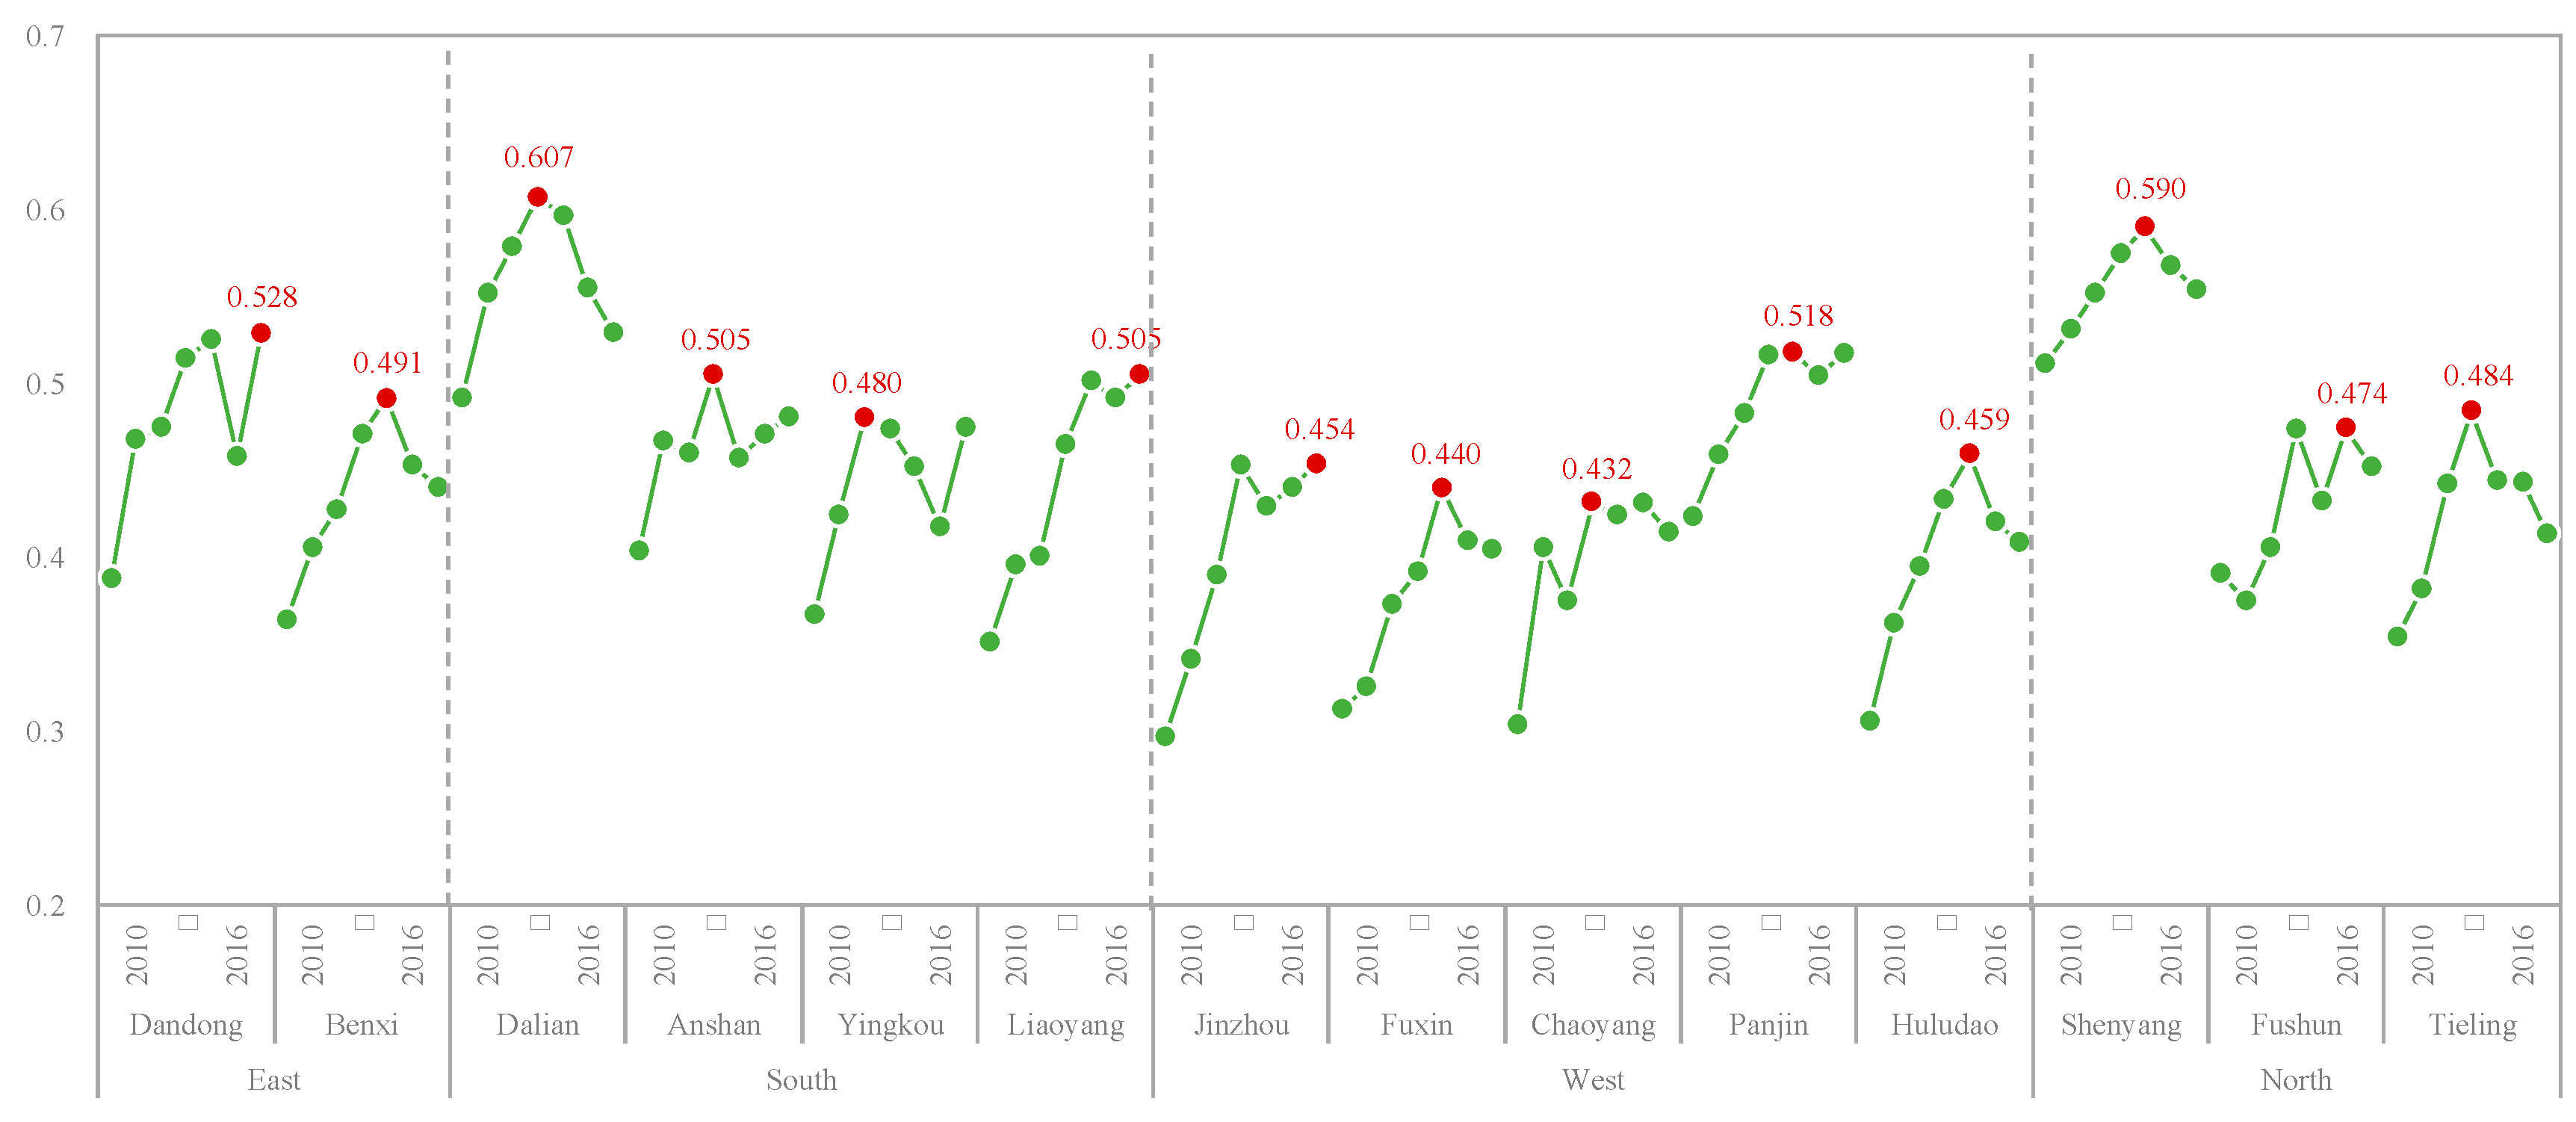
We collected the data for the criteria listed in Table 2 from the Liaoning Province Statistical Yearbook (2011–2017). We normalized the criteria values using Equations (1) and (2), and then aggregated the normalized values using Equation (3) to obtain the final sustainability evaluation scores of the 14 cities in 2010–2016, as shown in Table 3. Figure 3 more clearly shows the change in the sustainability scores of the cities in different years.
From Table 3 and Figure 3, (1) the sustainability of Shenyang and Dalian is comparatively higher, whereas the sustainability of Fuxin was the worst. (2) The sustainability of the 14 cities shows various degrees of increase in 2016 compared with 2010. The sustainability of Dandong, Liaoyang, and Panjin had the largest average annual growth rates of 2.34%, 2.56%, and 2.62%, respectively. (3) However, the sustainability of the 14 cities in Liaoning provinces is not perfect. Only two cities’ average sustainability scores were over 0.5 (accounting for 14.3%), which are Shenyang at 0.554, and Dalian at 0.559. (4) The sustainability levels of the cities, except for Shenyang and Dalian, were at the same level. However, the sustainability of most of the cities located in West Liaoning showed a higher growth rate.
The sustainability scores of the 14 cities with respect to the economic, social, and environmental subsystems are shown in Figure 4. The sustainability of the cities, except for Dalian, in terms of the economic subsystem was the lowest compared to the other two subsystems. The reasons for this are manifold. One main reason is that most cities in Liaoning province are facing severe industrial transformation and upgrading problems under a background of global heavy industry depression. As the population structure of Liaoning province deteriorates, the number of young people drops sharply, and the number of retirees increases rapidly. As a result, most government spending is used to plug pension holes, leaving little room to support new industry. The social sustainability levels of Shenyang, Dalian, Panjin, and Liaoyang were comparatively higher. By observing the actual performance values of the social criteria, these cities performed better in resident income, employment security, and health service. For environmental sustainability, Tieling, Chaoyang, and Huludao show higher levels. The main reason is that these cities are tourist cities with less emission of industrial waste water, industrial smoke and dust, etc.
3.2. Prediction Results
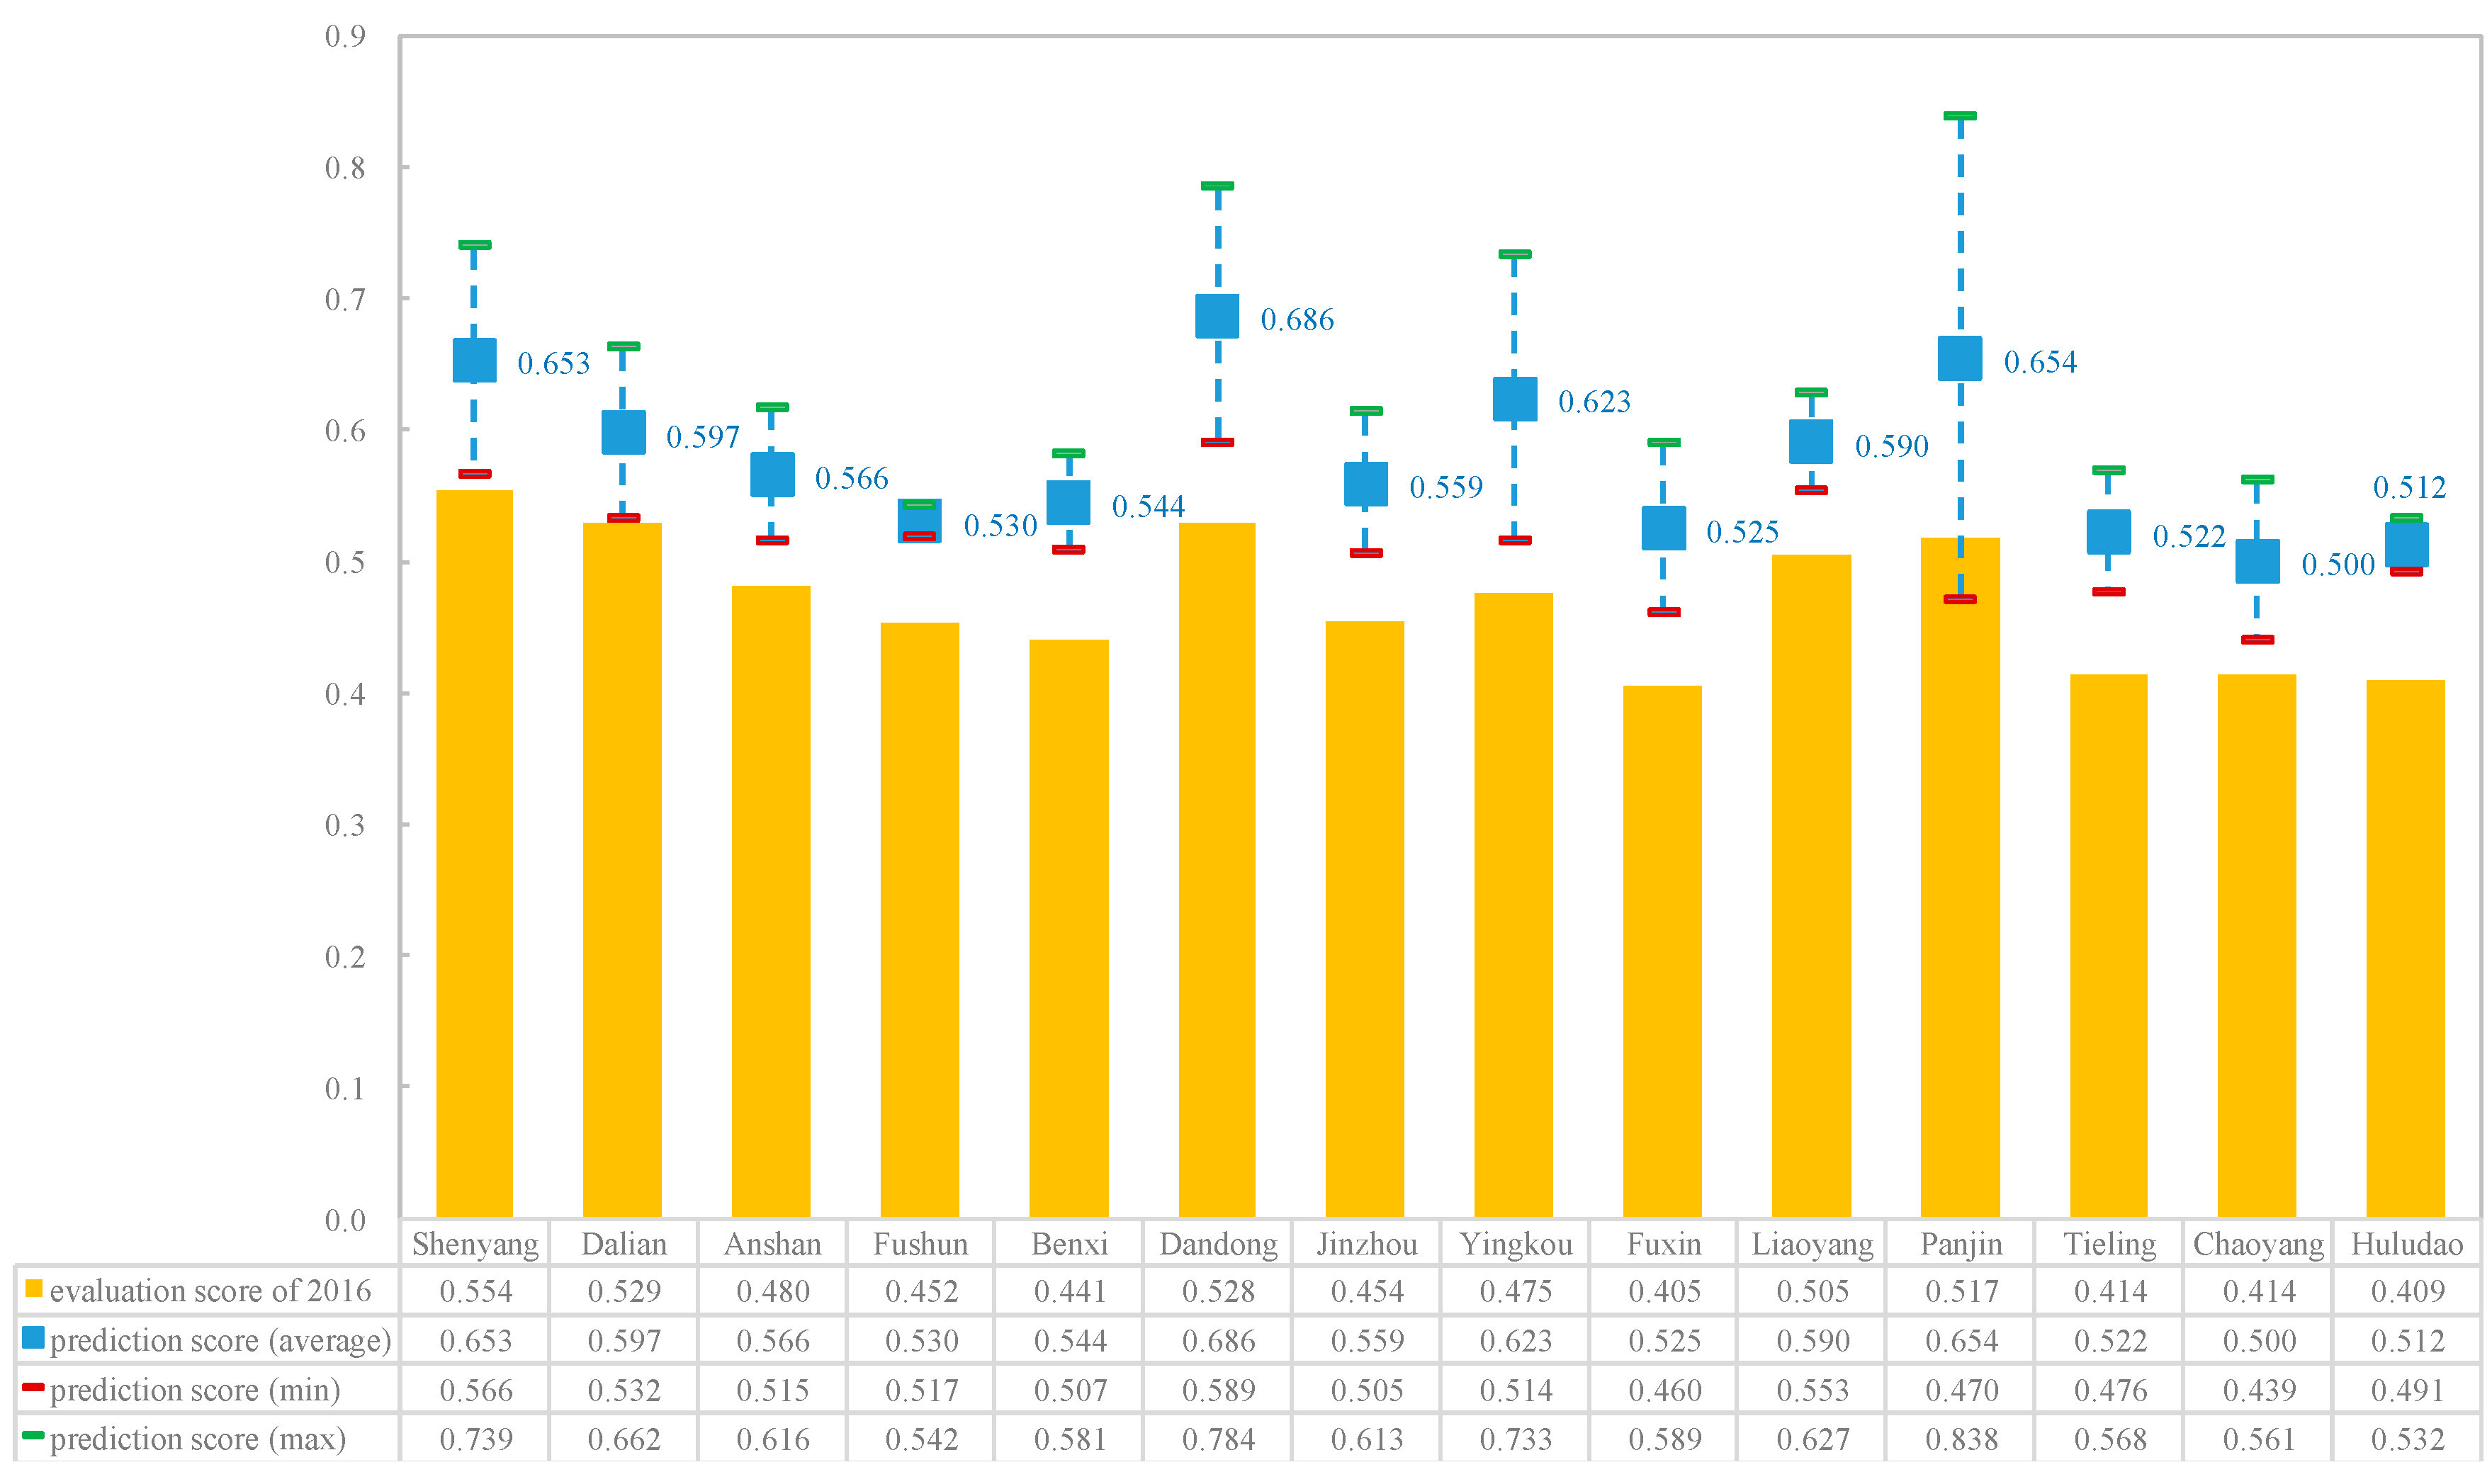
Using Equations (4) and (5), we calculated the interval criteria values of the 14 cities for the 21 criteria. Then, we completed the prediction by following the stochastic simulation steps provided above. Figure 5 shows the cities’ sustainability prediction scores including the possible maximum score, the possible minimum score, and the average score. In addition, the prediction scores were compared with the 2016 evaluation scores.
The sustainable development of the 14 cities was compared with that in 2016. The comparison was completed by calculating the degree of increase of the sustainability scores in future years compared with that in 2016. The results are shown in Table 4. Combined with Figure 5, except for the minimum prediction score for Panjin, all the prediction scores showed various degrees of improvement. This indicates that the sustainability of these cities will improve, more or less, in the future years. For Panjin, we counted the number of the prediction scores larger than the evaluation scores in 2016, and found that in future, it has a probability of 87.15% of outperforming its sustainability performance in 2016.
In terms of the fluctuation range (the maximum prediction score minus the minimum) of cities’ sustainability, the ranking of cities from top to bottom is Panjin, Yingkou, Dandong, Shenyang, Fuxin, Dalian, Chaoyang, Jinzhou, Anshan, Tieling, Benxi, Liaoyang, Huludao, and Fushun. The sustainability of Panjin had the largest fluctuation range, whereas Fushun and Huludao had fairly tight fluctuation ranges. Larger ranges mean the city’s sustainability may reach a much higher level in future years under positive guidance and management. We should also be more vigilant against a far sharper decline in the city’s sustainability for those with larger ranges.
The pairwise priority matrix of the cities’ sustainability was calculated by following the simulation steps as follows.
The values in the matrix indicate the probability of one city outperforming another with respect to the sustainable development in future years. Using Equation (8), we calculated the number of one city outperforming another, as shown in Table 5.
Then, we obtained the ranking of the 14 cities with probabilities as follows: Dandong Panjin Shenyang Yingkou Dalian Liaoyang Anshan Jinzhou Benxi Fushun Fuxin Tieling Huludao Chaoyang.
The values above the symbol “” represent the probability of one city outperforming another. For example, Dandong outperforms Panjin with a probability of 68.80%. Conversely, it means that Panjin may also outperform Dandong with a probability of 31.20%. This type of ranking is more consistent with the characteristics of future uncertainty in prediction.
From the ranking, the sustainability of Dandong and Panjin may exceed that of Shenyang and Dalian, and may rank toward the top of Liaoning province in future. The reason is that the two cities show comparatively better sustainability, such as the maximum evaluation score in 2010–2016 (over 0.5, Figure 3), the larger growth rate (Table 3), and the larger development space (fluctuation range) (Figure 4).
4. Discussion, Conclusions, and Future Work
In this paper, we evaluated the sustainability of 14 cities in Liaoning province, China. We considered 21 sustainability criteria from the economic, social, and environmental subsystems based on the three-pillar model. After collected data were transformed into a dimensionless scale between 0 and 1, a simple additive weighting method was used to obtain the evaluation scores, where equal weights were adopted to improve the comparability of the evaluation and prediction scores of the cities in different years. The sustainability performance of the 14 cities in future years was predicted using Monte Carlo stochastic simulation. In this process, we developed a normalization method used for scaling prediction data based on the interpolation method. The primary prediction results included the maximum, minimum, and average sustainability score of the cities, and the priority rate between any two cities.
The evaluation results showed that the sustainability of the 14 cities in Liaoning is not perfect, since only two cities’ average sustainability scores (accounting for 14.3%) were over 0.5 in 2010–2016. However, the sustainability of the 14 cities improved, more or less, in 2016 compared to 2010. This indicates the sustainability has better development momentum. This conclusion is consistent with the prediction results, where various degrees of increase were predicted in the sustainability of almost all the cities. Additionally, we found that the cities of Dandong and Panjin may rank near the top among the 14 cities in future years. As one of the important contributions of this research, multiple prediction results could provide more information for planners and policy analysts to improve the sustainability of the cities in Liaoning province. Moreover, the prediction results could provide a useful reference for city investment vehicles.
The methods, especially the stochastic simulation approach, developed in this research can provide guidance for decision makers in the following areas: (1) sustainability evaluation or prediction at various levels, such as city, urban, community, region, country, and others; (2) alternatives comparison over consecutive periods, where the dynamic mean range method and the extended interpolation technique can be used to reflect the dynamic and coherent change of criteria; and (3) uncertain multi-criteria decision-making problems and prediction questions, where multiple types of possible results are more suitable for uncertain and complicated environments.
As future work, we plan to use these methods to investigate the sustainability of other regions, especially the sustainable development of provincial-level regions in China. Additionally, we plan to develop a real-time system to monitor city sustainability, where the evaluation and prediction results will be presented dynamically in real time. In order to improve the scientific level of the sustainability investigation, expert judgment may be considered in future research. In this case, the credibility of experts, the quality of judgments, and the processing of fuzzy or uncertain information may be the key problems. The study of the interaction among multiple criteria and the determination of the criteria weights may also be a topic of interest.
Author Contributions
P.Y. designed the study and wrote the paper. W.L. conducted the research and analyzed the data. L.L. contributed to data collection and process. All authors read and approved the manuscript.
Funding
This research was supported by the Natural Science Foundation of China (71671031, 71701040), the Humanities and Social Sciences Foundation of Chinese Ministry of Education (17YJC630067), and the Fundamental Research Funds for the Central Universities of China (N170604004).
Acknowledgments
This research was supported by the Natural Science Foundation of China (71671031, 71701040), the Humanities and Social Sciences Foundation of Chinese Ministry of Education (17YJC630067), and the Fundamental Research Funds for the Central Universities of China (N170604004). Special thanks to the reviewers for their valuable comments.
Conflicts of Interest
The authors declare no conflict of interest.
References
- National Bureau of Statistics of the People’s Republic of China. Statistical communique of the People’s Republic of China on National Economic and Social Development in 2017. 2018. Available online: http://www.stats.gov.cn/tjsj /zxfb/201802/t20180228_1585631.html (accessed on 28 February 2018).
- Rad, T.G.; Sadeghi-Niaraki, A.; Abbasi, A.; Choi, S. A methodological framework for assessment of ubiquitous cities using ANP and DEMATEL methods. Sustain. Cities Soc. 2018, 37, 608–618. [Google Scholar]
- Leach, J.M.; Lee, S.E.; Hunt, D.V.L.; Rogers, C.D.F. Improving city-scale measures of livable sustainability: A study of urban measurement and assessment through application to the city of Birmingham, UK. Cities 2017, 71, 80–87. [Google Scholar] [CrossRef]
- Kawakubo, S.; Murakami, S.; Ikaga, T.; Asami, Y. Sustainability assessment of cities: SDGs and GHG emissions. Build. Res. Inf. 2018, 46, 528–539. [Google Scholar] [CrossRef]
- Mori, K.; Christodoulou, A. Review of sustainability indices and indicators: Towards a new city sustainability index (CSI). Environ. Impact Assess. Rev. 2012, 32, 94–106. [Google Scholar] [CrossRef]
- Mori, K.; Yamashita, T. Methodological framework of sustainability assessment in city sustainability index (CSI): A concept of constraint and maximisation indicators. Habitat Int. 2015, 45, 10–14. [Google Scholar] [CrossRef]
- Reza, B.; Sadiq, R.; Hewage, K. Sustainability assessment of flooring systems in the city of Tehran: An AHP-based life cycle analysis. Constr. Build. Mater. 2011, 25, 2053–2066. [Google Scholar] [CrossRef]
- Munier, N. Methodology to select a set of urban sustainability indicators to measure the state of the city, and performance assessment. Ecol. Indic. 2011, 11, 1020–1026. [Google Scholar] [CrossRef]
- Gibson, R.B. Beyond the pillars: Sustainability assessment as a framework for effective integration of social, economic and ecological considerations in significant decision-making. J. Environ. Assess. Policy Manag. 2006, 8, 259–280. [Google Scholar] [CrossRef]
- Ali-Toudert, F.; Ji, L.M. Modeling and measuring urban sustainability in multi-criteria based systems—A challenging issue. Ecol. Indic. 2017, 73, 597–611. [Google Scholar] [CrossRef]
- Ding, L.; Shao, Z.; Zhang, H.; Xu, C.; Wu, D. A comprehensive evaluation of urban sustainable development in China based on the TOPSIS-Entropy method. Sustainability 2016, 8, 746. [Google Scholar] [CrossRef]
- Zinatizadeh, S.; Azmi, A.; Monavari, S.M.; Sobhanardakani, S. Evaluation and prediction of sustainability of urban areas: A case study for Kermanshah city, Iran. Cities 2017, 66, 1–9. [Google Scholar] [CrossRef]
- Jin, J.; Wang, R.; Li, F.; Huang, J.; Zhou, C.; Zhang, H.; Yang, W. Conjugate ecological restoration approach with a case study in Mentougou district, Beijing. Ecol. Complex. 2011, 8, 161–170. [Google Scholar] [CrossRef] [Green Version]
- Zhang, L.; Xu, Y.; Yeh, C.H.; Liu, Y.; Zhou, D. City sustainability evaluation using multi-criteria decision making with objective weights of interdependent criteria. J. Clean. Prod. 2016, 131, 491–499. [Google Scholar] [CrossRef]
- Lu, C.P.; Xue, B.; Lu, C.Y.; Wang, T.; Jiang, L.; Zhang, Z.L.; Ren, W.X. Sustainability investigation of resource-based cities in northeastern China. Sustainability 2016, 8, 1058. [Google Scholar] [CrossRef]
- Ravetz, J. Integrated assessment for sustainability appraisal in cities and regions. Environ. Impact Assess. Rev. 2000, 20, 31–64. [Google Scholar] [CrossRef]
- Awasthi, A.; Chauhan, S.S. A hybrid approach integrating Affinity Diagram, AHP and fuzzy TOPSIS for sustainable city logistics planning. Appl. Math. Model. 2012, 36, 573–584. [Google Scholar] [CrossRef]
- Zhang, Y.P.; Sun, Y.B.; Qin, J.B. Sustainable development of coal cities in Heilongjiang province based on AHP method. Int. J. Min. Sci. Technol. 2012, 22, 133–137. [Google Scholar] [CrossRef]
- Su, S.H.; Yu, J.; Zhang, J. Measurements study on sustainability of China’s mining cities. Expert Syst. Appl. 2010, 37, 6028–6035. [Google Scholar] [CrossRef]
- Awasthi, A.; Omrani, H. A hybrid approach based on AHP and belief theory for evaluating sustainable transportation solutions. Int. J. Glob. Environ. Issues 2009, 9, 212–226. [Google Scholar] [CrossRef]
- Storto, C.L. Ecological efficiency based ranking of cities: A combined DEA cross-efficiency and Shannon’s entropy method. Sustainability 2016, 8, 124. [Google Scholar] [CrossRef]
- Erol, I.; Turgay, S.; Sari, R. A new fuzzy multi-criteria framework for measuring sustainability performance of a supply chain. Ecol. Econ. 2011, 70, 1088–1100. [Google Scholar] [CrossRef]
- Yan, J.H.; Feng, CH.; Li, L. Sustainability assessment of machining process based on extension theory and entropy weight approach. Int. J. Adv. Manuf. Technol. 2014, 71, 1419–1431. [Google Scholar] [CrossRef]
- Peng, Y.; Lai, Y.; Li, X.; Zhang, X. An alternative model for measuring the sustainability of urban regeneration: The way forward. J. Clean. Prod. 2015, 109, 76–83. [Google Scholar] [CrossRef]
- Baskaran, V.; Nachiappan, S.; Rahman, S. Indian textile suppliers’ sustainability evaluation using the grey approach. Int. J. Prod. Econ. 2012, 135, 647–658. [Google Scholar] [CrossRef]
- Arce, M.E.; Saavedra, Á.; Míguez, J.L.; Granada, E. The use of grey-based methods in multi-criteria decision analysis for the evaluation of sustainable energy systems: A review. Renew. Sustain. Energy Rev. 2015, 47, 924–932. [Google Scholar] [CrossRef]
- Begic, F.; Afgan, N. Sustainability assessment tool for the decision making in selection of energy system-bosnian case. Energy 2007, 32, 1979–1985. [Google Scholar] [CrossRef]
- Van de Kerk, G.; Manuel, A.R. A comprehensive index for a sustainable society: The SSI-the sustainable society index. Ecol. Econ. 2008, 66, 228–242. [Google Scholar] [CrossRef]
- Afgan, N.H.; Carvalho, M.G. Sustainability assessment of hydrogen energy systems. Int. J. Hydrogen Energy 2004, 29, 1327–1342. [Google Scholar] [CrossRef]
- Liou, J.J.H.; Chuang, Y.C.; Tzeng, G.H. A fuzzy integral-based model for supplier evaluation and improvement. Inf. Sci. 2014, 266, 199–217. [Google Scholar] [CrossRef]
- Zhang, L.; Zhou, P.; Newton, S.; Fang, J.; Zhou, D.; Zhang, L. Evaluating clean energy alternatives for Jiangsu, China: An improved multi-criteria decision making method. Energy 2015, 90, 953–964. [Google Scholar] [CrossRef]
- Fishburn, P.C. Additive Utilities within Complete Product Set: Applications to Priorities and Assignments; Operations Research Society of America (ORSA): Baltimore, MD, USA, 1967. [Google Scholar]
- Mulliner, E.; Malys, N.; Maliene, V. Comparative analysis of MCDM methods for the assessment of sustainable housing affordability. Omega 2016, 59, 146–156. [Google Scholar] [CrossRef] [Green Version]
- Liu, G. Development of a general sustainability indicator for renewable energy systems: A review. Renew. Sustain. Energy Rev. 2014, 31, 611–621. [Google Scholar] [CrossRef]
- Jovanovic, M.; Afgan, N.; Bakic, V. An analytical method for the measurement of energy system sustainability in urban areas. Energy 2010, 35, 3909–3920. [Google Scholar] [CrossRef]
- Govindan, K.; Khodaverdi, R.; Jafarian, A. A fuzzy multi criteria approach for measuring sustainability performance of a supplier based on triple bottom line approach. J. Clean. Prod. 2013, 47, 345–354. [Google Scholar] [CrossRef]
- Zhao, H.; Li, N. Performance evaluation for sustainability of strong smart grid by using stochastic AHP and fuzzy TOPSIS methods. Sustainability 2016, 8, 129. [Google Scholar] [CrossRef]
- Phillis, Y.; Davis, B. Assessment of corporate sustainability via fuzzy logic. J. Intell. Robot. Syst. 2009, 55, 3–20. [Google Scholar] [CrossRef]
- Ziemba, P.; Jankowski, J.; Wątróbski, J. Dynamic decision support in the internet marketing management. In Transactions on Computational Collective Intelligence XXIX; Nguyen, N., Kowalczyk, R., Eds.; Lecture Notes in Computer Science; Springer: Cham, Switzerland, 2018; pp. 39–68. [Google Scholar]
- Ziemba, P.; Wątróbski, J.; Zioło, M.; Karczmarczyk, A. Using the PROSA method in offshore wind farm location problems. Energies 2017, 10, 1755. [Google Scholar] [CrossRef]
- Medina-Salas, L.D.; Castillo-González, E.; Giraldi-Díaz, M.R.; Guzmán-González, V. Analysis of economical and environmental costs for the selection of municipal solid waste treatment and disposal scenarios through multicriteria analysis (ELECTRE Method). Sustainability 2017, 9, 1758. [Google Scholar] [CrossRef]
- Shen, K.Y. Compromise between short- and long-term financial sustainability: A hybrid model for supporting R&D decisions. Sustainability 2017, 9, 375. [Google Scholar]
- Han, H.; Yang, C.; Song, J. Scenario simulation and the prediction of land use and land cover change in Beijing, China. Sustainability 2015, 7, 4260–4279. [Google Scholar] [CrossRef]
- Cannavo, P.; Vidal-Beaudet, L.; Grosbellet, C. Prediction of long-term sustainability of constructed urban soil: Impact of high amounts of organic matter on soil physical properties and water transfer. Soil Use Manag. 2014, 30, 272–284. [Google Scholar] [CrossRef]
- Tian, Y.; Zhao, X. Stochastic forecast of the financial sustainability of basic pension in China. Sustainability 2016, 8, 46. [Google Scholar] [CrossRef]
- Masduqi, A.; Soedjono, E.S.; Endah, N.; Hadi, W. Prediction of rural water supply system sustainability using a mathematical model. J. Purif. 2009, 10, 155–164. [Google Scholar]
- CPC Central Committee and State Council. Certain Opinions Regarding the Comprehensive Revival of Old Industrial Bases Including the Northeast. 2016. Available online: http://www.gov.cn/zhengce/2016-04/26/content_ 5068242.htm (accessed on 10 August 2016).
- Research Group on Sustainable Development Strategy; Chinese Academy of Sciences (CAS). China Sustainable Development Report 2015: Reshaping the Governance for Sustainable Development; Science Press: Beijing, China, 2015. [Google Scholar]
- Wang, W.; Zhang, X.L.; Gombault, S.; Knapskog, S.J. Attribute normalization in network intrusion detection. In Proceedings of the 10th International Symposium on Pervasive Systems, Algorithms, and Networks (ISPAN), Kaohsiung, Taiwan, 14–16 December 2009; pp. 448–453. [Google Scholar]
- Ihsan, Z.; Idris, M.Y.; Abdullah, A.H. Attribute normalization techniques and performance of intrusion classifiers: A comparative analysis. Life Sci. J. 2013, 10, 2568–2576. [Google Scholar]
- Akima, H. A new method of interpolation and smooth curve fitting based on local procedures. J. Assoc. Comput. Mach. 1970, 17, 589–602. [Google Scholar] [CrossRef]
- Yi, P.T.; Zhang, D.N.; Guo, Y.J. The study on stochastic simulation method of comprehensive evaluation and application. Oper. Res. Manag. Sci. 2009, 18, 97–106. [Google Scholar]
Figure 1.
Location of the 14 cities in Liaoning province, China.

Figure 2.
The research framework of the investigation into city sustainability.
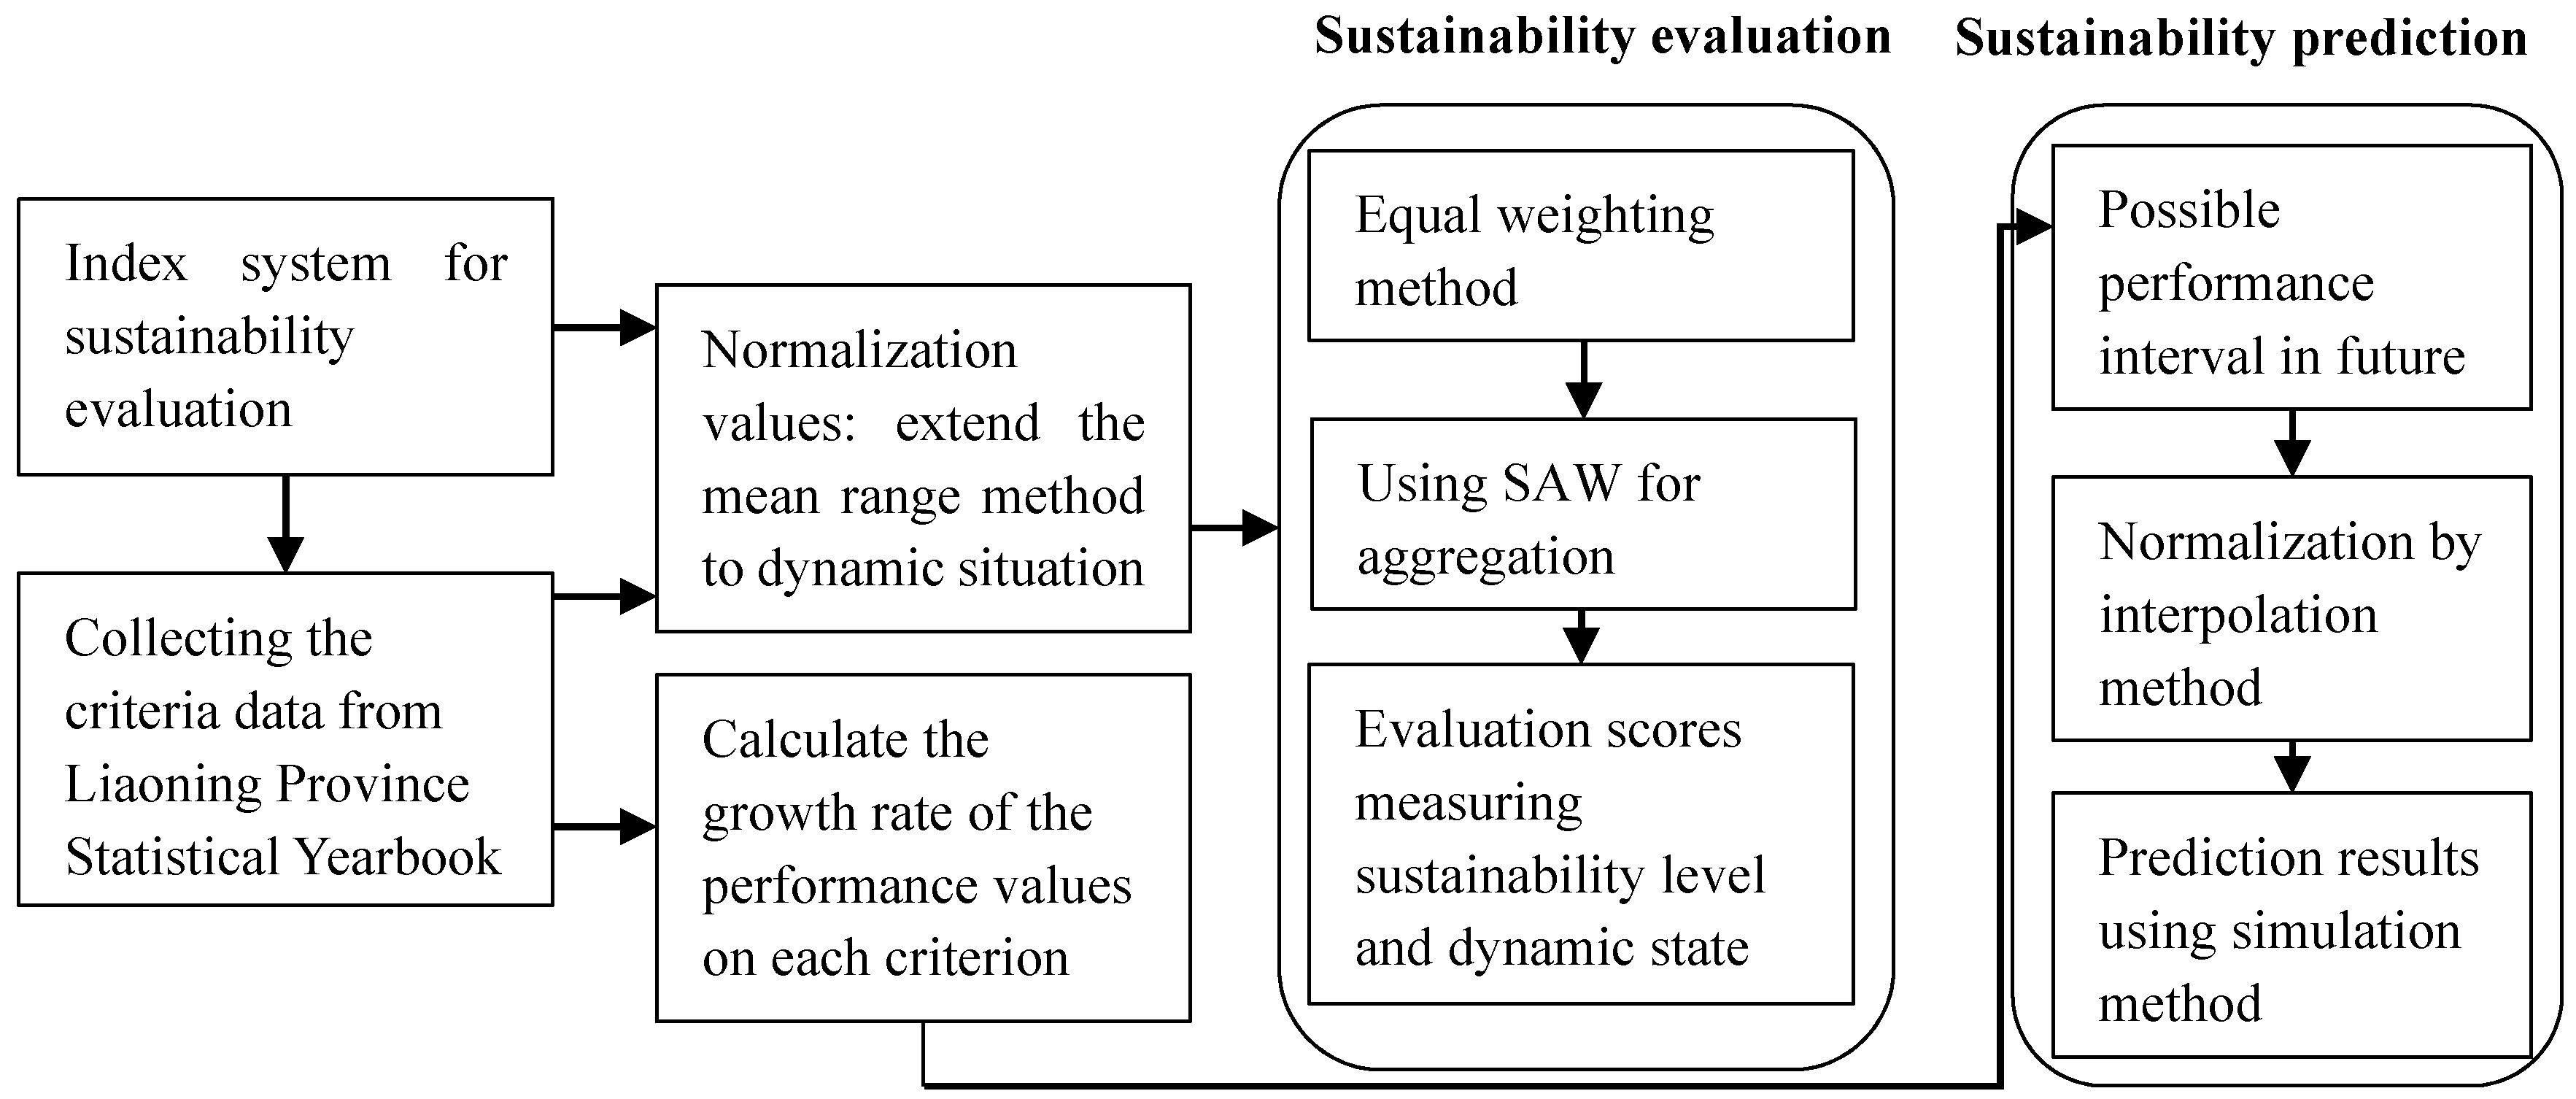
Figure 3.
Change in the sustainability evaluation scores of the 14 cities in different years.

Figure 4.
Sustainability scores of 14 cities with respect to the three subsystems.
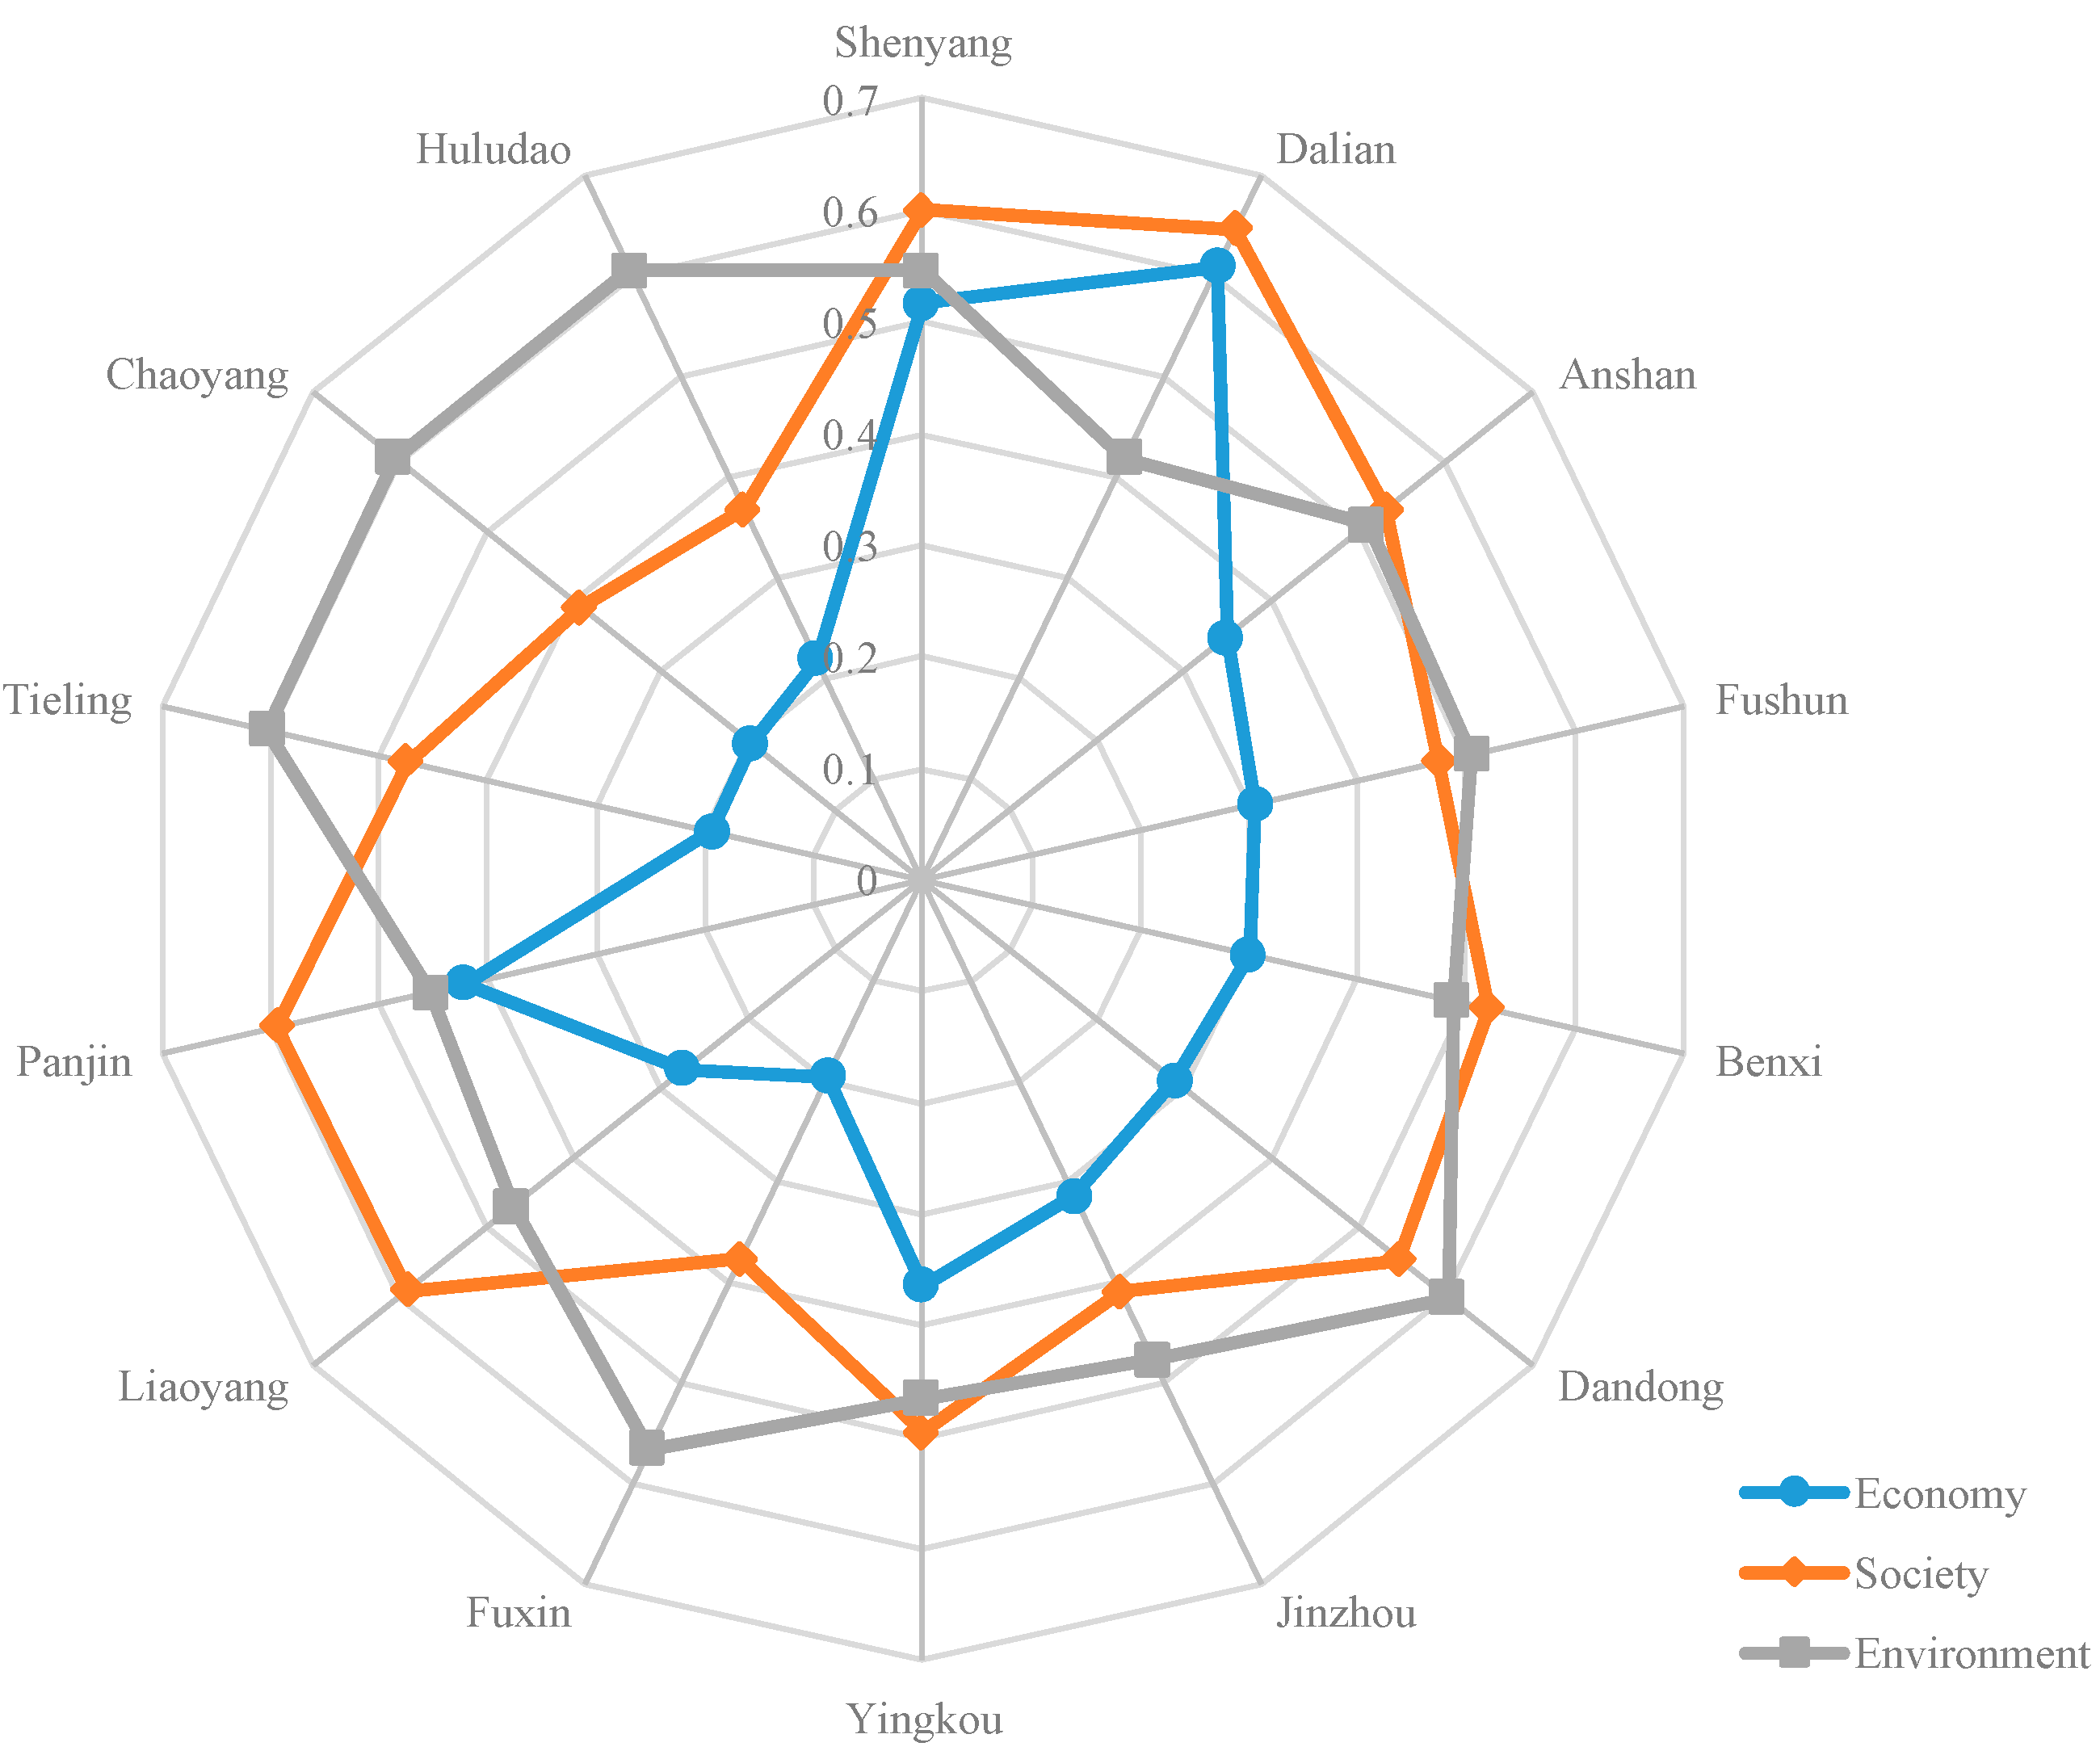
Figure 5.
Comparison of the prediction scores with the evaluation scores in 2016.

Table 1.
Specifications of the 14 cities in Liaoning province, China.
| City | Population | Area (km2) | Annual Average Temperature (°C) | Annual Rainfall (mm) | Per-Capita GDP (USD) * |
|---|---|---|---|---|---|
| Shenyang | 7,339,000 | 12,860 | 8.8 | 967.9 | 10,131.47 |
| Dalian | 5,956,000 | 12,574 | 12.0 | 380.2 | 14,762.59 |
| Anshan | 3,457,000 | 9255 | 11.0 | 861.0 | 6138.89 |
| Fushun | 2,148,000 | 11,272 | 7.4 | 1048.2 | 6322.00 |
| Benxi | 1,500,000 | 8411 | 8.9 | 821.7 | 6776.99 |
| Dandong | 2,379,000 | 15,290 | 9.9 | 1008.8 | 4728.97 |
| Jinzhou | 3,022,000 | 10,047 | 10.7 | 629.9 | 5102.92 |
| Yingkou | 2,328,000 | 5242 | 10.3 | 546.1 | 7172.74 |
| Fuxin | 1,889,000 | 10,355 | 8.6 | 579.7 | 3476.87 |
| Liaoyang | 1,786,000 | 4736 | 10.0 | 831.4 | 5474.44 |
| Panjin | 1,301,000 | 4065 | 9.6 | 747.5 | 10,675.65 |
| Tieling | 2,999,000 | 12,985 | 8.7 | 894.2 | 3365.85 |
| Chaoyang | 3,411,000 | 19,698 | 10.0 | 543.0 | 3678.15 |
| Huludao | 2,805,000 | 10,414 | 9.8 | 744.1 | 3839.00 |
* Exchange rate: 1 USD = 6.6025 RMB on 27 June 2018.
Table 2.
Index system used for evaluating cities’ sustainability in Liaoning province.
| Subsystem | Criterion (Code) | Unit | Property |
|---|---|---|---|
| Economy | GDP per capita (C1) | Yuan | Benefit |
| Proportion of GDP generated by the service industry (C2) | % | Benefit | |
| Ratio of profits, taxes, and interests to average assets of industrial enterprises above designated size (C3) | % | Benefit | |
| Retail sales of consumer goods per capita (C4) | Yuan | Benefit | |
| Amount of foreign investment actually utilized per capita (C5) | USD | Benefit | |
| Growth rate of total export-import volume (C6) | % | Benefit | |
| Per capita investment in fixed assets (C7) | Yuan | Benefit | |
| Natural growth rate of population (C8) | ‰ | Benefit | |
| Society | Registered urban unemployment rate (C9) | % | Cost |
| Ratio of per capita income of urban and rural households (C10) | % | Cost | |
| Per capita disposable income of urban households (C11) | Yuan | Benefit | |
| Beds of medical institutions per 10,000 population (C12) | Unit | Benefit | |
| Coverage rate of basic person insurance (C13) | % | Benefit | |
| Per capita area of paved roads (C14) | m2 | Benefit | |
| Investment in environmental protection as a proportion of DGP (C15) | % | Benefit | |
| Environment | Per capita park green area (C16) | m2 | Benefit |
| Per industrial enterprise waste water discharged (C17) | 10,000 tons | Cost | |
| Per industrial enterprise SO2 emissions (C18) | Ton | Cost | |
| Per industrial enterprise smoke and dust emissions (C19) | Ton | Cost | |
| Ratio of industrial solid wastes comprehensively utilized (C20) | % | Benefit | |
| Per capita area of afforestation (C21) | Hectare | Benefit |
Table 3.
Evaluation scores and the rank of the 14 cities in 2010–2016.
| City | Evaluation Score | Growth Rate * | Average Score ** | Average Ranking *** | ||||||
|---|---|---|---|---|---|---|---|---|---|---|
| 2010 | 2011 | 2012 | 2013 | 2014 | 2015 | 2016 | ||||
| Shenyang | 0.511 | 0.531 | 0.552 | 0.574 | 0.59 | 0.568 | 0.554 | 0.72% | 0.554 | 2 |
| Dalian | 0.491 | 0.552 | 0.579 | 0.607 | 0.596 | 0.555 | 0.529 | 0.63% | 0.559 | 1 |
| Anshan | 0.404 | 0.467 | 0.461 | 0.505 | 0.457 | 0.471 | 0.48 | 1.27% | 0.464 | 5 |
| Fushun | 0.391 | 0.375 | 0.405 | 0.474 | 0.432 | 0.474 | 0.452 | 1.02% | 0.429 | 9 |
| Benxi | 0.365 | 0.406 | 0.428 | 0.471 | 0.491 | 0.454 | 0.441 | 1.27% | 0.436 | 8 |
| Dandong | 0.388 | 0.468 | 0.475 | 0.515 | 0.525 | 0.458 | 0.528 | 2.34% | 0.48 | 4 |
| Jinzhou | 0.297 | 0.341 | 0.39 | 0.453 | 0.429 | 0.44 | 0.454 | 2.62% | 0.401 | 11 |
| Yingkou | 0.368 | 0.424 | 0.48 | 0.474 | 0.453 | 0.418 | 0.475 | 1.79% | 0.441 | 7 |
| Fuxin | 0.313 | 0.326 | 0.373 | 0.392 | 0.44 | 0.41 | 0.405 | 1.53% | 0.38 | 14 |
| Liaoyang | 0.352 | 0.395 | 0.401 | 0.465 | 0.501 | 0.492 | 0.505 | 2.56% | 0.445 | 6 |
| Panjin | 0.423 | 0.459 | 0.483 | 0.516 | 0.518 | 0.504 | 0.517 | 1.57% | 0.489 | 3 |
| Tieling | 0.354 | 0.382 | 0.442 | 0.484 | 0.444 | 0.444 | 0.414 | 1.00% | 0.423 | 10 |
| Chaoyang | 0.303 | 0.405 | 0.375 | 0.432 | 0.424 | 0.432 | 0.413 | 1.85% | 0.398 | 12 |
| Huludao | 0.306 | 0.363 | 0.394 | 0.433 | 0.459 | 0.421 | 0.409 | 1.71% | 0.397 | 13 |
* Growth rate represents the average annual growth rate of the sustainability score, which was calculated by (yi(tl) − yi(t1))/yi(t1)/(m − 1); ** Average score is the mean of the evaluation scores in the year 2010–2016; *** Average ranking is the ranking of the cities by the average scores.
Table 4.
The degree of the increase of the prediction scores compared with the evaluation scores in 2016.
Table 4.
The degree of the increase of the prediction scores compared with the evaluation scores in 2016.
| City | Increase in the Prediction Scores | ||
|---|---|---|---|
| Minimum | Average | Maximum | |
| Shenyang | 2.17% | 17.81% | 33.45% |
| Dalian | 0.53% | 12.75% | 24.96% |
| Anshan | 7.26% | 17.76% | 28.26% |
| Fushun | 14.34% | 17.08% | 19.83% |
| Benxi | 15.06% | 23.48% | 31.89% |
| Dandong | 11.40% | 29.88% | 48.35% |
| Jinzhou | 11.26% | 23.18% | 35.10% |
| Yingkou | 8.24% | 31.26% | 54.28% |
| Fuxin | 13.55% | 29.53% | 45.49% |
| Liaoyang | 9.41% | 16.75% | 24.08% |
| Panjin | −9.12% | 26.47% | 62.05% |
| Tieling | 14.92% | 26.06% | 37.19% |
| Chaoyang | 6.02% | 20.69% | 35.35% |
| Huludao | 20.10% | 25.13% | 30.15% |
Table 5.
The counting number of one city outperforming another.
| Shenyang | Dalian | Anshan | Fushun | Benxi | Dandong | Jinzhou |
| 11.5 | 9.5 | 7.5 | 4.5 | 5.5 | 13.5 | 6.5 |
| Yingkou | Fuxin | Liaoyang | Panjin | Tieling | Chaoyang | Huludao |
| 10.5 | 3.5 | 8.5 | 12.5 | 2.5 | 0.5 | 1.5 |
© 2018 by the authors. Licensee MDPI, Basel, Switzerland. This article is an open access article distributed under the terms and conditions of the Creative Commons Attribution (CC BY) license (http://creativecommons.org/licenses/by/4.0/).
Share and Cite
MDPI and ACS Style
Yi, P.; Li, W.; Li, L. Evaluation and Prediction of City Sustainability Using MCDM and Stochastic Simulation Methods. Sustainability 2018, 10, 3771. https://doi.org/10.3390/su10103771
AMA Style
Yi P, Li W, Li L. Evaluation and Prediction of City Sustainability Using MCDM and Stochastic Simulation Methods. Sustainability. 2018; 10(10):3771. https://doi.org/10.3390/su10103771
Chicago/Turabian StyleYi, Pingtao, Weiwei Li, and Lingyu Li. 2018. "Evaluation and Prediction of City Sustainability Using MCDM and Stochastic Simulation Methods" Sustainability 10, no. 10: 3771. https://doi.org/10.3390/su10103771
Note that from the first issue of 2016, this journal uses article numbers instead of page numbers. See further details here.