Experimental Study on Mitigations of Seismic Settlement and Tilting of Structures by Adopting Improved Soil Slab and Soil Mixing Walls

1
School of Port and Transportation Engineering, Zhejiang Ocean University, Zhoushan 316022, China
2
State Key Laboratory of Hydroscience and Engineering, Tsinghua University, Beijing 100084, China
*
Author to whom correspondence should be addressed.
Sustainability 2018, 10(11), 4069; https://doi.org/10.3390/su10114069
Submission received: 11 October 2018
/
Revised: 27 October 2018
/
Accepted: 2 November 2018
/
Published: 6 November 2018
(This article belongs to the Special Issue Resilience and Sustainability of Civil Infrastructures under Extreme Loads)
Abstract
:Settlement of surface structures due to subsoil liquefaction is a big issue in geotechnical engineering. It has been happening during earthquakes in liquefaction-prone areas for many years. Mitigations have been proposed for this problem. The improved soil slabs and vertical mixing soil walls combined with lowering ground water levels (GWLs) were proposed in this study. Experiments were carried out by adopting a 1-g shaking table test. Two different soil densities with uniform and eccentric loads were included. Combined with lowering GWLs, three different soil slabs with a length of 40, 60 and 80 cm and two different mixing walls with soil and plastic were studied and compared. Results show that the horizontal soil slabs have good performance to reduce the settlement of structures. On the other hand, the vertical soil mixing walls did not reduce the settlement effectively, but its performance could be improved by lowering of GWLs.
1. Introduction
Liquefaction is a phenomenon which was first documented after the 1908 San Francisco earthquake [1]. More than 50 years later in 1964 two big earthquakes in Niigata, Japan and Alaska induced huge settlements to structures triggered by liquefaction, and the research to understand this phenomenon has become more important. Yoshimi and Tokimatsu [2] found and explained the basic mechanism behind the liquefaction through shaking table tests. It is shown that the liquefaction starts when the excess pore water pressure reaches the same value as the total stress in the same point. In that instant, the soil has zero bearing capacity, and it behaves like a fluid more than soil [3]. To stop or lower the damage caused by liquefaction effectively, mitigations should be investigated and then adopted.
Research has been focused on understanding the mechanism of structure settlement. Liu and Dobry [4] have carried out several centrifuge experiments to study the mechanism of settlement and effectiveness of sand densification. They noted that, by soil compaction under the structure, the settlement decreases while the earthquake motion is amplified. Dashti et al. [5,6] studied the mechanism of settlement by conducting shaking table tests. The ground and building settlement were categorized into volumetric and deviatoric groups and in each of them several governing mechanisms were listed. Effects of peak ground acceleration, relative density of ground, liquefiable layer thickness and foundation width were also examined. Mitigations such as installation of water barriers and rigid walls were also proposed and examined to reduce settlement of structures. Tsukamoto et al. [7] mainly focused on the mechanism of rigid circular foundations. Effects of neighboring foundation on settlement of buildings were also examined.
Previous studies show that the mechanism of liquefaction-induced settlement of structures was the main focus of researchers and proposing countermeasures for especially existing structures was not studied as extensively as the mechanism of the problem. Rasouli et al. [8] worked on effects of installation of sheet-pile walls against the problem by carrying out shaking table experiments. Rayamajhi et al. [9] examined the reinforcing mechanism of soil-cement columns. Olarte et al. [10] conducted an experimental study of the performance of 3-story structures with shallow foundations on a saturated soil profile including a thin liquefiable layer. Three different mitigation techniques were evaluated, including ground densification, enhanced drainage with prefabricated vertical drains and reinforcement with in-ground structural walls. Merits and drawbacks of the three mitigations were presented and discussed. Olarte et al. [11] also illustrated the potential tradeoffs associated with liquefaction mitigation involving ground densification with drainage control through a series of centrifuge experiments. They pointed out that enhancing drainage around the densified zone would notably reduce permanent foundation settlement and rotation during all motions but amplified accelerations.
Recently, numerical models have been studied to characterize the behavior of foundations on liquefiable ground. Naesgaard et al. [12] performed a numerical study of 2-D models representing strip foundations on liquefiable soils. The effects of foundation bearing pressure as well as the thickness and limiting strain of the liquefiable material in soil profiles consisting of a cohesive clay crust were investigated. Shahir et al. [13] numerically studied the correlations between the settlement of shallow, rigid box structures and their dimensions of the surrounding densified ground. Bray and Macedo [14] developed a 2-D, linear-elastic model to predict the influence of several parameters on settlement and characterized that influence in the model. Karimi et al. [15] presented results from a comprehensive numerical parametric study of soil foundation structure systems on layered liquefiable deposits. The numerical simulations involved fully-coupled, 3-D, nonlinear dynamic analyses of the soil-foundation-structure (SFS) system. It shows that the relative importance of parameters depend on ground motion intensity and soil relative density.
Generally, experimental and numerical methods have been used to investigate the mechanism behind the structure settlement and performance of different mitigation measures. In this study, to reduce the settlement and tilting of structures, the improved soil slab and deep soil mixing walls were proposed to install under the existing structures. The experiments were conducted using a 1-g shaking table to study the performance of the two mitigation measures. Different ground water levels (GWLs) were also considered in the experiments to address the effects of lowering GWL.
2. Method of Shaking Table Tests
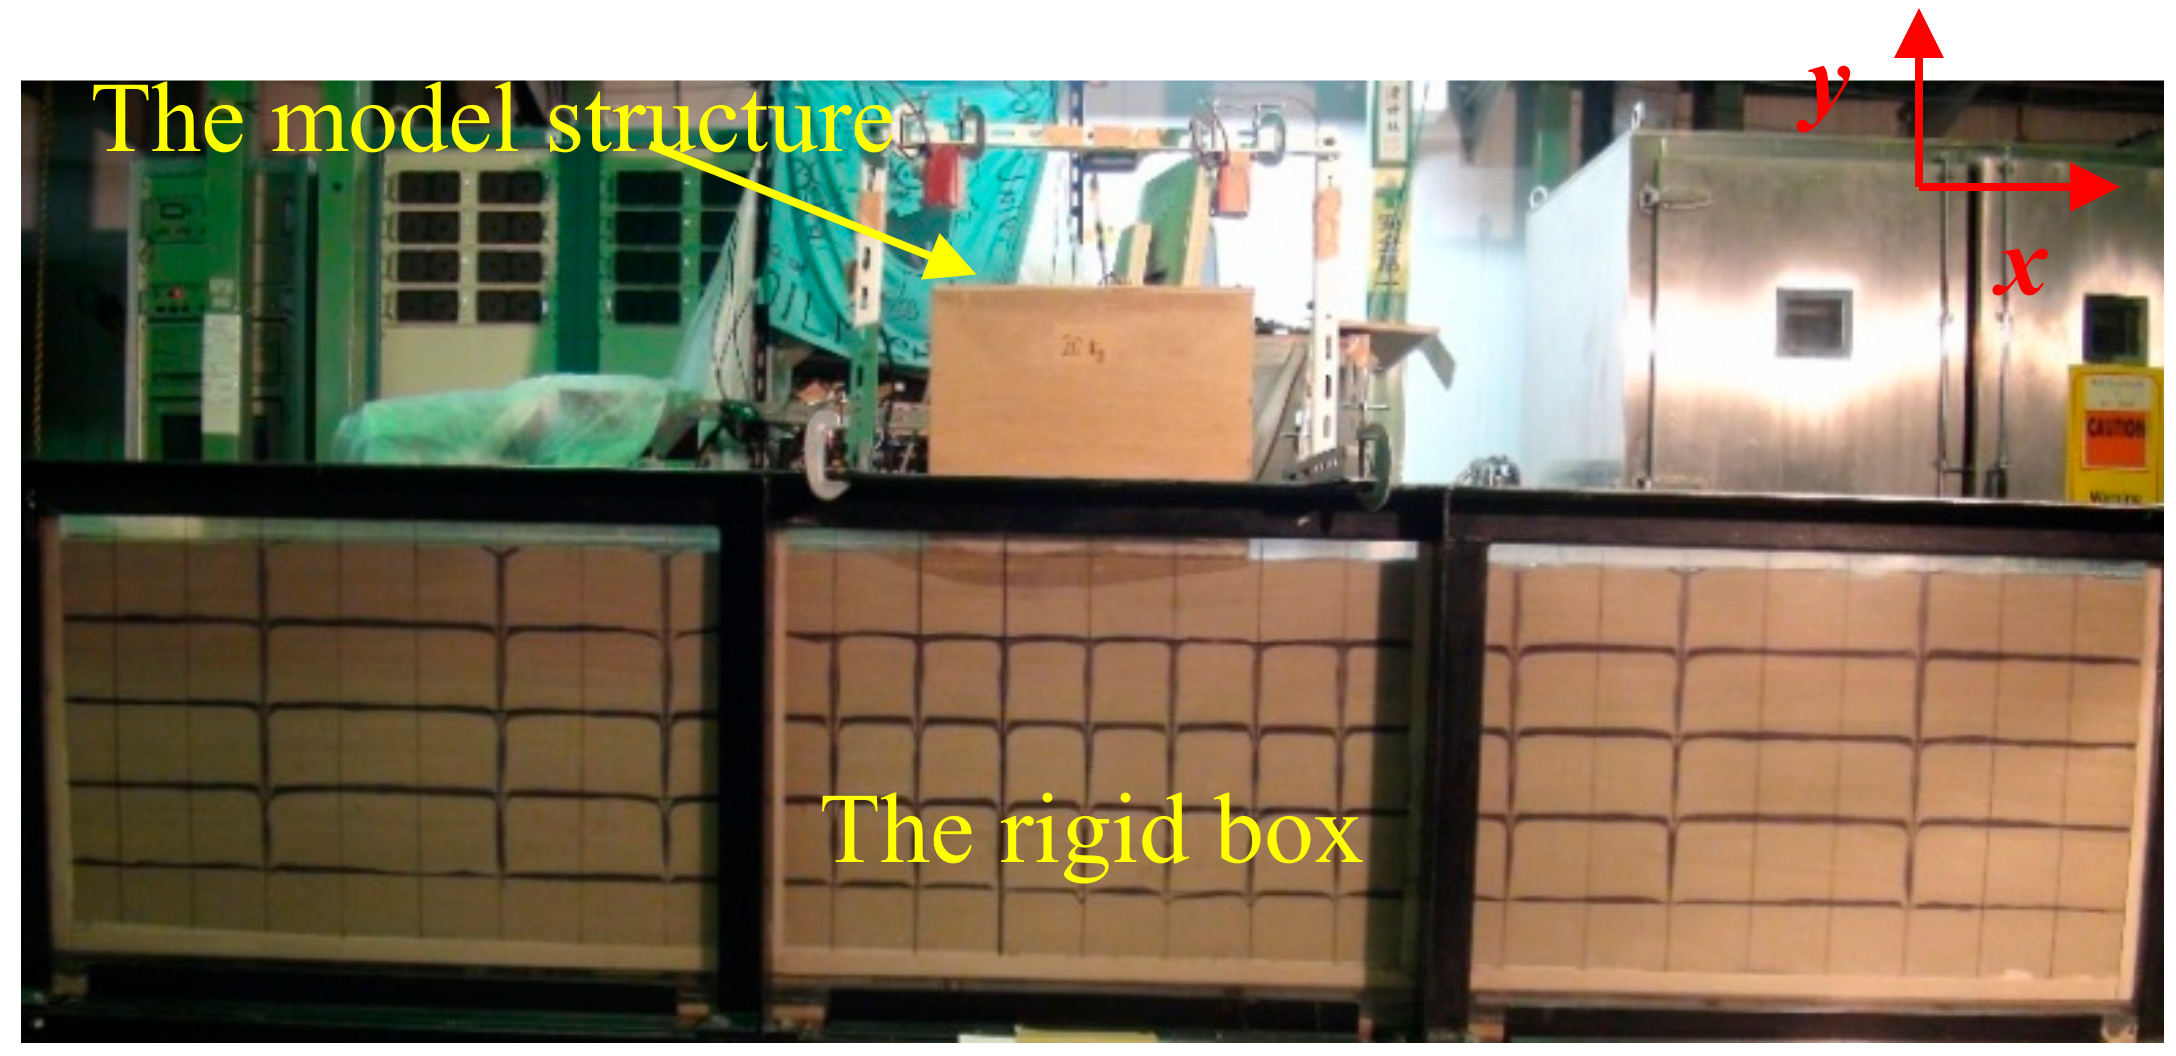
Experiments were conducted on the shaking table with a square plate which can be accelerated in x and y directions. See in Figure 1, a rigid box with acrylic glass sides was fixed on top of the plate. Dimensions of the box are 2.65 0.4 0.6 m (length width height). A wooden box filled with sand takes the role as a model structure in this set of experiments. The total weight of the box is always 20 kg. Together with the dimensions of 37.2 38.5 cm (length width) an average pressure of q = 1369.9 N/m2 resulted. In the case of eccentric load, the model structure has a weight of 7.5 kg in the negative direction of x axis and 12.5 kg on the opposite. That leads to a system with two different loads of qL = 1027.4 N/m2 and qR = 1712.4 N/m2.
The test set up is made up of five layers of sand of which the first bottom layer was compacted with a relative density Dr = 80%, and considered to be not liquefiable. The thickness of each layer is 10 cm. The overlying layers with a relative density Dr = 46% were prepared by water pluviation method. To achieve this relative density, water level was raised up to 10 cm above the bottom layer and then sand was poured uniformly into the water to make loose layers. To show the deformation of the sand visually, a mesh was formed with colored sand. For different GWLs, a drainage system at the bottom of the box was used. After finishing all five layers the model structure was placed on top of the sand in the middle of the box. In all experiments, silica sand No. 7 was prepared and used. The grain size distribution of silica sand No. 7 is shown in Figure 2. Its properties are shown in Table 1.
For the data collection, a set of pore water pressure sensors, accelerometers, displacement transducers and a laser were used and mounted. Layout of the sensors is shown in Figure 1 and Figure 3. The accelerometers and the pore water pressure sensors are fixed in the sand layers to record the behavior of the ground model. On every sand layer, a pore water pressure sensor was put in place and it is possible to measure the excess pore water pressure every 10 cm in height. The horizontal distance of the pore water pressure sensors is 20 cm, with a row of the sensors right underneath the model structure. Before putting the sensors in place, they were saturated in water to avoid false values for the influence of air bubbles. The accelerometers were also placed on every sand layer to measure the acceleration every 10 cm in height. The horizontal distance between the accelerometers is 30 cm, again with a set of sensors right underneath the model structure. With the results from the accelerometers it is possible to show the intensity of the shake in the soil and of the structure. The displacement transducer (LVDT) and laser sensors are fixed to the box to measure the movement of the structure. Apart from the settlement, it is possible to calculate the tilting of the structure.
The input motion is assumed to have an amplitude of 300 Gal and a frequency of 10 Hz over 25 s, see in Figure 4. The duration is longer than most real earthquakes, and the maximum possible subsidence was be measured. The motion was applied in one direction, and the sensor measurement was always taken for 100 s.
3. Results and Discussion
3.1. Performance of Improved Soil Slab against Liquefaction-Induced Settlement of Structures
The idea of the improved soil slab under the structure is to increase the cohesion of the soil and create an additional non-liquefiable layer. The length of the slab has a very big influence on its performance. A bigger area is able to distribute the induced load of the structure, and therefore decreases the actual load acting on the liquefiable soil layer. The thickness of the liquefiable soil layer would also be decreased and lead to less lateral flow of soil.
In this set of experiments, three different soil slabs were tested. The variable therefore was the length of the slabs. The height of 10 cm and the width of 38.5 cm were kept the same in all the three cases. The weight of the slabs should be the same as the sand layer and water should still be able to penetrate. Therefore, silica sand No. 7 with a relative density of Dr = 46% was mixed with 5% of two component epoxy glues and then put into the formwork in one layer. The masses of sand and epoxy glues for each geometry are listed in Table 2. The choice to use epoxy glue is to use the least possible amount of binder to create a rigid structure which would withstand the loads induced by the shaking during the experiment.
After preparing the sand layers, the improved soil slab was placed on top of the sand. The remaining sand was evenly distributed to the left and right side of the box. The slab in the water is sufficient saturated. The specifics of the soil slabs are given in Table 3. For the soil density, a different sieve with a bigger mesh size was used for the water pluviation method. Therefore, two different soil densities were achieved.
After constructing the soil slab, the rigidity could be confirmed and its behavior was totally stiff. The slab works as a good mitigation because it reduced the liquefiable soil layer and the evenly distributed load. The subsidence of improved soil slabs in the four different cases is shown in Figure 5. As seen from the results, the subsidence reaches about 30 mm in the case of 80 cm slab and 63 mm in the case of 40 cm slab. The settlement rate too is lower in the cases of wider slabs. In the four cases, with the regular slabs of 10 cm thickness the settlement reaches the maximum shortly after the strong shaking.
Tilting of the structures with 10 cm thickness slabs are shown in Figure 6. With an eccentric load, the structure was always loaded with 12.5 kg in the positive direction of x axis and 7.5 kg in the other. As expected, the bigger slabs showed less tilting than the smaller one after the shaking. The main cause for the improvement is the smaller resulting moment under the bigger slab.
The horizontal displacement of soil under the 40 cm and 50 cm soil slab is shown in Figure 7. The soil on the right side, where the pressure under the slab is higher, has more displacement. The total displacement of soil in the case of 50 cm slab with a thickness of 5 cm is larger, because the displacement under a thinner slab is easier than the case of thicker slab which reduces the thickness of the liquefiable soil layer. The tilting over time in Figure 7 shows that after a maximum tilting in both cases, a recovery in the opposite direction starts and then tends to smooth for the time when the subsidence is deep enough that the uplift of sand soil mixture can support it. This point is reached at approximately 25 s. After that, the settlement under the lighter side still keeps going on, leading to a reduction of tilting towards the end of shaking.
The lateral movement of the soil under the structure is triggered by the vertical subsidence. The sand during the liquefaction would be barely compacted or compressed. The settlement because of the compression is assumed to be around 3–5% of the liquefiable layer thickness [8]. The rest of the resulting subsidence is therefore caused by the lateral flow of soil away from the foundation. Lateral displacements of the soil at the edge of the slab with three different lengths are shown in Figure 8. The displacement of the 80 cm slab is the smallest compared to the other two slabs apart from the top and bottom parts. This effect is very advantageous to the resulting settlement under the wider structure for the same volume of moved soil and the bigger area of the 80 cm slab leads to less subsidence. The displacement on the left side of the slabs in the case of 40 cm and 60 cm is higher than the right side. The tilting of the structure increases the lateral movement in this direction. Most likely the eccentricity of the resulting load is responsible for this behavior. In the case of 80 cm slab, the tilting is reduced and the lateral displacement in this case is almost symmetric only with a difference in the top 20 cm soil layer.
The mitigation of lowering the GWL was also carried out and compared. Two different GWLs of −5 cm and −10 cm were considered. The load of the structure is 20 kg uniformly loaded. The case 12, also a reduction of the GWL of 10 cm was conducted with an eccentric load. The subsidence is shown in Figure 9. Based on the experimental results, it can be seen that the horizontal soil slab reduces the subsidence during an earthquake. Even the 40 cm soil slab, which is the same length as the structure foundation, shows a significant effect. The lowering of GWL also leads to a reduction of the liquefiable soil layer, but creates a non-liquefiable crust with a higher flexibility compared to the very stiff soil slabs. The 80 cm soil slab leads to a higher subsidence reduction than the −10 cm GWL case which creates a crust over a bigger area. The rigid soil slab seems to have a better pressure distribution than the still flexible and drained soil layer. Case 12 on the other hand shows that the lowering of GWL does not bring immediate results. The saturation of the top layer was still very high before the shaking. Therefore, the excess pore water which was pushed into the top layer because of the rise in pore water pressure in the lower layer led to immediate liquefaction. The higher settlement, even higher than the no mitigation case, can be related to the eccentric load, which led to a tilting of the structure. Higher pressure at the edges of the model structure followed by a larger subsidence shows strong post-shaking behavior.
The pore water pressure curves in Figure 10 of the sensor 20 cm under the surface level show that the pore water pressure has to rise to higher values. The difference under unloaded conditions is very small though and the measured difference correlates with the difference in total stress. Under the structure the difference of pore water pressure is approximately 0.5 kPa for the two sand densities. Further, the denser sand under the structure restricts the water flow. Together with the load of the structure, a pressure level higher than the unloaded conditions is built up. The lower settlement can also come from the bigger uplift created by the higher soil density of the sand. Therefore, the total possible settlement is reduced. The last factor is the consolidation and compaction of the sand during the shaking. The denser grain structure leads to less consolidation and therefore to a reduced consolidation settlement. It is noteworthy that with only two cases and a difference in density it is not possible to get significant results, because the difference can also just be in the range of uncertainty.
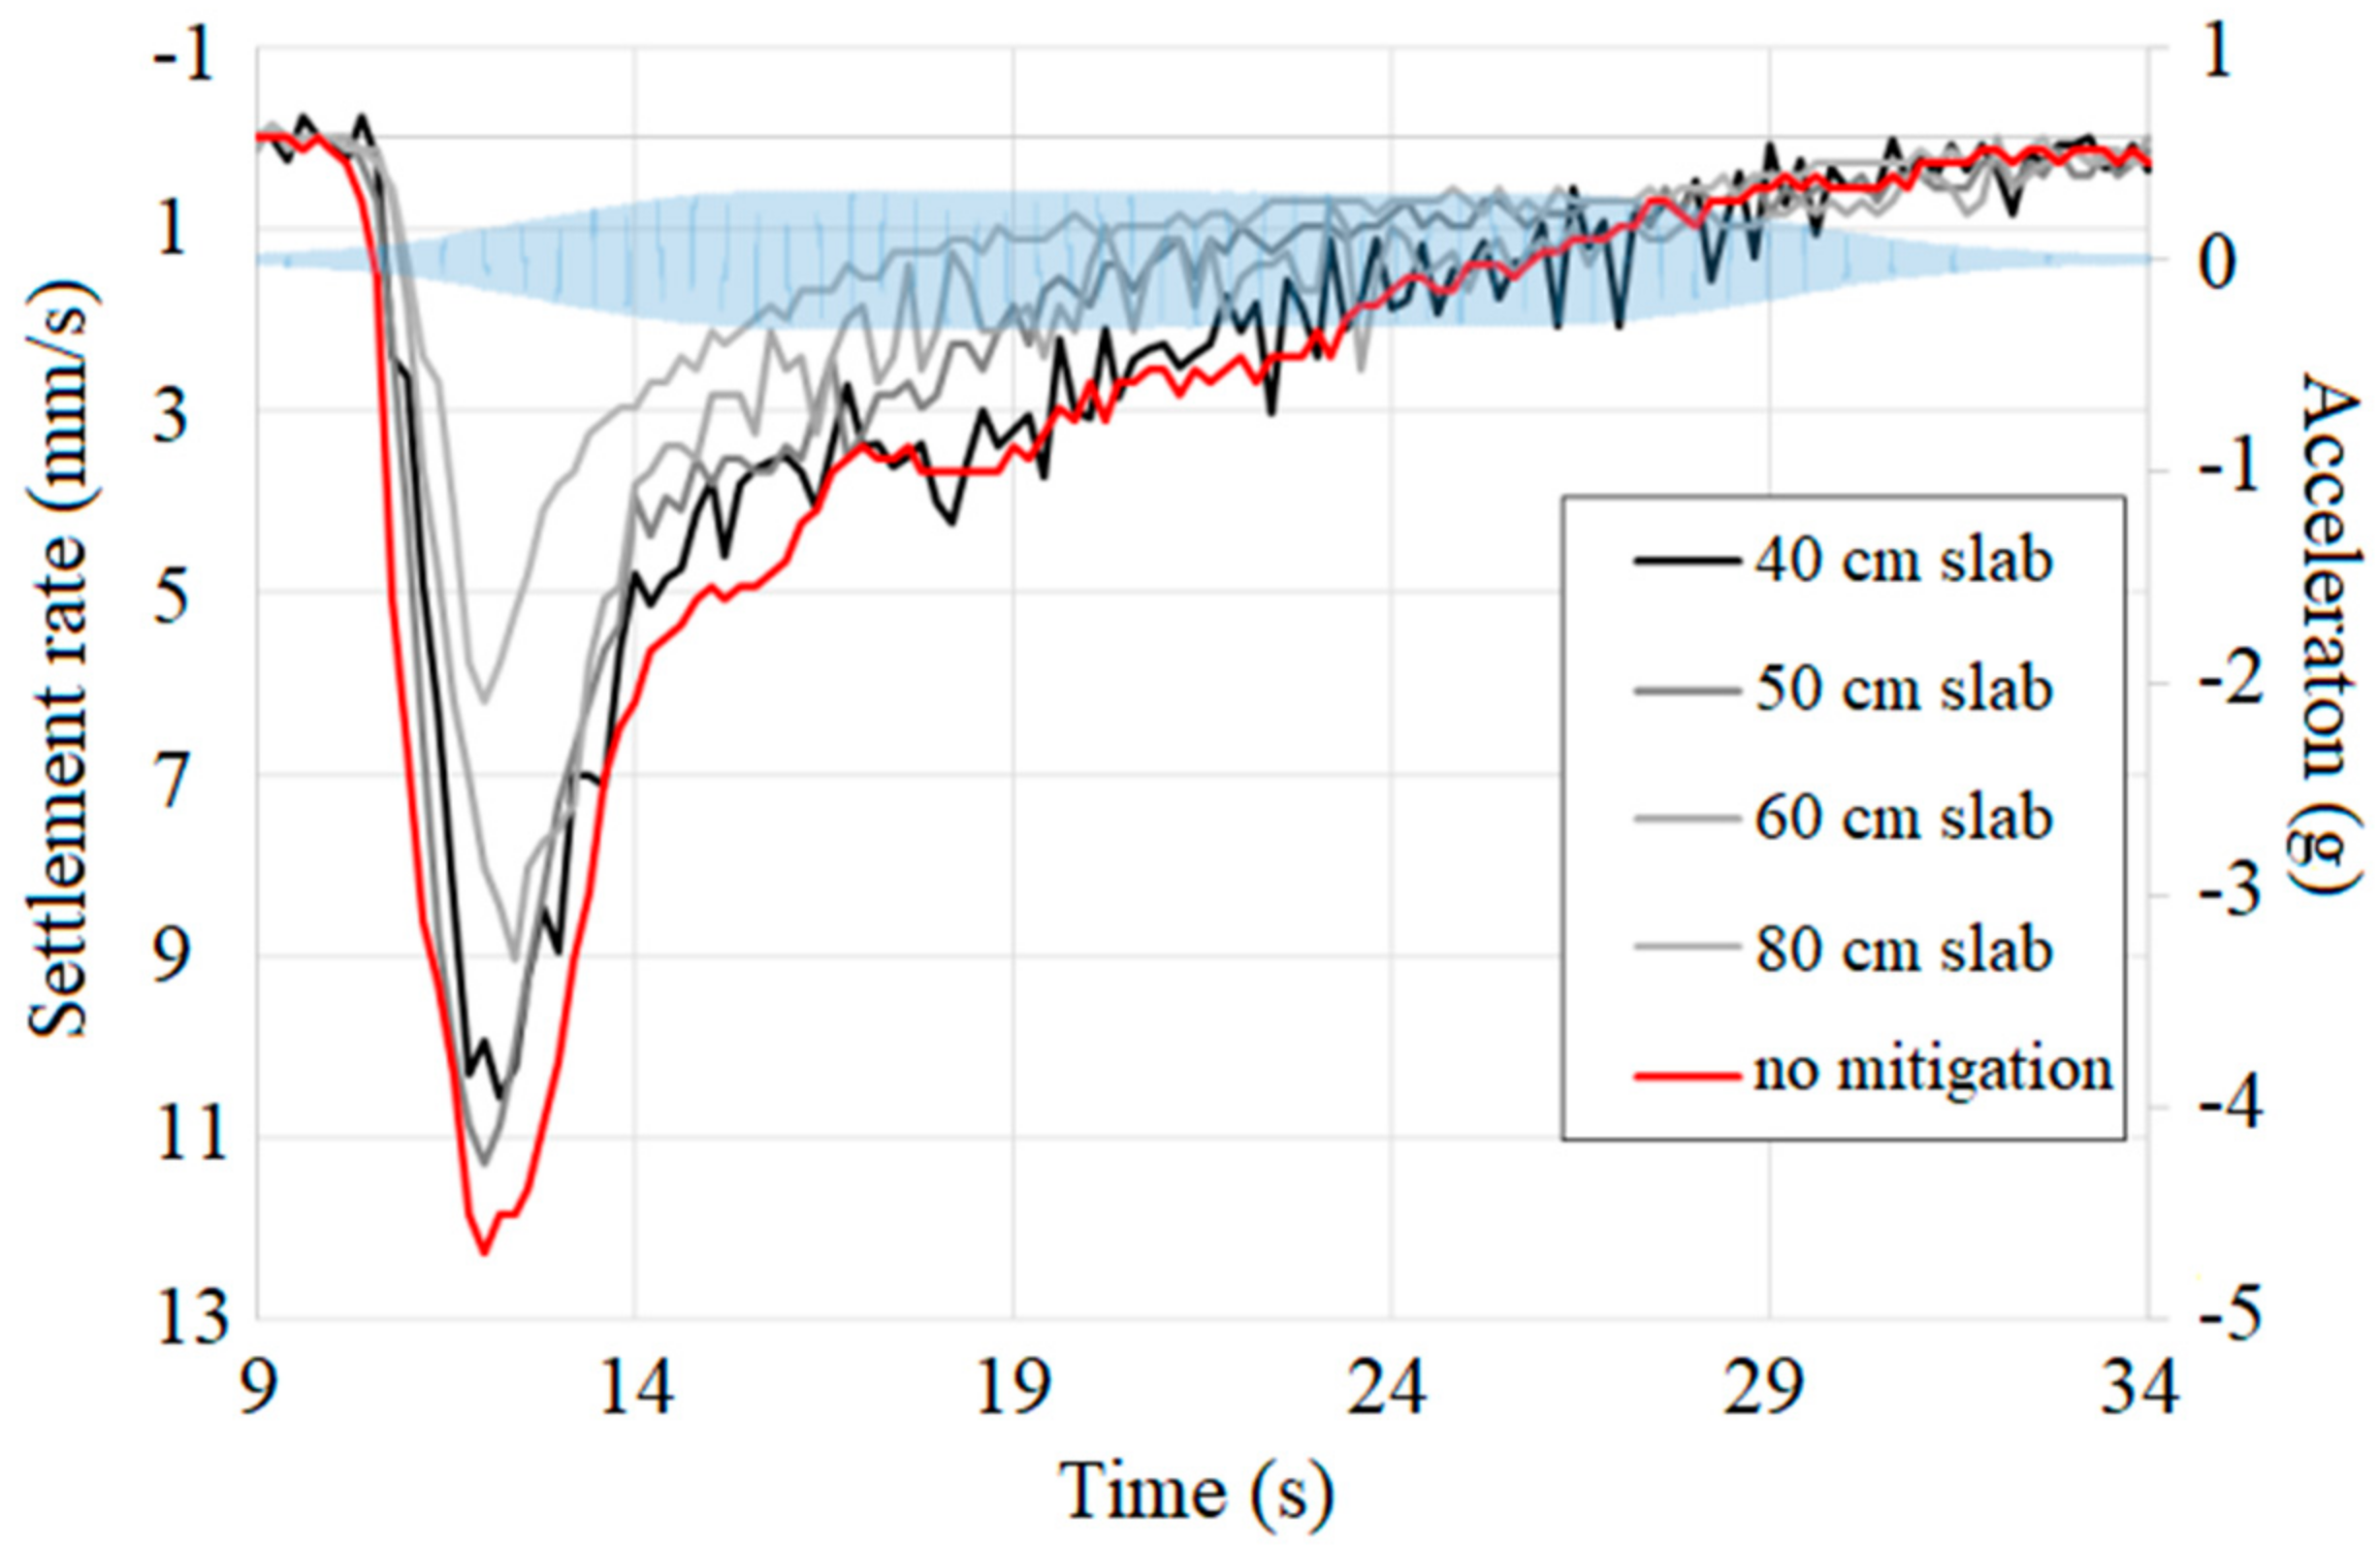
The settlement rate shows how fast the structure sinks into the soil. As shown in Figure 11, the settlement velocity reached its maximum in all cases almost at the same time, meaning a constant increase of settlement rate independent of the length of the slab. The maximum settlement velocity takes place before the input motion reaches its motion amplitude. The thinner slab with a length of 50 cm shows a bigger settlement velocity at the beginning compared to the slabs with 10 cm thickness. The inclination of the velocity curve has the same value as in the case of no mitigation. In general, the length of the slab defines the increase of settlement speed. The wider of the slab is the smaller of the settlement rate. The reason is that the distribution of the structure load over a wider area leads to smaller shear stresses in the soil and a smaller lateral flow of sand.
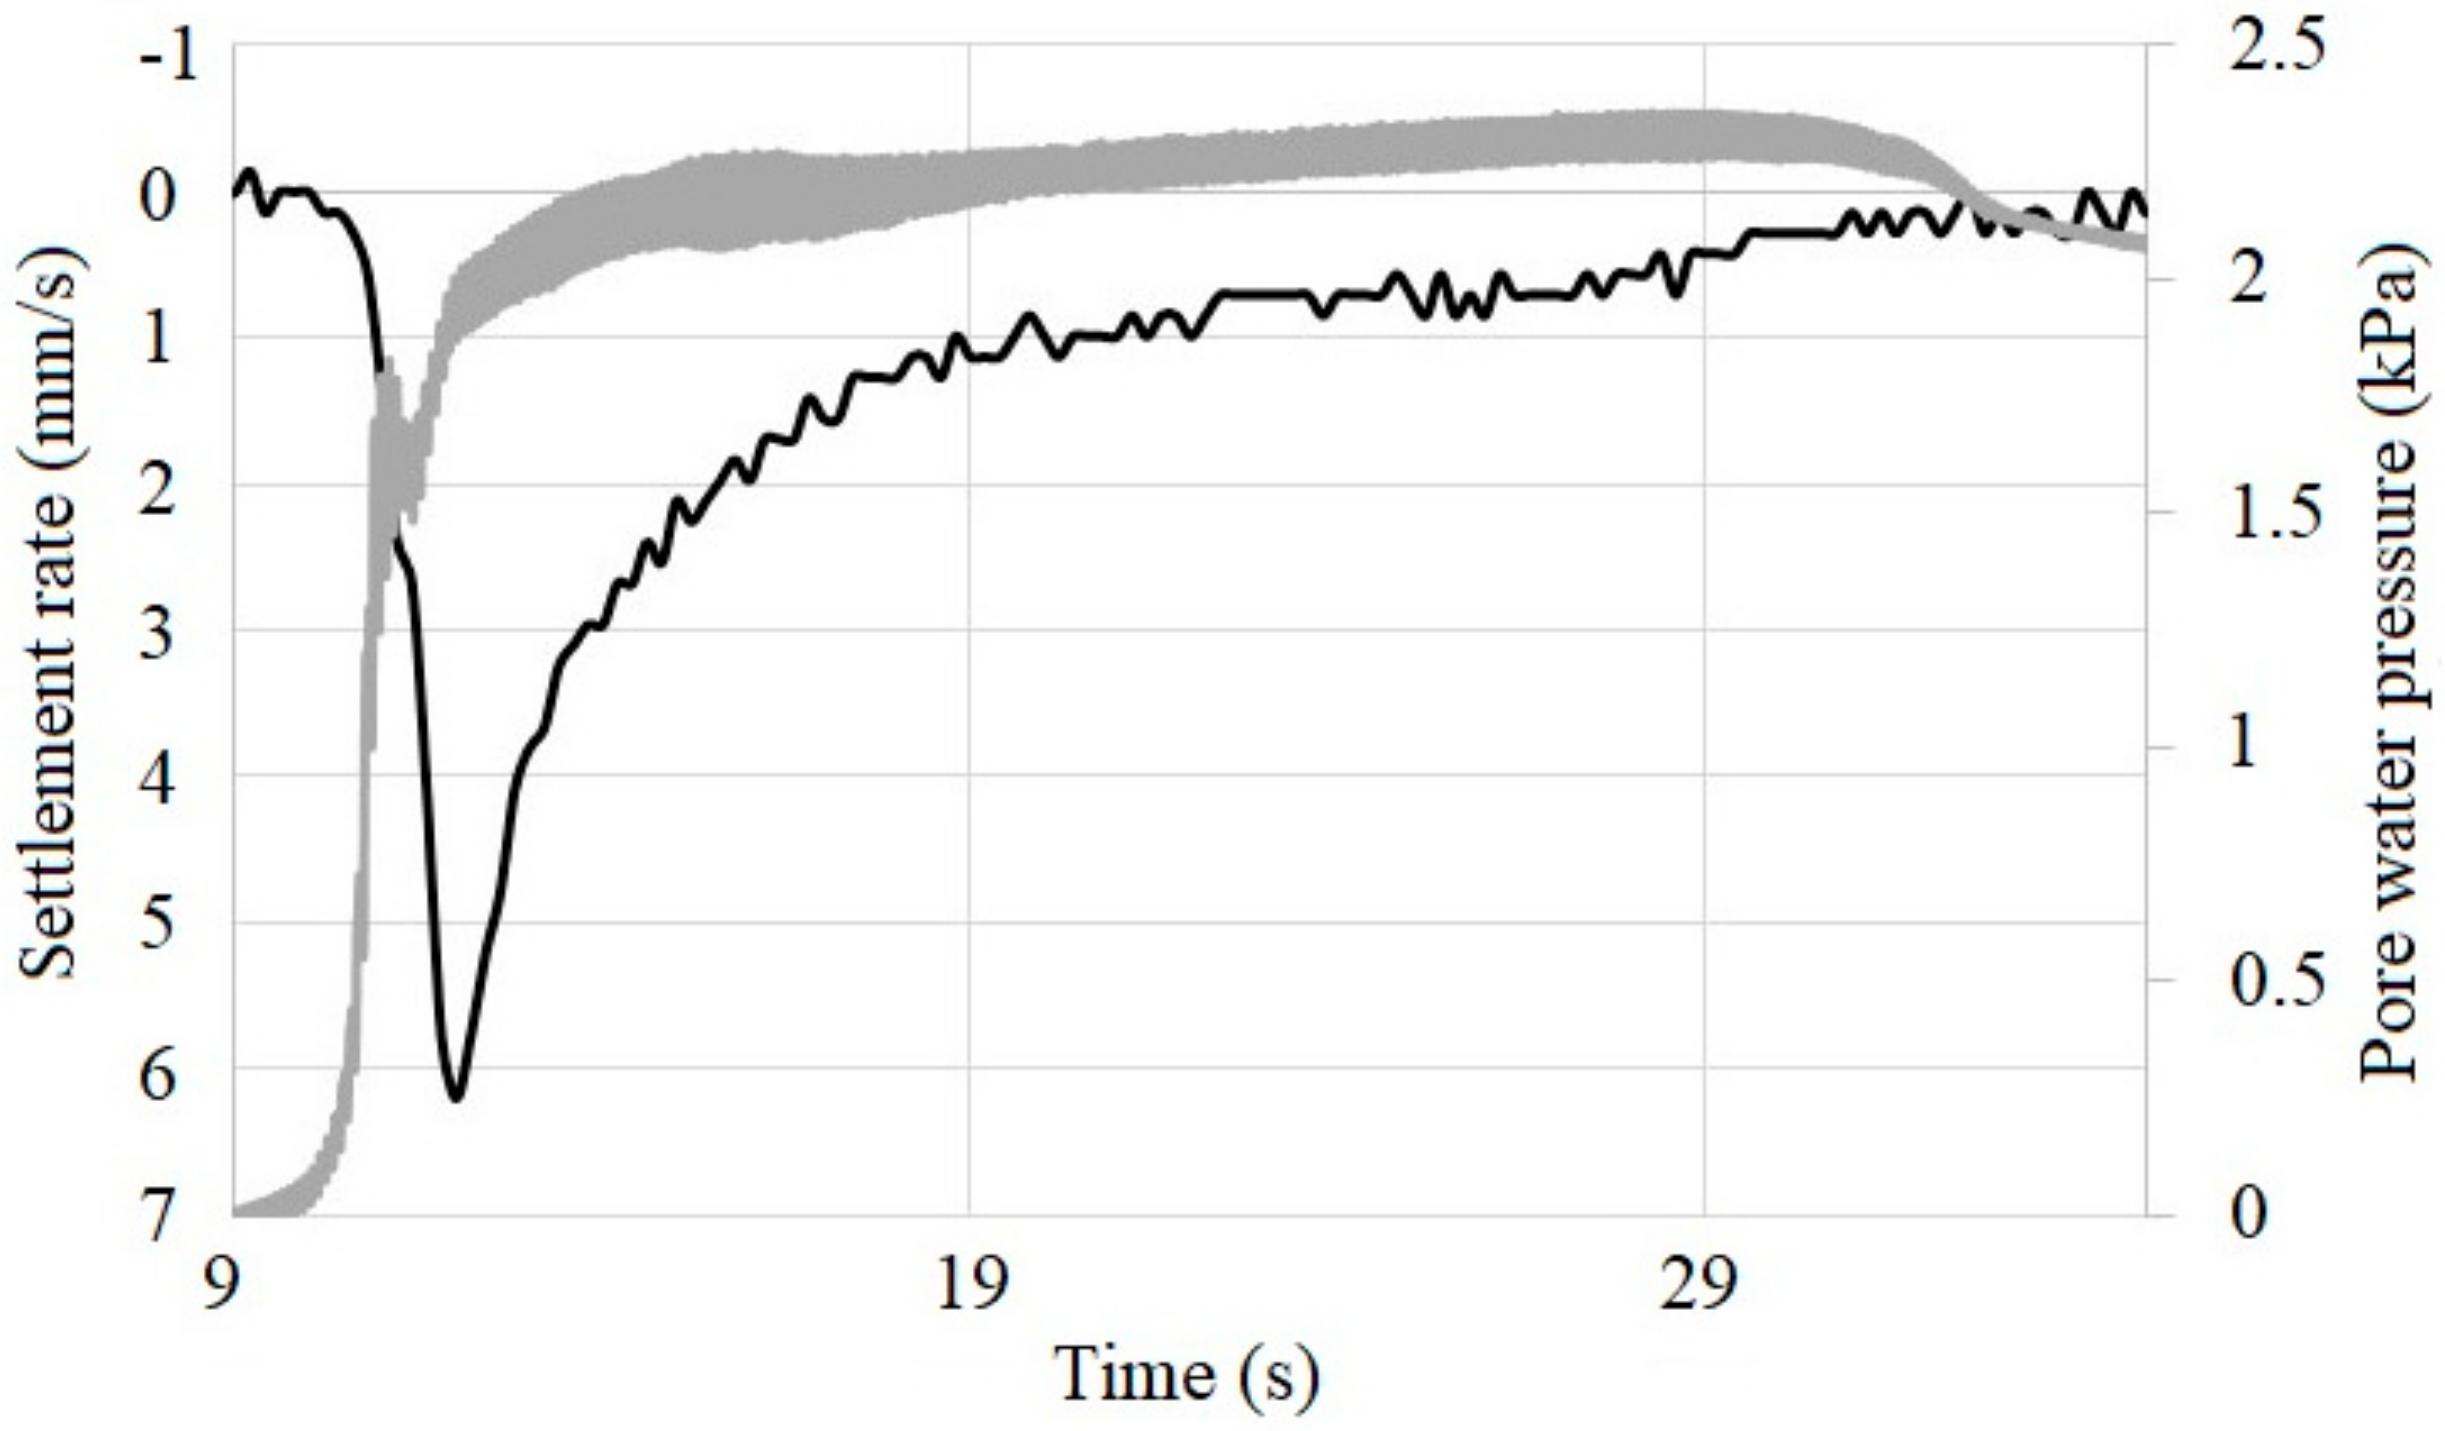
Comparison of the pore water pressure and the settlement rate is shown in Figure 12. The fast increase of settlement velocity is caused by the beginning of liquefaction and the fast rise of pore water pressure. During that time, the settlement mechanisms described by Dashti et al. [5] work and add up to the settlement velocity. After reaching the liquefied state, the main settlement mechanism is the lateral displacement of sand and then the settlement rate decreases steadily.
3.2. Performance of Vertical Deep Soil Mixing Walls against Liquefaction-Induced Settlement of Structures
Experimental set up for the vertical deep soil mixing walls is shown in Figure 13. The bottom was attached with duct tape to the box to create a fixed bottom and prevent the slab from moving during the compaction of the first non-liquefiable soil layer. The soil mixing walls are a few millimeters smaller than the width of the shaking box to allow the movement of the walls. Therefore, a small gap between soil walls and the acrylic glass of the box was unavoidable. Specifics of the testing cases for the vertical deep soil mixing walls are summarized in Table 4. In case 6, 7 and 11, the top layer was prepared to simulate lower GWL. In this section, to assess the effect of the deep soil mixing walls, results of the water barrier are also presented and compared. The latex sheets are used to simulate a water barrier. The latex sheet itself is a very soft material which could allow a lot of deformation of the liquefied sand, but still confine the water inside. Therefore a regular plastic bag with a lot of spare material was fixed to the box walls. This created a sector under the structure which could contain the water inside but allow movement of the soil.
A comparison of the vertical deep soil mixing walls with the water barrier shows a very similar subsidence. Expected was a difference, because of the permeability of the soil walls. It can be assumed that in both cases the same effect led to the shape of settlement curve shown in Figure 14. Therefore the permeability of the soil wall seems to be non-existing, or the excess pore water pressure was decreased in different ways. The pore water pressure shown in Figure 15 leads to the assumption that the dissipation mechanism is similar, meaning that the settlement should show a very similar trend. In case of the water barrier, the pore water pressure dissipation starts a little later, leading to a later stop of settlement.
Figure 16 shows the ultimate state seen by the colored sand. Both are very similar, which supports the assumption of similar settlement mechanisms. During liquefaction, between the structure and walls, water was pushed upwards and overtopped the walls. In both cases, the wall and the plastic bag too were pushed outwards. The type of movement is different though. In case of the plastic bag the shape of the bag was similar to the shape of the colored sand with large movement in the middle of the liquefiable soil layer. The walls rotated around the bottom and had the largest displacement at the top. This movement led to a movement of the untouched sand outside of the walls over the whole liquefiable layer height. The outwards movement of the walls created a bigger volume under the structure and decreased the density of the sand and the maximum possible uplift force was decreased, leading to higher subsidence, also after the shaking. After the biggest amplitude of the input motion the total settlement was still not reached, and the pore water pressure was still high enough to keep the sand in a liquefied state.
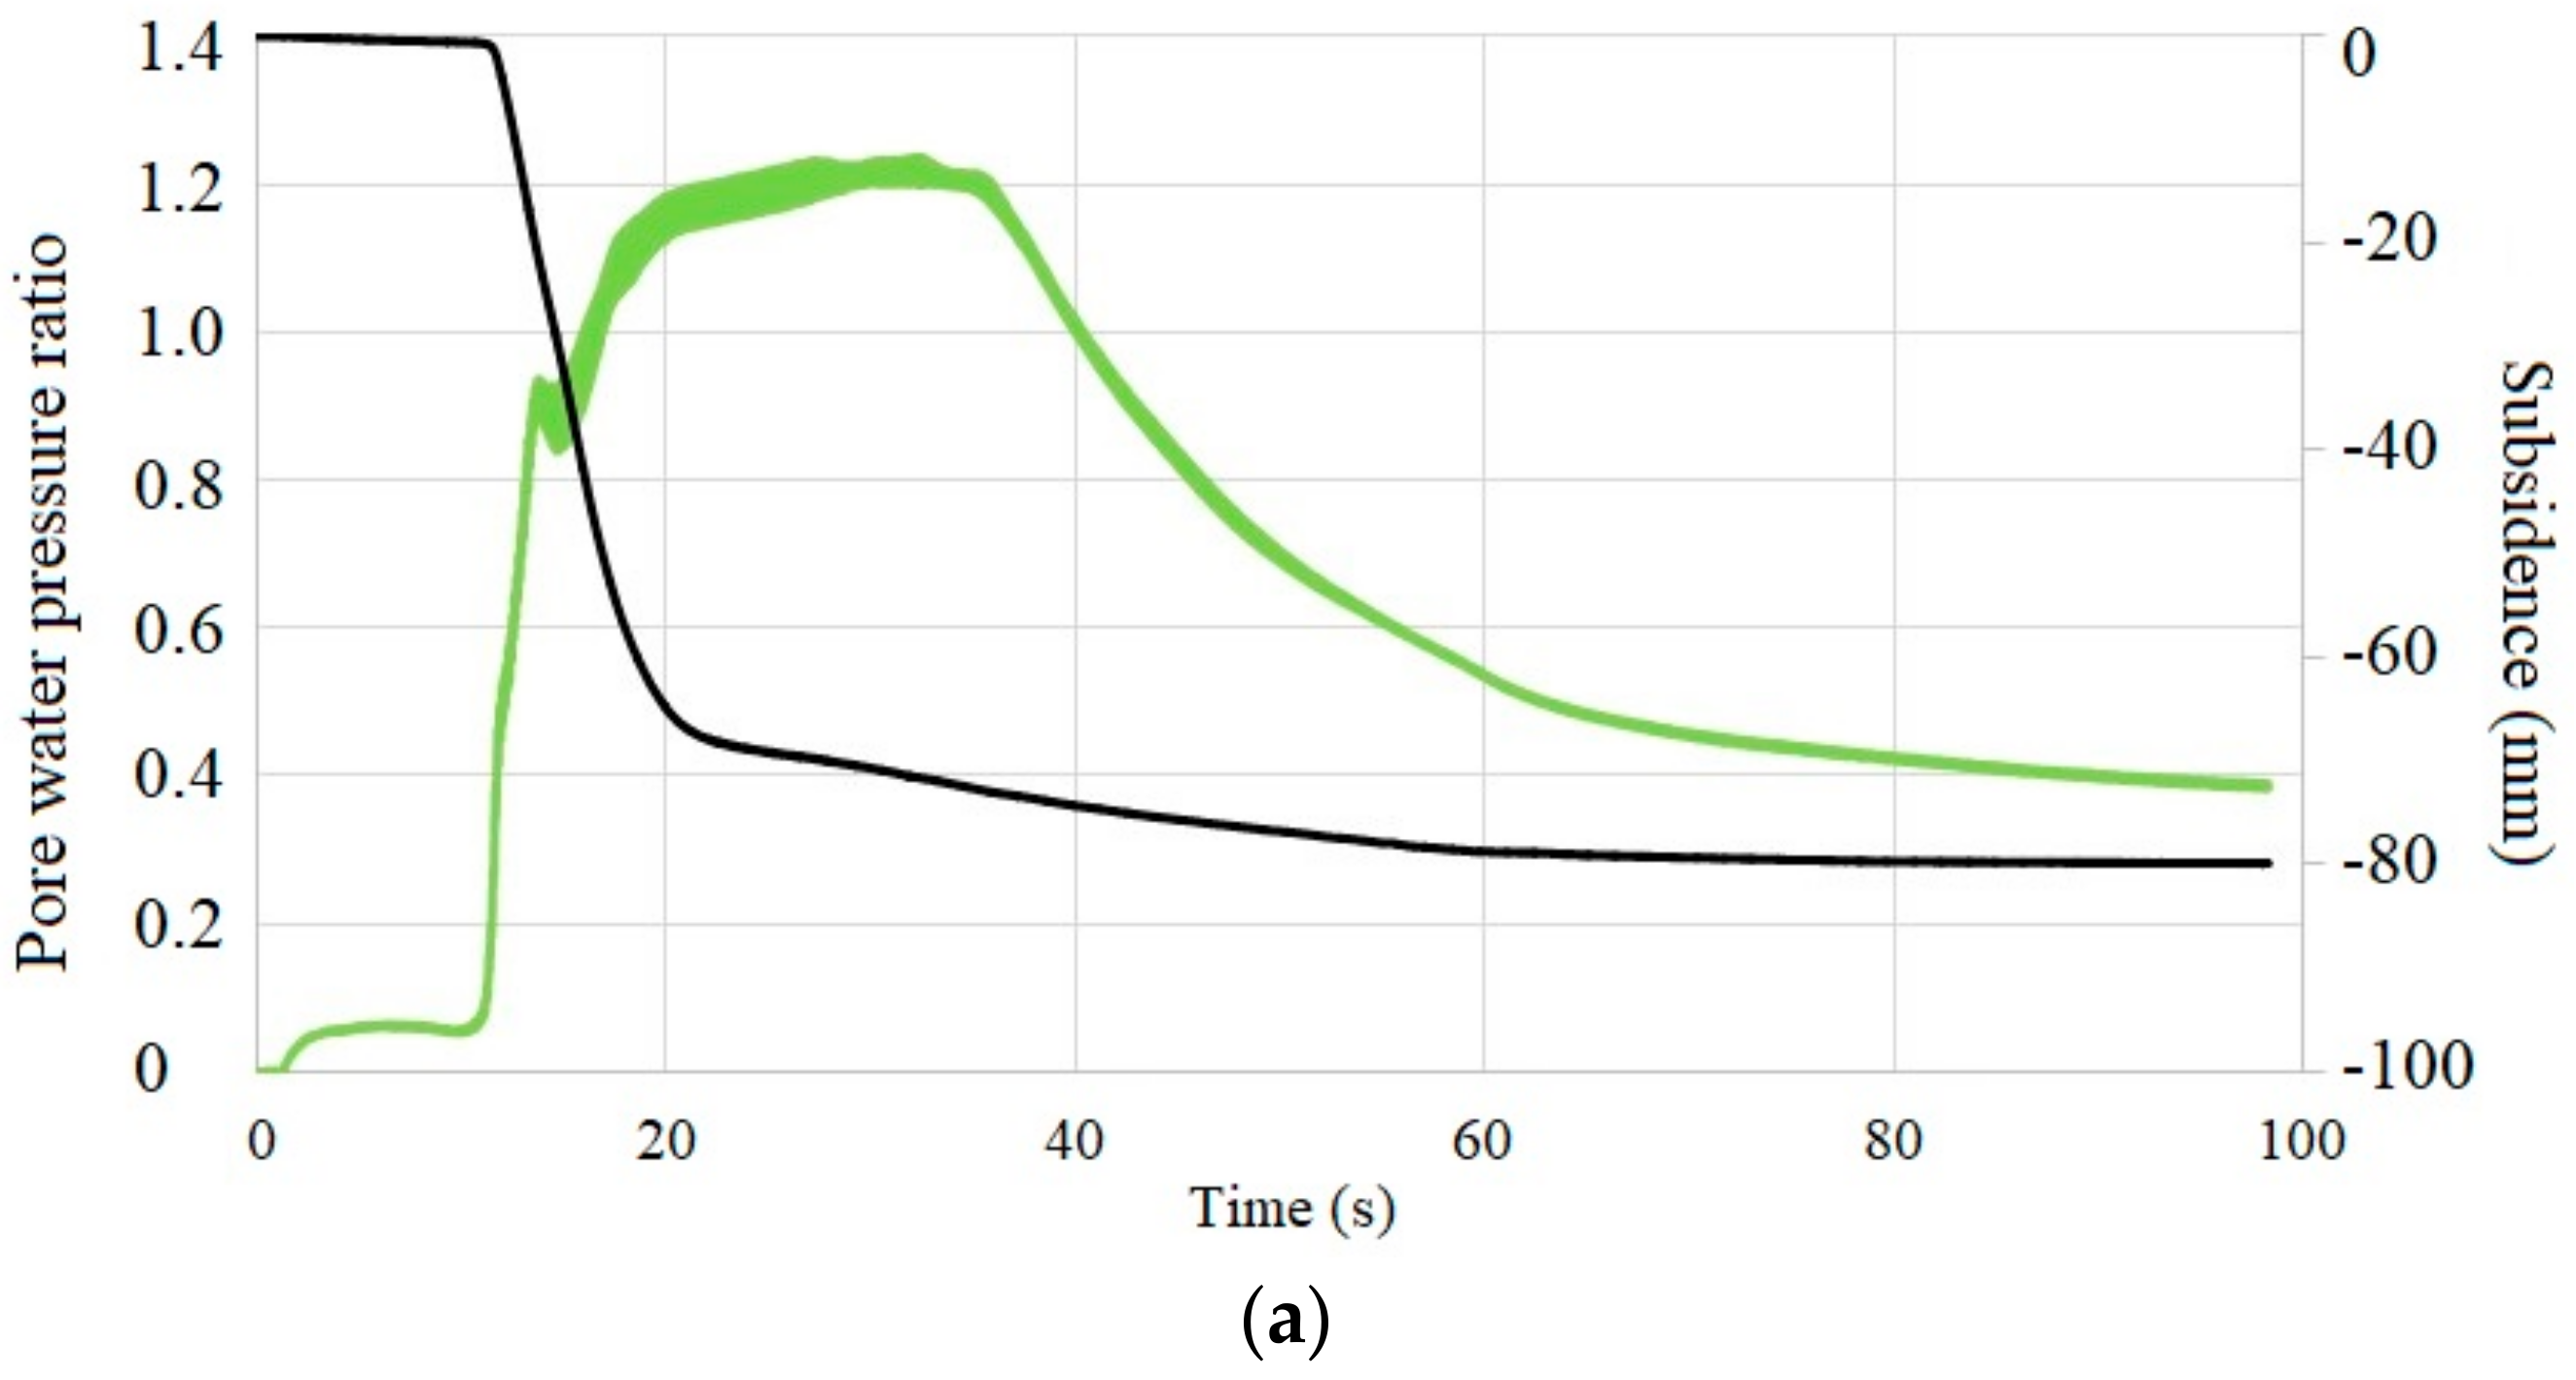
Figure 17 shows the subsidence over time compared with the pore water pressure ratio of case 5 and 10. In the first stage a very rapid settlement happens until reaching around 70 mm. After that the settlement still increases for a long time after the end of shaking. The rapid settlement at the beginning can be correlated with the shaking, which supports the effect of settlement. After that the excess pore water pressure caused by the entrapped water and therefore the reduced effective stress still leads to a bearing capacity problem and to further settlement until the point of maximum possible settlement.
The dissipation of pore water pressure is also linked to the maximum possible settlement. The stop in settlement causes the pore water dissipation rate to change to smaller values because the total stresses in the soil do not change anymore. Additionally, the slower or the stopped settlement of the soil reduces the dissipation rate of the pore water pressure because the sensor does not change its position anymore and the hydraulic pressure caused by the ground water stays the same. The only measured difference at this point is the decreasing excess pore water pressure.
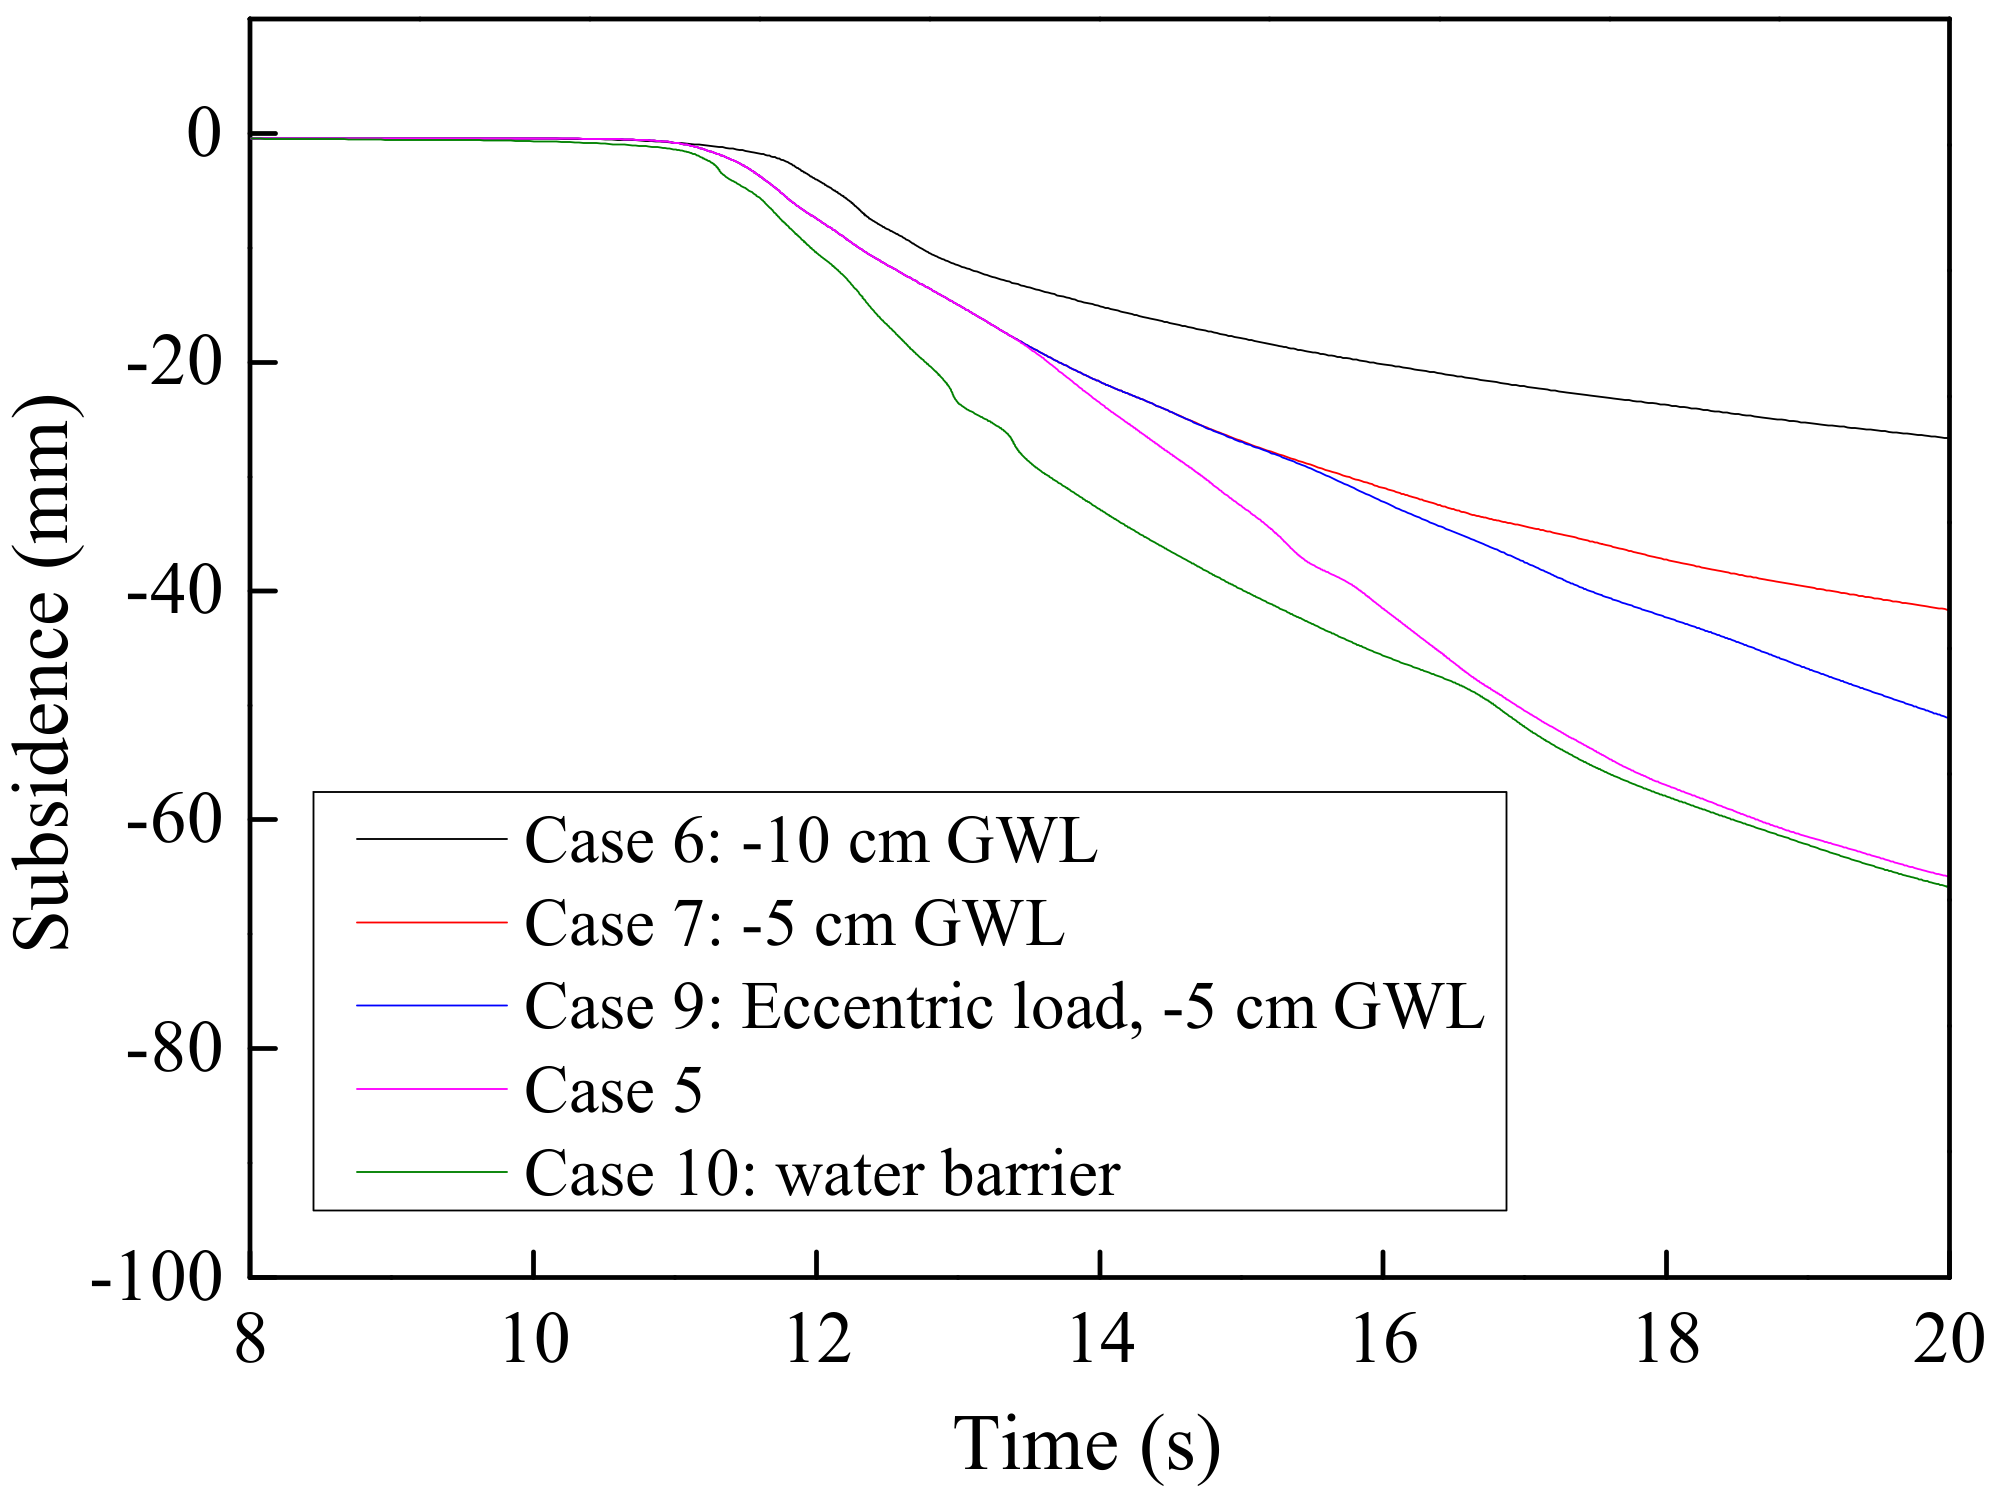
The trend of subsidence at the beginning differs in all the cases as shown in Figure 18. A big influence shows the lowering of the GWL. This is the same effect as already discussed in the previous section; the distribution of the structure load over a bigger area, and therefore a stronger influence of the uplift force. Results show that in case of the −5 cm GWL the eccentric and uniform load show a very similar behavior in the first stage of the shaking. After about 15 s, the eccentric load of the model structure starts to tilt and destroy the top layer and settlement keeps increasing. The water barrier case settles in the first stage faster than the vertical soil walls. The pore water pressure cannot be responsible for this behavior, because the development of pore water pressure in the case of soil walls is faster than the plastic bags. Therefore, the movement of the plastic bag would be the reason for the faster settlement velocity in the beginning. The vertical deep soil mixing wall in combination with lowering groundwater level shows very good performance. Case 6 with lowering the GWL −10 cm reached the smallest settlement of all the experiments.
In the previous section, the focus was mainly on the soil behavior between the walls. The idea of building a wall structure under a foundation is to decouple the overall liquefaction and produce a confined space, where with the same input motion less subsidence occurs. The area outside of the walls was untouched and experienced in the end just the regular consolidation, volumetric and sedimentation settlement. Only in case 5, without additional mitigation and the water barrier, the moving of the wall influenced the surrounding soil and induced significant lateral displacement of the top layer.
The pore water pressure inside the soil walls develops differently from outside of the walls (see Figure 19). In every case the pore water pressure directly under the structure rises slower than in other places. Outside of the walls the pore water pressure can rise easily to a certain value. The small rise during the shaking can be correlated to the volumetric, sedimentation and consolidation settlement and is most linear. In case 5, the curves are at different pressures. A pressure gradient is developing which is inclined compared to the soil level. This pressure gradient later influences the dissipation of pore water pressure.
The velocity diagram in Figure 20 of the settlement shows a very surprising behavior for the case 5 of no additional mitigation to the vertical deep soil mixing walls. In the case of lowering GWL, the peak velocity is reached after a short time, and decreases uniformly to zero. In the case of the water barrier, the velocity of subsidence keeps increasing and reaches the highest value, even higher than the case without mitigation. The settlement velocity decreases slower than in other cases. The soil flow is not restricted by the vertical walls and can expand, which leads to higher lateral displacement and in the end to vertical subsidence. In the cases of lowered GWL which fixed the top of the soil walls, the decrease in settlement velocity is much higher.
An unexpected event is the increase of settlement speed in case of no additional mitigation to the vertical deep soil mixing walls. After reaching a first peak at the same time as the no mitigation and the water barrier case, the settlement velocity decreases, and at the time the shaking reaches the maximum amplitude of 300 gal, the settlement velocity increases again.
The rate develops in the same way for both cases in the beginning of shaking (see in Figure 21). After 14 s, the settlement velocity is not decreasing at the same rate anymore. In the case of the eccentric load, the decreasing of the velocity stays at the same rate, which can also be seen in the subsidence curve. Responsible is the tilting of the structure, which increases the pressure on the soil in a smaller area than the case of a uniform loaded model structure. The uplifting soil cannot support the structure, the drained layer breaks and saturates. Therefore the settlement rate is higher over the whole time of shaking and does not decrease until the end of the shaking. Then the shear stress reaches almost zero, and the settlement rate decreases very fast to zero. Additionally, the walls tilted in the case of eccentric load. As explained before, because of the destruction of the drained top layer, movement of the soil wall became possible, which leads to higher lateral soil flow, same as in the case of no additional mitigation.
4. Conclusions
To mitigate liquefaction-induced settlement and tilting of structures, the improvement soil slabs and soil mixing walls combined with lowering GWLs were proposed and investigated. Model tests were carried out based on a 1-g shaking table. Results of this study would be helpful for practical implementation of soil slabs and mixing walls against liquefaction-induced settlement and tilting of structures in future. Important findings of the experiments can be drawn and listed as follows.
1. The horizontal improved soil slabs show a very good performance. The ultimate settlement, tilting and settlement rate was reduced obviously compared to the case of no mitigation. With a length of 80 cm, the subsidence is 30 mm which is the smallest among the investigated cases. When the length is 40 cm, the subsidence increases to nearly two times of the case of 80 cm. The reduction of subsidence was strongly influenced by the length of the slab. The thickness on the other hand was not the main deceiving factor.
2. The vertical deep soil mixing walls showed a disappointing behavior. The settlement was not reduced at all compared to no mitigation. In the case of soil and plastic walls, the subsidence of the model structure are large and reach to 85 mm and 80 mm, separately. However, lowering of the GWL in combination with the vertical soil walls performed well in reducing the subsidence. Combined with −10 cm GWL, the subsidence is reduced to 35 mm. From the results, it can be seen that the lowering of GWL is the main reason behind the reduction of subsidence.
3. The tilting of the structure can be easily reduced by building a horizontal soil slab under the structure. As expected, the length of the slab governs the resistance against tilting. The wider the slab is, the less of the tilting. The thickness of the slab too has an influence.
4. All the cases showed that the settlement rate depends on the length of the substructure. The distribution of the structure load led to different rates of settlement. In each case during the quick rise of pore water pressure the highest settlement rate is measured. In the first stage, the subsidence is mainly governed by the lateral soil flow and loss of bearing capacity of the soil. A slow settlement rate can be advantageous because the duration of an earthquake and the intensity is usually shorter than the applied motion in these experiments. Generally, if liquefaction occurs, settlement of the structure also occurs. With a smaller settlement rate, the maximum subsidence is reduced.
Author Contributions
J.Z. wrote the manuscript and Y.C. performed the experiments.
Funding
Support for this research was provided partly by the National Natural Science Foundation of China under Award no. 51809237.
Acknowledgments
The authors thank the two anonymous reviewers, who have given valuable recommendations to improve the paper.
Conflicts of Interest
The authors declare no conflict of interest.
References
- Youd, T.L.; Hoose, S. Historic Ground Failures in Northern California Triggered by Earthquakes; U.S. Government Publishing Office: Washington, DC, USA, 1978.
- Yoshimi, Y.; Tokimatsu, K. Settlement of Buildings on Saturated Sand during Earthquakes. J. Jpn. Soc. Soil Mech. Found. Eng. 1977, 17, 23–38. [Google Scholar] [CrossRef]
- Terzaghi, B.K. Theoretical Soil Mechanics; Chapman & Hall: London, UK, 1959. [Google Scholar]
- Liu, L.; Dobry, R. Seismic response of shallow foundation on liquefiable sand. J. Geotech. Geoenviron. Eng. 1997, 6, 557–567. [Google Scholar] [CrossRef]
- Dashti, S.; Bray, J.D.; Pestana, J.M.; Riemer, M.; Dan, W. Mechanisms of Seismically Induced Settlement of Buildings with Shallow Foundations on Liquefiable Soil. J. Geotech. Geoenviron. Eng. 2009, 137, 151–164. [Google Scholar] [CrossRef]
- Dashti, S.; Bray, J.D.; Pestana, J.M.; Riemer, M.; Dan, W. Centrifuge Testing to Evaluate and Mitigate Liquefaction-Induced Building Settlement Mechanisms. J. Geotech. Geoenviron. Eng. 2010, 136, 918–929. [Google Scholar] [CrossRef]
- Tsukamoto, Y.; Ishihara, K.; Sawada, S.; Fujiwara, S. Settlement of Rigid Circular Foundations during Seismic Shaking in Shaking Table Tests. Int. J. Geomech. 2012, 12, 462–470. [Google Scholar] [CrossRef]
- Rasouli, R.; Towhata, I.; Hayashida, T. 1-g Shaking Table Tests on Mitigation of Seismic Subsidence of Structures. In Proceedings of the International Conference on Physical Modeling in Geotechnics 2014, Perth, Australia, 14–17 January 2014. [Google Scholar]
- Rayamajhi, D.; Tamura, S.; Khosravi, M.; Boulanger, R.W.; Wilson, D.W.; Ashford, S.A.; Olgun, C.G. Dynamic Centrifuge Tests to Evaluate Reinforcing Mechanisms of Soil-Cement Columns in Liquefiable Sand. Available online: https://ascelibrary.org/doi/10.1061/%28ASCE%29GT.1943-5606.0001298 (accessed on 5 November 2018).
- Olarte, J.; Paramasivam, B.; Dashti, S.; Liel, A.; Zannin, J. Centrifuge modeling of mitigation-soil-foundation-structure interaction on liquefiable ground. Soil Dyn. Earthq. Eng. 2017, 97, 304–323. [Google Scholar] [CrossRef]
- Olarte, J.C.; Dashti, S.; Liel, A.B.; Paramasivam, B. Effects of drainage control on densification as a liquefaction mitigation technique. Soil Dyn. Earthq. Eng. 2018, 110, 212–231. [Google Scholar] [CrossRef]
- Naesgaard, E.; Byrne, P.M.; Huizen, G.V. Behaviour of light structures founded on soil ‘crust’ over liquefied ground. In Geotechnical Earthquake Engineering and Soil Dynamics III; American Society of Civil Engineers: Reston, VA, USA, 1998. [Google Scholar]
- Shahir, H.; Pak, A.; Ayoubi, P. A performance-based approach for design of ground densification to mitigate liquefaction. Soil Dyn. Earthq. Eng. 2016, 90, 381–394. [Google Scholar] [CrossRef]
- Bray, J.D.; Escudero, J.M. Ishihara Lecture: Simplified Procedure for Estimating Liquefaction-Induced Building Settlements. In Proceedings of the International Conference on Soil Mechanics and Geotechnical Engineering 2017, Seoul, Korea, 17–22 September 2017. [Google Scholar]
- Karimi, Z.; Dashti, S.; Bullock, Z.; Porter, K.; Liel, A. Key predictors of structure settlement on liquefiable ground: a numerical parametric study. Soil Dyn. Earthq. Eng. 2018, 113, 286–308. [Google Scholar] [CrossRef]
Figure 1.
Shaking table with experimental set up.

Figure 2.
Grain size distribution of silica sand No. 7.

Figure 3.
Layout of the sensors.

Figure 4.
The input motion.

Figure 5.
Subsidence of improved soil slabs.

Figure 6.
Tilting of the soil slabs with three different lengths, (a) 40 cm, (b) 60 cm, (c) 80 cm.

Figure 7.
(a) Tilting over time of the structure and (b) horizontal displacement of soil for 40 cm and 50 cm soil slabs.
Figure 7.
(a) Tilting over time of the structure and (b) horizontal displacement of soil for 40 cm and 50 cm soil slabs.

Figure 8.
Lateral displacement of the soil at the edge of the slab.

Figure 9.
Subsidence of soil slab and lowering of ground water level (GWL).

Figure 10.
Pore water pressure for case 1 and 8, (a) under structure and (b) under unloaded area.

Figure 11.
Settlement rate of improved soil slabs.

Figure 12.
Settlement rate compared to the pore water pressure of 80 cm slab.

Figure 13.
Experimental set up for vertical deep soil mixing walls, (a) plastics and (b) soil.

Figure 14.
Subsidence of vertical deep soil mixing wall.

Figure 15.
Pore water pressure of case 5 and water barrier.

Figure 16.
Ultimate state of (a) case 5 and (b) case 10.

Figure 17.
Subsidence and pore water pressure ratio for (a) case 5 and (b) case 10.


Figure 18.
Subsidence of vertical soil mixing walls at the beginning.

Figure 19.
Pore water pressure of case 5, vertical deep soil mixing wall without additional mitigation.
Figure 19.
Pore water pressure of case 5, vertical deep soil mixing wall without additional mitigation.

Figure 20.
Settlement rate of vertical deep soil mixing walls and water barrier.

Figure 21.
Settlement rate for eccentric and uniform load in the cases of vertical sheet pile walls with −5 cm GWL.
Figure 21.
Settlement rate for eccentric and uniform load in the cases of vertical sheet pile walls with −5 cm GWL.


Table 1.
Properties of silica sand No. 7.
| Items | Value |
|---|---|
| Maximum void ratio, emax | 1.25 |
| Minimum void ratio, emin | 0.749 |
| Specific gravity, Gs (kg/m3) | 2650 |
| Effective weight, (Dr = 46%) (N/m3) | 7915 |
| Effective weight, (Dr = 80%) (N/m3) | 8649 |
Table 2.
Weight of soil slabs and epoxy glue.
| Slab Length | Mass of Sand | Mass of Epoxy Glue | Total Mass |
|---|---|---|---|
| 40 cm | 20.19 kg | 1.01 kg | 21.2 kg |
| 60 cm | 30.28 kg | 1.51 kg | 31.8 kg |
| 80 cm | 40.37 kg | 2.02 kg | 42.4 kg |
Table 3.
Testing cases of improved soil slab.
| Cases | Slab Length | Slab Thickness | Load | Soil Density |
|---|---|---|---|---|
| Case 1 | 60 cm | 10 cm | Eccentric | 52% |
| Case 3 | 40 cm | 10 cm | Eccentric | 46% |
| Case 4 | 80 cm | 10 cm | Eccentric | 46% |
| Case 8 | 60 cm | 10 cm | Eccentric | 46% |
| Case 11 | 50 cm | 5 cm | Eccentric | 46% |
| Case 12 | none | −10 cm GWL | Eccentric | 46% |
Table 4.
Cases testing of vertical deep soil mixing walls.
| Case | Wall Material | GWL | Load | Soil Density |
|---|---|---|---|---|
| Case 5 | Soil | surface | uniform | 46% |
| Case 6 | Soil | −10 cm | uniform | 46% |
| Case 7 | Soil | −5 cm | uniform | 46% |
| Case 10 | plastics | surface | uniform | 46% |
| Case 11 | Soil | −5 cm | eccentric | 46% |
© 2018 by the authors. Licensee MDPI, Basel, Switzerland. This article is an open access article distributed under the terms and conditions of the Creative Commons Attribution (CC BY) license (http://creativecommons.org/licenses/by/4.0/).
Share and Cite
MDPI and ACS Style
Zhang, J.; Chen, Y. Experimental Study on Mitigations of Seismic Settlement and Tilting of Structures by Adopting Improved Soil Slab and Soil Mixing Walls. Sustainability 2018, 10, 4069. https://doi.org/10.3390/su10114069
AMA Style
Zhang J, Chen Y. Experimental Study on Mitigations of Seismic Settlement and Tilting of Structures by Adopting Improved Soil Slab and Soil Mixing Walls. Sustainability. 2018; 10(11):4069. https://doi.org/10.3390/su10114069
Chicago/Turabian StyleZhang, Jianwei, and Yulong Chen. 2018. "Experimental Study on Mitigations of Seismic Settlement and Tilting of Structures by Adopting Improved Soil Slab and Soil Mixing Walls" Sustainability 10, no. 11: 4069. https://doi.org/10.3390/su10114069
Note that from the first issue of 2016, this journal uses article numbers instead of page numbers. See further details here.