A Multi-Objective Ground Motion Selection Approach Matching the Acceleration and Displacement Response Spectra

1
Department of Civil Engineering, Harbin Institute of Technology at Weihai, Weihai 264209, China
2
Cooperative Innovation Center of Engineering Construction and Safety in Shandong Blue Economic Zone, Qingdao 266033, China
*
Author to whom correspondence should be addressed.
Sustainability 2018, 10(12), 4659; https://doi.org/10.3390/su10124659
Submission received: 11 October 2018
/
Revised: 2 November 2018
/
Accepted: 15 November 2018
/
Published: 7 December 2018
(This article belongs to the Special Issue Resilience and Sustainability of Civil Infrastructures under Extreme Loads)
Abstract
:For seismic resilience-based design (RBD), a selection of recorded time histories for dynamic structural analysis is usually required. In order to make individual structures and communities regain their target functions as promptly as possible, uncertainty of the structural response estimates is in great need of reduction. The ground motion (GM) selection based on a single target response spectrum, such as acceleration or displacement response spectrum, would bias structural response estimates leading significant uncertainty, even though response spectrum variance is taken into account. In addition, resilience of an individual structure is not governed by its own performance, but depends severely on the performance of other systems in the same community. Thus, evaluation of resilience of a community using records matching target spectrum at whole periods would be reasonable because the fundamental periods of systems in the community may be varied. This paper presents a GM selection approach based on a probabilistic framework to find an optimal set of records to match multiple target spectra, including acceleration and displacement response spectra. Two major steps are included in that framework. Generation of multiple sub-spectra from target displacement response spectrum for selecting sets of GMs was proposed as the first step. Likewise, the process as genetic algorithm (GA), evolvement of individuals previously generated, is the second step, rather than using crossover and mutation techniques. A novel technique improving the match between acceleration response spectra of samples and targets is proposed as the second evolvement step. It is proved computationally efficient for the proposed algorithm by comparing with two developed GM selection algorithms. Finally, the proposed algorithm is applied to select GM records according to seismic codes for analysis of four archetype reinforced concrete (RC) frames aiming to evaluate the influence of GM selection considering two design response spectra on structural responses. The implications of design response spectra especially the displacement response spectrum and GM selection algorithm are summarized.
1. Introduction
Dynamic response history analysis is commonly used in performance-based earthquake engineering (PBEE) to estimate the response of structure subjected to ground motion records representing potential earthquakes in future. The concept of PBEE indicates that spectrum match for a period range rather than entire spectrum match is sufficient to describe seismic behavior of an individual structure [1]. Nevertheless, records whose average response spectrum matches the target spectrum at a specified period range may produce significant uncertainty for estimating the response of structures in the same community, assuming that their natural periods are far away from that period range. In that case, resilience evaluation of community would be biased. In recent years, varieties of techniques have been developed to select recorded time histories for structural analysis [2,3,4,5,6,7,8,9]. One approach is to select recorded ground motions (GM) according to scenario earthquake [3], which apparently is not based on response spectral values. Another alternate approach is to select a group of most unfavorable real GMs that lead to the highest damage potential for given structures [4]. Likewise, it is not based on design response spectrum. The final alternate approach, more popularly used in seismic engineering, is to select “real” or artificial records whose response spectra match specified mean response spectrum [5,6,7,10].
For a given target spectrum, one approach is to select GM records that best match the target by minimizing the sum of squared difference between the response spectrum of scaled record and target [11]. The other alternate approach is to select a GM set scaled using a same factor, rather than one factor for each record, to match target response spectrum. It is more complicated for the latter one that some advanced technique is required to introduce, such as genetic algorithm (GA) [12] and evolutionary algorithms (EA) [13].
In most cases where the target response spectrum is the mean acceleration response spectrum, even though the acceleration response spectrum variance has been taken into consideration. In addition, it has been successfully solved in terms of greedy optimization algorithm despite both the mean and variance being taken into consideration [14]. The best set of GMs can be quickly selected using a greedy algorithm since the mean and variance of target response spectrum are synthesized into a single target function. Recently, a notable multi-objective optimization considering the acceleration mean and variance separately as target functions has been developed [15]. Nevertheless, it is computationally expensive for GA procedure when the size of the GM dataset is large. The solutions can hardly evolve towards the optimal direction in terms of crossover and mutation techniques as the size gets larger.
It is well known that the spectral demands of design acceleration response spectra at long period coordinates are usually much lower than those at short period ordinates. It would bias the estimates for long-period structures using records selected in terms of acceleration response spectra [16,17]. The displacement response spectrum, rather than the acceleration response spectrum, has been remarkably developed as an alternate target spectrum to select GM records in Italy recently [18]. The displacement response spectrum, instead of using standard pseudo-spectral criteria transferred from acceleration spectrum, is compatible with design acceleration response spectrum. However, the proposed GM selection method by selecting GM records merely in terms of displacement spectrum may limit its application where the displacement and acceleration response spectra are incompatible. It is because the acceleration response spectra of GM records may probably deviate from target response spectrum significantly. Furthermore, the displacement response spectra defined according to different seismic codes are significantly varied even though their corresponding acceleration spectra are similar. It will be illustrated in subsequent sections.
Additionally, the target spectrum either the acceleration spectrum or displacement spectrum would be preferred, assuming it is suitable up to long periods and constrained by results of full period probabilistic seismic hazard analyses (PSHA). In such a case, estimations of seismic resilience of a community including short-period and long-period systems would be more reliable. Spectrum match for entire period range is also in great need. To date, PSHA in terms of horizontal displacement response spectrum ordinates up to vibration period of 20 s was only found in Italy. The design spectra including displacement response spectrum can only be chosen as target spectra to identify the engineering demand parameters (EDP) under records selected in terms of the counterpart seismic intensity. Thus, it must increase the complexity of GM selection as both the means and variances of both response spectra are taken into account. It is a notable multi-objective optimization that the greedy algorithm is not easy to resolve since the number of GM records matching target response spectrum is predetermined by user who has no idea of actual number of GMs optimally matching. Even the GA for multi-objective optimization, its computational consumption would greatly increase if the sample size gets larger. Moreover, evolving speed would significantly drop down accordingly.
Irrespective of definition of the target response spectrum, GM selection algorithms that select GM records matching target acceleration or displacement response spectrum, individually, was presented previously. However, the GM selection approach that selects records matching both acceleration and displacement response spectra has rarely been illustrated. In this study, a computationally efficient approach based on probabilistic frame will be proposed. Firstly, the sample size will shrink promptly and several GM sets whose displacement response spectrum mean and variance matching the targets will be generated using a new method. Afterwards, a novel evolving technique was introduced to select GMs in each set matching target acceleration response spectrum mean and variance. Two scaling factors were derived accordingly to best match these two target spectra individually using the least square technique. The most compatible GM set, namely having the closest scaling factors for both spectra, was finally selected as the optimal solution.
After this introduction in Section 1, review of compatibility of design response spectra according to international codes and general flowchart of the proposed algorithm will be shown in Section 2. Then, the third section provides detailed information of a new GM selection algorithm and gives an example of selecting an optimal set of GMs matching given target spectra. Meanwhile, the efficiency of the proposed algorithm is proved by comparing with a developed GM selection tool. Application of the proposed GM selection approach for international seismic codes is carried out and compared with a popularly-used algorithm in the fourth section. Four reinforced concrete (RC) frames were modeled to compare the bias of structural response estimates under GMs selected from these two methods. Some important results are concluded in Section 5.
2. Compatibility of Response Spectra and GM Selection Framework
2.1. Review of Displacement Response Spectra from International Seismic Codes
As previously stated, the design displacement spectra of international seismic codes are significantly different, even though the corresponding design acceleration spectra of most seismic codes are similar, such as seismic codes, including Eurocode EC8; Italian NTC08; American Society of Civil Engineering (ASCE) 7-16 and New Zealand NZS 1170. Firstly, the corner periods for all these codes to define displacement response spectra by pseudo-spectral relationship mentioned previously are basically different. In addition, their spectral shapes are significantly different. The major feature of the latter two codes is that the displacement spectral shape can be represented as a bilinear shape in addition to the corner periods independent of site condition. The spectral displacement assumed to be constant beyond corner period, TE, can be seemed as peak ground displacement (PGD). In contrast, the major feature of the first two codes is that a decreasing branch beyond a corner period has been introduced in spectral shape and afterwards the branch approaches a constant value. For EC8 code, the first corner period, TD, depends on magnitude. While the corner period for NTC08 is dependent on site condition in addition to PSHA results. The displacement response spectra shapes of these codes have been illustrated in Figure 1 [18].
It is shown that the elastic acceleration spectra in Figure 1a were adjusted to be close to each other. For NZS2004 code, the hazard factor Z has been set as 0.3 g and the spectral shape was anchored in terms of rock site, namely C site type. Hence, the peak ground acceleration of NZS2004 code can be fixed to 0.3 g which also results in spectral accelerations SS = 1.125 g and S1 = 0.4 g for ASCE 7-16 code at periods of TS and T1, respectively. For the codes of EC8 and NTC08, the site type was defined as B and PGA was set as ag = 0.3 g. These two codes have such similar expressions on acceleration spectra and definition of displacement spectra that their displacement spectra are much closer than those of the other two codes.
The difference for both spectra at periods less than three seconds is not relevant since the spectra for four codes have marginal difference. Nevertheless, the ground motion selection results may be affected more seriously if the displacement response spectra are taken into account since the displacement spectra branches of codes NZS2004 and ASCE 7-16 at a long period range will be relevant to larger magnitude earthquake events than those from EC8 or NTC08 codes. Hence, it would be relevant to compare GM records selected according to acceleration response spectra in addition to their displacement response spectra.
2.2. Importance of Spectral Compatibility
The acceleration response spectrum other than the displacement response spectrum has conventionally been selected as target spectrum for GM selection. As we know, the acceleration response spectra of records are less sensitive to low frequency characteristic of GMs than the displacement response spectra. Thus, GM records selected merely based on target acceleration response spectrum may produce significant dispersion of displacement response spectra at long periods. On the contrary, GM selection only based on displacement response spectrum has been rarely studied [18]. Trivial but relevant differences between these two spectra are compared as the following.
Two pairs of GM records having the most similar spectral shape have been selected in terms of a similarity index as shown in Equation (1):
where represents the deviation of acceleration spectrum of ith record, i.e., with respect to of jth record. In addition, is the number of periods within the considered period range. A comparison matrix was constructed with respect to , from all records in the Next Generation Attenuation (NGA) database (https://ngawest2.berkeley.edu/). Finally, two pairs of records with the most similar acceleration and displacement response spectral shape were selected and shown in Figure 2. The damping ratio for the elastic response spectra equals 5% of all of the following.
For the first pair of GM records with NGA sequence numbers 144 (Dursunbey, Turkey earthquake in 1979) and 1738 (Northridge earthquake in 1994), the acceleration and displacement response spectra of these two records are shown in the first row of Figure 2. The acceleration response spectra are nearly the same at periods larger than 0.5 s. However, their displacement response spectra are significantly different at periods larger than 0.5 s. In addition, the displacement response spectra at periods less than 0.5 s are nearly the same on the contrary.
In contrast, the other pair of records having the most similar displacement response spectrum is shown in the second row of Figure 2. Records of NGA_2482 (Chi-Chi Taiwan earthquake in 1999) and NGA_2483 (Chi-Chi Taiwan earthquake in 1999) derived in the same station have the most similar displacement response spectral shape in the NGA database. The displacement spectra of these two records at periods less than 0.8 s nearly overlap as shown in the right bottom panel of Figure 2. However, the corresponding acceleration spectra within this period range have a significant difference as shown in the left bottom panel of Figure 2. The largest gap of the spectral accelerations of these two records is more than 1 m/s2. As such, the difference of displacement spectra at long periods cannot be clearly identified in corresponding acceleration response spectra.
As is clear from the above illustration, a trivial difference of spectral accelerations of records at long periods or the same spectral displacements at short periods probably produces a significant difference of spectral values of the counterparts. This spectral incompatibility of GM records may introduce significant dispersions of spectral values at this period range if one of target spectra is neglected.
Recently, the displacement response spectra at short periods have been proved compatible with corresponding acceleration spectra according to seismic hazard at a specified site in Italy. The target displacement response spectrum in Italy (TDSI), in accordance with NTC08 [19] at a short period range on one side, and, on the other side, with the framework of Project S5 (http://progettos5.stru.polimi.it/) at a long period range (attaining twenty second) has been well developed [18]. The TDSI can be expressed according to location, soil type, limit state and nominal life. Furthermore, the corresponding compatible spectra can be derived according to TDSI as shown in Figure 3.
The trend of acceleration spectrum beyond corner period, , simply denoted as a function of period, is significantly different from that of displacement spectrum which is represented by two more corner periods, i.e., and in Figure 3a. It implies that the spectral compatibility at periods less than may be more important for both spectra. Note that the factor, , ranging from 0.85 to 1.4 in Italy, is so far less from two in Figure 3b that a significant drop will take place at period of , whereas, it will be reduced as the corner period of gets larger.
A GM selection tool based on displacement response spectrum was successfully developed by Smerzini etc., [18]. The mean acceleration response spectrum of selected GMs matches the target acceleration response spectrum well because the target acceleration and displacement response spectra are compatible. It implies that the GM selection tool may be not suitable in other countries since the TDSI is only suitable in Italy. The TDSI additionally presented herein is majorly used for illustration of computational-efficiency of the GM selection algorithm newly proposed in this work.
2.3. Framework of the New GM Selection Algorithm
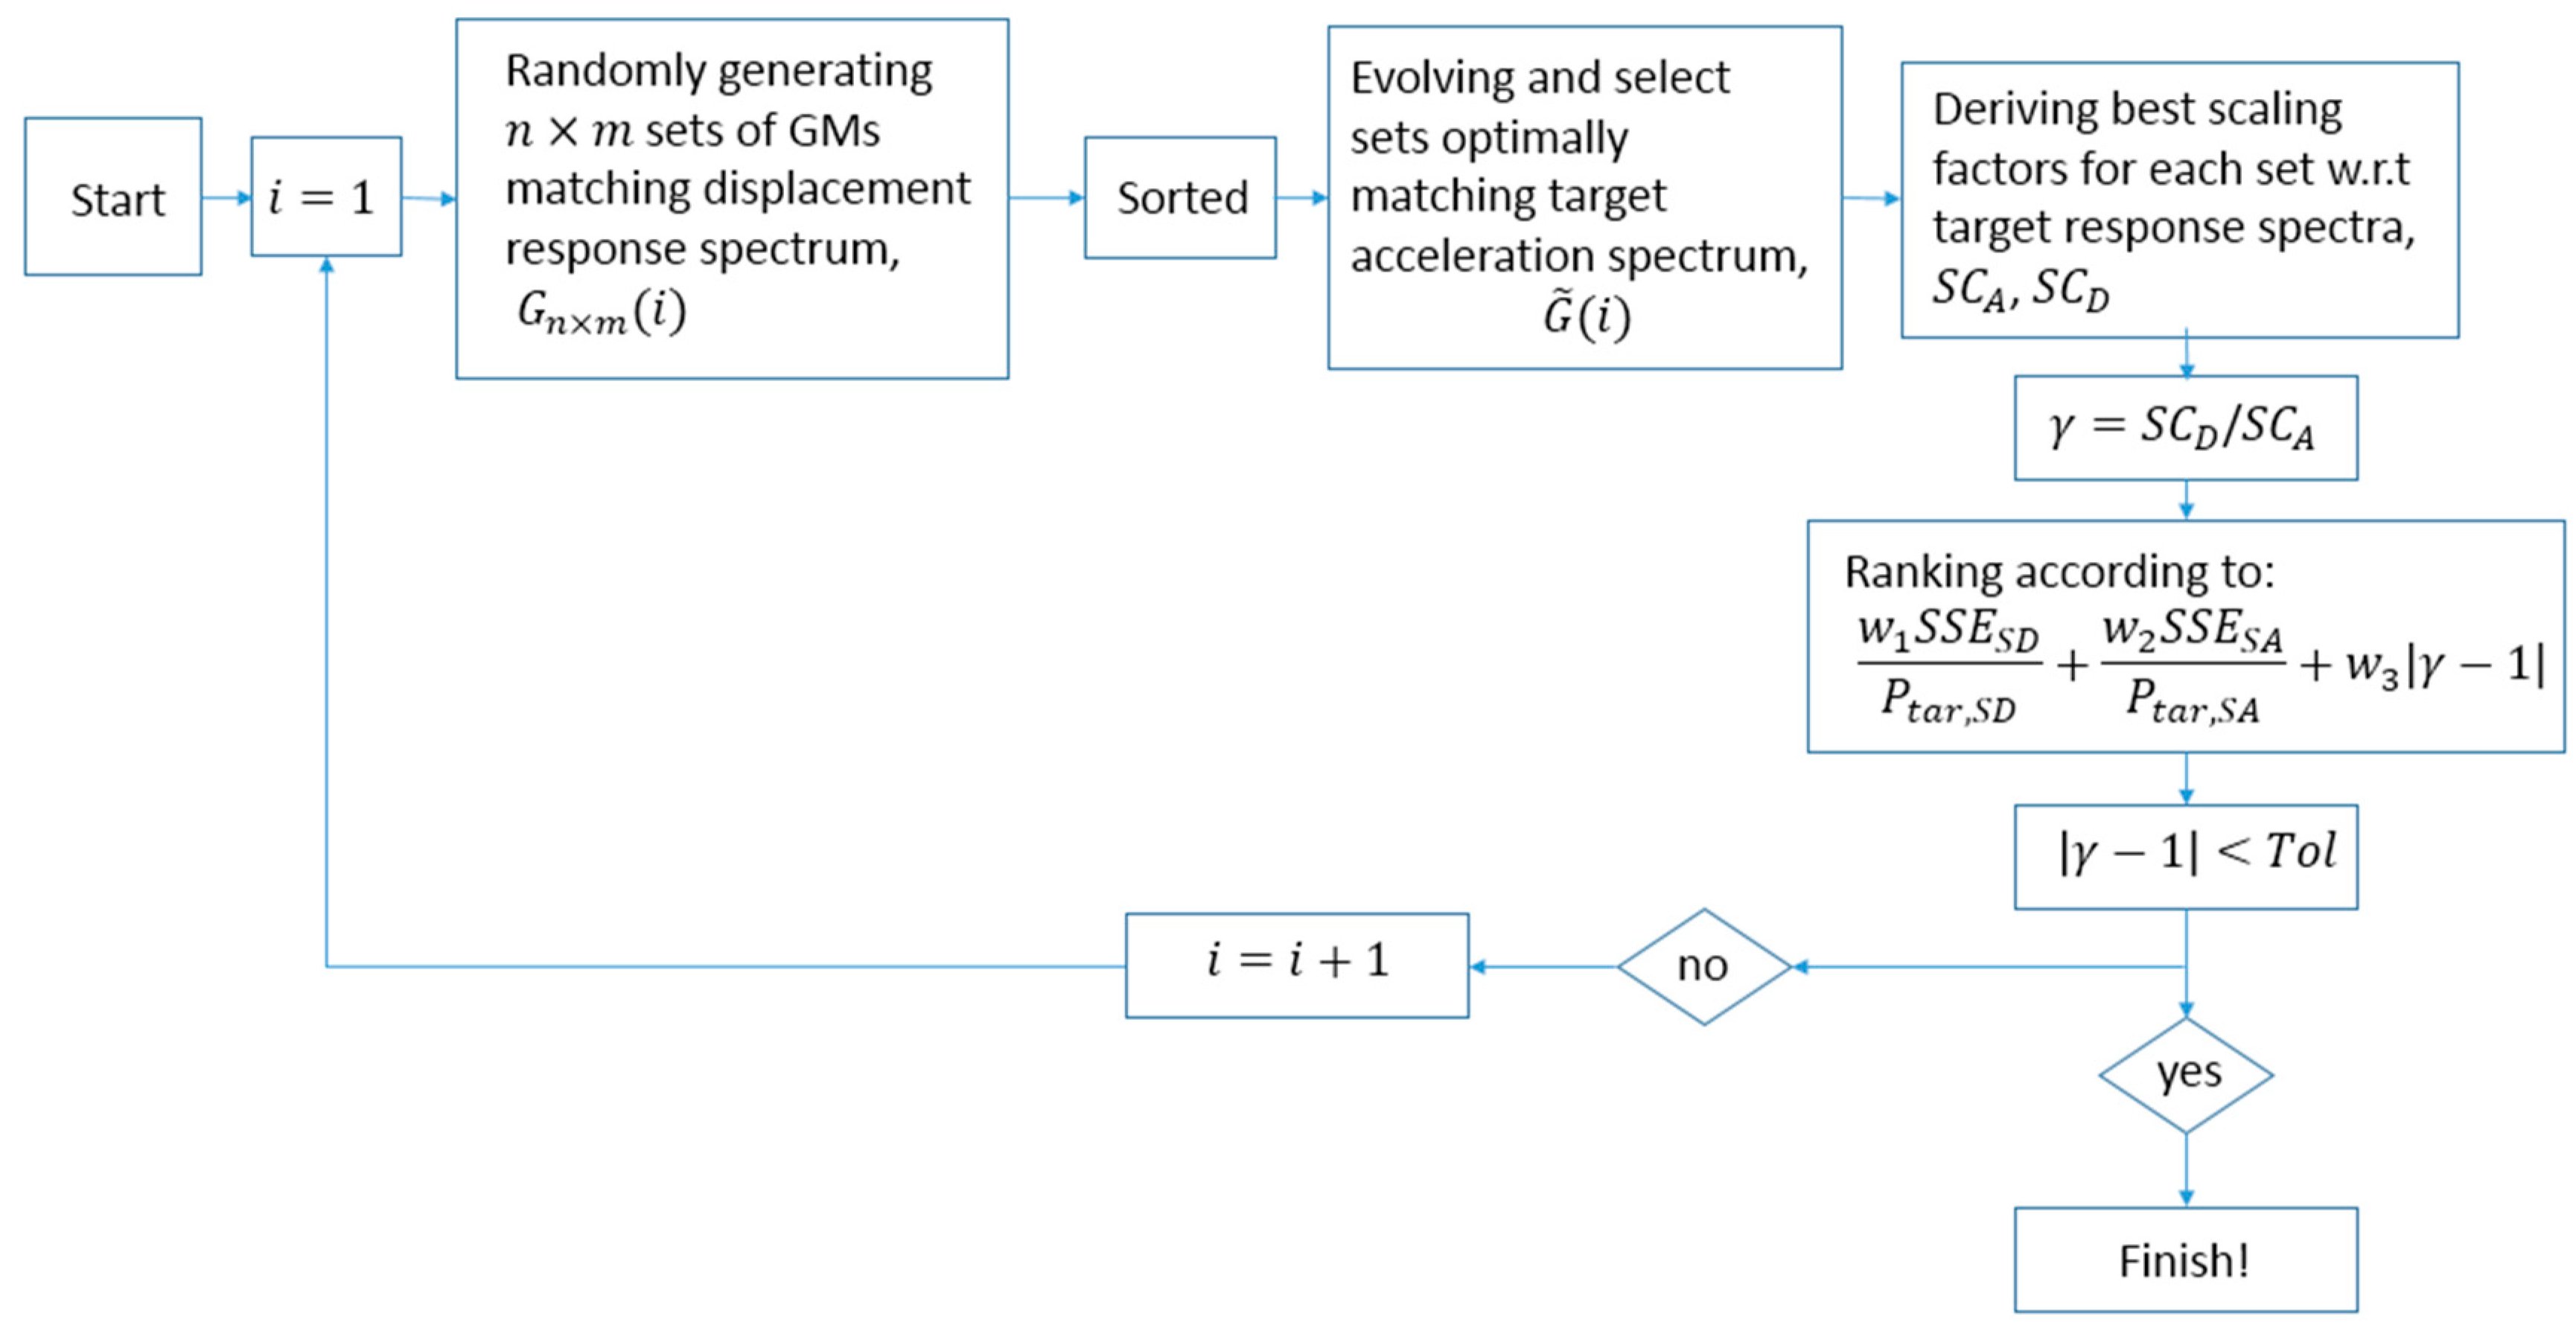
Traditional multi-objective optimization mainly includes four steps: i.e., (1) generating initial populations; (2) sorting the populations according to their non-dominated rankings; (3) evolving individuals in the place of the latter half using crossover and mutation techniques; and (4) finally resorting them together with the first half individuals. The solutions placed in the Pareto fronts can be traced to find the optimal solution user expects. Note that the first and third steps are carried out using random procedure, which, however, may increase computational consumption if the samples expand. However, the basic framework of multi-objective optimization is valuable and chosen for designing a new GM selection algorithm whose flowchart is shown in Figure 4.
The main steps for multi-objective optimization have been modified as shown in Figure 4 including:
- (1)
- Initial populations are generated similarly with traditional method, but the generation method is changed using a Markov chain Monte Carlo (MCMC) sampling technique. Additionally, the total number of populations is divided into two parts, i.e., n and m, where variable n denotes the number of sub-target displacement response spectra and variable m denotes the sampling frequency for each target. Finally, a GM set including sub-sets of records is totally generated matching the target displacement response spectra.
- (2)
- Non-dominated sorting technique is essential for this proposed algorithm since the displacement response spectrum mean and variance are taken as respective target functions. Note that the generation of initial populations is different from the traditional method. Populations generated from different sub-target response spectra may have different ranking levels.
- (3)
- Thus, individuals ranking in the first level, rather than ranking at the latter half, are selected for the next evolving procedure since the displacement response spectrum is not the only target hereafter. The acceleration response spectrum mean and variance are also the targets so that potentially optimal sets of GMs are only interested. It is different from traditional multi-objective optimization that the evolved populations do not need to compare with the former original sets of GMs because the evolving procedure does not introduce samples outside the original set but only withdraws bad ones. The evolving procedure will be illustrated in the following section.
- (4)
- GM sets after evolvement can probably improve the match of target acceleration and displacement response spectra. However, there is only one set of GMs finally selected as the optimal solution. Individuals evolved will be sorted according to their deviation from both target spectra and compatibility of the spectra which are synthesized as a function taking the weights of these variables into consideration. Details of this function will be stated in the following section. Note that the major target of the proposed GM selection algorithm is to derive a set of GMs whose response spectra are the most compatible. Therefore, computation will stop once the compatible tolerance is satisfied. Meanwhile, more iteration is needed if target tolerance cannot be satisfied. The solution can approach the optimal state to full extent if target tolerance is not specified.
2.4. Ground Motion Database and Scaling Approach
Ground motion database according to the SIMBAD database (Selected Input Motions for displacement-Based Assessment and Design) [18] including 220 records from Japan, 83 records from Italy, 77 records from New Zealand, 44 records from United States, 18 records from Europe, 15 records from Turkey, seven records from Greece and three records from Iran were indispensable in this paper. Pre-selection of subsets having sufficient number of ground motions from general database according to site type or epicentral distance is impractical since the total number of earthquake events in SIMBAD is only 467 on one side, handful of records with specified characteristics on the other side. Hence, pre-selection of records from database of SIMBAD according to specified ground characteristics, such as site type and magnitude et al., was out of consideration in this paper.
Note that the candidate sets of ground motions were scaled with a same factor stated previously that the relative intensity of each ground motion record can be preserved. Furthermore, the largest scale factor was set equal to three, which ensures the scale factors for ground motions less five [20,21,22,23].
3. Ground Motion Selection Using the Passive Matching Distribution-Scaled Method (PMDS)
3.1. Generation of Initial Population
Recall that the purpose of generation of initial population is to reduce sample size and match the target displacement response spectrum. Additionally, the displacement response spectrum, rather than the acceleration response spectrum selected as a target, is because the displacement response spectrum at long periods may be harder to match for GMs compared with acceleration response spectrum at short periods. The scaling strategy, as stated previously, that retains relative energy distribution of ground motions enables utilization of a probabilistic sampling method. Furthermore, it implicates the target spectrum can be “moved” to match response spectrum mean of candidate bins of records inversely. That is, in fact, ground motion records do not need to be scaled but need only "passive" matched with a “moving” target spectrum. Hence, it is named as passive matching (PM) method hereafter.
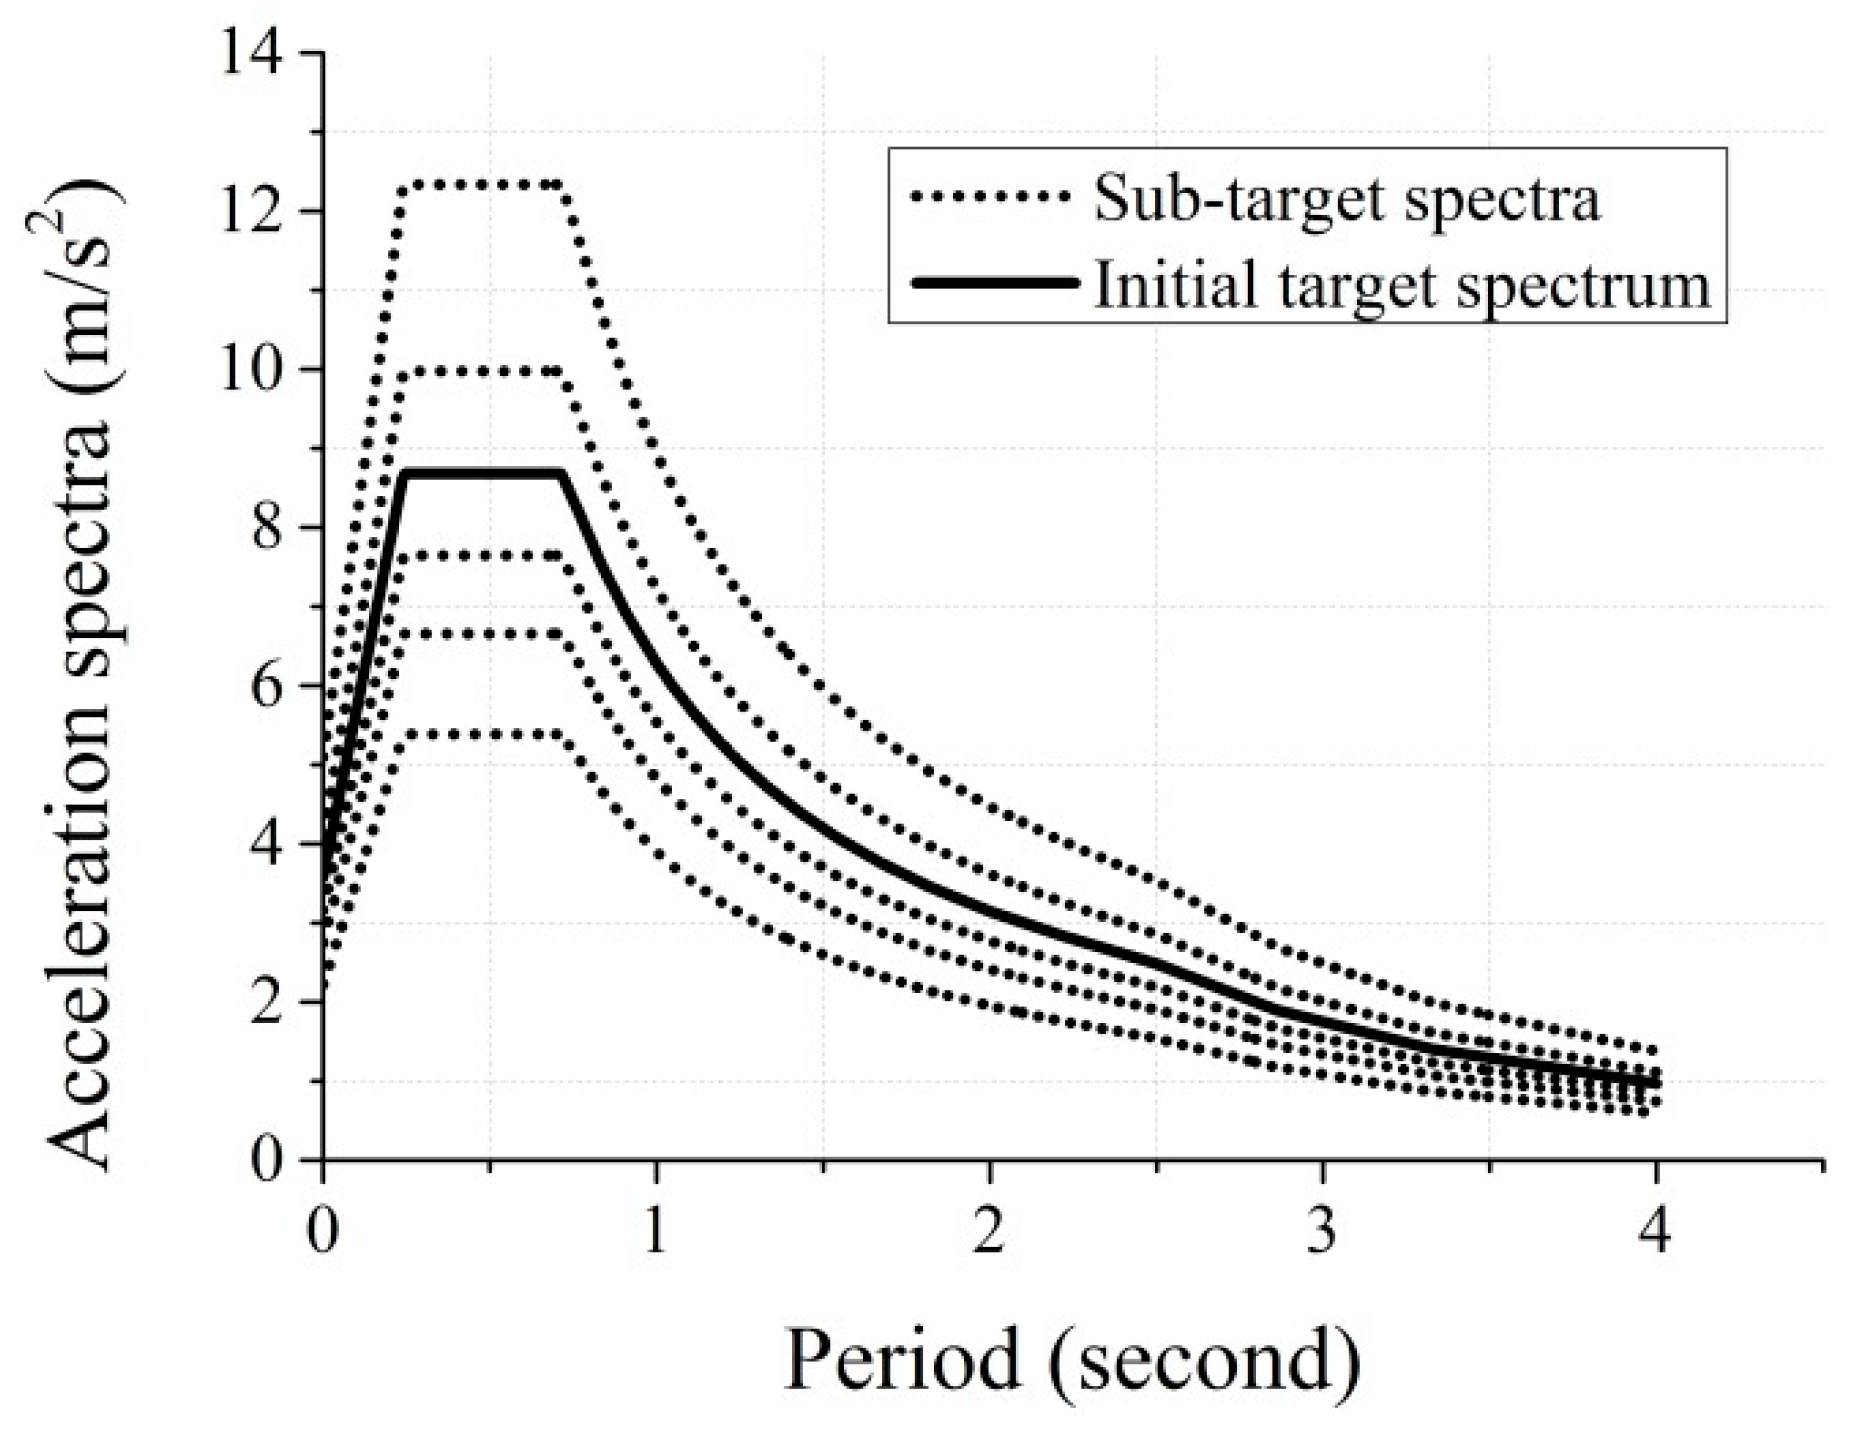
The best solution can be found provided all the solutions with respect to each sub-spectrum were derived as shown in the second column of Figure 5. The target spectra including dispersion spectrum in the second column of Figure 5 show that the original target spectra were divided into n stripes by n scale factors. Furthermore, m sets of GM records were generated by a stochastic method corresponding to each stripe as shown in the third column of Figure 5. The initial populations were generated having totally sets of GM records.
For each stripe, the traditional algorithm such as a greedy method, can easily select specified number of records to best match target spectra, which however is not proposed herein because the number of records, in fact, is unknown initially. In order to select ground motions optimally matching target spectra, a Monte Carlo sampling based on Markov chain (also known as the Metropolis algorithm) sampling technique has been used in this study to select records matching the target displacement spectra. In addition, the diversity of initial populations can be achieved using this random sampling technique.
Take TDSI, for example, a site locating at longitude 14.191, latitude 40.829 in Italy, the target displacement and tolerance spectra (blue and dotted blue lines individually) with respect to D site, Operability Limit State (SLO) and II function type structure were shown in Figure 6.
There were 78 GM records whose displacement response spectral ordinates at period of five second satisfying the target distribution function as follows:
where is the target deviation which is equal to 0.2 times the target mean, . In addition, x is the spectral values within a specified interval range. A similar proposal distribution function centered at , but dependent on previous state , has been proposed according to the Metropolis algorithm. The proposed state at sample will be accepted only if the target distribution, is warranted with sufficiently large density, i.e., . However, on the contrary, the proposed sample may be rejected or accepted randomly. All of the samples will be traversed only once during each initial population selection process.
As shown in Figure 6a, the median (or mean) spectral value of selected records closely matches the target spectrum near the predefined period. Nevertheless, other median spectral points outside the specified period cannot match the target, which indicates MCMC sampling with a single period is not enough to select GM records matching spectral shape at long periods. The situation is improved when sampling at periods of ten seconds has been added to filter out records outside the tolerance as shown in Figure 6b. In order to cover all possible combinations of GM records, several sets of GM records will be generated for each sub-stripe to cover all possible combinations of GM records at the extreme. Totally, thirty sets of GM records will be generated when six random scaling factors and sampling five times for each target stripe are used.
3.2. Non-Dominated Sorting of Initial Populations
Note that two target functions should be satisfied as shown in Figure 6. Namely, the dispersion spectrum written as and median displacement spectrum written as need to be matched. Herein, and are standard deviation and median spectral displacement of the scaled ground motion displacement spectra at jth point of period, respectively. Parameters of and are target dispersion and median spectral displacement at the jth point of period.
In order to save computation time, the non-dominated sorting technique has been utilized to select candidate sets of GM records ranking in the first level [24]. Figure 7 is a candidate solution including eight records that match the target median and dispersion spectra. It shows that MCMC sampling and non-dominated sorting techniques demonstrate remarkable performance in selecting initial candidate solutions matching the target displacement spectra.
According to the displacement response spectral shape, two points of periods for MCMC sampling are proposed hereafter to select GM records matching the spectral shape. In addition, a relatively small amount of population (five herein) is necessary for MCMC sampling techniques. With the help of non-dominated sorting, more satisfactory candidate sets of ground motions can be well selected. However, whether the acceleration response spectrum mean of selected records at short periods significantly deviate from the target acceleration response spectra or not is still unknown.
3.3. Evolving Based on the Distribution-Scaled Method
As previously stated, initial populations were from different target response spectra corresponding to different seismic intensities. Thus, traditional evolving techniques, such as crossover and mutation, are no longer usable. Assuming that the response spectra of GM records are in the place of sub-spectra derived from the initial target acceleration response spectrum as shown in Figure 8, these records would survive after evolvement in high probability. In order to further filtrate GM records significantly deviating from the acceleration response spectra at short periods, a distribution-scaled method was used.
The sub-spectra according to the intensity at the probability of are defined as:
where is the inverse standardized normal distribution function and is the ith midpoint cumulative probability. Parameters of and denote the median and standard deviation of target spectral acceleration at a specified period. It is assumed that the acceleration spectra of ground motions were log-normally distributed. Then, parameter was set as 0.2 times the target median spectral acceleration. The maximum allowed stripes in Figure 8 were set equal to the size of selected records representing the percentile probabilities, , in corresponding individual. It can be inferred that the number of records finally selected would be smaller than the size of stripes initially defined.
Note that there was only one record selected for each stripe; meanwhile, the corresponding stripe should be deleted afterwards. In addition, ground motions whose response spectra are far away from the target stripes will be cleared. For simplicity, those records having peak response values at periods from 0.2 to two seconds three times more than or one third less than those of the target stripe at corresponding periods were removed additionally. None of the ground motions in each individual should be obsolete if they cannot get the deviation from target acceleration spectrum worse. On the contrary, records that amplify statistical deviation should be deleted. Herein, the scale factor both for displacement and acceleration spectra matching was derived by minimizing the summation Q:
where and represent the median spectrum and target spectrum at the ith period point, respectively. Furthermore, a is the scale factor required to be solved. Equation (4) achieves the minimum value when the first derivative of Q versus a equals zero.
3.4. Selecting the Optimal Solution
There are several sets of GM records ranking in the first level after non-dominated sorting to evolve. However, there is only one set of GMs can be left for each loop as shown in Figure 4 to determine whether the iteration is finished or not. In order to improve the solution, there is a trade-off between the target acceleration, displacement response spectra and their compatibility to rank the individuals as shown in Equation (5):
where is the sum of squared errors (SSE) of displacement response spectrum mean and variance with respect to the target and, is the maximum target spectral displacement. Parameters of denote the weighting values the target functions have. For simplicity, these three weighting factors are equally assumed, i.e., . The variables of and have similar definition as and . Parameter of denotes the ratio between the scaling factor for the displacement response spectra and that for the acceleration response spectra of jth set of GMs. Finally, the set of GM records having a smallest deviation between scaling factors for the acceleration and displacement response spectra will be only selected.
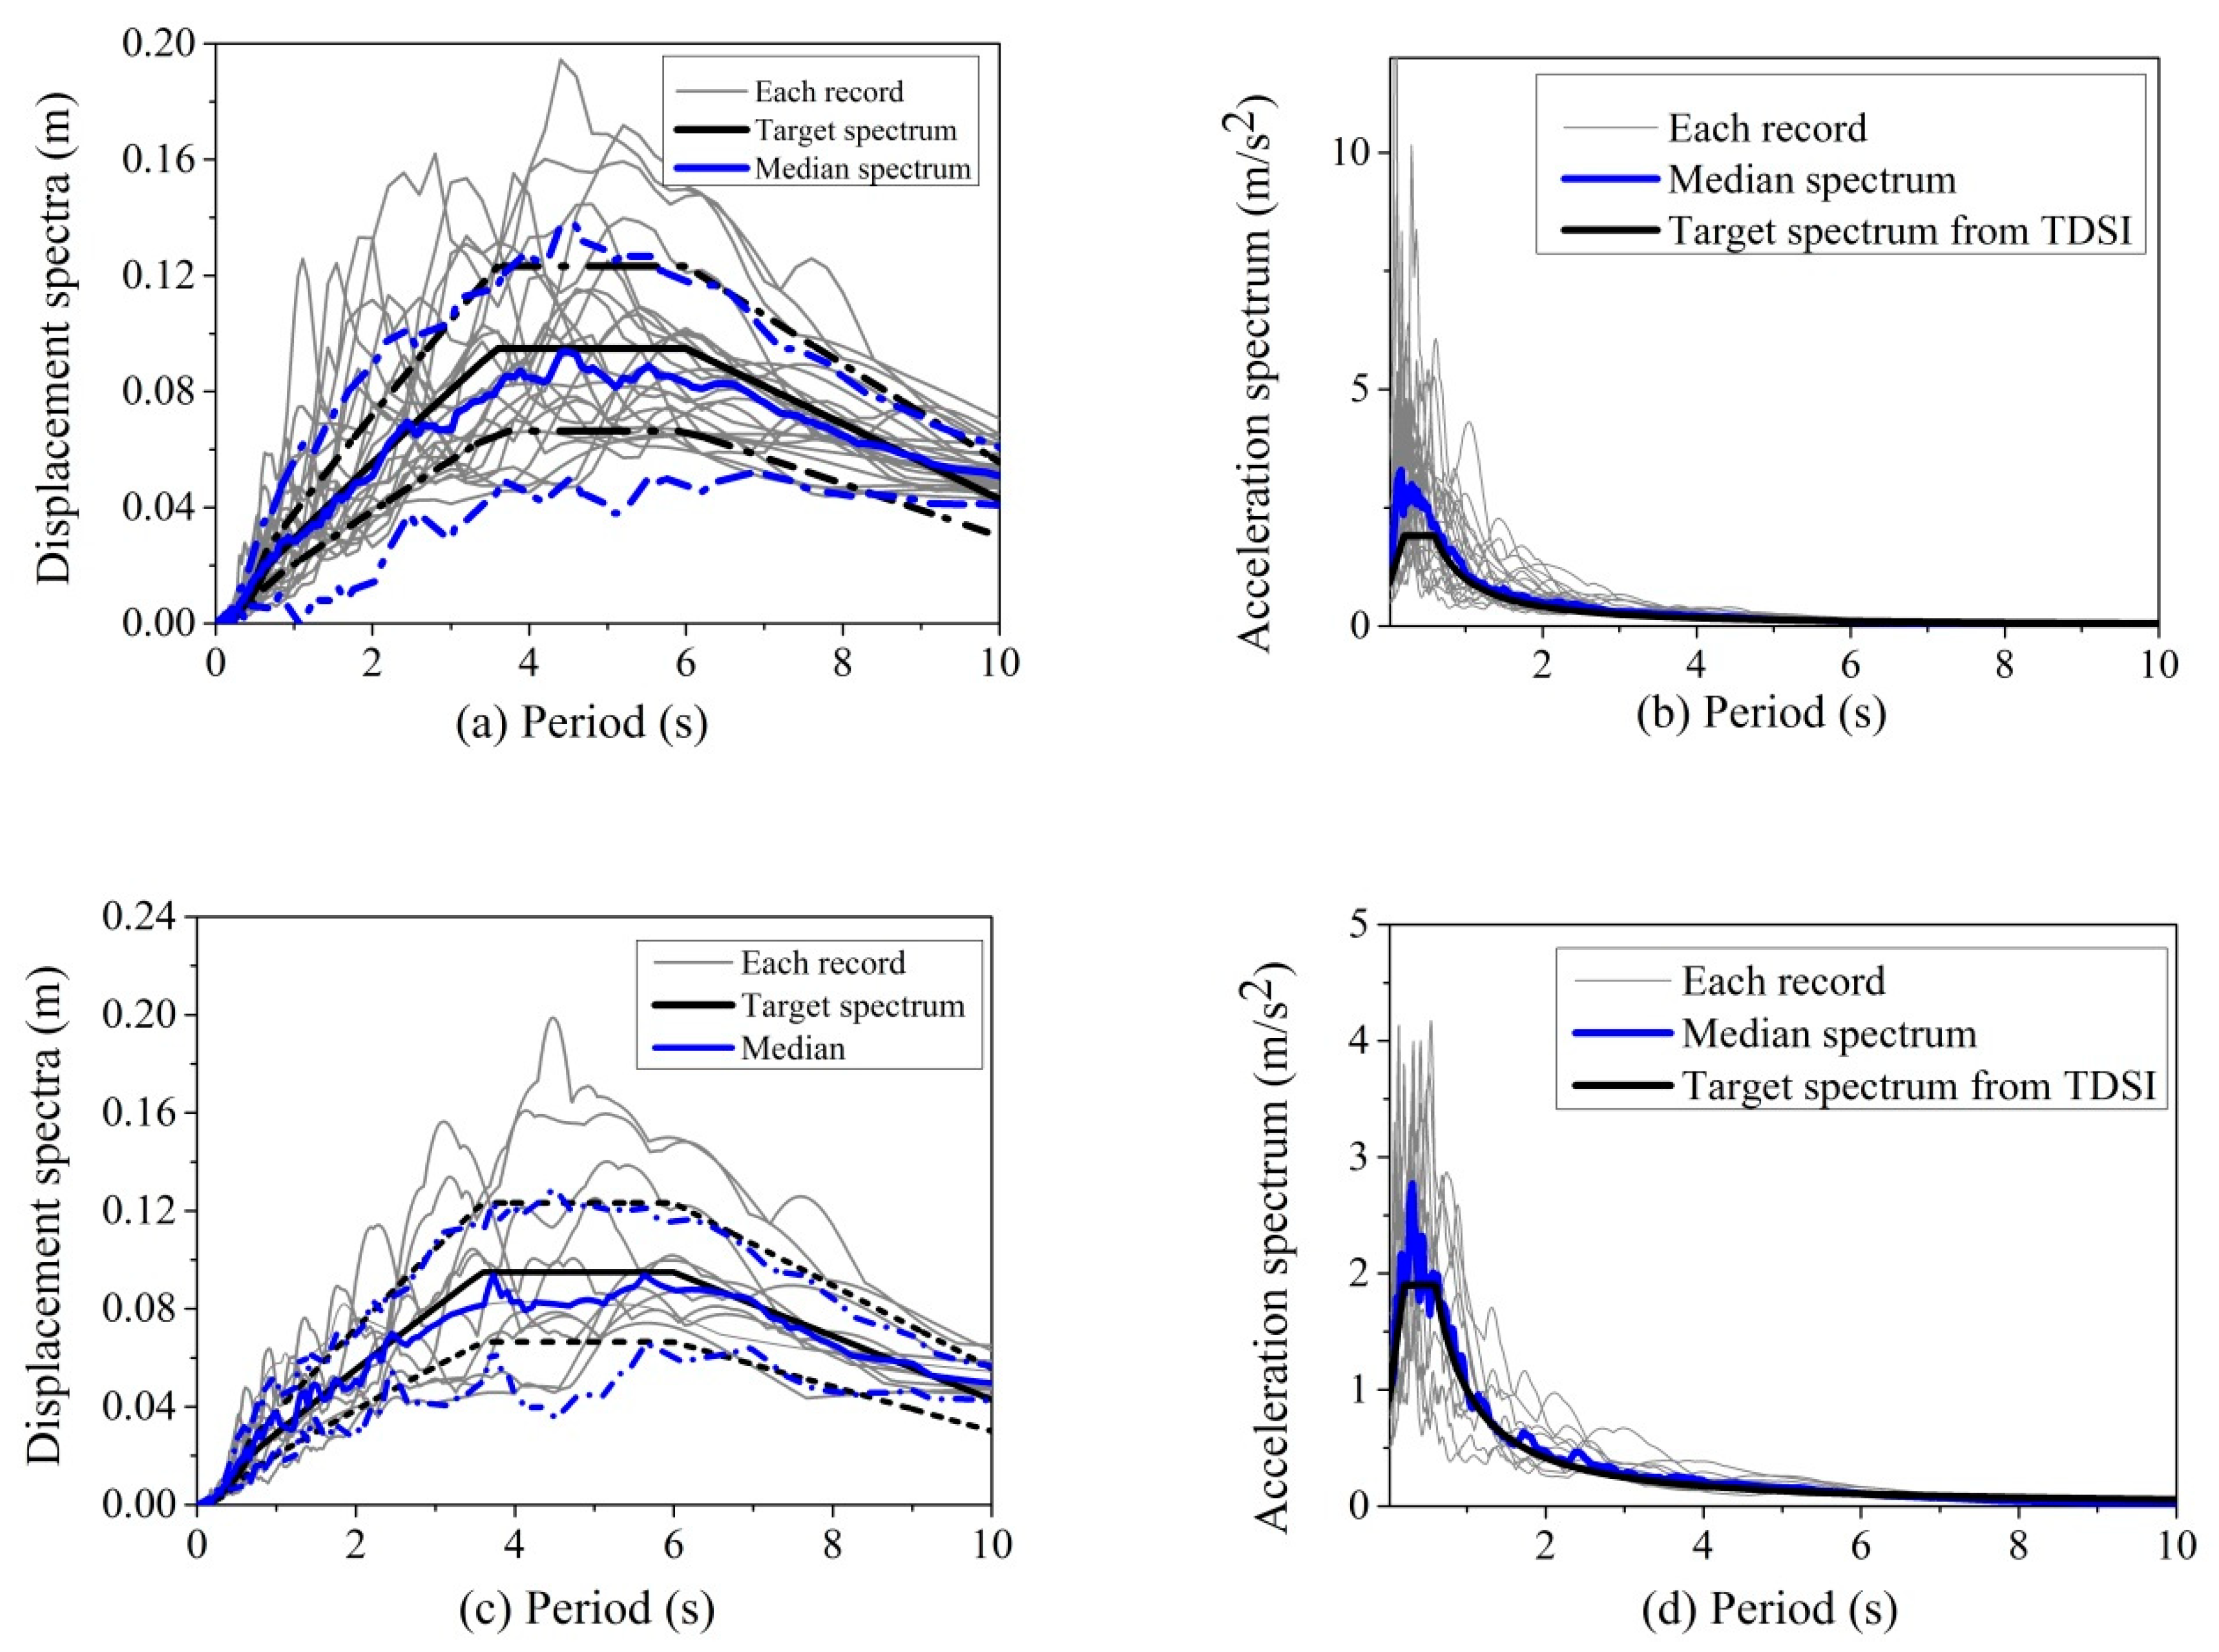
For example, a candidate set including twenty-four records was derived from the previous section and shown in Figure 9a where the median and dispersion of response spectra can well match the target displacement spectra. Nevertheless, the acceleration spectra of these accelerograms as shown in Figure 9b are significantly deviated from the target, especially those at short periods. Thus, twenty-four sub-target acceleration spectra derived according to Equation (3) were used afterwards to wide out records mismatching. The median value, , was derived to be equal to the target acceleration spectrum at 0.5 s, and the standard deviation, , was set equal to . There were twenty-four sub-target spectra produced for the acceleration spectra of records to match. After a few iterations, the solution successfully evolved as shown in Figure 9d. Apparently, the displacement spectra of selected records were also improved to match both the median and dispersion spectra as shown in Figure 9c.
It was stated that the mean displacement response spectrum of selected GM records may deviate from the target displacement spectrum after evolvement, and the scaling factor for displacement spectral match may also be different from that for acceleration spectral match. The iteration will stop if target compatible tolerance is satisfied. Furthermore, solutions can also evolve towards the perfect match if computation cost is out of consideration.
3.5. Example of PMDS Method on GM Selection According to TDSI
As shown in Figure 4, iteration will not terminate if the target function or tolerance cannot be satisfied. An index coordinating the acceleration and displacement spectral matching was proposed in this study because the spectra of selected records can match the target spectra well separately. Nevertheless, the selected records may not match both target spectra simultaneously using the same factor. Therefore, a compatible index (simplified as CI) was defined as the ratio between scale factors, a derived from Equation (4), for displacement and acceleration response spectra, respectively. In order to prove the efficiency of PMDS method on GM selection, a developed GM selection tool, REXEL-DISP v 1.2 (Manufacturer, City, US State abbrev. if applicable, Country) [18], was used to selected GM records according to the same target spectra, i.e., TDSI.
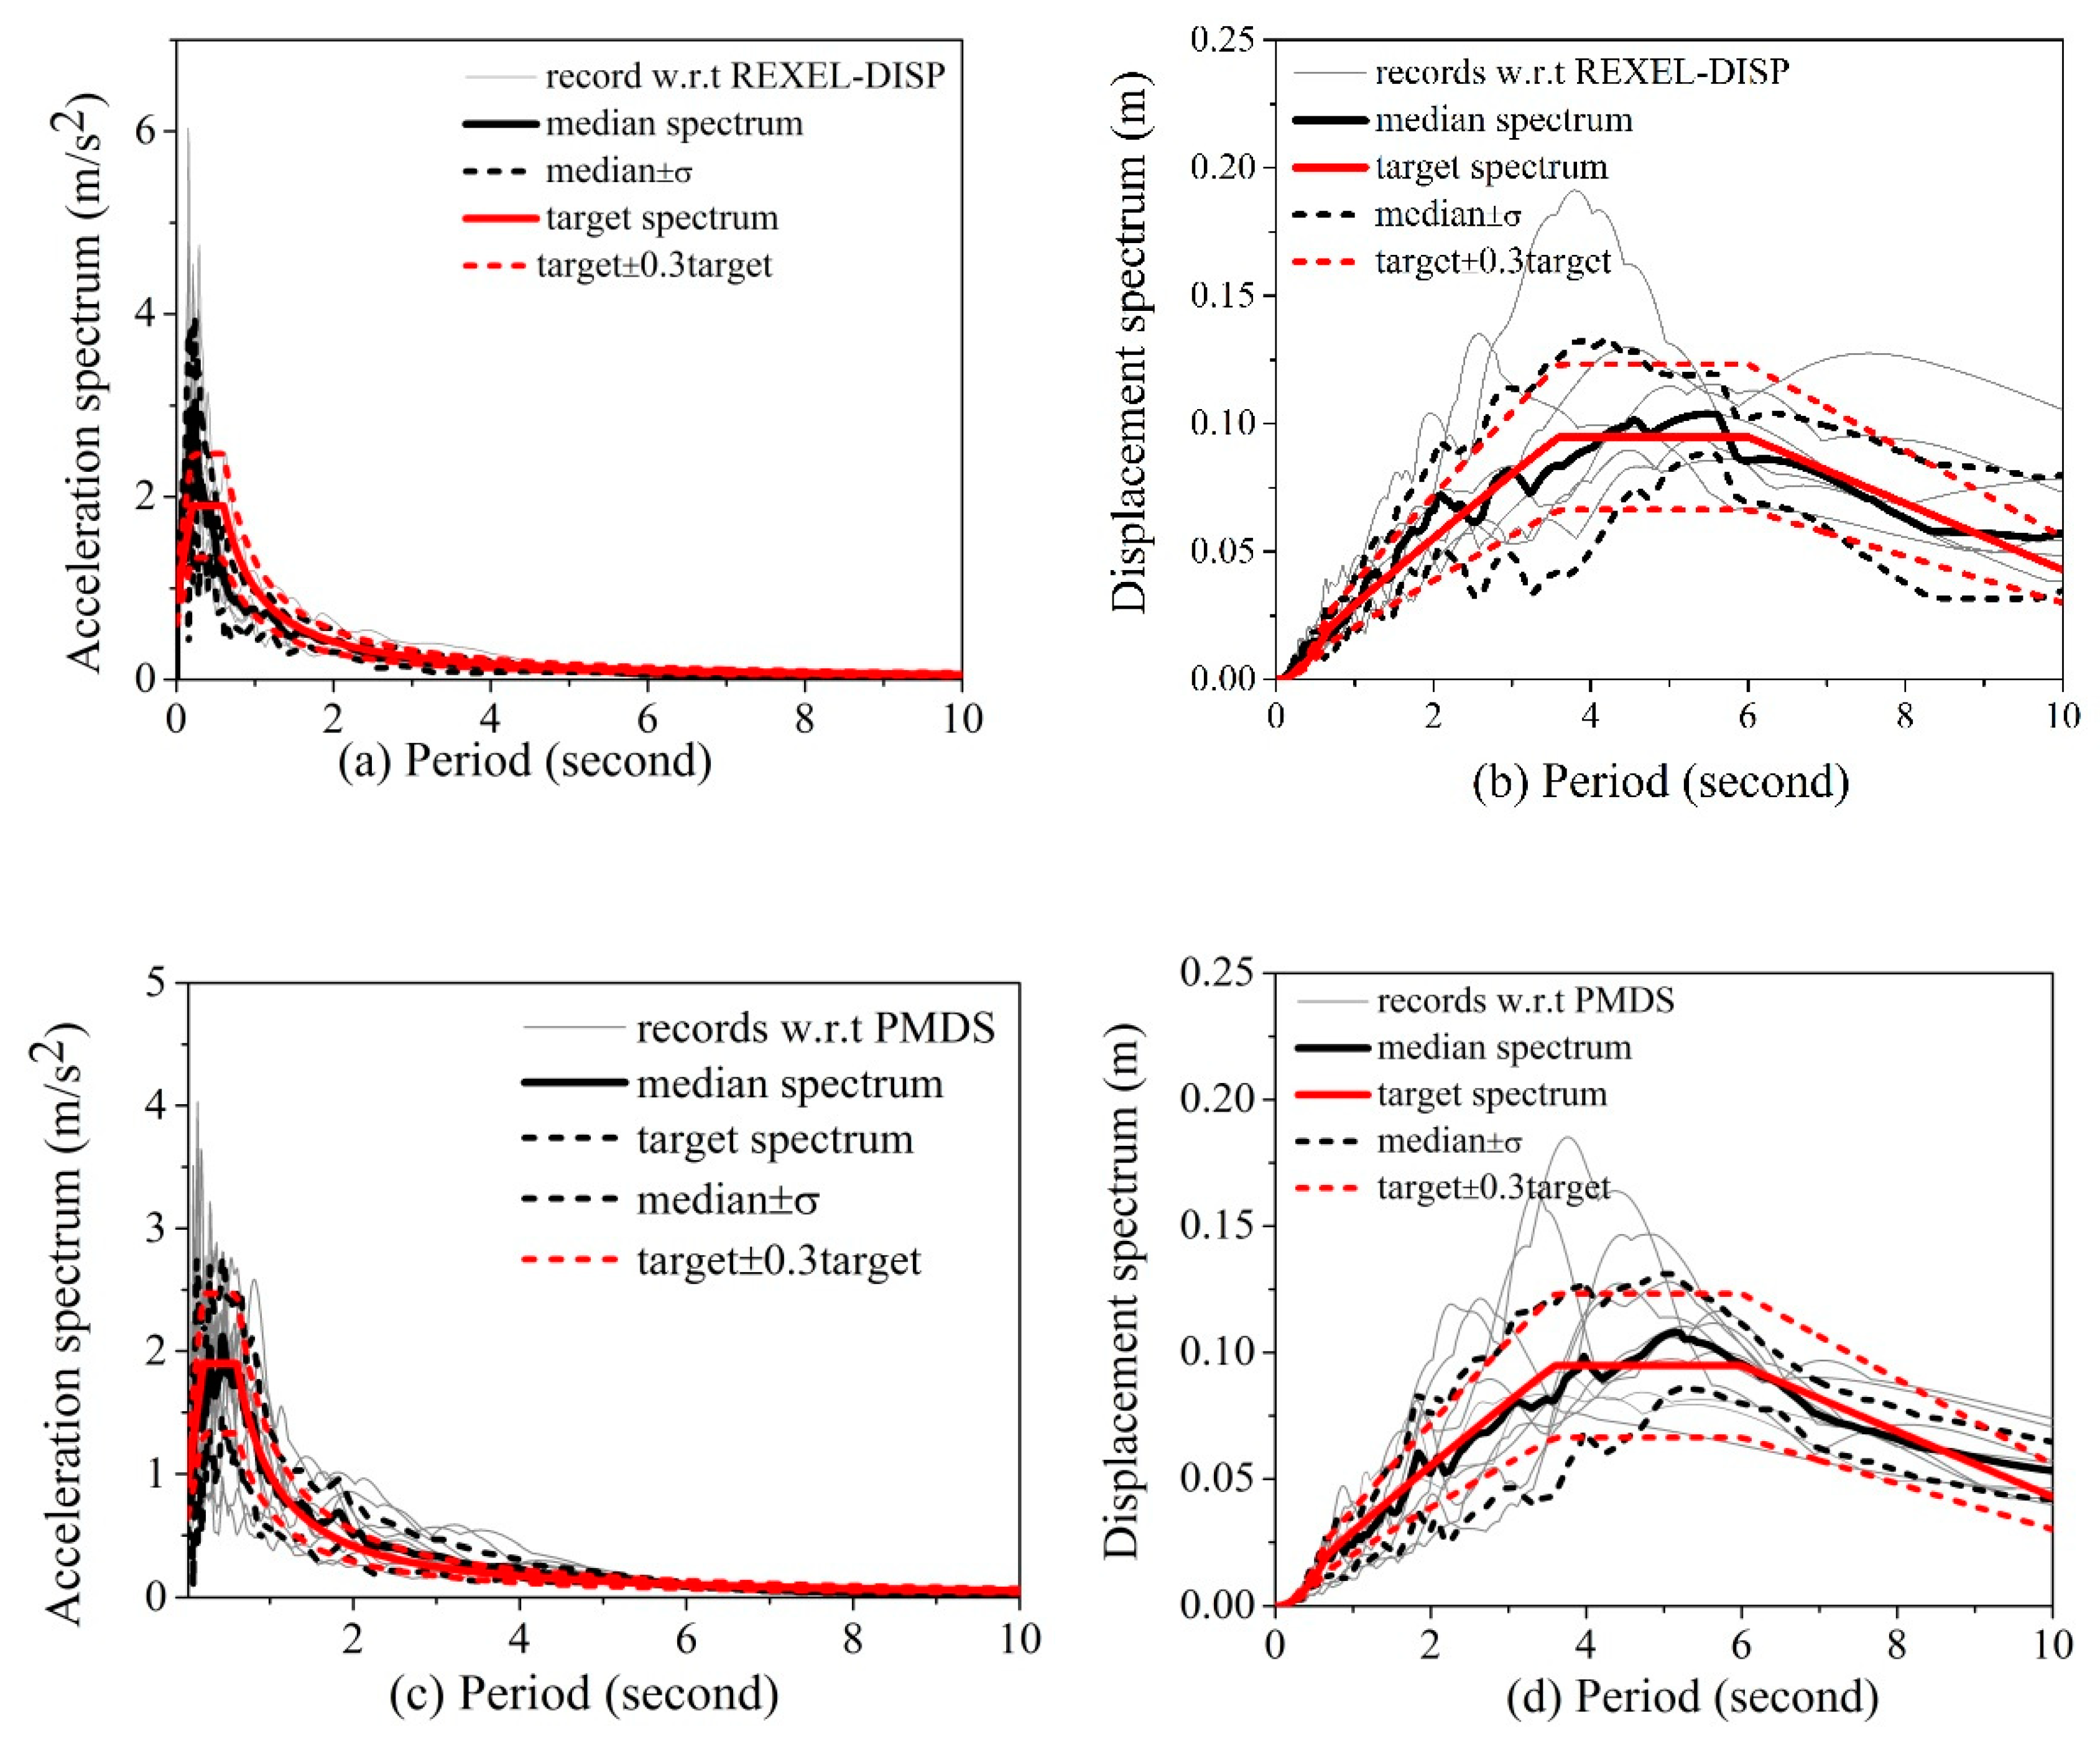
Two sets of optimal GM records were found and shown in Figure 10 according to the target spectra the same with Figure 9. For the tool of REXEL-DISP v 1.2, the acceleration and displacement response spectra of records (Set 1) are shown in Figure 10a,b, respectively. In contrast, the acceleration and displacement response spectra of records (Set 2) selected according to the proposed PMDS method are shown in Figure 10c,d, respectively. The waveform IDs of these two sets of records were derived according to ground motion database compiled in REXEL v 3.5 [25] and shown in Table 1.
For REXEL-DISP v 1.2, default settings where the lower and upper tolerances equal to 20% and the matching period starts from 0.5 to 8 s were chosen to select optimal GM records best matching the target displacement response spectra. An option of “Seven records” included in the set size module was also expected in addition to “I’m feeling lucky” option. The final solution is illustrated in Figure 10a,b where the median displacement response spectrum of records matches the target displacement response spectrum better compared with that for the target acceleration response spectrum. The acceleration response spectrum median and variance at a short period range are significantly deviated from the targets as shown in Figure 10a. The corresponding median and variance at long period range much better match the targets in contrast due to a good match of the displacement response spectra at long periods. However, records selected according to the REXEL-DISP v 1.2 are not very compatible generally.
As previously stated, the acceleration and displacement response spectra at short periods are not easy to compatible even though the displacement response spectra at corresponding periods are overlapped. It is more reasonable for GM selection if the target acceleration response spectrum is taken into account as shown in Figure 10c,d. Herein, ten records in Set 2 where the compatibility index equals 0.972 were finally selected and listed in Table 1. As shown in Figure 10d, the median displacement response spectrum in addition to the dispersion spectrum of records evolved by the PMDS method matches the target spectra a little better than those derived by toolbox of REXEL-DISP v 1.2 as shown in Figure 10b. The more important thing is that the median and dispersion acceleration response spectra of records derived by PMDS method can better match the targets at whole periods. The median acceleration response spectrum of records at long period ordinates is a little higher than the target spectrum at these ordinates. It is implicated that these records have more energy at the low frequency as the CI is lower than one. In spite of this, both target the acceleration and displacement response spectra are generally better matched using the PMDS method.
4. Application of PMDS and Its Influence on Structural Response
4.1. GM Selection Based on PMDS
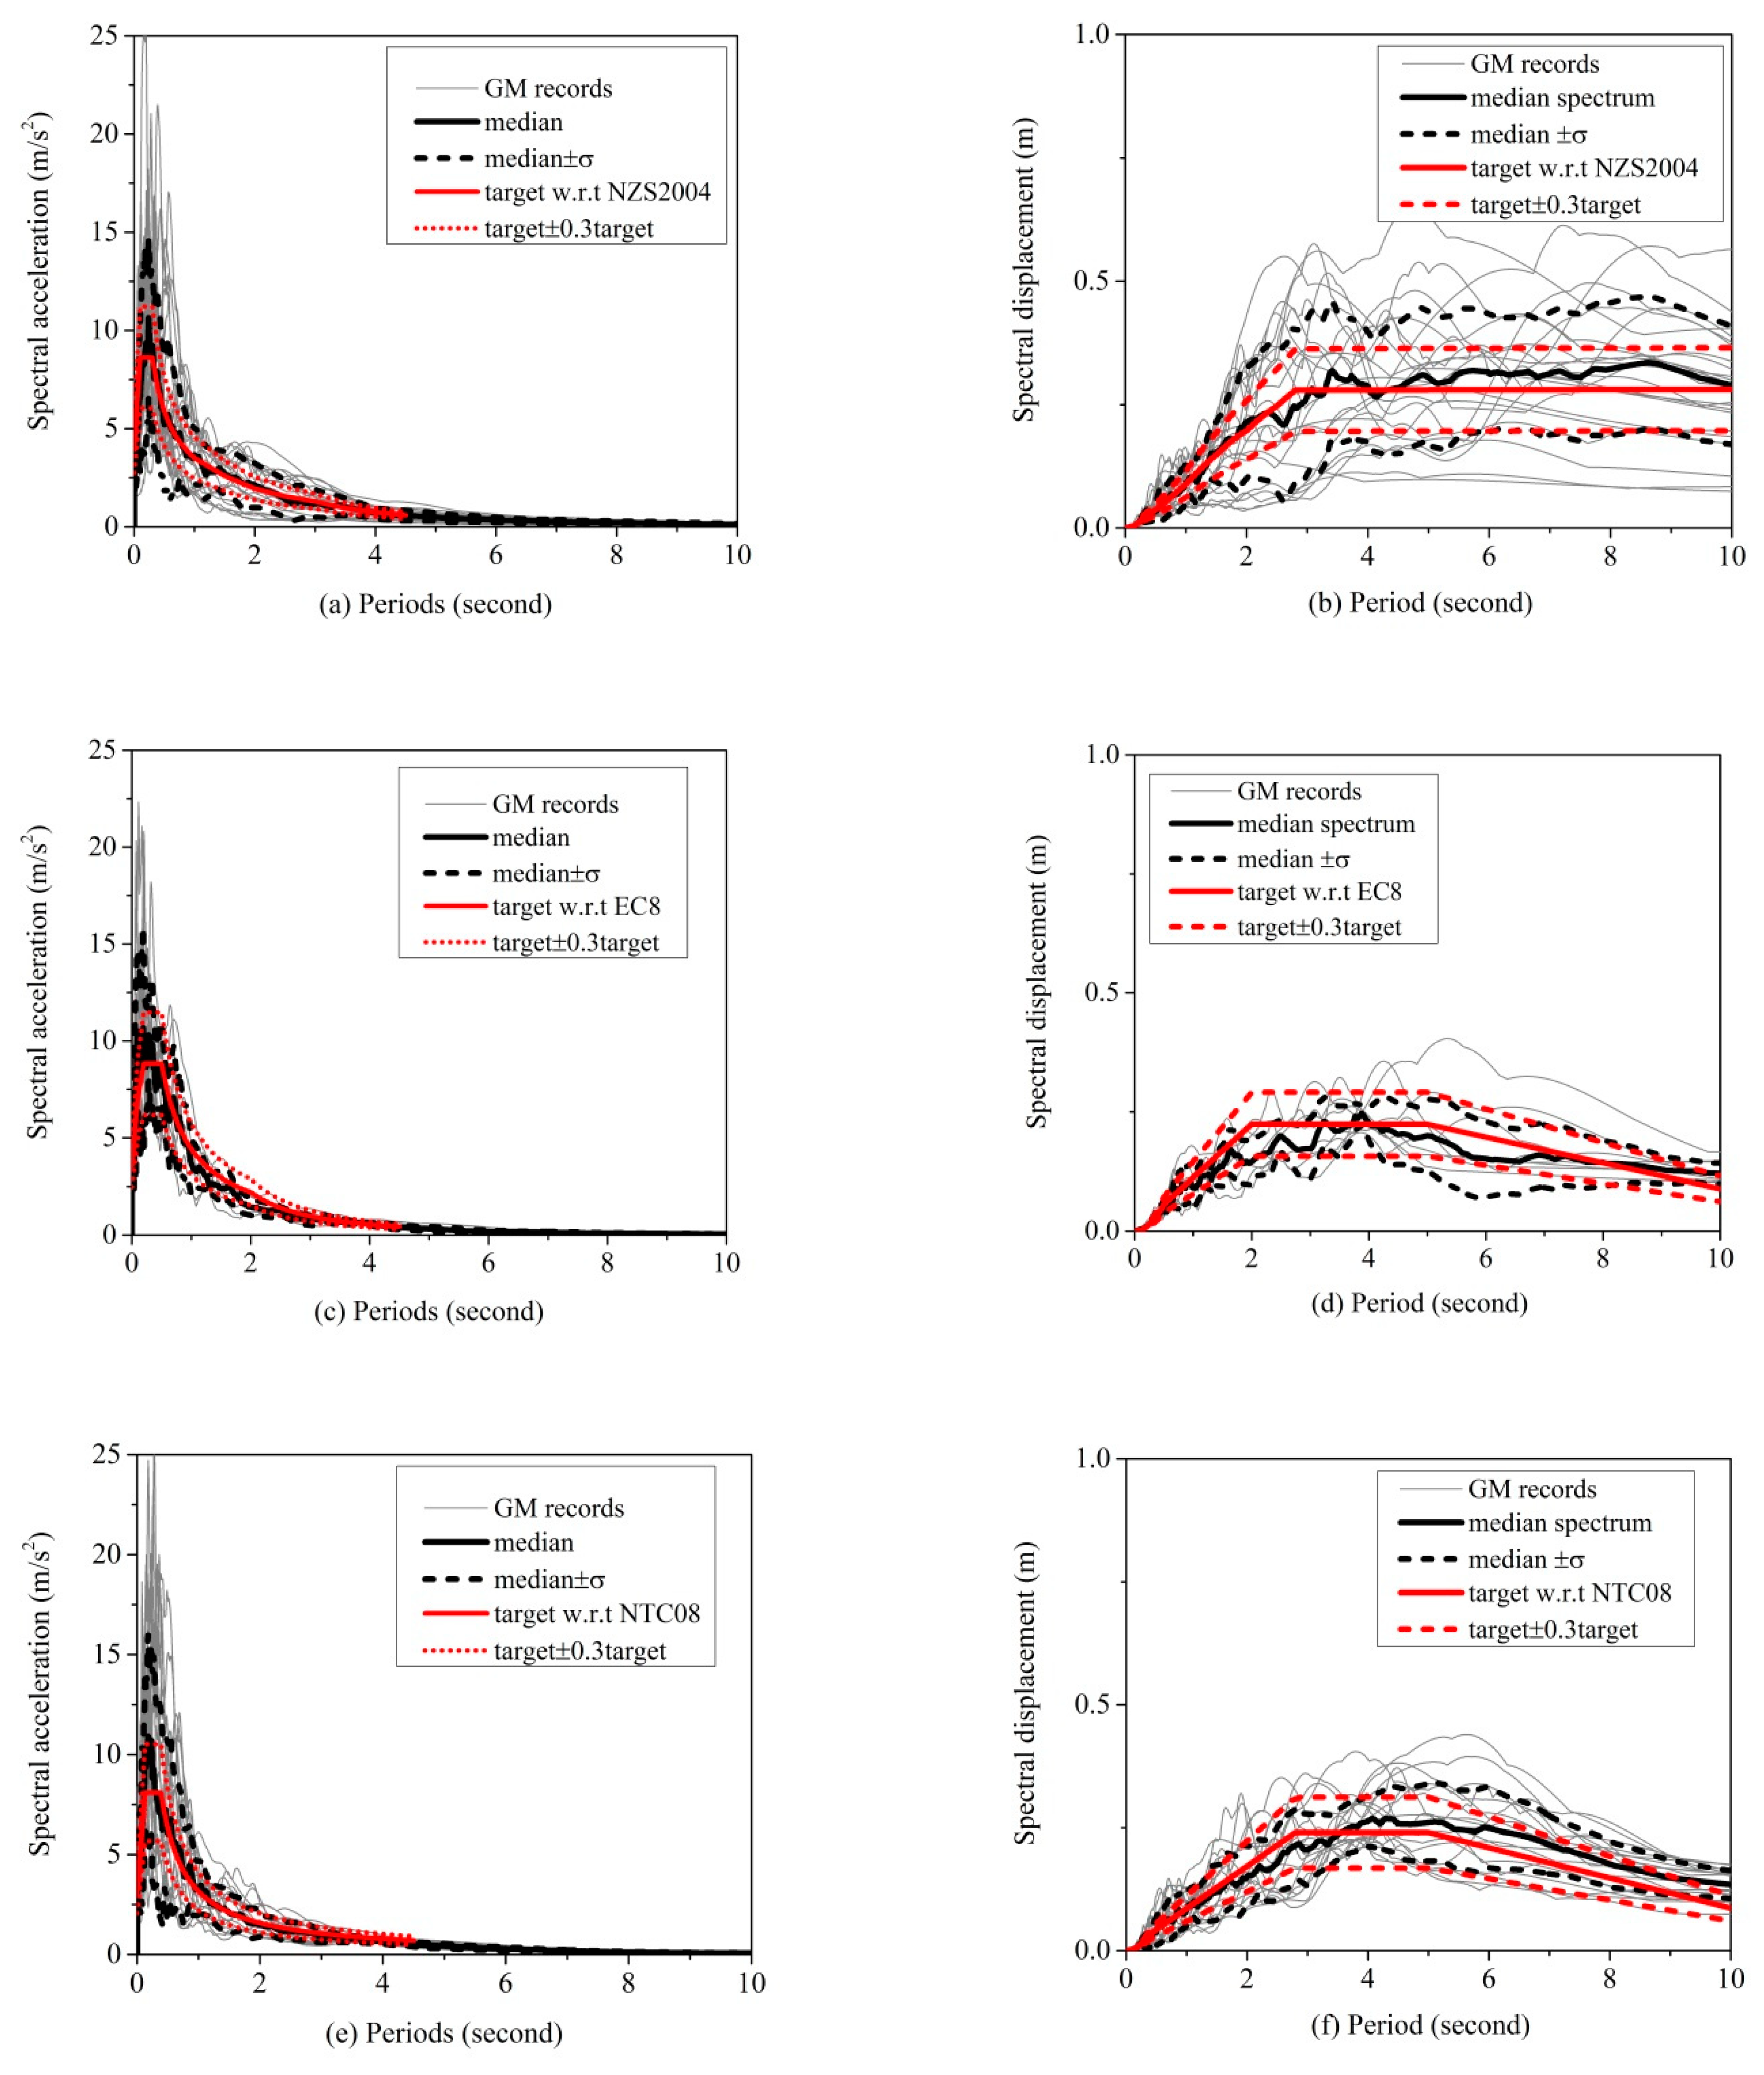
GM records selected based on PMDS method, for the first advantage, can select suitable records matching specified acceleration and displacement response spectra; for the second advantage, it does not consider whether or not these spectra are compatible. Remember that the displacement response spectra in Figure 1a are significantly different. The GM selection results would probably be different using the PMDS procedure even though the acceleration response spectra are adjusted to a similar magnitude. In such a case, records selected according to these codes may have significantly different intensities which lead to bias for structural response estimates. Meanwhile, a famous GM selection algorithm proposed by Baker et al. [26] was also introduced to compare both the response spectral match and its influence on structural response estimates.
There was no suitable set of GM records matching the spectra with respect to ASCE 7-16 due to its irrationally high spectral displacements at long period coordinates. The target spectra with respect to other three seismic codes concerned were left for GM record selection. The corresponding response spectra are illustrated in Figure 11.
Three pairs of target spectra have been well matched as shown in Figure 11. The acceleration response spectra are better matched in Figure 11a,c,e compared to those of corresponding displacement response spectra in Figure 11b,d,f, respectively. Without consideration of the displacement response spectra as shown in the right panel of Figure 11, dispersions of acceleration response spectra in Figure 11a,e are comparable except of those near two seconds. Thereinto, dispersion of acceleration response spectra of selected records according to EC8 ranks the lowest. Nevertheless, dispersion of acceleration response spectra of selected records in Figure 11a,c,e has a negligible difference at the period larger than four seconds. Note that this incompatibility has been stated in the previous section and can be magnified in the displacement response spectra, which are shown in the right panel of Figure 11.
The dispersion of displacement response spectra in Figure 11f is much less than that in Figure 11b at most period coordinates especially at periods larger than one second. It may be attributed to the fact that the number of GM records usable for the target displacement response spectrum is limited. In addition, dispersion of displacement response spectra in Figure 11d at periods larger than four seconds is much larger than that at periods lower than four seconds, whereas the corresponding acceleration response spectra at periods larger than four seconds are significantly unified. It implies that dispersion of structural response may be larger for structures designed with long periods (larger than four second) than those with short periods. However, it cannot be totally determined by the acceleration response spectra because the response spectra concerned above are within elasticity. Hence, further discussion of selected GMs on nonlinear structures is greatly needed.
4.2. GM Selection Based on Baker’s Greedy Method
A greedy optimization proposed by Baker [26] has been popular to use in recent years. The target acceleration response spectrum mean and variance can be reduced maximally. However, the displacement response spectrum was out of consideration. In order to compare selection results with the PMDS method, GM sets including 22, 9 and 20 GM records (simplified as G22, G09 and G20) were derived in terms of Baker’s greedy optimization method. The acceleration response spectrum corresponding with EC8 code for simplicity was chosen as the target spectrum. The corresponding numbers of records are consistent with those in Figure 11 of the previous section. Furthermore, the acceleration and displacement response spectra are shown in Figure 12.
Most records in G22, G09 and G20 overlap from the selection results. Eight records in G09 and sixteen records in G20 are included in G22, respectively. Target acceleration response spectrum means and variances in Figure 12a,c,e are well matched with samples. The G20 set derives the least variance with target variance as shown in Figure 11e. While G22 set in Figure 12a derives the worst variance among the other two sets even though it only has two more records, it implies that the target variance has no direct correlation with target number of records. Hence, G09 set in Figure 12c does not derive the least variance. Even so, the target acceleration response spectrum mean and variance are better matched than those in Figure 11a,c,e.
The displacement response spectra of selected records cannot match the target spectrum as shown in the right panel of Figure 12. The G22 set in Figure 12b derives the worst displacement spectrum variance relative with the target, and G20 set in Figure 12f is a little better off as some records excluded. The G09 set in Figure 12d derives the least variance, which, however, is larger than that of Figure 11d. The variances of displacement response spectra of these three groups of GMs at short period (two seconds herein) are generally smaller than those in Figure 11, especially the G22 and G20 sets. It is due to the fact greedy optimization method is emphasized on acceleration spectral matching.
4.3. Influence of GM Selection Results on Structural Response
4.3.1. Numerical Model of Reinforcement Concrete Frames
In order to illustrate influence of ground motion selection in terms of different codes on structural response, four archetype RC frames, including 1-storey, 2-storey, 4-storey, and 8-storey, are referred to Haselton’s models and were designed according to US codes, including ASCE 7-16, ACI 318-14 and IBC. [27,28,29]. All of the archetype frames were assumed to be located in California, coordinated as 33.855 N, -118.006 W on stiff soil site categorized as D per National Earthquake Hazards Reduction Program (NERHP). The corresponding mapped spectral accelerations for short periods and one-second periods are , which were used to design structures.
A typical three-bay frame was considered in this study. The elevations and reinforcement details are illustrated in Figure 13. The height of first story is 15 ft and the other typical story height is 13 ft. Beam and column sizes were selected by joint shear requirements and beam-column dimensional compatibility. For all analysis, the P-Delta effect was accounted for, using leaning column members with gravity loads in addition to lateral resisting frame. The horizontal displacement of base leaning column is coupled with base floor of main RC frame. The design yield stress of reinforcements in beams and columns was both 60 ksi, and the compressive strengths of beams and columns were chosen in accordance with Haselton [30]. Expected dead and live loads were set to 175 psf and 12 psf, respectively [31]. The design parameters of archetype structures are illustrated in Table 2.
Structural models were completed in Open Systems for Earthquake Engineering Simulation (OpenSees), [32] which can effectively simulate collapse of RC frame considering deterioration. The strength modification factor of fixed-base structures was chosen as eight, which corresponds with special moment frame. Space frames were considered in this study in which the ratio of tributary area for gravity and lateral loads was set to one.
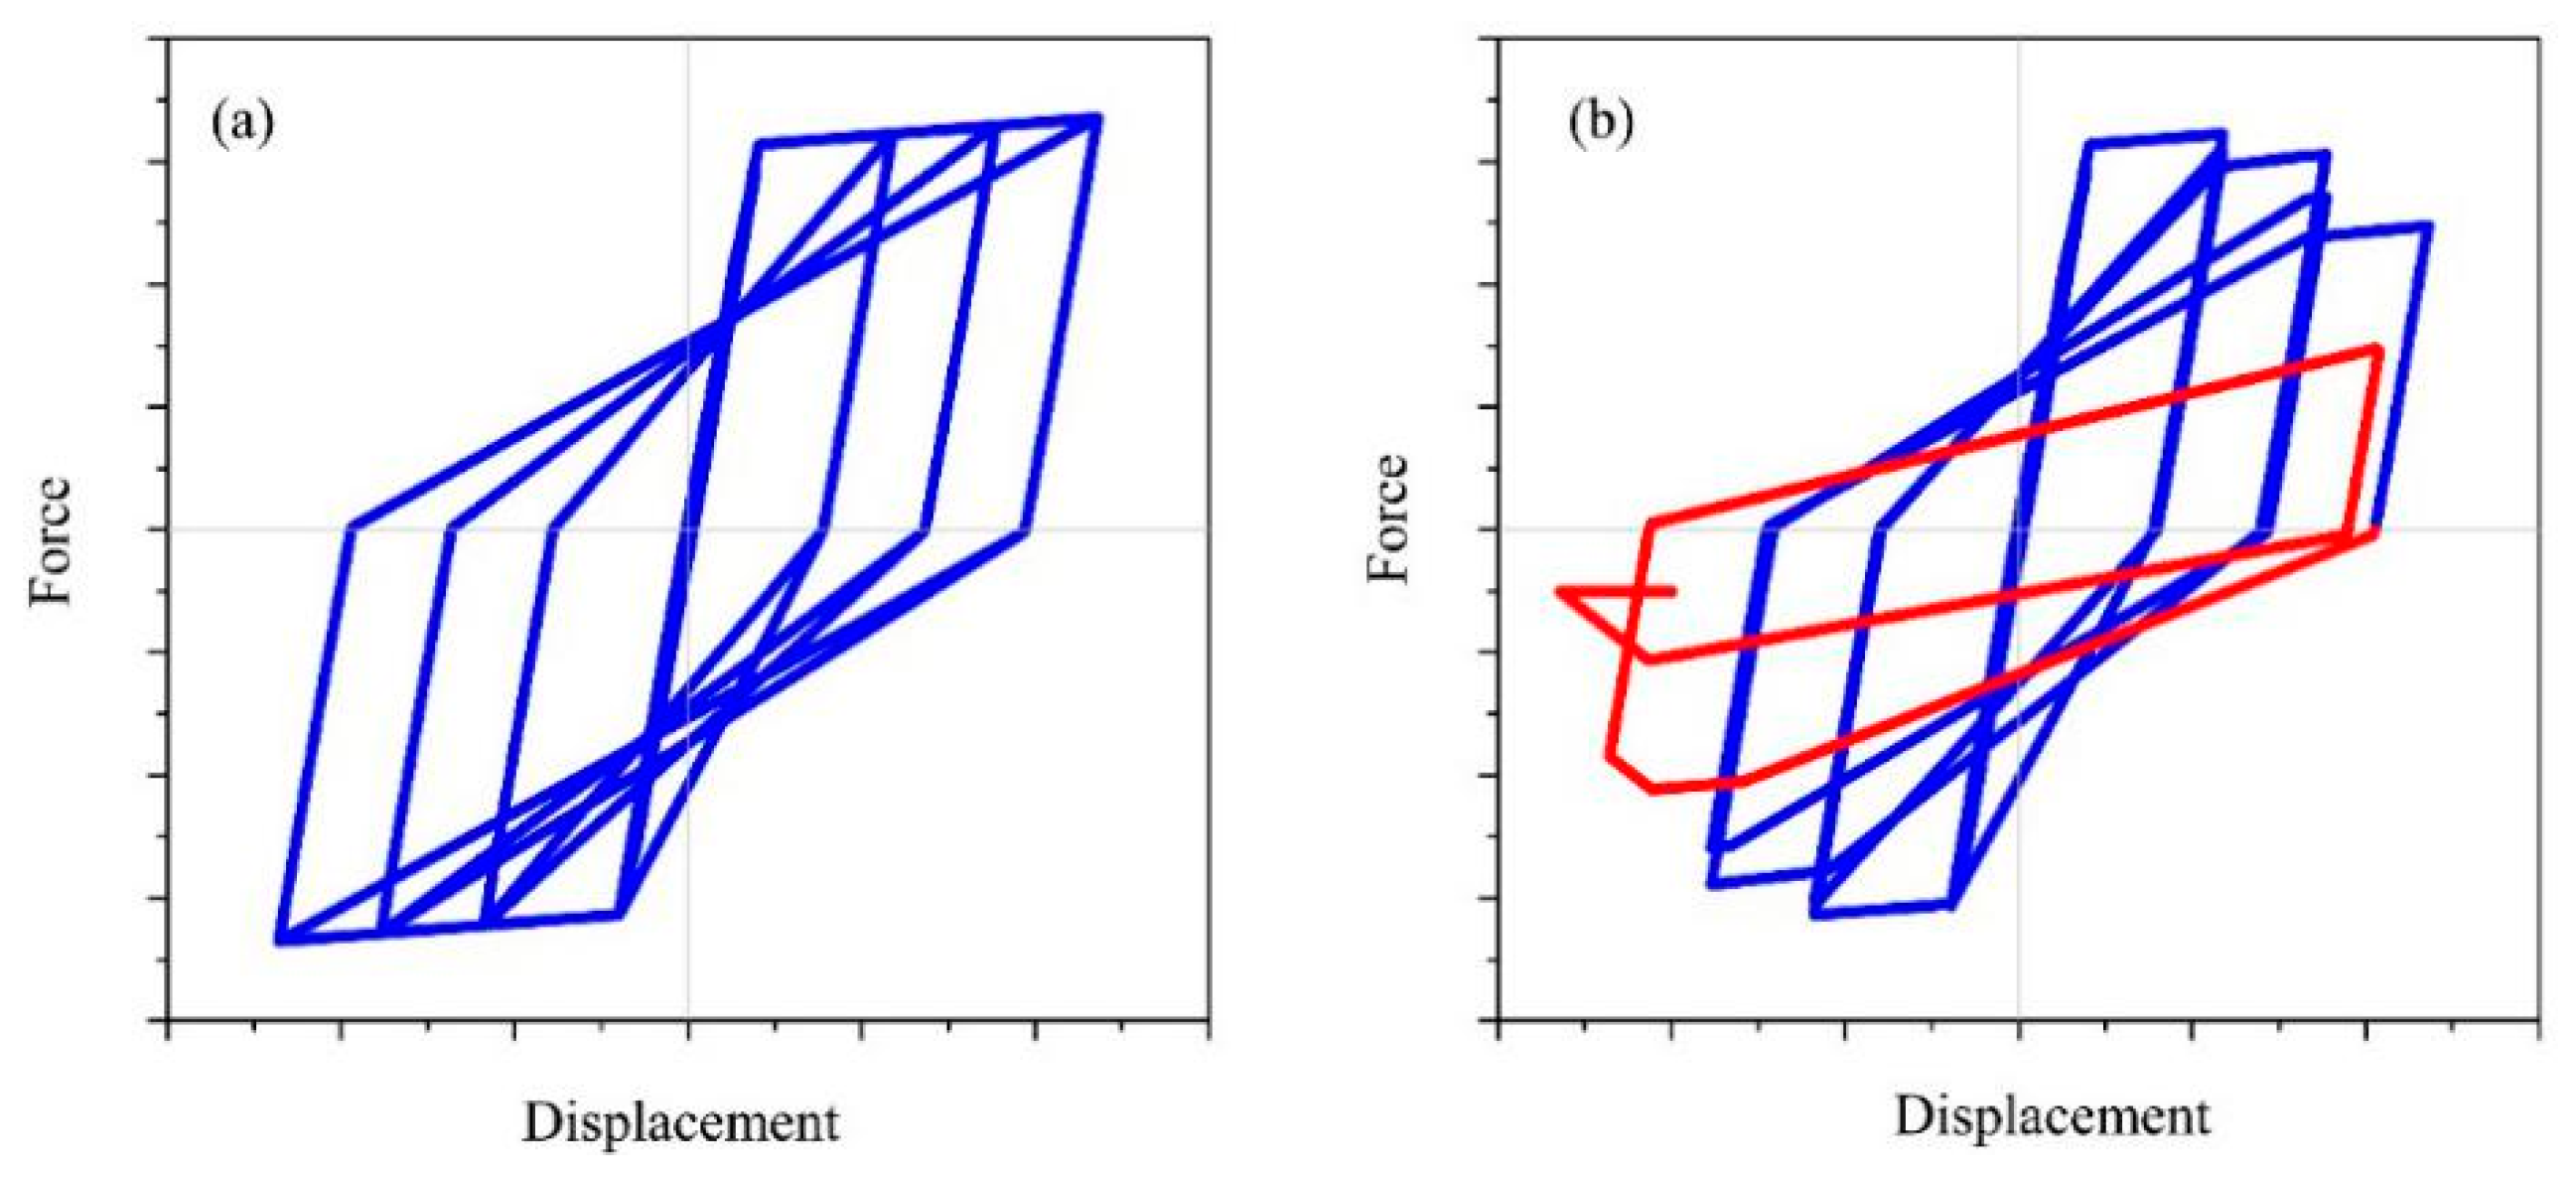
Joint2D element, widely used for simulating RC frame sideway collapse was used in this study. A zero-length Ibarra lumped plastic hinge, which captured cycle and in-cycle deterioration hysteric modes located at the external nodes of Joint2D element well, was employed in these models. The tri-linear monotonic backbone curve and some hysteric rules can be used to model cyclic deterioration behavior of hinge from Federal Emergency Management Agency (FEMA) P695, [33] as shown in Figure 14b, while the model without consideration of degradation is compared in Figure 14a. Yield strength, a major parameter of backbone curve, was predicted by Panagiotakos and Fardis functions [34]. Other parameters of backbone curve were referenced with calibrated results from FEMA P695. Additionally, a shear panel of Joint2D element, for simplicity, was modeled as elastic element whose cracked stiffness was only considered according to Sugano and Koreishi [35]. In this case, modifications in stiffness proportional damping have negligible effect on nonlinear response of RCF. Hence, Rayleigh damping expressed as linearly proportional to mass and initial stiffness was assigned only to elastic beams and columns [36]. Damping ratio, equal to 5% at the first mode period, was used and the factor applied to linear elements initial stiffness was amplified by 1.1 because the damping was only applied to linear elements.
4.3.2. Impact of GM Selection on Structural Responses
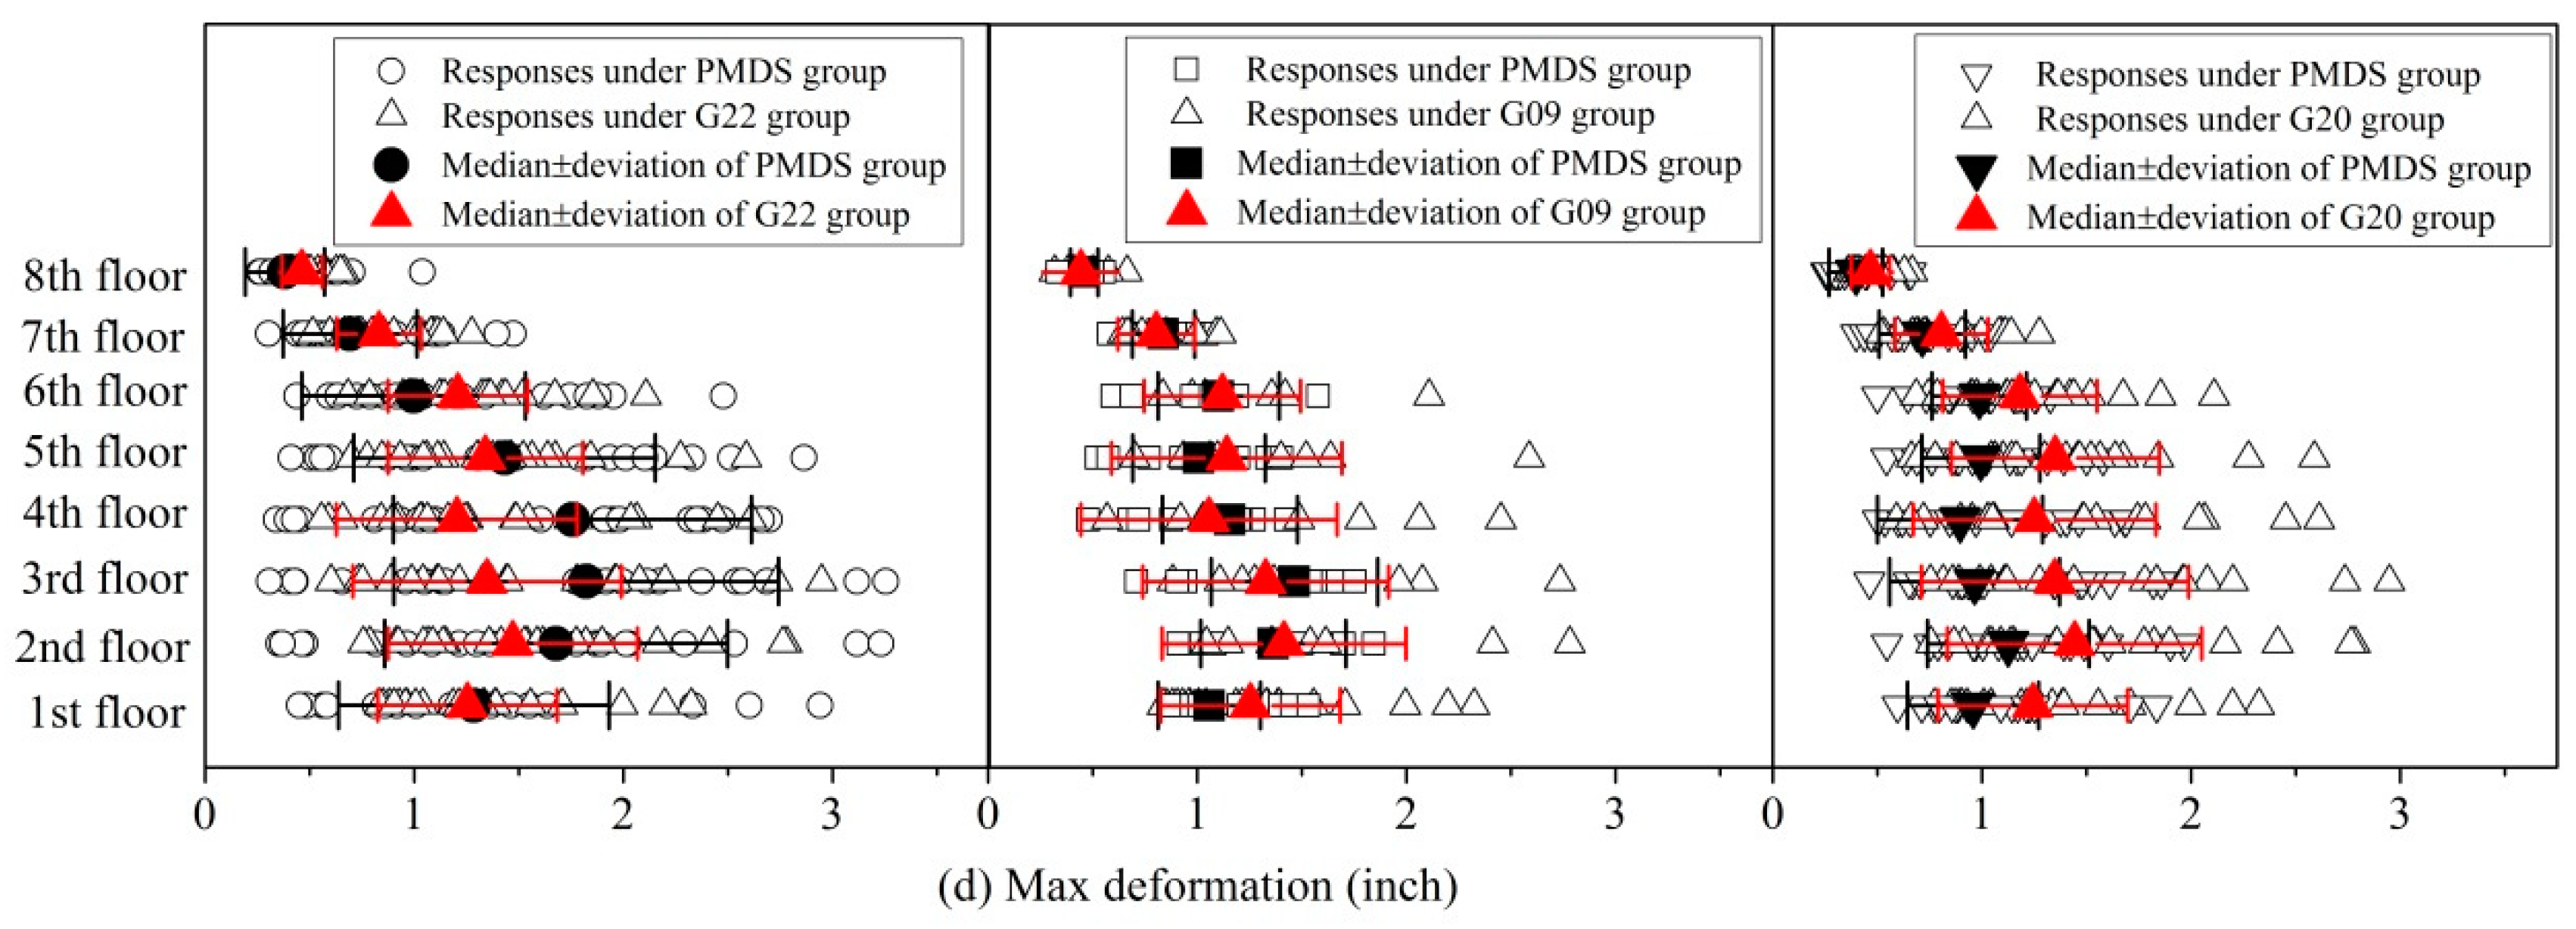
Nonlinear time history analyses, up to 408 times, have been performed to study structural responses based on GM records selected. Six groups of ground motions as shown in Figure 11 and Figure 12 were used to analyze four concrete steel frame structures, and the results are shown in Figure 15. Note that all the GM records were scaled the same as with Figure 11 and Figure 12.
The Str01 derives comparable bias of structural response estimates as shown in the left panel of Figure 15a. Additionally, the G22 set derives larger median responses of Str01, Str02 and Str03 (as shown in the left panel of Figure 15b,c) than those of GMs relative with NZS2004, which may be due to the former set having relatively larger target spectral accelerations at fundamental periods of corresponding structures. However, the median structural response of Str04 under GMs selected by PMDS method as shown in the left panel of Figure 15d is larger than that under Baker G22 set. It may attribute to contribution of larger low frequency components as shown in Figure 11b. Generally, the bias of structural response estimate of GMs with respect to code NZS2004 is close to that of GMs derived by Baker’s greedy method.
The structural response estimates are improved for GMs derived by PMDS method as shown in the middle panel of Figure 15 except Str01 model. The bias of structural response estimates decreases as the fundamental period of structure gets larger, such as Str02, Str03 and Str04. The structural response bias under GMs with respect to code EC8 derived by PMDS method is less than that derived by Baker’s greedy method. The results are shown in the middle panel of Figure 15b–d. For Str03 model, the standard variance under GMs derived by PMDS method is nearly half of that derived by greedy method. The advantage of the former method with respect to Str04 model as shown in the middle panel of Figure 15d follows and the statistical results are illustrated in Table 3 and Table 4.
The acceleration response spectrum is not the only target function for PMDS selection method that the acceleration spectrum variance of GMs selected would probably larger than that of GMs by the greedy method. The bias of structural response estimates, such as short-period structure Str01, would significantly depend on acceleration response spectrum variance. Therefore, the bias of Str01 under GMs according to code NTC08 in the right panel of Figure 15a is larger than that of GMs derived by the greedy method. The biases of other models including Str02, Str03 and Str04, under GMs selected by PMDS method, are smaller than those under GMs derived by the latter method. The structural response means of all archetype RC models under G20 set of GMs are larger than those under GMs selected by PMDS method. Detailed results are illustrated in Table 3 and Table 4.
The results as shown above show that the bias of long-period structural responses is tightly correlated with displacement spectra variance of selected records at long periods are expected. In addition, the GM group that has larger low frequency components would derive larger median structural response, especially long-period structures. The PMDS method generally performs better on structural response estimates than greedy method even though it has a little larger bias of structural response estimate for the Str01 model.
5. Conclusions
A computationally effective GM selection algorithm was proposed to select a set of recorded time histories whose acceleration and displacement response spectra match the targets. The algorithm initially probabilistically generates several sub-spectra from target displacement response spectrum, and then selects suites of GM records with the MCMC sampling technique individually match the sub-spectra. A distribution-scaling technique then further improves the match between the acceleration response spectra of records and targets. The evolved individuals were finally ranked in terms of a proposed normalized function to find the optimal one that deviates from the targets the least. It was shown that the proposed selection algorithm selects GM records whose acceleration and displacement response spectra generally better match the targets including means and variances by comparing with two mature GM selection algorithms. The GM records selected by the PMDS method are more compatible than those by the tool of REXEL-DISP v1.2 with respect to given TDSI. Furthermore, the proposed selection algorithm can select records without consideration of compatibility of target response spectra.
The proposed selection algorithm, then, was used to select GM records for structural seismic response estimates of four RC frames, aiming to assess influence of GM selection considering the target displacement response spectrum on structural response. It was seen that GM records selected merely according to acceleration response spectrum may overestimate seismic structural responses. The dispersion of displacement response spectra of records selected by Baker’s algorithm is larger than those selected by proposed PMDS method. The increase on dispersion of displacement response spectra of records at long periods increases the dispersion of responses for Str02, Str03 and Str04 models except Str01 model. This is inevitable because the match of acceleration response spectrum mean and variance of records selected by Baker’s algorithm at short periods is better than those by the PMDS algorithm. It can be improved if the match for the target acceleration response spectrum is better, which, however, needs more iteration. These results observed implicates that the application of GM selection including displacement response spectrum is important for many seismic performance evaluations since the design displacement response spectrum has a close correlation with long-period structures. It would be promising to quantify the influence of GM selection on RBD or PBEE estimation, which, however, has not been applied herein, and this new proposed algorithm will be facilitated in future study.
Author Contributions
Conceptualization and Methodology, Y.C.; Validation, X.Z. and H.L.; Resources, L.X. and X.Z.; Writing—Original Draft Preparation, Y.C.; Writing—Review and Editing, X.Z., L.X. and H.L.
Funding
This work was financially supported by the National Key R & D Program of China (No. 2017YFC1500602), the National Natural Science Foundation of China (No. 51678208) and the Natural Science Foundation of Shandong Province (No. ZR2018BEE044). We also appreciate the support of the Major Program of Mutual Foundation of Weihai City with the Harbin Institute of Technology (Weihai).
Conflicts of Interest
The authors declare no conflict of interest.
References
- Cimellaro, G.P.; Renschler, C.; Bruneau, M. Introduction to resilience-based design (RBD). In Computational Methods, Seismic Protection, Hybrid Testing and Resilience in Earthquake Engineering; Springer: Cham, Switzerland, 2015; pp. 151–183. [Google Scholar]
- Katsanos, E.I.; Sextos, A.G.; Manolis, G.D. Selection of earthquake ground motion records: A state-of-the-art review from a structural engineering perspective. Soil Dyn. Earthq. Eng. 2010, 30, 157–169. [Google Scholar] [CrossRef]
- Jayaram, N.; Baker, J.W. Ground-motion selection for PEER Transportation Systems Research Program. In Proceedings of the 7th CUEE and 5th ICEE Joint Conference, Tokyo, Japan, 3–5 March 2010. [Google Scholar]
- Zhai, C.H.; Xie, L.L. A new approach of selecting real input ground motions for seismic design: The most unfavourable real seismic design ground motions. Earthq. Eng. Struct. Dyn. 2007, 36, 1009–1027. [Google Scholar] [CrossRef]
- Beyer, K.; Bommer, J.J. Selection and Scaling of Real Accelerograms for Bi-Directional Loading: A Review of Current Practice and Code Provisions. J. Earthq. Eng. 2007, 11, 13–45. [Google Scholar] [CrossRef]
- Shantz, T.J. Selection and scaling of earthquake records for nonlinear dynamic analysis of first model dominated bridge structures. In Proceedings of the 8th U.S. National Conference on Earthquake Engineering, San Francisco, CA, USA, 18–22 April 2006. [Google Scholar]
- Watson-Lamprey, J.; Abrahamson, N. Selection of ground motion time series and limits on scaling. Soil Dyn. Earthq. Eng. 2006, 26, 477–482. [Google Scholar] [CrossRef]
- Dussom, K.B.; Hadj-Hamou, T.; Bakeer, R.M. Quake: An expert system for the selection of design earthquake accelerogram. Comput. Struct. 1991, 40, 161–167. [Google Scholar] [CrossRef]
- Wang, G.; Youngs, R.; Power, M.; Li, Z. Design ground motion library: an interactive tool for selecting earthquake ground motions. Earthq. Spectra 2015, 31, 617–635. [Google Scholar] [CrossRef]
- Al Atik, L.; Abrahamson, N. An improved method for nonstationary spectral matching. Earthq. Spectra 2010, 26, 601–617. [Google Scholar] [CrossRef]
- Youngs, R.R.; Power, M.S.; Wang, G.; Makdisi, F.I.; Chin, C.C. Design ground motion library (DGML)—Tool for selecting time history records for specific engineering applications. In Proceedings of the SMIP07 Seminar on Utilization of Strong-Motion Data, Sacramento, CA, USA, 13 September 2007. [Google Scholar]
- Naeim, F.; Alimoradi, A.; Pezeshk, S. Selection and scaling of ground motion time histories for structural design using genetic algorithms. Earthq. Spectra 2004, 20, 413–426. [Google Scholar] [CrossRef]
- Georgioudakis, M.; Fragiadakis, M.; Papadrakakis, M. Multi-criteria selection and scaling of ground motion records using Evolutionary Algorithms. Procedia Eng. 2017, 199, 3528–3533. [Google Scholar] [CrossRef]
- Jayaram, N.; Lin, T.; Baker, J.W. A computationally efficient ground-motion selection algorithm for matching a target response spectrum mean and variance. Earthq. Spectra 2011, 27, 797–815. [Google Scholar] [CrossRef]
- Moschen, L.; Medina, R.A.; Adam, C. A Ground Motion Record Selection Approach Based on Multiobjective Optimization. J. Earthq. Eng. 2017, 21, 1–19. [Google Scholar] [CrossRef]
- FEMA, Federal Emergency Management Agency. Improvement of Nonlinear Static Seismic Analysis Procedures, FEMA 440; Applied Technology Council (ATC-55 Project): Washington, DC, USA, 2005.
- Powell, G.H. Displacement-based seismic design of structures. Earthq. Spectra 2008, 24, 555–557. [Google Scholar] [CrossRef]
- Smerzini, C.; Galasso, C.; Iervolino, I.; Paolucci, R. Ground motion record selection based on broadband spectral compatibility. Earthq. Spectra 2014, 30, 1427–1448. [Google Scholar] [CrossRef]
- Code-NTC08 I. Norme tecniche per le costruzioni in zone sismiche. Ministerial Decree DM 2008, 14, 9-04.02. [Google Scholar]
- Kottke, A.; Rathje, E.M. A semi-automated procedure for selecting and scaling recorded earthquake motions for dynamic analysis. Earthq. Spectra 2008, 24, 911–932. [Google Scholar] [CrossRef]
- Iervolino, I.; Cornell, C.A. Record selection for nonlinear seismic analysis of structures. Earthq. Spectra 2005, 21, 685–713. [Google Scholar] [CrossRef]
- Heo, Y.A.; Kunnath, S.K. Abrahamson N. Amplitude-scaled versus spectrum-matched ground motions for seismic performance assessment. J. Struct. Eng. 2010, 137, 278–288. [Google Scholar] [CrossRef]
- Seifried, A.E. Response Spectrum Compatibilization and Its Impact on Structural Response Assessment. Ph.D. Thesis, Stanford University, Stanford, CA, USA, 2013. [Google Scholar]
- Deb, K.; Agrawal, S.; Pratap, A.; Meyarivan, T. A fast elitist non-dominated sorting genetic algorithm for multi-objective optimization: NSGA-II. In Parallel Problem Solving from Nature PPSN VI; Springer: Heidelberg, Germany, 2000; pp. 849–858. [Google Scholar]
- Iervolino, I.; Galasso, C.; Cosenza, E. REXEL: Computer aided record selection for code-based seismic structural analysis. Bull. Earthq. Eng. 2010, 8, 339–362. [Google Scholar] [CrossRef]
- Baker, J.W. The conditional mean spectrum: A tool for ground motion selection. ASCE J. Struct. Eng. 2011, 137, 322–331. [Google Scholar] [CrossRef]
- American Society of Civil Engineers. Minimum Design Loads for Buildings and Other Structures; ASCE: Reston, VA, USA, 2010. [Google Scholar]
- American Concrete Institute. ACI 318–14: Building Code Requirements for Structural Concrete and Commentary; American Concrete Institute: Farmington Hills, MI, USA, 2014. [Google Scholar]
- International Code Council. International Building Code, USA. 2012. Available online: https://codes.iccsafe.org/content/IBC2012/toc (accessed on 18 November 2018).
- Haselton, C.B. Assessing Seismic Collapse Safety of Modern Reinforced Concrete Moment Frame Buildings; Stanford University: Stanford, CA, USA, 2006. [Google Scholar]
- Ellingwood, B. Development of a Probability Based Load Criterion for American National Standard A58: Building Code Requirements for Minimum Design Loads in Buildings and Other Structures; US Department of Commerce, National Bureau of Standards, 1980. Available online: https://nehrpsearch.nist.gov/static/files/NIST/PB80196512.pdf (accessed on 18 November 2018).
- Mazzoni, S.; McKenna, F.; Scott, M.H.; Fenves, G.L. OpenSees Command Language Manual; Pacific Earthquake Engineering Research (PEER) Center: Berkeley, CA, USA, 2006. [Google Scholar]
- Federal Emergency Management Agency. Quantification of Building Seismic Performance Factors; FEMA: Washington, DC, USA, 2009.
- Panagiotakos, T.B.; Fardis, M.N. Deformations of reinforced concrete members at yielding and ultimate. Struct. J. 2001, 98, 135–148. [Google Scholar]
- Sugano, S.; Koreishi, I. An empirical evaluation of inelastic behavior of structural elements in reinforced concrete frames subjected to lateral forces. V WCEE 1974, 1, 841–844. [Google Scholar]
- Ibarra, L.F.; Medina, R.A.; Krawinkler, H. Hysteretic models that incorporate strength and stiffness deterioration. Earthq. Eng. Struct. Dyn. 2005, 34, 1489–1511. [Google Scholar] [CrossRef]
Figure 1.
Elastic design acceleration (a) and displacement (b) spectra according to New Zealand NZS1170, United States, European and Italian seismic codes for 475-yr return period on ground category B.
Figure 1.
Elastic design acceleration (a) and displacement (b) spectra according to New Zealand NZS1170, United States, European and Italian seismic codes for 475-yr return period on ground category B.

Figure 2.
Acceleration and displacement response spectra of NGA_144, NGA_1738 records (top row plot), and NGA_2482, NGA_2483 records (bottom row plot).
Figure 2.
Acceleration and displacement response spectra of NGA_144, NGA_1738 records (top row plot), and NGA_2482, NGA_2483 records (bottom row plot).

Figure 3.
Compatible acceleration and displacement spectra derived from target displacement spectrum in Italy (TDSI).
Figure 3.
Compatible acceleration and displacement spectra derived from target displacement spectrum in Italy (TDSI).

Figure 4.
Flowchart of the ground motion selection algorithm.

Figure 5.
Illustration of pre-selection of GM records in terms of displacement response spectra.

Figure 6.
Pre-selection of GM records by the Markov chain Monte Carlo sampling technique using: (a) a reference period at five seconds and (b) two reference periods at five and ten seconds.
Figure 6.
Pre-selection of GM records by the Markov chain Monte Carlo sampling technique using: (a) a reference period at five seconds and (b) two reference periods at five and ten seconds.

Figure 7.
A solution selected by non-dominated sorting.

Figure 8.
The acceleration sub-spectra derived according to the seismic distribution using the inverse of the normal distribution function.
Figure 8.
The acceleration sub-spectra derived according to the seismic distribution using the inverse of the normal distribution function.

Figure 9.
The displacement (a) and acceleration (b) response spectra derived before solution evolving; and the displacement (c) and acceleration (d) response spectra derived after the solution evolving using the distribution-scaled method.
Figure 9.
The displacement (a) and acceleration (b) response spectra derived before solution evolving; and the displacement (c) and acceleration (d) response spectra derived after the solution evolving using the distribution-scaled method.

Figure 10.
Acceleration and displacement response spectra of records derived using REXEL-DISP v1.2 ((a) and (b)) and the newly proposed method in this work ((c) and (d)) with respect to target displacement spectrum in Italy.
Figure 10.
Acceleration and displacement response spectra of records derived using REXEL-DISP v1.2 ((a) and (b)) and the newly proposed method in this work ((c) and (d)) with respect to target displacement spectrum in Italy.

Figure 11.
Acceleration and displacement response spectra of optimal sets of ground motion records selected based on target spectra derived according to codes of NZS2004 (corresponding to (a) and (b)), EC8 (corresponding to (c) and (d)) and NTC08 (corresponding to (e) and (f)).
Figure 11.
Acceleration and displacement response spectra of optimal sets of ground motion records selected based on target spectra derived according to codes of NZS2004 (corresponding to (a) and (b)), EC8 (corresponding to (c) and (d)) and NTC08 (corresponding to (e) and (f)).

Figure 12.
Acceleration and displacement response spectra of optimal sets of GM records selected in terms of Baker’s greedy method for 22 records (corresponding to (a) and (b)), nine records (corresponding to (c) and (d)) and 20 records (corresponding to (e) and (f)).
Figure 12.
Acceleration and displacement response spectra of optimal sets of GM records selected in terms of Baker’s greedy method for 22 records (corresponding to (a) and (b)), nine records (corresponding to (c) and (d)) and 20 records (corresponding to (e) and (f)).

Figure 13.
Design documentation for a one-story (top left), two-story (top right), four-story (bottom left) and eight-story (bottom right) space frame archetype with 20’ bay spacing.
Figure 13.
Design documentation for a one-story (top left), two-story (top right), four-story (bottom left) and eight-story (bottom right) space frame archetype with 20’ bay spacing.

Figure 14.
Force-displacement relation of beam-column joint (a) without considering deterioration; and (b) considering deterioration.
Figure 14.
Force-displacement relation of beam-column joint (a) without considering deterioration; and (b) considering deterioration.

Figure 15.
Maximum deformations of each floor of archetype Str01 (a), Str02 (b), Str03 (c) and Str04 (d) under sets of GM records with respect to NZS2004 and G22 in the first column, EC8 and G09 in the middle column, NTC08 and G20 in the third column, respectively.
Figure 15.
Maximum deformations of each floor of archetype Str01 (a), Str02 (b), Str03 (c) and Str04 (d) under sets of GM records with respect to NZS2004 and G22 in the first column, EC8 and G09 in the middle column, NTC08 and G20 in the third column, respectively.


Table 1.
Information of ground motion records selected based on the target spectra derived from TDSI.
Table 1.
Information of ground motion records selected based on the target spectra derived from TDSI.
| GM Set | Waveform ID | Station ID | Earthquake Name | Date | Mw | Fault Mechanism | Epicentral Distance (km) |
|---|---|---|---|---|---|---|---|
| Set 1 | 014(y component) | TKY011 | Near Miyakejima Island | 2000-7-30 | 6.4 | strike-slip | 21.59 |
| 114(y component) | ST_108 | South Iceland | 2000-6-17 | 6.5 | strike-slip | 13.23 | |
| 118(y component) | ST_105 | South Iceland | 2000-6-21 | 6.4 | strike-slip | 21.37 | |
| 243(y component) | FKS014 | EASTERN FUKUSHIMA PREF | 2011-4-11 | 6.6 | normal | 23.07 | |
| 244(y component) | FKS015 | EASTERN FUKUSHIMA PREF | 2011-4-11 | 6.6 | normal | 27.56 | |
| 383(y component) | CACS | Christchurch | 2011-6-13 | 6.0 | reverse | 19.34 | |
| 389(x component) | RHSC | Christchurch | 2011-6-13 | 6.0 | reverse | 14.76 | |
| Set 2 | 124(x component) | ST_306 | South Iceland | 2000-6-21 | 6.4 | strike-slip | 20.18 |
| 242(x component) | FKS011 | EASTERN FUKUSHIMA PREF | 2011-4-11 | 6.6 | normal | 26.24 | |
| 242(y component) | FKS011 | EASTERN FUKUSHIMA PREF | 2011-4-11 | 6.6 | normal | 26.24 | |
| 313(x component) | SAN0 | EMILIA_Pianura_Padana | 2012-5-29 | 6.0 | reverse | 4.73 | |
| 345(x component) | TPLC | Christchurch | 2011-2-21 | 6.2 | reverse | 19.97 | |
| 383(x component) | CACS | Christchurch | 2011-6-13 | 6.0 | reverse | 19.34 | |
| 388(x component) | PPHS | Christchurch | 2011-6-13 | 6.0 | reverse | 13.44 | |
| 388(y component) | PPHS | Christchurch | 2011-6-13 | 6.0 | reverse | 13.44 | |
| 391(y component) | SMTC | Christchurch | 2011-6-13 | 6.0 | reverse | 14.86 | |
| 438(x component) | ST_36445 | Parkfield | 2004-9-28 | 6.0 | strike-slip | 15.23 |
Table 2.
Fundamental period and static pushover information for each archetype designs.
| Structure | No. of Story | Bay Width (ft) | Period (s) | Design Base Shear (kips) | Peak Base Shear (kips) | Over-Strength |
|---|---|---|---|---|---|---|
| Str01 | 1 | 20 | 0.42 | 46.9 | 102 | 2.17 |
| Str02 | 2 | 20 | 0.62 | 65 | 127.6 | 1.96 |
| Str03 | 4 | 20 | 0.89 | 92.9 | 167.5 | 1.8 |
| Str04 | 8 | 20 | 1.76 | 92 | 129.5 | 1.41 |
Table 3.
The statistical results of each archetype under excitations of three sets of records derived by the newly proposed ground motion selection method.
Table 3.
The statistical results of each archetype under excitations of three sets of records derived by the newly proposed ground motion selection method.
| Structure | Story Number | NZS2004 | EC8 | NTC08 | |||
|---|---|---|---|---|---|---|---|
| Median | Deviation | Median | Deviation | Median | Deviation | ||
| Str01 | 1 | 1.40 | 0.89 | 1.92 | 0.71 | 1.62 | 0.83 |
| Str02 | 1 | 1.27 | 0.71 | 1.84 | 0.67 | 1.51 | 0.71 |
| 2 | 1.09 | 0.58 | 1.42 | 0.45 | 1.30 | 0.65 | |
| Str03 | 1 | 1.44 | 0.69 | 1.28 | 0.59 | 1.20 | 0.57 |
| 2 | 1.25 | 0.54 | 1.27 | 0.47 | 1.12 | 0.44 | |
| 3 | 0.74 | 0.27 | 0.95 | 0.23 | 0.83 | 0.26 | |
| 4 | 0.73 | 0.12 | 0.46 | 0.11 | 0.40 | 0.14 | |
| Str04 | 1 | 1.29 | 0.65 | 1.06 | 0.25 | 0.96 | 0.31 |
| 2 | 1.68 | 0.82 | 1.36 | 0.35 | 1.13 | 0.39 | |
| 3 | 1.82 | 0.92 | 1.46 | 0.40 | 0.96 | 0.41 | |
| 4 | 1.76 | 0.86 | 1.16 | 0.32 | 0.89 | 0.40 | |
| 5 | 1.43 | 0.72 | 1.01 | 0.32 | 0.99 | 0.28 | |
| 6 | 1.00 | 0.53 | 1.10 | 0.29 | 0.99 | 0.23 | |
| 7 | 0.69 | 0.32 | 0.84 | 0.15 | 0.71 | 0.21 | |
| 8 | 0.38 | 0.19 | 0.46 | 0.07 | 0.40 | 0.13 | |
Table 4.
The statistical results of each archetype under excitations of three sets of records derived by greedy method.
Table 4.
The statistical results of each archetype under excitations of three sets of records derived by greedy method.
| Structure | Story Number | Baker G22 | Baker G09 | Baker G20 | |||
|---|---|---|---|---|---|---|---|
| Median | Deviation | Median | Deviation | Median | Deviation | ||
| Str01 | 1 | 1.68 | 0.60 | 1.68 | 0.40 | 1.79 | 0.48 |
| Str02 | 1 | 2.08 | 0.74 | 2.13 | 0.59 | 2.08 | 0.68 |
| 2 | 1.67 | 0.67 | 1.66 | 0.56 | 1.67 | 0.62 | |
| Str03 | 1 | 1.61 | 0.99 | 2.67 | 1.09 | 2.15 | 0.99 |
| 2 | 1.85 | 0.70 | 2.09 | 0.74 | 1.87 | 0.68 | |
| 3 | 1.00 | 0.39 | 1.14 | 0.36 | 1.08 | 0.37 | |
| 4 | 0.41 | 0.12 | 0.47 | 0.11 | 0.41 | 0.11 | |
| Str04 | 1 | 1.25 | 0.43 | 1.27 | 0.49 | 1.24 | 0.45 |
| 2 | 1.47 | 0.60 | 1.41 | 0.58 | 1.44 | 0.61 | |
| 3 | 1.35 | 0.64 | 1.33 | 0.59 | 1.35 | 0.64 | |
| 4 | 1.20 | 0.58 | 1.06 | 0.61 | 1.25 | 0.58 | |
| 5 | 1.34 | 0.47 | 1.14 | 0.55 | 1.35 | 0.50 | |
| 6 | 1.21 | 0.33 | 1.12 | 0.37 | 1.18 | 0.37 | |
| 7 | 0.83 | 0.20 | 0.80 | 0.18 | 0.81 | 0.22 | |
| 8 | 0.46 | 0.10 | 0.44 | 0.11 | 0.47 | 0.09 | |
© 2018 by the authors. Licensee MDPI, Basel, Switzerland. This article is an open access article distributed under the terms and conditions of the Creative Commons Attribution (CC BY) license (http://creativecommons.org/licenses/by/4.0/).
Share and Cite
MDPI and ACS Style
Chen, Y.; Xu, L.; Zhu, X.; Liu, H. A Multi-Objective Ground Motion Selection Approach Matching the Acceleration and Displacement Response Spectra. Sustainability 2018, 10, 4659. https://doi.org/10.3390/su10124659
AMA Style
Chen Y, Xu L, Zhu X, Liu H. A Multi-Objective Ground Motion Selection Approach Matching the Acceleration and Displacement Response Spectra. Sustainability. 2018; 10(12):4659. https://doi.org/10.3390/su10124659
Chicago/Turabian StyleChen, Yabin, Longjun Xu, Xingji Zhu, and Hao Liu. 2018. "A Multi-Objective Ground Motion Selection Approach Matching the Acceleration and Displacement Response Spectra" Sustainability 10, no. 12: 4659. https://doi.org/10.3390/su10124659
Note that from the first issue of 2016, this journal uses article numbers instead of page numbers. See further details here.