Abstract
The sustainability of agriculture depends as much on the natural resources required for production as it does on the stakeholders that manage those resources. It is thus essential to understand the variables that influence the decision-making process of agricultural stakeholders to design educational programs, interventions, and policies geared towards their specific needs, a required step to enhance agricultural sustainability. This study employed a survey of multiple-choice and open-ended questions to examine the perceptions, experiences, and priorities that influence management decisions of agricultural stakeholders across Montana, United States. A total of 272 respondents completed a survey, representing five distinct agricultural stakeholder groups: 103 (34.9%) conventional producers, 78 (28.7%) consultants, 37 (13.6%) researchers, 33 (12.1%) organic grain producers, and 21 (7.7%) organic vegetable producers. The results revealed that, while stakeholder groups have distinct perceptions, experiences, and priorities, there were similarities across groups (pseudo-F = 22.92, p = 0.001). Specifically, organic vegetable and organic small-grain producers showed similar responses that were, in turn, divergent from those of conventional producers, researchers, and crop consultants. Conventional small-grain producers and researchers showed overlapping response patterns, while crop consultants formed an isolated group. Six clusters resulting from the classification of the multiple-choice response dataset associated with specific agricultural professions (χ2 = 549.72, p = 0.001). The classification of open-ended questions that assessed agronomic challenges and research needs resulted in six distinctive clusters, with specific associations between clusters and agricultural stakeholder groups (χ2 = 164.41, p = 0.001). These results reinforce the need for agricultural education and programs that address unique and shared experiences, priorities, and concerns of multiple stakeholder groups. This study endorses the call for a paradigm shift from the traditional top-down agricultural extension model to one that accounts for participants’ socio-ecological contexts to facilitate the adoption of sustainable agricultural systems that support environmental and human wellbeing.
1. Introduction
Agricultural professionals shape food, fiber, and energy production practices through a series of decision-making processes that ultimately influence the natural and human dimensions of food systems. Decisions regarding what to grow and how to manage it impact the sustainability of the agricultural enterprise, the availability and quality of agricultural products, and the ecosystems services provided by farms and ranches [1]. Agricultural professionals’ management decisions are influenced by multiple socio-ecological factors, including interactions with other producers, extension agents, agro-industry personnel, and researchers. For extension efforts to enhance agricultural sustainability, it is thus critical to understand how the perceptions, experiences, and priorities that support agro-ecosystem management decisions differ among agricultural stakeholders. Yet, in the traditional model of top-down agricultural knowledge and technology transfer, researchers, extension agents, and crop consultants design extension materials and activities centered around a limited number of challenges they presuppose to be important. This model assumes that those extension efforts inform producers of novel management strategies and technologies and it does not account for participants’ perceptions, experiences, and priorities [2]. Further, this approach to extension does not monitor emerging commonalities and differences within and across stakeholder groups and fails to consider the many interdependent components that form complex socio-agroecological systems.
Many of the environmental, social, and economic shortcomings associated with agricultural production are largely driven by human decisions and actions, as are solutions to address such problems [3]. Characterizing the variables that determine the decision-making processes of agricultural professionals is thus important for designing best management practices for sustainable and resilient food systems [1,4]. These variables are context-specific and occur at multiple scales, from individuals, to groups, to societies. When individuals come together and form groups, we can assess the salience of collective perceptions, beliefs, knowledge, and experiences within and across groups of stakeholders to understand joint actions and multiple perspectives [5,6,7]. This process is crucial for improving communication within and across groups, overcoming stakeholders’ knowledge limitations and misconceptions [8] and enhancing social learning [9,10].
Perceptions, experiences, and priorities that influence decision-making can be organized into mental models that characterize an individual’s cognitive representation of the external reality that he/she uses to interact with his/her surroundings [11]. These cognitive representations influence how individuals define problems, assess risks and benefits, and gather and process information [12], including the filtering and storage of new information [3]. An emerging body of socio-ecological systems research focuses on examining the processes that shape mental models of stakeholder groups in food systems [13,14], including determining collective mental models for the design and sustainable management of agroecosystems [15,16].
Determining agreements and discrepancies within and across agricultural stakeholder groups has the potential to highlight opportunities and constraints for research, outreach, and implementation of sustainable agriculture programs. Yet, the extent to which different agricultural stakeholders share mental models is largely unknown in numerous regions, including the Northern Great Plains region of the United States. Filling this knowledge gap is imperative for the development of sustainable agricultural extension efforts. The overall goal of this study was to evaluate how the perceptions, experiences, and priorities supporting agroecosystem management decisions differ among producers, extension agents, agro-industry crop consultants, and researchers in Montana, United States. Montana is a compelling case for conducting research on agricultural stakeholders’ perceptions, experiences, and priorities across the Norther Great Plains region of North America. Montana is home to over 27,000 farms and ranches on >2.38 × 10⁷ hectares and its diverse climate supports a range of high-quality food products including beef, small grains, hay, legume crops, potatoes, sugar beets, oilseed crops, and small fruits [17].
To our knowledge, no previous study conducted in the Northern Great Plains region examined the perceptions, experiences, and priorities that influence the management decisions of agricultural stakeholders. Specifically, this study evaluated perceptions, experiences, and priorities that influence the development of mental models and decision-making processes of five major agricultural stakeholders: conventional small-grain producers, organic small-grain producers, organic vegetable producers, crop consultants including agro-industry representatives and agricultural extension agents, and researchers. These stakeholders were selected because collectively they represent agricultural production, outreach, and research activities in Montana. To achieve our goal, we administered a survey of multiple-choice and open-ended questions to: (1) characterize the environmental, ecological, and economic contexts of agricultural enterprises, (2) identify perceptions, experiences, and priorities that drive agroecosystem management decision-making, and (3) highlight opportunities and constraints for improving extension-based activities for agricultural sustainability.
2. Materials and Methods
2.1. Survey Development and Administration
The survey utilized in this study was adapted from one developed by the Montana Organic Advisory and Education Council (OAEC), a non-profit organization composed of certified organic farmers whose mission is to assess and prioritize the needs for organic research and education (http://www.oaecmt.org). The survey consisted of 37 questions designed to evaluate experiences, perceptions, and priorities driving agroecosystem management decisions, production challenges, and opportunities for sustainable agriculture (Table S1). The Montana State University review board issued the IRB protocol, “Assessing producer’s knowledge and attitudes about natural resources” [FM01114-EX] on 21 January 2014, approving this study. Prior-informed consent was received from all respondents before administering the survey, and the survey was analyzed anonymously. Twenty-five of the questions were multiple-choice and aimed at identifying the environmental, ecological, and economic contexts of stockholders’ farming enterprises. The other twelve questions allowed for open-ended responses and assessed perceptions of agronomic challenges, factors influencing management decisions, priorities for future research, and sources of farming information.
The survey was first distributed by the OAEC to organic small-grain producers and organic vegetable producers throughout Montana in 2012 and 2013. Following the initial dissemination, the survey was administered in 2014 to a broad constituency of stakeholders of conventional and organic producers, crop consultants including agro-industry representatives and agricultural extension agents, and researchers. To do this, the survey was disseminated through Montana State University Extension Service efforts during nine different field days and meetings across the state as well as by personal communications. To increase participation, the survey was available both in paper and online, depending on the respondents’ preferences. Although the respondents do not represent a truly random sample, it is expected that coverage and non-response errors were reduced through the multi-modal nature of the survey and the extensive network reached through stakeholder organizations and the Montana State University’s Extension Service [18]. A similar approach was recently successfully used to evaluate agricultural stakeholder perceptions and observations of climate change in the Northern Great Plains [19].
2.2. Open-Ended Response Coding
Following reference [13], open-ended responses were coded into a series of domains (i.e., major thematic categories) and subdomains (i.e., specific issues within a given domain) by identifying emerging themes for a particular set of responses (Table S2). To minimize subjectivity, domains and subdomains were developed by two researchers jointly, and the responses to seven of the twelve open-ended questions were evaluated together by these researchers. The responses to the remaining five open-ended questions were coded by either one of these two researchers, independently. For these five independently coded questions, the other researcher re-coded a random subset of 20% of respondents to test for inter-coder reliability, calculated as percent agreement:
where R is the percent correspondence between the re-coder and the original coder for a specific question, Dk is the number of respondents whose answers were coded with domain k by either the re-coder or the original coder, and Mk is the number of mismatches between the re-coder and the original coder for domain k [20]. The same formula was used to calculate inter-coder reliability for subdomains. Following reference [13], if either domain or subdomain inter-coder reliability was below 2/3 (67%) correspondence, the question was jointly re-coded in its entirety by the two researchers. Finally, to further reduce subjectivity and to validate inter-coder reliability [20], three other researchers re-coded a random subset of 20% of respondents. For this new set of codes, inter-coder reliability was calculated as described above. Inter-coder reliability for each open-ended question is reported in Table S2.
2.3. Data Processing and Analysis
All responses in the multiple-choice dataset with categorical nominal answers were converted into a set of binary dummy variables. The responses to questions with categorical ordinal answers in the multiple-choice dataset were given a numeric rank score. For the open-ended data, all domain and subdomain codes for each response were also converted into a series of binary dummy variables. These dummy variables were grouped into three distinct subsets: one for multiple-choice questions, one for response domains to open-ended questions, and one for response subdomains to open-ended questions. For each of these subsets, a dissimilarity matrix using the Bray–Curtis dissimilarity index was constructed as:
where BC(j,k) is the Bray–Curtis dissimilarity between respondents j and k, a(i,j) is the response value of respondent j to question i, a(i,k) is the response value of respondent k to question i, and R is the total number of questions in the subset [21].
To investigate differences in the environmental, ecological, and economic contexts of agronomic enterprises among the five agricultural stakeholder groups, a non-metric multidimensional scaling (NMDS) ordination for the multiple-choice dataset was performed. Initial positions in ordination space were determined by principal coordinates analysis of the dissimilarity matrix. Statistical significance of the separation among agricultural professions was determined using Permutational Multivariate Analysis of Variance (PERMANOVA) with 999 iterations [22]. Emerging associations among respondents in their answers were then investigated by performing cluster analyses using a flexible-β hierarchical agglomerative clustering algorithm parameterized with α1 = α2 = 0.625, β = −0.25, and γ = 0, following reference [23]. For each classification dendrogram, clusters were separated at constant dissimilarity. Correspondence between the responses of the agricultural stakeholder groups and the clusters derived from each classification was tested using a χ2 analysis. Because of concerns of low expected values, p-values were obtained using a Monte Carlo simulation with 999 iterations. This Monte Carlo simulation was also used for pairwise comparisons between the agricultural professions and the classification clusters. For this analysis, χ2 for each pairwise comparison was calculated as:
where χ2(i,j) is the test statistic for the comparison between agricultural stakeholder group i and cluster j, O(i,j) is the observed number of respondents that were simultaneously identified as agricultural stakeholder groups i and classified into cluster j, and E(i,j) is the expected number of respondents for that pairing. As explained above, because of concerns of low expected values, p-values were obtained using a Monte Carlo simulation with 999 iterations. The p-values for these pairwise comparisons were calculated as:
where P(i,j) is the p-value for the comparison between agricultural stakeholder groups i and cluster j, R(i,j) is the number of times χ2(i,j) obtained from a Monte Carlo iteration exceeded χ2(i,j) from the observed data, and B is the number of iterations in the Monte Carlo simulation. Our post-hoc analyses were adapted from reference [24].
To identify specific concerns of each one of the five agricultural stakeholder groups and the proposed clusters, the five most indicative responses for each cluster group were identified by adapting indicator species analysis, a method used in community ecology [25]. In our study, the indicator value of a stakeholder group is the product of the fidelity and exclusivity of that group to a cluster, given by:
where INDVAL(i,j) is the indicator value of stakeholder group i for cluster j, F(i,j) is the fidelity of stakeholder group i to cluster j, and E(i,j) is the exclusivity of stakeholder group i to cluster type j. Fidelity is the propensity for a stakeholder group to occur in a given cluster and is calculated as:
where F(i,j) is the fidelity of stakeholder group i to cluster type j, C(i,j) is the number of observations in which stakeholder group i occurs in cluster j, and C(.,j) is the total number of observations in cluster j. Exclusivity is the propensity for a stakeholder group to occur only in observations of a specific cluster and is calculated as:
where E(i,j) is the exclusiveness of stakeholder group i to cluster j, N(i,j) is the mean abundance of stakeholder group i in observations of cluster j, and N(i,.) is the sum of mean abundances of stakeholder group i in each classification cluster. Probabilities for the indicator values were obtained from a Monte Carlo simulation with 999 iterations.
All data processing and analyses were conducted in R statistical software version 3.0.2 [26]. Batch data processing and compilation were performed using the labdsv [27], plyr [28], and reshape [29] packages of R. Multivariate analyses and indicator species analysis were performed using the labdsv [27], optpart [30], and cluster [31] packages. Three-dimensional graphics were created in the rgl [32] package.
3. Results
A total of 272 respondents completed the survey, representing the following agricultural stakeholder groups: 103 (34.9%) conventional producers, 78 (28.7%) consultants, 37 (13.6%) researchers, 33 (12.1%) organic grain producers, and 21 (7.7%) organic vegetable producers. From the multiple-choice response dataset, a strong separation among agricultural stakeholders was identified (pseudo-F = 22.92; df = 4, 265; r2 = 0.26; p = 0.001; Figure 1). Specifically, it was possible to observe a distinction between organic vegetable producers and organic grain producers, located mostly on the negative values of the second NMDS axis, and all other stakeholders, positioned in the positive values of that axis.
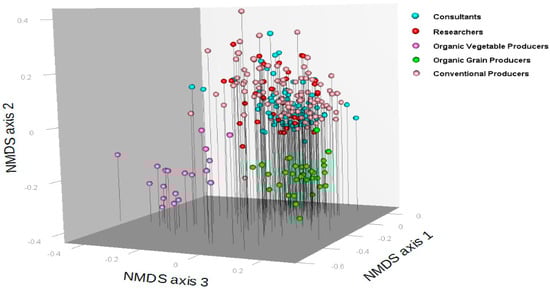
Figure 1.
Non-metric multidimensional scaling (NMDS) ordination of responses provided by agricultural stakeholders to multiple-choice questions aimed at identifying contextual information about agricultural production conditions. Agricultural stakeholders’ professions are color-coded, and respondents closer in ordination space had answers that more closely resembled each other, whereas those farther apart had more dissimilar answers.
The classification of the multiple-choice response dataset reveled six distinct clusters (χ2 = 549.72; df =20; p = 0.001; Figure 2). While both conventional producers and researchers positively associated with the first cluster (P1), consultants, organic grain growers, and organic vegetable producers negatively associated with this cluster. Conventional producers associated positively with cluster P2, and no other agricultural profession associated with this cluster. Organic vegetable producers associated positively with cluster P3, while conventional producers, researchers, and consultants were negatively associated with this cluster. Organic grain producers positively associated with cluster P4, whereas all other agricultural professions negatively associated with this cluster. Consultants positively associated with cluster P5, and both conventional and organic producers negatively associated with this cluster. Finally, cluster P6 did not associate with any specific agronomic profession.
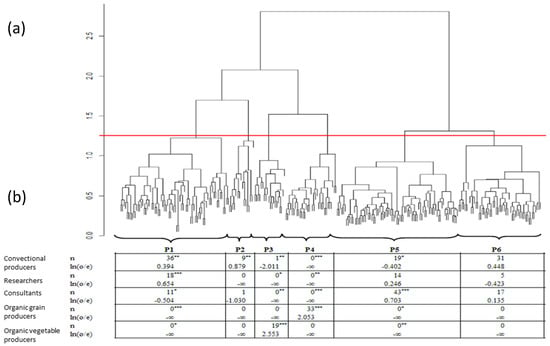
Figure 2.
(a) Dendrogram based on twenty-five multiple-choice questions aimed at identifying contextual information about agricultural production conditions. The horizontal red line delineates the proposed clusters. (b) Contingency table of cluster membership (columns) by agricultural stakeholder profession (rows), where n denotes the number of respondents with joint membership in a cluster and an agricultural stakeholder group, and ln(o/e) denotes the log likelihood ratio. Significance levels: 0.05 ≥ p ≥ 0.01 *; 0.01 > p ≥ 0.001 **; 0.001 > p ***.
The results of the indicator response analysis showed specific associations between the clusters and the multiple-choice questions utilized to identify information about the environmental, ecological, and economic contexts of agricultural operations (Table 1). No indicator responses were associated with cluster P1, suggesting heterogeneous contextual conditions associated with the researchers and conventional producers presented in this cluster. For example, researchers cited soil fertility, phytophagous insect pests, precipitation, and crop varieties as the strongest influences on crop yields. In addition, researchers operated primarily in Gallatin County, MT. By contrast, conventional producers of cluster P1 were characterized by extensive career length and operated primarily in Broadwater and Valley Counties, MT. The strongest indicators for stakeholders in P2, a cluster dominated by conventional producers, included the location of their enterprise, difficulty in managing houndstongue (Cynoglossum officinale L.), musk thistle (Carduus nutans L.), and American licorice (Glycyrrhiza lepidota (Nutt.) Pursh), and producing on rangeland. The indicator responses associated with P3, a cluster dominated by organic vegetable producers, included success growing lettuce (Lactuca sativa L.), tomato (Solanum lycopersicum L.), alliums (Amaryllidaceae: Allioidae), and brassicas (Brassicaceae). Additionally, respondents in P3 expressed concern that phytophagous insects had a major impact on brassicas. The top indicator responses for cluster P4, a cluster dominated by organic grain producers, included success growing spring wheat (Triticum aestivum L.), impacts of weeds on flax (Linum usitatissimum L.) and forage crops, difficulty marketing flax, and difficulty managing kochia (Bassia scoparia (L.) A.J. Scott). Specific indicators of cluster P5, a group positively associated with consultants, included diseases impacting chickpea (Cicer arietinum L.), lentil (Lens culinaris Medik.), and oilseed production, as well as weeds and insect pests impacting chickpea production. Finally, the indicative responses for cluster P6 included difficulty marketing winter wheat and barley (Hordeum vulgare L.), success growing barley, and difficulty managing downy brome (Bromus tectorum L.) and wheat stem sawflies (Hymenoptera: Symphyta), but no stakeholder group associated with this cluster.

Table 1.
Indicative responses for (top) clusters and (bottom) agricultural stakeholders for twenty-five predetermined responses aimed at identifying contextual information about farming condition. P1 to P6 refers to the cluster groups of Figure 2. CG: conventional grower. OGG: organic grain growers. OVG: organic vegetable grower. CON: crop consultant. RES: researcher.
The classification of open-ended domains used to assess agronomic challenges and research needs resulted in six distinctive clusters (Figure 3), with specific associations between clusters and agricultural stakeholder groups (χ2 = 164.41; df = 20; p = 0.001). Consultants associated positively with cluster D1, while researchers, organic grain producers, and organic vegetable producers were negatively associated with this cluster. Organic grain producers and organic vegetable producers associated positively with cluster D2, while consultants and conventional producers associated negatively with that cluster. Cluster D3 had a marginally positive association with researchers and a marginally negative association with organic vegetable producers. Conventional producers were positively associated with cluster D4, while consultants and organic grain growers were negatively associated with that cluster. Finally, no associations between any stakeholder groups and cluster D5 were found, and researchers were the only stakeholder group that associated positively with cluster D6.
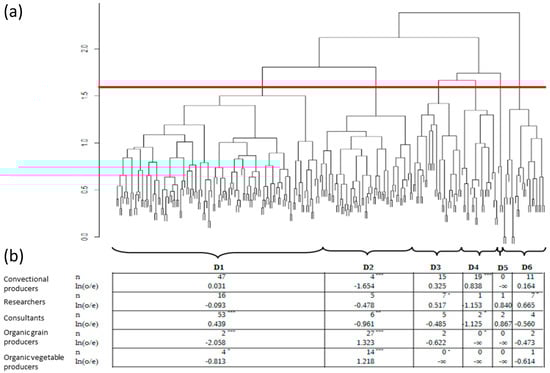
Figure 3.
(a) Dendrogram of domains with recurrent themes from open-ended questions aimed at assessing agricultural stakeholder perceptions of agronomic challenges. The horizontal red line delineates the proposed clusters. (b) Contingency table of cluster membership (columns) by agricultural stakeholder profession (rows), where n denotes the number of respondents with joint membership in a cluster and an agricultural profession, and ln(o/e) denotes the log likelihood ratio of each joint membership. Statistical significance levels: 0.05 ≥ p ≥ 0.01 *; 0.01 > p ≥ 0.001 **; 0.001 > p ***.
Indicator response analysis for the open-ended response domains (Table 2) showed that the strongest indicators for cluster D1, a cluster positively associated with consultants, were obtaining information from extension/university outlets and personal communication, fertilizer use, and conducting on-farm research. The strongest indicator domains of D2, a cluster dominated by organic grain and organic vegetable producers, were the need to conduct research on agronomic, insect pest, and weed management issues. The strongest indicator domains for organic grain producers included the length of no-till practices, the need of conducting research on specific weed species, agroecological factors challenging production, the need to conduct research on environmental factors, and choosing crop rotations based on economic factors. The strongest indicator domains for organic vegetable producers were fertilizer use, choosing crop rotations based on specific agronomic management practices, citing agronomic and social factors as the most needed research, and mentioning environmental factors as their greatest production challenge. No significant indicator domains were observed for D3, a cluster that showed a marginal positive association with researchers, suggesting divergent interests within this stakeholder group. Among the varied interest researchers cited were conducting on-farm research, managing pests and beneficial insects, including ecological factors in weed research, and conducting marketing research. The only indicator domain for cluster D4, a group positively associated with conventional producers, was gaining experience with no-till practices. Also, the only indicator domain of respondents in cluster D5, a cluster not associated with any specific stakeholder group, was citing environmental factors and agronomic management as the greatest agronomic challenge. Finally, the indicator domain for cluster D6, a cluster positively associated with researchers, was citing agroecological factors as the greatest agronomic challenge.
Table 2.
Indicator responses for (top) clusters and (bottom) agricultural stakeholders for open-ended response domain data from the 2014 Montana State University Agricultural Professional Survey. D1 to D6 refer to the cluster group of Figure 3. CG: conventional grower. OGG: organic grain grower. OVG: organic vegetable grower. CON: crop consultant. RES: researcher.
Six distinct clusters were obtained from the classification of the open-ended subdomain data, suggesting differences in the concerns among the agricultural stakeholder groups (χ2 = 144.83; df = 20; p = 0.001; Figure 4). While consultants associated positively with cluster S1, organic grain producers and organic vegetable producers were negatively associated with this cluster. Organic vegetable producers associated positively with cluster S2, but consultants negatively associated with this cluster. Consultants positively associated with cluster S3, while both organic grain and organic vegetable producers were negatively associated with S3. Organic grain producers associated positively with cluster S4, while conventional producers, researchers, and consultants were negatively associated with this cluster. Organic grain producers positively associated with cluster S5. Finally, no associations were found between any stakeholder group and cluster S6.
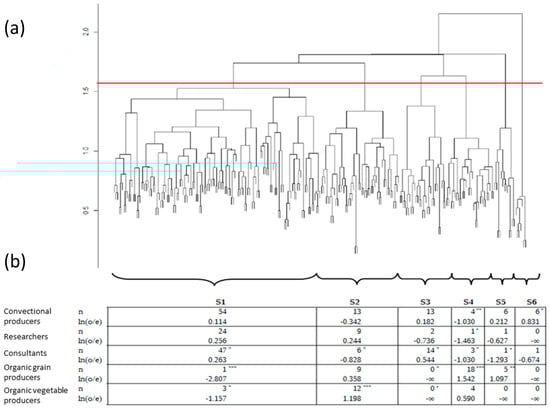
Figure 4.
(a) Dendrogram of open-ended response subdomains aimed at assessing agricultural stakeholder perceptions of agronomic challenges. The horizontal red line delineates the proposed clusters. (b) Contingency table of cluster membership (columns) by agricultural stakeholder profession (row), where n denotes the number of respondents with joint membership in a cluster and an agricultural profession, and ln(o/e) denotes the log likelihood ratio of each joint membership. Statistical significance levels: 0.05 ≥ p ≥ 0.01 *; 0.01 > p ≥ 0.001 **; 0.001 > p ***.
Indicator subdomains for consultants, the only stakeholder group positively associated with S1, included having experience with no-till practices, adding fertilizer on the basis of soil test results, obtaining farming information from field demonstrations, internet resources, and training workshops (Table 3). The strongest indicator subdomains for organic vegetable producers, the only stakeholder group that associated positively with S2, were fertilizer use, improving crop rotation based on nutrient biogeochemistry, citing education as the most needed marketing research, and conducting research on perennial weed management. The most indicative subdomains for cluster S3 included conducting research of new revenue streams and markets, as well as integrated weed management. Indicator subdomains for organic grain producers, the only stakeholder group positively associated with either cluster S4 or cluster S5, included lacking experience with no-till practices and citing management of perennial and dicotyledonous weeds as the most needed weed research. The strongest indicator subdomains for respondents in cluster S6 were obtaining farming information from university faculty, assessing weed community responses to management practices, use of GPS mapping technology, use of foliar-applied fungicides, and investigations into crop nutritive value as the most needed marketing research. While no significant association between any stakeholder groups and cluster S6 was found, conventional producers comprised the majority of this cluster. Also, although researchers did not associate positively with any cluster from the subdomain classification, indicator subdomains for this group included obtaining farming information from peer-reviewed journals, neighbors, and colleagues, citing nitrogen cycling and biogeochemistry as the most needed soil fertility research, conducting on-farm research on crop varieties, and providing fertilizer recommendations based on leaching and volatilization potential.
Table 3.
Indicator responses for (top) clusters and (bottom) agricultural stakeholders for open-ended response subdomain data from the 2014 Montana State University Agricultural Professional Survey. S1 to S6 refer to the cluster group of Figure 4. CG: conventional grower. OGG: organic grain grower. OVG: organic vegetable grower. CON: crop consultant. RES: researcher.
4. Discussion
The design and management of sustainable agroecosystems requires shifting from an industrial agriculture paradigm focused on yield, returns, and efficiency maximization to one that aims at jointly enhancing the environmental, social, and economic dimensions of the food system [33,34,35]. In this process, assessing the perceptions, experiences, and priorities underpinning agricultural professionals’ decisions is critical to develop alternative extension programs that will facilitate the adoption of sustainable agricultural practices [36]. Nevertheless, Land Grant Universities and the industrial sector traditionally use a top-down extension approach to disseminate technological information developed in laboratories and research stations in a process that treats research results as universally applicable information [37]. This approach does not account for the unique environmental, ecological, and economic context of individual agricultural enterprises, making it inadequate for solving complex socio-ecological issues of sustainable food, fiber, and bioenergy production [38].
The development of alternative extension programs requires an interdisciplinary perspective that combines bio-physical science and social science, recognizes that there is as much diversity in the human dimension of management as in the biological and natural resources being managed [39], and finds a common ground of understanding between agricultural producers, educators, agro-ecologists, and social scientists [40,41]. Prior experiences, values, beliefs, and perceptions that underpin the mental models of agricultural stakeholders guide their actions, decisions, and use of information [42]. Researchers and agricultural educators can, in turn, draw from this information to better tailor their efforts to producers’ environmental, ecological, and economic contexts, goals, and available technology [36]. Such approach would enable effective extension efforts that link knowledge and action, a central tenet in sustainability [43].
Previous research has demonstrated variation in the mental models and decision-making processes within specific groups of agricultural stakeholders including agroforestry practitioners [15,44], vineyard growers [16], and organic farmers [13,14]. Yet, the extent to which mental models vary across stakeholder groups is largely unknown, but see reference [45] for “experts” versus farmers comparison. The results of this study indicate similarities and differences across agricultural stakeholder groups, suggesting that sustainable agricultural education programs should address the context specificity of management systems, including the crops being produced, cropping systems utilized, environmental conditions, and socio-economic constraints of the agricultural operations. For example, organic vegetable and organic grain producers in this study showed particularly divergent perceptions, experiences, and priorities when compared with conventional producers, researchers, and crop consultants. At the same time, conventional producers and researchers showed similarities, as indicated by their joint association in the ordination and cluster analysis, suggesting agreement between these groups. However, researchers did not show strong agreement with each other in their open-ended responses, highlighting the varied perspectives and priorities of this group of stakeholders. Finally, crop consultants formed an isolated group with divergent priorities and perspectives from those of all other agricultural stakeholders. The divergence of priorities, needs, and perspectives of crop consultants from those of other agricultural stakeholders is concerning because this group includes Cooperative Extension agents from Land Grant Universities who have the task of supporting producers’ interests [46].
Our results have direct applications to Montana in particular, and the Northern Great Plains region in general, and the results should be extrapolated outside the studied area with caution. Yet, and in agreement with studies conducted in other regions [2], the results indicate that extension programs tailored to the needs of organic producers should specifically consider these divergent needs, issues that are not usually addressed in traditional education programs. Further, the approach utilized in this study could be complemented with the development of indicator indices of sustainability, an approach used across different countries [47].
The findings of this study highlight the importance of addressing methods of information dissemination for specific agricultural stakeholders in order to design more effective outreach programs that support sustainability objectives. For example, researchers obtained information from the scientific literature, consultants took advantage of colleagues, neighbors, field demonstrations, internet resources, and workshops. By contrast, conventional producers obtained information primarily from periodicals. Previous studies conducted in Europe and the North East region of the United States have also suggested that producers do not place as much importance on gathering information from scientific research compared with their own experiences [43,45,48]. As such, future research and outreach efforts aimed at promoting sustainable agro-ecosystem management decisions should incorporate producers’ experiences and priorities and consider alternative approaches to disseminate information. This can be accomplished by including producers on research and extension teams, incorporating citizen science in research efforts, and developing Producer Community Advisory Boards to guide research and outreach [37].
This study was not designed to formally test for communication gaps across stakeholder groups, and we cannot pinpoint the reason for the observed discrepancies in perceptions, experience, and priorities. Nonetheless, our results underscore the importance of improved communication to avoid conflicting efforts between the producers and the researchers, educators, and consultants that support their work [49]. Indeed, the lack of a system in which agricultural professionals exchange information and experiences with researchers and consultants has been cited across agroecosystems and regions of the world as a barrier hindering the adoption of ecologically based farming practices [2,5,50]. Furthermore, evaluations of social networks indicate that information exchange helps generate shared understanding of challenges, constraints, and opportunities, a required step for conversing about complex information [38] and an approach not commonly used in the current models of agricultural outreach and education [51]. Bringing this approach to fruition may require agricultural stakeholders to challenge their assumptions [52] and engage in a collaborative dialogue to share contrasting perceptions, experiences, and priorities. This process can highlight areas of disagreement or conflict that extension efforts can target, such as non-target effects of pesticide applications on organic farms or increased propagule pressure on conventionally managed farms adjacent to organically managed fields.
5. Conclusions
This study highlights the need for developing agricultural innovation systems, an approach that embraces the importance of the totality of and interaction among all actors involved when addressing the complex agricultural challenges and transforming old extension paradigms [53]. Core elements of agricultural innovation systems include understanding the roles, attitudes, and practices of key stakeholders in the food system, characterizing patterns of stakeholder interactions, and assessing how receptive the socio-ecological system is for the proposed innovation [54]. Neglecting to involve the network of agricultural stakeholders in designing and implementing sustainable production systems may impede the adoption of sustainable agricultural practices, particularly in a rapidly changing world. As a result, many countries are shifting their agricultural innovation models from one focused on agricultural research to a network approach that includes researchers, farmers, entrepreneurs, and other organizations in the creation, dissemination, adaptation, and use of knowledge and resources for agricultural innovation [55]. Individuals’ internal cognitive representations that support agroecosystem management decisions are not static and vary on the basis of numerous and changing experiences, including their participation in sustainable education programs [56]. For example, Cranton [57] demonstrated how agricultural producers changed their mental models as a result of transformative events that called to question their own values, beliefs, knowledge, and skills. Future studies should thus examine how different agricultural stakeholder groups modify their agricultural perceptions, experiences, and priorities as a result of specific educational and extension programming.
Supplementary Materials
Supplementary Materials: The following are available online at http://www.mdpi.com/2071-1050/10/11/4096/s1.
Author Contributions
Conception and design of the project: F.M., J.M., M.B., S.A. Collection of data: H.P., S.M., FM. Analysis and interpretation of data: S.M., H.P., F.M., S.A., J.M., M.B. Drafting the article: S.M., S.A., F.M., H.P. Critical revision for important intellectual content: F.M., S.A., S.M., J.M., M.B. Approval of the final draft: F.M., S.A., S.M., J.M., M.B., H.P.
Funding
Support for this research was provided by the Montana Western Sustainable Agriculture Research, NSF RII Track-2 FEC OIA 1632810, and Education Professional Development Program and the NIFA—Organic Research and Education Initiative grant number 2012-51300-20004 and NIFA—ORG grant number 2015-51106-23970.
Acknowledgments
We thank the agricultural producers, consultants, and researchers that participated in this project. Randa Jabbour helped us develop the domain and subdomain categories used in this study. Perry Miller, Zachariah Miller, and Colter Ellis provided valuable insights on the agricultural and social analysis and implications of our research. Special thanks to the Montana OEAC for sharing with us the results of the initial survey they conducted. We are grateful to Alicia Leitch for her support in inputting survey data for this study.
Conflicts of Interest
The authors declare no conflict of interest.
References
- Ahmed, S.; Stepp, J.R.; Orians, C.; Griffin, T.; Matyas, C.; Robbat, A.; Cash, S.; Xue, D.; Long, C.; Unachukwu, U.; et al. Effects of extreme climate events on tea (Camellia sinensis) functional quality validate indigenous farmer knowledge and sensory preferences in tropical China. PLoS ONE 2014, 9, e109126. [Google Scholar] [CrossRef] [PubMed]
- Menalled, F.D.; Landis, D.A.; Dyer, L. Research and extension supporting ecologically based IPM systems. J. Crop Improv. 2004, 11, 153–174. [Google Scholar] [CrossRef]
- Jones, N.; Ross, H.; Lynam, T.; Perez, P.; Leitch, A. Mental models: An interdisciplinary synthesis of theory and methods. Ecol. Soc. 2011, 16, 46. [Google Scholar] [CrossRef]
- McKey, D.; Cavagnaro, T.R.; Cliff, J.; Gleadow, R. Chemical ecology in coupled human and natural systems: People, manioc, multitrophic interactions and global change. Chemoecology 2010, 20, 109–133. [Google Scholar] [CrossRef]
- Langan-Fox, J.; Wirth, A.; Code, S.; Langfield-Smith, K.; Wirth, A. Analyzing shared and team mental models. Int. J. Ind. Ergon. 2001, 28, 99–112. [Google Scholar] [CrossRef]
- Abel, N.; Ross, H.; Walker, P. Mental models in rangeland research, communication and management. Rangel. J. 1998, 20, 77–91. [Google Scholar] [CrossRef]
- Ozesmi, U.; Ozesmi, S.L. Ecological models based on people’s knowledge: A multi-step fuzzy cognition mapping approach. Ecol. Model. 2004, 176, 43–64. [Google Scholar] [CrossRef]
- Morgan, M.G.; Fischhoff, B.; Bostrom, A.; Atman, C. Risk Communication: A Mental Models Approach; Cambridge University Press: Cambridge, New York, NY, USA, 2002. [Google Scholar]
- Pilewort, C.; Hare, M. Processes of social learning in integrated water management. J. Community Appl. Soc. Psychol. 2004, 14, 193–206. [Google Scholar]
- Kolkman, M.J.; Kok, M.; van der Veen, A. Mental model mapping as a new tool to analyse the use of information in decision-making in integrated water management. Phys. Chem. Earth 2005, 30, 317–332. [Google Scholar] [CrossRef]
- Johnson-Laird, P.N. Mental Models: Towards a Cognitive Science of Language, Inference, and Consciousness; Cambridge University Press: Cambridge, New York, NY, USA, 1983. [Google Scholar]
- Wilson, J.R.; Rutherford, A. Mental models: Theory and application in human factors. Hum. Factors 1989, 31, 617–634. [Google Scholar] [CrossRef]
- Jabbour, R.; Gallandt, E.R.; Zwickle, S.; Wilson, R.S.; Doohan, D. Organic farmer knowledge and perceptions are associated with on-farm weed seedbank densities in northern New England. Weed Sci. 2014, 62, 338–349. [Google Scholar] [CrossRef]
- Dedecker, J.J.; Masiunas, J.B.; Davis, A.S.; Courtney, G. Weed management practice selection among Midest U.S. organic growers. Weed Sci. 2014, 62, 520–531. [Google Scholar] [CrossRef]
- Banes, J.; Herbohn, J.; Russel, I. The influence of farmers’ mental models on an agroforestry extension program in the Philippines. Small-Scale For. 2010, 10, 377–387. [Google Scholar] [CrossRef]
- Hoffman, M.; Lubell, M.; Hillis, V. Linking knowledge and action through mental models of sustainable agriculture. Proc. Nat. Acad. Sci. USA 2014, 111, 13016–13021. [Google Scholar] [CrossRef] [PubMed]
- National Agriculture Statistic Service. Montana Office of USDA’s NASS. 2015. Available online: http://www.nass.usda.gov/Statistics_by_State/Montana (accessed on 28 September 2018).
- Roberts, C. Mixing Modes of Data Collection in Surveys: A Methodological Review. ESRC National Centre for Research Methods NCRM Methods Review Papers NCRM/008. 2007. Available online: http://eprints.ncrm.ac.uk/418/1/MethodsReviewPaperNCRM-008.pdf (accessed on 28 September 2018).
- Grimberg, B.I.; Ahmed, S.; Elis, C.; Miller, Z.; Menalled, F. Climate Change Perceptions and Observations of Agricultural Stakeholders in the Northern Great Plains. Sustainability 2018, 10, 1687. [Google Scholar] [CrossRef]
- Neuendorf, K. The Content Analysis Guidebook; Sage Publication: Thousand Oaks, CA, USA, 2002. [Google Scholar]
- Bray, R.J.; Curtis, J.T. An ordination of the upland forest communities of southern Wisconsin. Ecol. Monogr. 1957, 27, 325–349. [Google Scholar] [CrossRef]
- Anderson, M.J. PERMANOVA. Permutational Multivariate Analysis of Variance. A Computer Program. Department of Statistics, University of Auckland: New Zealand, 2005. Available online: http://img2.timg.co.il/forums/1_124959686.pdf (accessed on 28 September 2018).
- Lance, G.N.; Williams, W.T. A general theory of classificatory sorting strategies. Comput. J. 1967, 9, 373–380. [Google Scholar] [CrossRef]
- Jin, M.; Wang, B. Implementing Multiple Comparisons on Pearson Chi-Square Test for an R×C Contingency Table in SAS®; SAS Global Forum; Statistical Analysis Software: Washington, DC, USA, 2014; Available online: http://support.sas.com/resources/papers/proceedings14/1544-2014.pdf (accessed on 28 September 2018).
- Dufrene, M.; Legendre, P. Species assemblages and indicator species: The need for a flexible asymmetrical approach. Ecol. Monogr. 1997, 67, 345–366. [Google Scholar] [CrossRef]
- R Development Core Team. R: A Language and Environment for Statistical Computing; R Foundation for Statistical Computing: Vienna, Austria, 2013; Available online: http://www.R-project.org (accessed on 28 September 2018).
- Roberts, D.W. Labdsv. Ordination and Multivariate Analysis for Ecology. R Package Version 1. 2007. Available online: http://cran.r-project.org/web/packages/labdsv/labdsv.pdf (accessed on 28 September 2018).
- Wickham, H. The split-apply-combine strategy for data analysis. J. Stat. Softw. 2011, 40, 1–29. [Google Scholar] [CrossRef]
- Wickham, H. Reshaping data with the reshape package. J. Stat. Softw. 2007, 21, 1–20. [Google Scholar] [CrossRef]
- Roberts, D.W. Optpart: Optimal Partitioning of Similarity Relations. R Package Version: 2.0-1. 2010. Available online: http://cran.r-project.org/web/packages/optpart/optpart.pdf (accessed on 28 September 2018).
- Maechler, M.; Rousseeuw, P.; Struyf, A.; Hubert, M.; Hornik, K. Cluster: Cluster Analysis Basics and Extensions. R Package Version 2.0.1. 2012. Available online: http://cran.r-project.org/web/packages/cluster/ (accessed on 28 September 2018).
- Adler, D.; Murdoch, D. Rgl: 3D Visualization Device System (OpenGL). R Package Version 0.75. 2007. Available online: http://CRAN.R-project.org/package=rgl (accessed on 28 September 2018).
- Prost, L.; Berthet, E.T.; Cerf, M.; Jeuffroy, M.-H.; Labatut, J.; Meynard, J.M. Innovative design for agriculture in the move towards sustainability: Scientific challenges. Res. Eng. Des. 2017, 28, 119–129. [Google Scholar] [CrossRef]
- Ahmed, S.; Stepp, J.R. Beyond yields: Climate effects on specialty crop quality and agroecological management. Elem. Sci. Anthr. 2016, 4, 92. [Google Scholar] [CrossRef]
- Toma, P.; Massari, S.; Miglietta, P.P. Natural resource use efficiency and economic productivity. In Life Cycle Approaches to Sustainable Regional Development; Massari, S., Sonnemann, G., Balkau, F., Eds.; Routledge: New York, NY, USA, 2016; pp. 143–148. ISBN 9781138940604. [Google Scholar]
- Menalled, F.D.; Grimberg, B.; Jones, C. Evaluation of agricultural professionals’ perceptions and knowledge on sustainable agriculture: A useful step in the development of an on-line extension program. J. Agric. Educ. 2009, 50, 86–97. [Google Scholar] [CrossRef]
- Warner, K.D. Agroecology in Action: Extending Alternative Agriculture through Social Networks (Food, Health, and the Environment); The MIT Press: Cambridge, MA, USA, 2007; 291p, ISBN 0262731800. [Google Scholar]
- Wood, B.; Blair, H.; Gray, D.; Kemp, P.; Kenyon, P.R.; Morris, S.T.; Sewell, A.M. Agricultural science in the wild: A social network analysis of farmer knowledge exchange. PLoS ONE 2014, 9, e105203. [Google Scholar] [CrossRef] [PubMed]
- Nowak, P.J.; Cabot, P.E. Human dimension of resource management programs. J. Soil Water Conserv. 2004, 59, 128A–135A. [Google Scholar]
- Viseu, A. Integration of social science into research is crucial. Nature 2015, 525, 291. [Google Scholar] [CrossRef] [PubMed]
- Brown, R.R.; Deletic, A.; Wong, T.H.F. Interdisciplinarity: How to catalyze collaboration. Nature 2015, 525, 315–317. [Google Scholar] [CrossRef] [PubMed]
- Eckert, E.; Bell, A.A. Invisible force: Farmers’ mental models and how they influence learning and actions. J. Ext. 2005, 43, 3FEA2. [Google Scholar]
- Turner, R.J.; Davies, G.; Moore, H.; Grundy, A.C.; Mead, A. Organic weed management: A review of the current UK farmer perspective. Crop Prot. 2007, 26, 377–382. [Google Scholar] [CrossRef]
- Jiang, X.; Wang, X. Application of optimal harvesting decision model to the analysis of Chinese forestry economic policy. Chin. J. Popul. Res. Environ. 2013, 11, 333–344. [Google Scholar] [CrossRef]
- Jabbour, R.; Zwickle, S.; Gallandt, E.; McPhee, K.; Wilson, R.; Doohan, D. Mental models of organic weed management: Comparison of New England US farmer and expert models. Renew. Agric. Food Syst. 2013, 29, 319–333. [Google Scholar] [CrossRef]
- Gornish, E.S.; Roche, L.M. Cooperative Extension is key to unlocking public engagement with science. Front. Ecol. Environ. 2017, 15, 487–488. [Google Scholar] [CrossRef]
- De Leo, F.; Miglietta, P.P. The contribution of environmental indicators to the sustainable performance of countries. Int. J. Sustain. Policy Pract. 2015, 11, 12–26. [Google Scholar] [CrossRef]
- Macé, K.; Morlon, P.; Munier-Jolain, N.; Quéré, L. Time scales as a factor in decision-making by French farmers on weed management in annual crops. Agric. Syst. 2007, 93, 115–142. [Google Scholar] [CrossRef]
- Freitas, M.R.; Matias, S.V.B.G.; Macedo, R.L.G.; Venturin, N. Socio-ecological insights into the development of agrarian professionals. Chin. J. Popul. Res. Environ. 2013, 11, 352–356. [Google Scholar] [CrossRef]
- National Research Council. Alternative Agriculture; The National Academies Press: Washington, DC, USA, 1989. [Google Scholar]
- De Leo, F.; Gravili, G.; Miglietta, P.P. Social media and environmental sustainability: An overview of European countries. Int. J. Bus. Manag. 2016, 11, 1–10. [Google Scholar] [CrossRef]
- Eckert, E.; Bell, A.A. Continuity and change: Themes of mental model development among small-scale farmers. J. Ext. 2006, 44, 1FEA2. [Google Scholar]
- Hickey, G.M.; Klerkx, L.; Pigford, A.E.; Hickey, G.M. Beyond agricultural innovation systems? Exploring an agricultural innovation ecosystems approach for niche design and development in sustainability transitions. Agric. Syst. 2018, 164, 116–121. [Google Scholar]
- World Bank. Enhancing Agricultural Innovation: How to Go Beyond the Strengthening of Research Systems. The International Bank for Reconstruction and Development/The World Bank, 2006. Available online: http://siteresources.worldbank.org/INTARD/Resources/Enhancing_Ag_Innovation.pdf (accessed on 28 September 2018).
- Klerkx, L.; Hall, A.; Leeuwis, C. Strengthening Agricultural Innovation Capacity: Are innovation brokers the answer? Int. J. Agric. Res. Gov. Ecol. 2009, 8, 409–438. [Google Scholar] [CrossRef]
- Arnes, E.; Diaz-Ambrona, C.G.H.; Marin-Gonzalez, O.; Astier, M. Farmer Field Schools (FFSs): A tool empowering sustainability and food security in peasant farming systems in the Nicaraguan Highlands. Sustainability 2018, 10, 3020. [Google Scholar] [CrossRef]
- Cranton, P. Teaching for transformation. In Contemporary Viewpoints on Teaching Adults Effectively: No. 93. New Directions for Adult and Continuing Education; Imel, S., Ross-Gordon, J.M., Eds.; Jossey-Bass: San Francisco, CA, USA, 2002; pp. 63–72. [Google Scholar]
© 2018 by the authors. Licensee MDPI, Basel, Switzerland. This article is an open access article distributed under the terms and conditions of the Creative Commons Attribution (CC BY) license (http://creativecommons.org/licenses/by/4.0/).