Article

Spatio-Temporal Patterns and Impacts of Sediment Variations in Downstream of the Three Gorges Dam on the Yangtze River, China

1
Chongqing Institute of Green and Intelligent Technology, Chongqing 401122, China
2
Key Laboratory on Water Environment of Reservoir Watershed, Chinese Academy of Sciences, Chongqing 401122, China
3
Key Laboratory of Petroleum Resources of Gansu Province and Key Laboratory of Petroleum Resources Research, Institute of Geology and Geophysics, Lanzhou 730099, China
4
Graduate School “Human Development in Landscapes”, Christian-Albrechts-Universität zu Kiel, Kiel 24118, Germany
5
Key Laboratory of Mountain Hazards and Earth Surface Processes, Chinese Academy of Sciences, Chengdu 610041, China
*
Author to whom correspondence should be addressed.
Sustainability 2018, 10(11), 4093; https://doi.org/10.3390/su10114093
Submission received: 27 September 2018 / Revised: 31 October 2018 / Accepted: 1 November 2018 / Published: 8 November 2018
(This article belongs to the Special Issue Human Nature Interactions)

Abstract

:
Spanning the Yangtze River of China, the Three Gorges Dam (TGD) has received considerable concern worldwide with its potential impacts on the downstream side of the dam. This work investigated the spatio-temporal variations of suspended sediment concentration (SSC) at the downstream section of Yichang-to-Chenglingji from 2002 to 2015. A random forest model was developed to estimate SSC using MODIS ground reflectance products, and the spatio-temporal distributions of SSC were retrieved with this model to investigate the characteristics of water-silt variation. Our results revealed that, relatively, SSC before 2003 was evenly distributed in the downstream Yangtze River, while this spatial distribution pattern changed ce 2003 when the dam started storing water. Temporally, the SSC demonstrated a W-shaped curve of seasonal variation as one peak occurred in September and two troughs in March and November, and showed a significantly decreasing trend after three-stage impoundment. After official operation of the TGD in 2009, the SSC was reduced by over 40% than before 2003. Spatially, the most significant changes occurred in the upper Jingjiang section, where the SSC dropped by 45%. During all stages of impoundment, the water impoundment to 135 m in 2003 had the most significant impact on suspended sediment. The decreased SSC has led to emerging risks of bank failure, aggravated erosion of water front and aggressive down-cutting erosion along the downstream of the dam, as well as other ecological and environmental issues that require urgent attention by the government.

1. Introduction

Suspended matters in river water mainly consist of sediments. Suspended sediment concentration (SSC) affects the transmission of light through the water column, transport of pollutants and heavy metals, and production of water-column phytoplankton and other aquatic vegetation [1,2,3]. Meanwhile, suspended sediment in natural waters and their associated processes play a critical role in shaping the physical riverscape and regulating the associated ecological systems [4,5].
Since officially operated in 2009, the Three Gorges Dam (TGD) played key roles in flood control, power generation, shipping, drought resistance, and water supply [6,7]. However, the dam has also triggered considerable concerns worldwide. In accordance with the operation strategy of “storing clear water and releasing the mud,” the clear water discharged over the spillway of the dam vigorously scours the riverbeds and riverbanks [8]. This process exerts a far-reaching impact on the ecological environment along the downstream from the TGD—bank collapse, soil erosion, and sediment deposition, among others. Thus, understanding suspended sediment distributions and their long-term changes in the downstream of the TGD would be a prerequisite to explain how the suspended-sediment changes over time and space under a changing climate and increased human activity [9,10].
Traditionally, the SSC is surveyed mainly by means of sampling method and indoor analysis. Yet, such a research based approach is a time-consuming process, and can obtain only a small number of data points, which are discrete in spatio-temporal distribution [11,12]. In recent years, as the utility of satellite remote sensing has been applied in SSC estimation [13,14,15], many studies on SSC have been conducted using different remote-sensing data sources and methods and have achieved satisfactory results. For instance, Miller et al. (2004) explored the correlation between the Moderate Resolution Imaging Spectroradiometer (MODIS) single band reflectance and SSC in an aquatic environment [16]. Volpe et al. (2011) proposed an approach to estimating SSC in lagoon/estuarine waters by using the radiative transfer model [17]. Bowers et al. (2014) used measured data to establish an exponential model between the band backscattering coefficient and SSC [18]. Guillo et al. (2017) evaluated the spatio-temporal variabilities of near-surface SSC under the combined effects of tides and waves based on numerical simulations [19].
The empirical statistical model is also widely used to conduct remote-sensing monitoring of SSC in the aquatic environment [20]. The uncertainty between aquatic information and remote-sensing information is assumed in a specific functional relationship. Thus, the uncertainty can be estimated by transforming it into multiple linear functions [21]. The process typically requires samples to satisfy the specific distribution characteristics (such as normal distribution). However, for water parameters, the widely existing spatio-temporal autocorrelation fails to satisfy the assumptions. Therefore, theoretically, the hypothesis is inadequacies, resulting to low precision, poor extension performance, and narrow application of the prediction model [22,23].
Numerous studies prefer the non-parametric model with wide applicability and high reliability. Yang (2009) used an artificial neural network (ANN) model to evaluate the transport formulas of the total sediment load [24]; Ozgur (2012) developed a support vector machine (SVM) model to accurately estimate daily SSC [25]. However, difficulties also arise in using these models. Although ANN is unnecessary to assume a functional relationship between SSC and the remote-sensing parameters in advance, “overfitting” occurs, in which the prediction ability shows a nonconforming increase as the degree of fitting increases [26]. The SVM model yields an undesirable result when the default parameter is used. Its prediction effect is unideal when experience parameters are used and the calculation is considered miscellaneous [27]. Simultaneously, these models involve complex methods, and internal operating mechanisms have yet to be determined, in which the model variables are difficult to explain. These limits reduce the prediction accuracy and restrict the applications of the non-parametric models.
In addition, the spectral response of sediment-laden water is not only dependent on SSC but also closely related to the sediment properties (color, type, and particle size), mineral composition, chlorophyll, and chromophoric dissolved organic matters in water. Therefore, the number of variables involved in the SSC retrieval model is large and complex. Random Forest (RF) [28], an algorithm based on classification trees, is flexible, robust, simple, and convenient. It can be used for classification, clustering, regression, and prediction analysis, among others. In recent years, RF has been widely used in remote-sensing and forecasting [29,30]. If the model clearly provides advantages in parameter optimization, variable ordering, subsequent variable analysis, and interpretation, RF is suitable for the remote-sensing estimation of suspended solids in the downstream from the dam.
Therefore, given the advantages of RF algorithm in SSC estimation, and the increasing need of SSC data for investigating the impacts of TGD on sediment, this study was motivated to apply RF algorithm to estimating SSC and investigated the variations of SSC during impoundment periods at the downstream sections below the TGD from Yichang to Chenglingji. The main objectives of this study are (1) to examine the feasibility of estimating SSC using the RF algorithm and to construct a RF model for a TGD of the downstream Yangtze River; (2) to investigate the spatio-temporal variations of SSC during impoundment; and (3) to analyze the possible impacts of SSC change on the bank of the downstream Yangtze River.

2. Materials and Methods

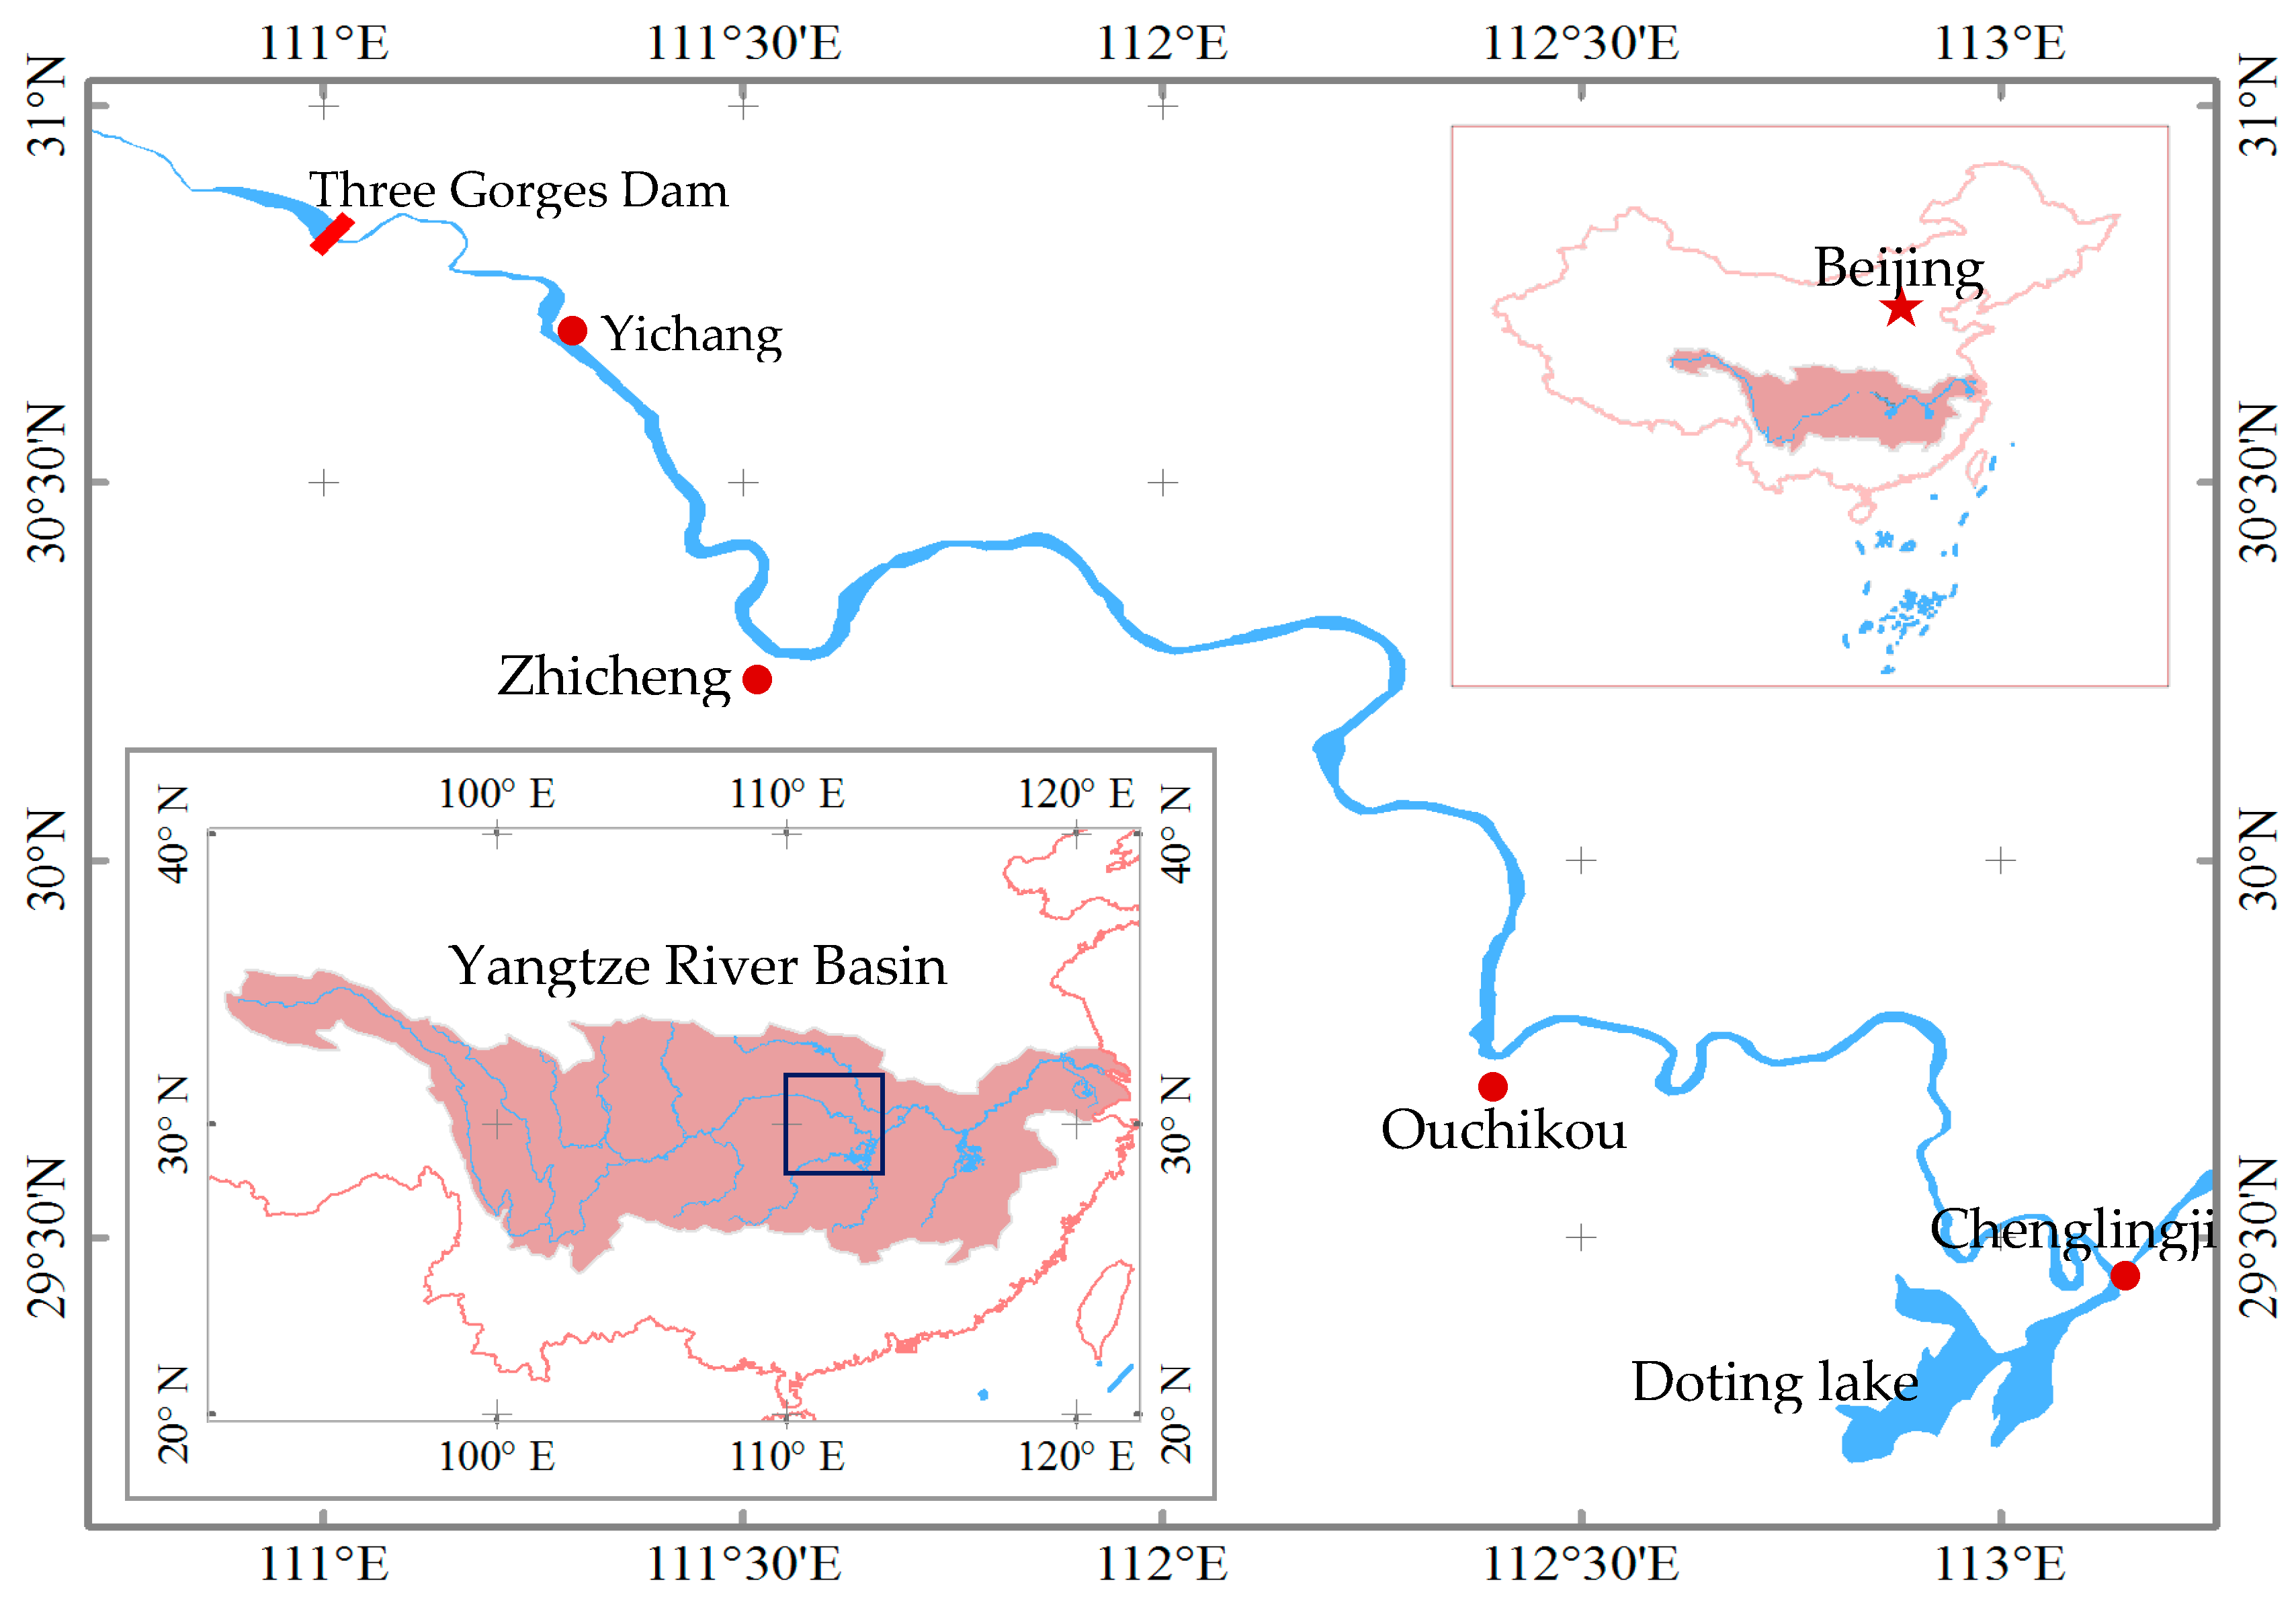
2.1. The Study Area and the Impoundment Stage of TGD

The river section from Yichang to Chenglingji in the downstream side of the TGD is located at the middle reaches of the Yangtze River, with a total length of approximately 480 km. According to the different characteristics of the river, the river section from Yichang to Chenglingji (Yi-Cheng) is divided into sub-sections of Yichang to Zhicheng (Yi-Zhi), Zhicheng to Ouchikou (upper Jingjiang), and Ouchikou to Chenglingji (lower Jingjiang) (Figure 1) [7]. The region is of high density in agricultural activities and population. Three important hydrological control stations distribute along the river in Yichang, Shashi, and Chenglingji. The geographical locations and hydrological characteristics of these stations can basically cover a typical hydrological information (e.g., runoff and sediment) over the region. Therefore, monitoring data at these stations are used as sample data for remote-sensing inversion and model validation of SSC.
The upper stream of the Yangtze River is intercepted by the TGD (2335 m long and 185 m high), which forms a 660 km long Three Gorges Reservoir (TGR) with a water surface area of 1084 km2 and a storage capacity of 39.3 billion m3 [31]. The TGD started storing water step by step from 135 m in 2003, to 156 m in 2006, and 172 m in 2008. After two years of experimental impoundment in 2008 and 2009, the TGD has been officially operated at full capacity [32]. Thus, the study period (2000–2015) is divided into five stages (before 2002; 2003–2005; 2006–2007; 2008–2009; 2010–2015) to investigate the temporal variations of SSC and the effect of the impoundment on SSC in the downstream Yangtze River.

2.2. Estimation of Suspended Sediment Concentration

The daily sediment concentration data measured at the three hydrological stations (Yichang, Shashi, and Chenglingji) were point-integrated samples collected at 0.2, 0.6, and 0.8 water depths from ten verticals in the cross-section. The water samples were treated following the national standard [33]. Statistical charts of monthly runoff and sediment discharge at the three stations from 2002 to 2015 were collected from the annual Yangtze River Sediment bulletins issued by the Changjiang Water Resources Commission. The Digitizer Module of OriginPro 9.0 [34] was used to analyze these data and calculate the monthly mean SSC (Equation (1)).
ρ = 100 m v  
where m is the monthly sediment discharge (106 t), v is the monthly runoff (108 m3), and ρ is the monthly mean SSC (mg/L).
A total of 504 SSC sample records (3 stations in 12 months during the 14 years) were collected. The data records were split into two sub-datasets: 80% of the records were selected randomly to train the RF algorithm and develop the estimation model, and the remaining 20% were used for validation and evaluations.

2.3. Remote Sensing Datasets Collection and Processing

2.3.1. Datasets Collection

The MODIS Terra ground reflectance products (MOD13Q1) from 2002 to 2015 were downloaded from the National Aeronautics and Space Administration (NASA) Earthdata website (http://reverb.echo.nasa.gov/reverb/). These products, which adopt sinusoidal projection with a spatial resolution of 250 m, are synthesized for 16 days by using the atmospheric corrected vegetation indices. It includes the ground reflectance in the blue, red, mid-infrared and near-infrared (NIR) bands [35]. For the study area, the following two tiles of the images are required: h27v05 and h27v06, where h and v denote the horizontal and vertical tile number, respectively.

2.3.2. MODIS Data Processing

The downloaded images are then processed as follows. Atmospheric correction, radiance calibration and geometric correction of MOD13Q1 have been performed by NASA before delivery to the user. The MOD13Q1 datasets provided in Hierarchical Data Format (HDF) were imported to the GeoTIFF format by the MODIS Reprojection Tool (MRT) 3.0a [36] and reprojected from the Integerized Sinusoidal (ISIN) projection to a geographic projection (WGS 1984 UTM Zone 49N). Then the two tiles of h27v05 and h27v06 were mosaiced into one tile, and a rectangular image covering the study area is clipped by the MRT tool.

2.3.3. Reflectance Information Extraction

The 3 × 3 regional pixel value around the three monitoring points are chosen to extract the reflectance of each hydrological area. Due to the low spatial resolution of MOD13Q1, the reflectance of the pixels can be influenced by the width of the river, the passing ships, and clouds or fog in different periods. Therefore, we need to find the most spectrally pure pixels from these, and use their values as the reflectance of the monitoring points. As a water body has a negative normalized difference vegetation index (NDVI), a lower NDVI of a certain pixel indicates a higher probability that the pixel is a pure water body. Thus, we first use NDVI MOD13Q1 data to determine the 3 × 3 pixel region of each monitoring point, then locate the position of the NDVI value that is the minimum of nine pixels, and ultimately extract the corresponding location of all bands.

2.4. Regression Model for the Estimation of Suspended Sediment Concentration

2.4.1. Data Processing and Selection of Variables

The SSC and the reflectance are arranged, and the outliers are removed using the Dixon’s Q-test [37]. To ensure that the regression parameter estimator exhibits good statistical properties and thus improves the accuracy of the model, the natural logarithm of SSC (expressed as Ln (SSC)) is calculated and then fit with other band reflectance [38]. Simultaneously, to explore the temporal variation of SSC, the datasets were divided into sub-datasets according to two hydrological regimes (wet season from May to October, dry season from November to April), and four seasons (spring from March to May, summer from June to August, autumn from September to November, winter from December to February).
One of the key tasks in SSC estimation using RF algorithm is the selection of the input variables. Numerous studies suggested that five group variables, including the band reflectance (Band(i)), enhanced vegetation index (EVI), difference vegetation index (DVI DVI(i,j)), ratio vegetation index (RVI(i,j)), and NDVI(i,j), are the most widely used variables [14,15,16], where i and j are band number. There are four bands reflectance for MOD13Q1, resulting in four band reflectance variables (Band(1), Band(2), Band(3), Band(4)), six difference vegetation index variables (NDVI(1,2), NDVI(1,3), NDVI(1,4), NDVI(2,3), NDVI(2,4), NDVI(3,4)), six difference vegetation index variables (DVI(1,2), DVI(1,3), DVI(1,4), DVI(2,3), DVI(2,4), DVI(3,4)), and 12 ratio vegetation index variables (RVI(1,2), RVI(1,3), RVI(1,4), RVI(2,3), RVI(2,4), RVI(3,4), RVI(2,1), RVI(3,1), RVI(4,1), RVI(3,2), RVI(4,2), RVI(4,3)), and EVI variable. Thus, a total of 29 potential variables were used (Table 1, where B is spectral reflectance of ground reflectance products, i and j are band number).

2.4.2. Modeling Process

Two important parameters in the RF algorithm have been identified: the number of classified regression trees (k) and the number of random variables (m) of the separated nodes. By optimizing the two parameters, the prediction accuracy of the model can be improved [23]. In the present study, k has the value 50 as the interval in the range from 10 to 1010. m has the value 1 as the interval in the range of 1 to n (n is the number of prediction variables, i.e., 29).
The scikit-learn machine learning tool [39] in Python is used to implement the algorithm and then sort the variables by their contribution rates to prediction variables and prediction accuracy. A higher rate indicates greater importance of the variables. In RF, the importance of the variables is relative and the sum of the contribution rate is always 1.
Sorted by importance, the variables are screened from the other variables to ensure that the model has less predictive variables and a better prediction effect. This process does not only simplify the model, but also help to explain the variance of the model [40]. The Backward method [41] is employed to select the variable. According to importance of size sorting, all variables (n) are firstly selected as predictive parameters of the RF algorithm. The model is then used to predict the test sample and the prediction accuracy is recorded. One variable is then reduced. The aforementioned procedure is repeated. The prediction accuracy levels of the models under different combinations of variables are compared. The combination with the highest accuracy is considered the optimal variable set. On this basis, the RF model is reconstructed to test the prediction accuracy of the model. When the model is applied to all satellite pixels covering the studying area, the spatial variation of sediment concentration can be presented.

2.5. Model Evaluations

The coefficient of determination (R2), root mean square error (RMSE, Equation (2)), and relative RMSE (rRMSE, Equation (3)) [42] are used to evaluate the predictive ability of all regression models. RMSE is the most commonly used statistic indicator for measuring the model error. Meanwhile, rRMSE uses percentages to express model errors, which is relatively intuitive and is not affected by the range of raw data.
RMSE = i = 1 n ( y i , m y i , p ) 2 n  
RRMSE = 100 % i = 1 n ( y i , m y i , p ) 2 n y i , m  
where n, yi,m, yi,p, and yi,m represent the number of testing data, the measured value, the estimated value and the average value of the measurement, respectively.

3. Results

3.1. Spatial Variation of Suspended Sediment

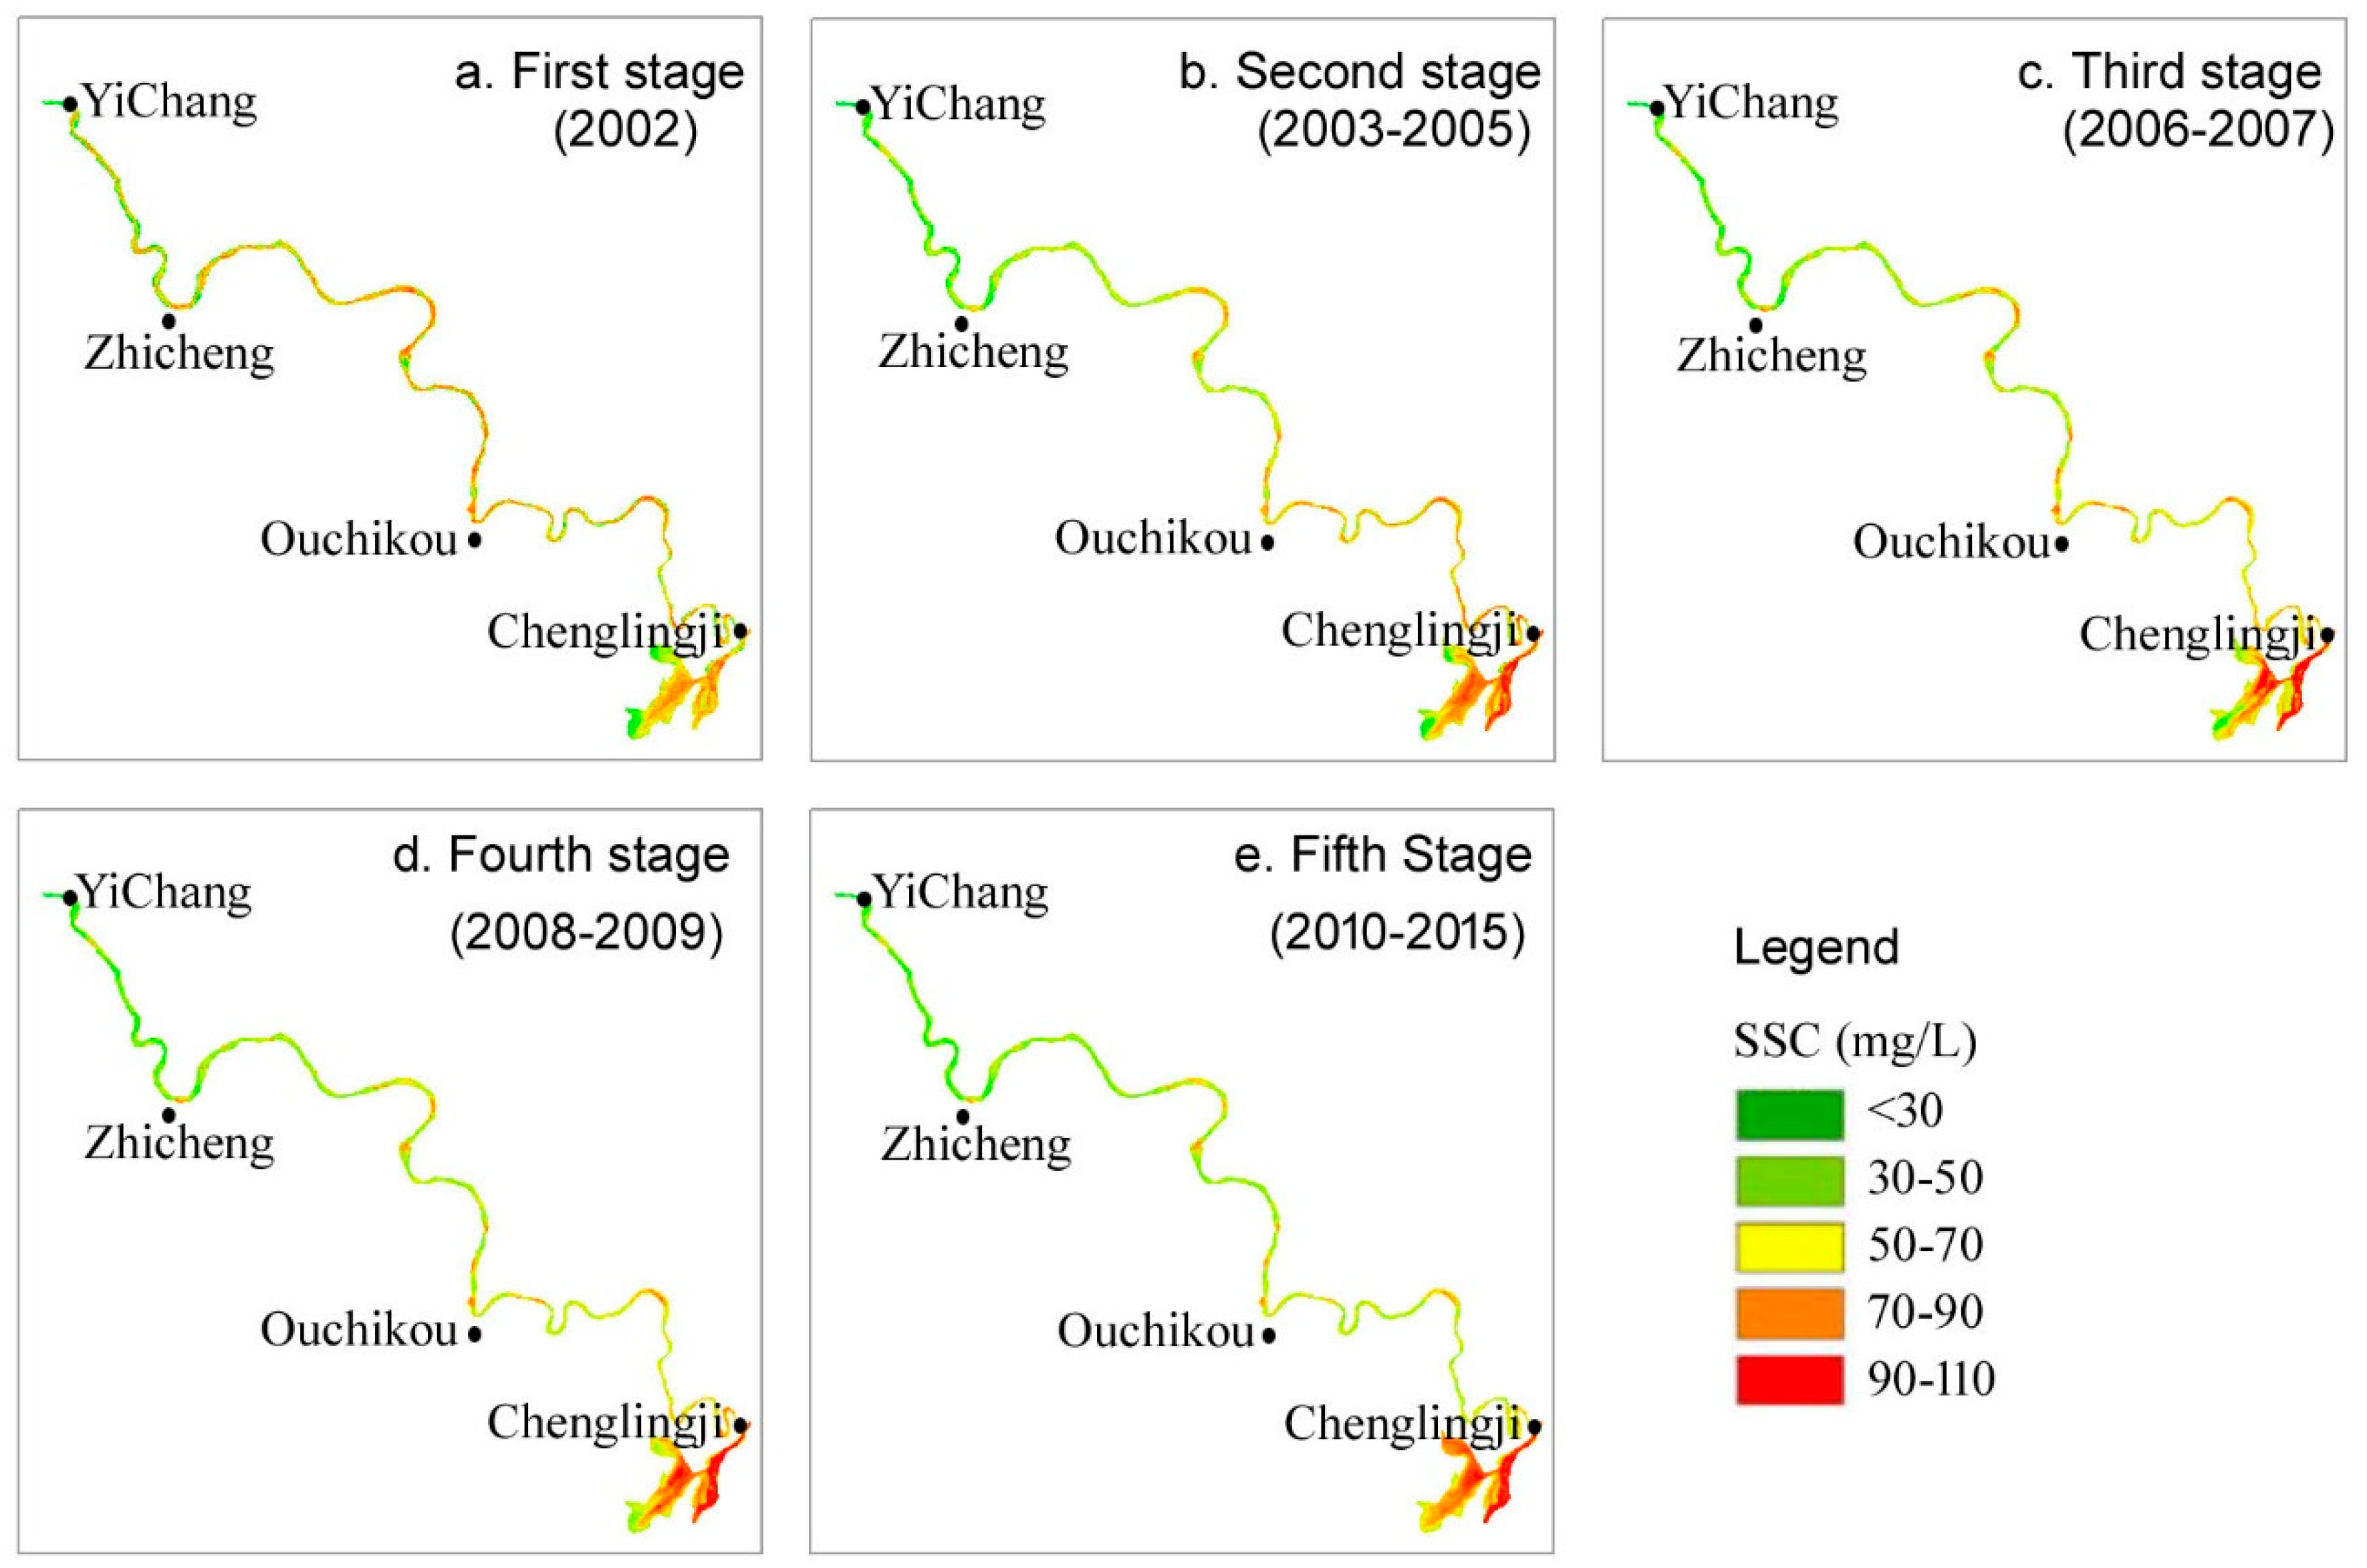
3.1.1. Spatial Distribution of Annual Suspended Sediment

Relatively, suspended sediment during the first stage was evenly distributed in the downstream side of the TGD, where the average concentration was between 70 and 90 mg/L (Figure 2a). In sharp river bends, suspended sediment was relatively higher. SSC in the course of the river was significantly reduced to the concentration averagely ranging between 50 and 70 mg/L during the second stage. Also, the distribution of sediment distribution was characterized by spatial differentiation, demonstrating that the amount of sediment is the lowest at the immediate downstream of the dam and reached the highest at Chenglingji (Figure 2b). The distribution of suspended sediment remained consistent and the average concentration was approximately 50 mg/L during the third and fourth stages (Figure 2c–d). After the TGD official operation in 2010, SSC remained stable in most sections, except for some curved reaches (Figure 2e). Comparing with the other stages, suspended sediment in Shishou section shifted significantly during the fifth stage only. A general conclusion can be made that SSC along the downstream of the dam decreased significantly from 2002 to 2015.

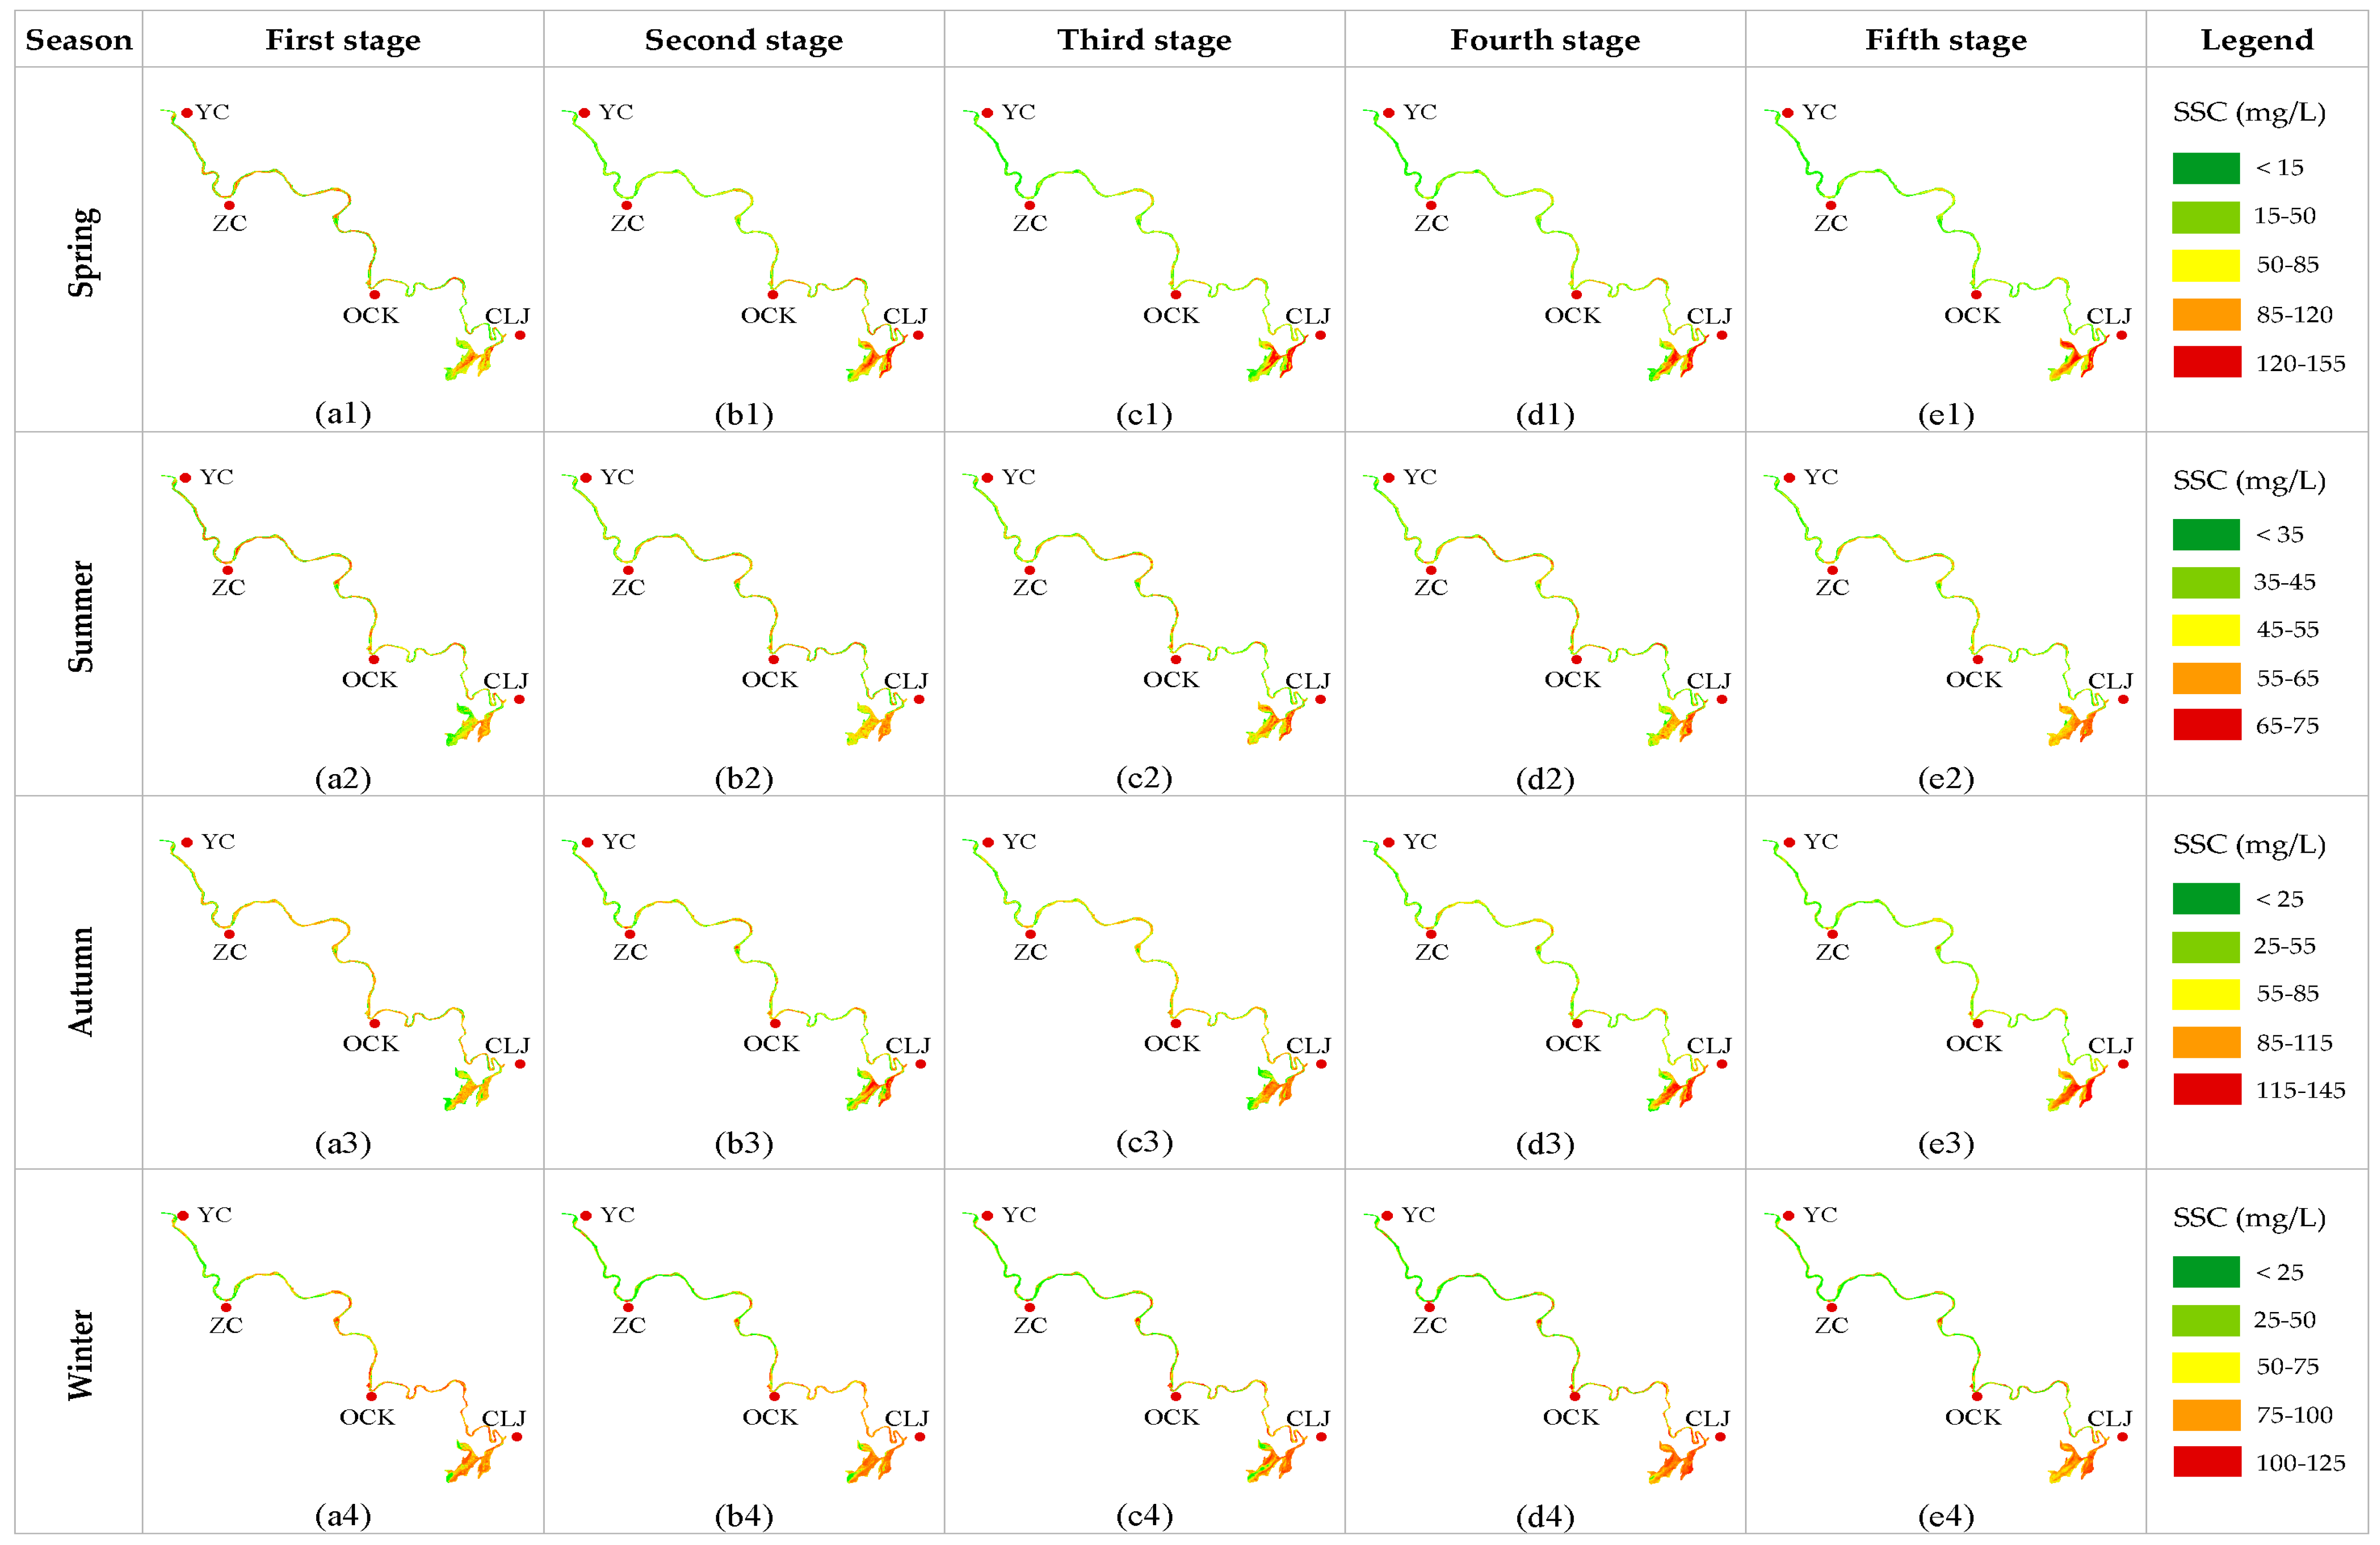
3.1.2. Spatial Distribution of Seasonal Suspended Sediment

During the first stage (Figure 3a1–a4), higher concentration at the downstream of TGD was found in certain river bends and in the middle of Dongting Lake with the average concentration of 60 mg/L in spring. In summer, the average concentration was 50 mg/L and a higher concentration was found in the main streams of the downstream. In autumn, the SSC for the whole range was elevated to 90 mg/L. In winter, the suspended sediment gradually increased from upstream to downstream, demonstrating a gradient in distribution where the average concentration was 75 mg/L. The concentration in the Jingjiang River section exceeded 100 mg/L, indicating a high probability of siltation.
During the second stage in spring (Figure 3b1–b4), SSC concentration at downstream of the dam was quite low at averaging at 30 mg/L. Peak concentration was found at the Chenglingji section. In summer, sediment was evenly distributed as a similar pattern as that of before impoundment (50 mg/L). In autumn, the average concentration elevated to 80 mg/L and the spatial distribution was still a gradually-increasing gradient from upstream to downstream. The concentration of sediment in winter, averaged at 60 mg/L, while higher concentration of 90 mg/L were found in the lower section of the Jingjiang River.
During the third stage (Figure 3c1–c4), SSC at the downstream in spring was also relatively low. For most of the sections, the concentration was lower than 30 mg/L. Higher sediment concentration was found at the end of the Chenglingji section and the average concentration exceeded 90 mg/L. In summer, sediment concentration was slightly higher than that in spring and the average concentration for the whole range was between 30 and 60 mg/L. In autumn, sediment concentration for certain parts of the river exceeded 60 mg/L and a significant increase was detected at the end of the Chenglingji section. In winter, sediment concentration was substantially decreased at the Yizhi section. While in some river bends sediment kept silting up and the average concentration exceeded 90 mg/L. In the lower section of the Jingjiang River, sediment concentration was relatively high and the sediments showed a tendency of transporting to the downstream.
During the fourth stage (Figure 3d1–d4), SSC in spring averaged out to 30 mg/L and spatial distribution patterns were similar to those during the third stage. In summer, sediment concentration averaged at 50 mg/L, and peak concentration moved to the lower section of the Jingjiang River. In autumn, SSC at the downstream Yangtze River of the dam was slightly reduced and a relatively high concentration was found at the end of the lower Jingjiang River. In winter, sediment concentration averaged 60 mg/L and a higher concentration was observed in the river bends in the upper section of the Jingjiang River. The concentration exceeded 100 mg/L, resulting in a large amount of siltation.
After the official operation of the TGD (the fifth stage), SSC were similar to those during the fourth stage. The average concentration of suspended sediment was 30, 50, 45, and 55 mg/L for spring, summer, autumn, and winter, respectively. Overall, the spatial distribution of suspended sediment concentration in the downstream Yangtze River of the dam showed significant difference during different stages, and the most significant difference was observed between the first stage and the second stage.

3.2. Temporal Variation of Suspended Sediment Concentration

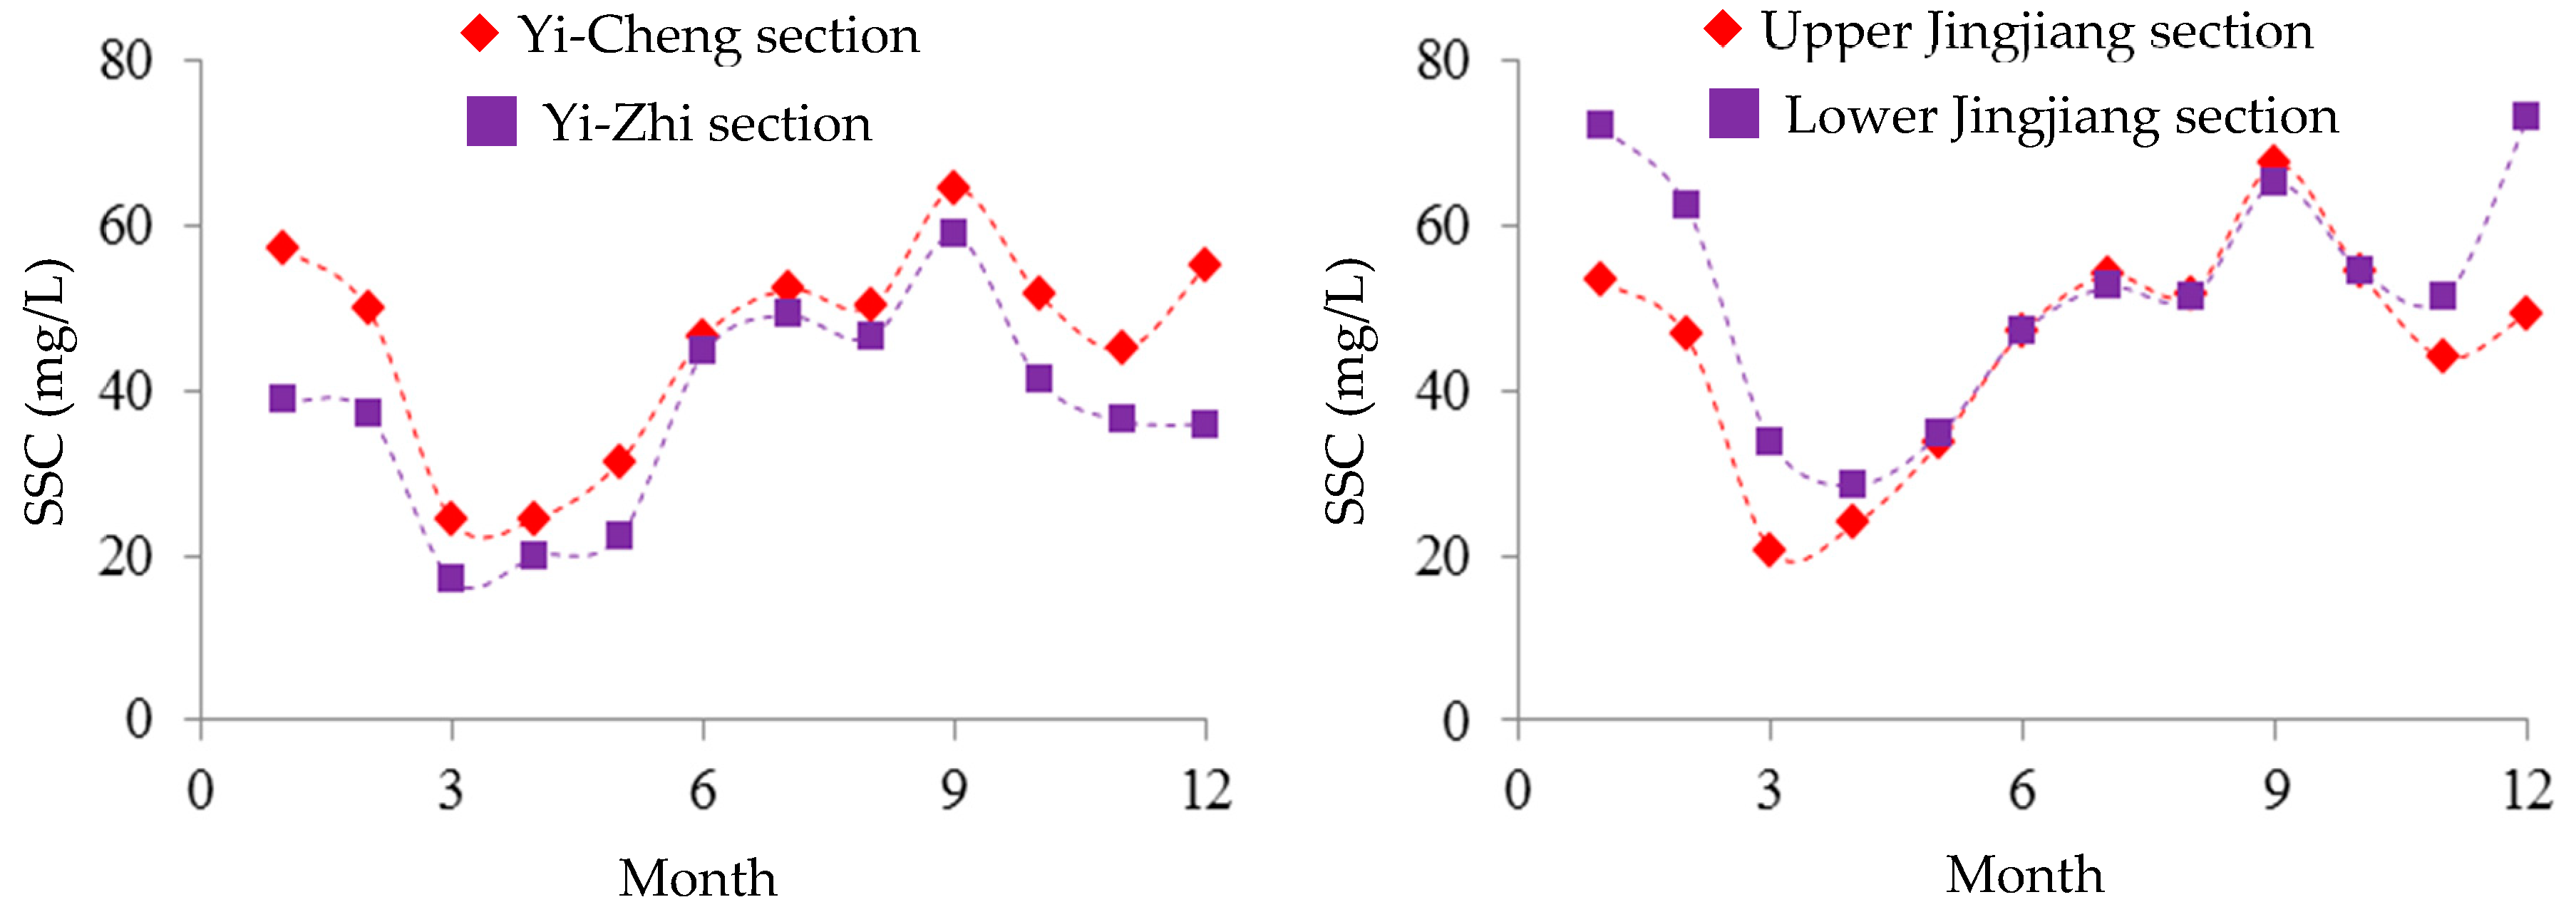
3.2.1. Seasonal Variations of Suspended Sediment Concentration

To investigate the temporal variation of SSC in different regions, the SSC in the whole Yi-Cheng river section and three sub sections (Yi-Zhi, upper Jingjiang and lower Jingjiang sections) were analyzed (Figure 4). Overall, a W-shaped seasonal variation curve could be roughly identified for the SSC at the downstream Yangtze River of the dam. The SSC of the whole Yi-Cheng river section started to drop sharply from 57 mg/L in January to 24 mg/L in March and April. Then it turned to increase and reached the maximum in September. Afterwards, SSC began to decease and arrived at the second trough in November. Except for the lower Jingjiang section, maximum SSC was found in September and minimum in March. The seasonal variations of suspended sediment were essentially consistent with that of the whole Yi-Cheng river section, while peak SSC for the lower Jingjiang section was found in December and January and trough concentration in April.

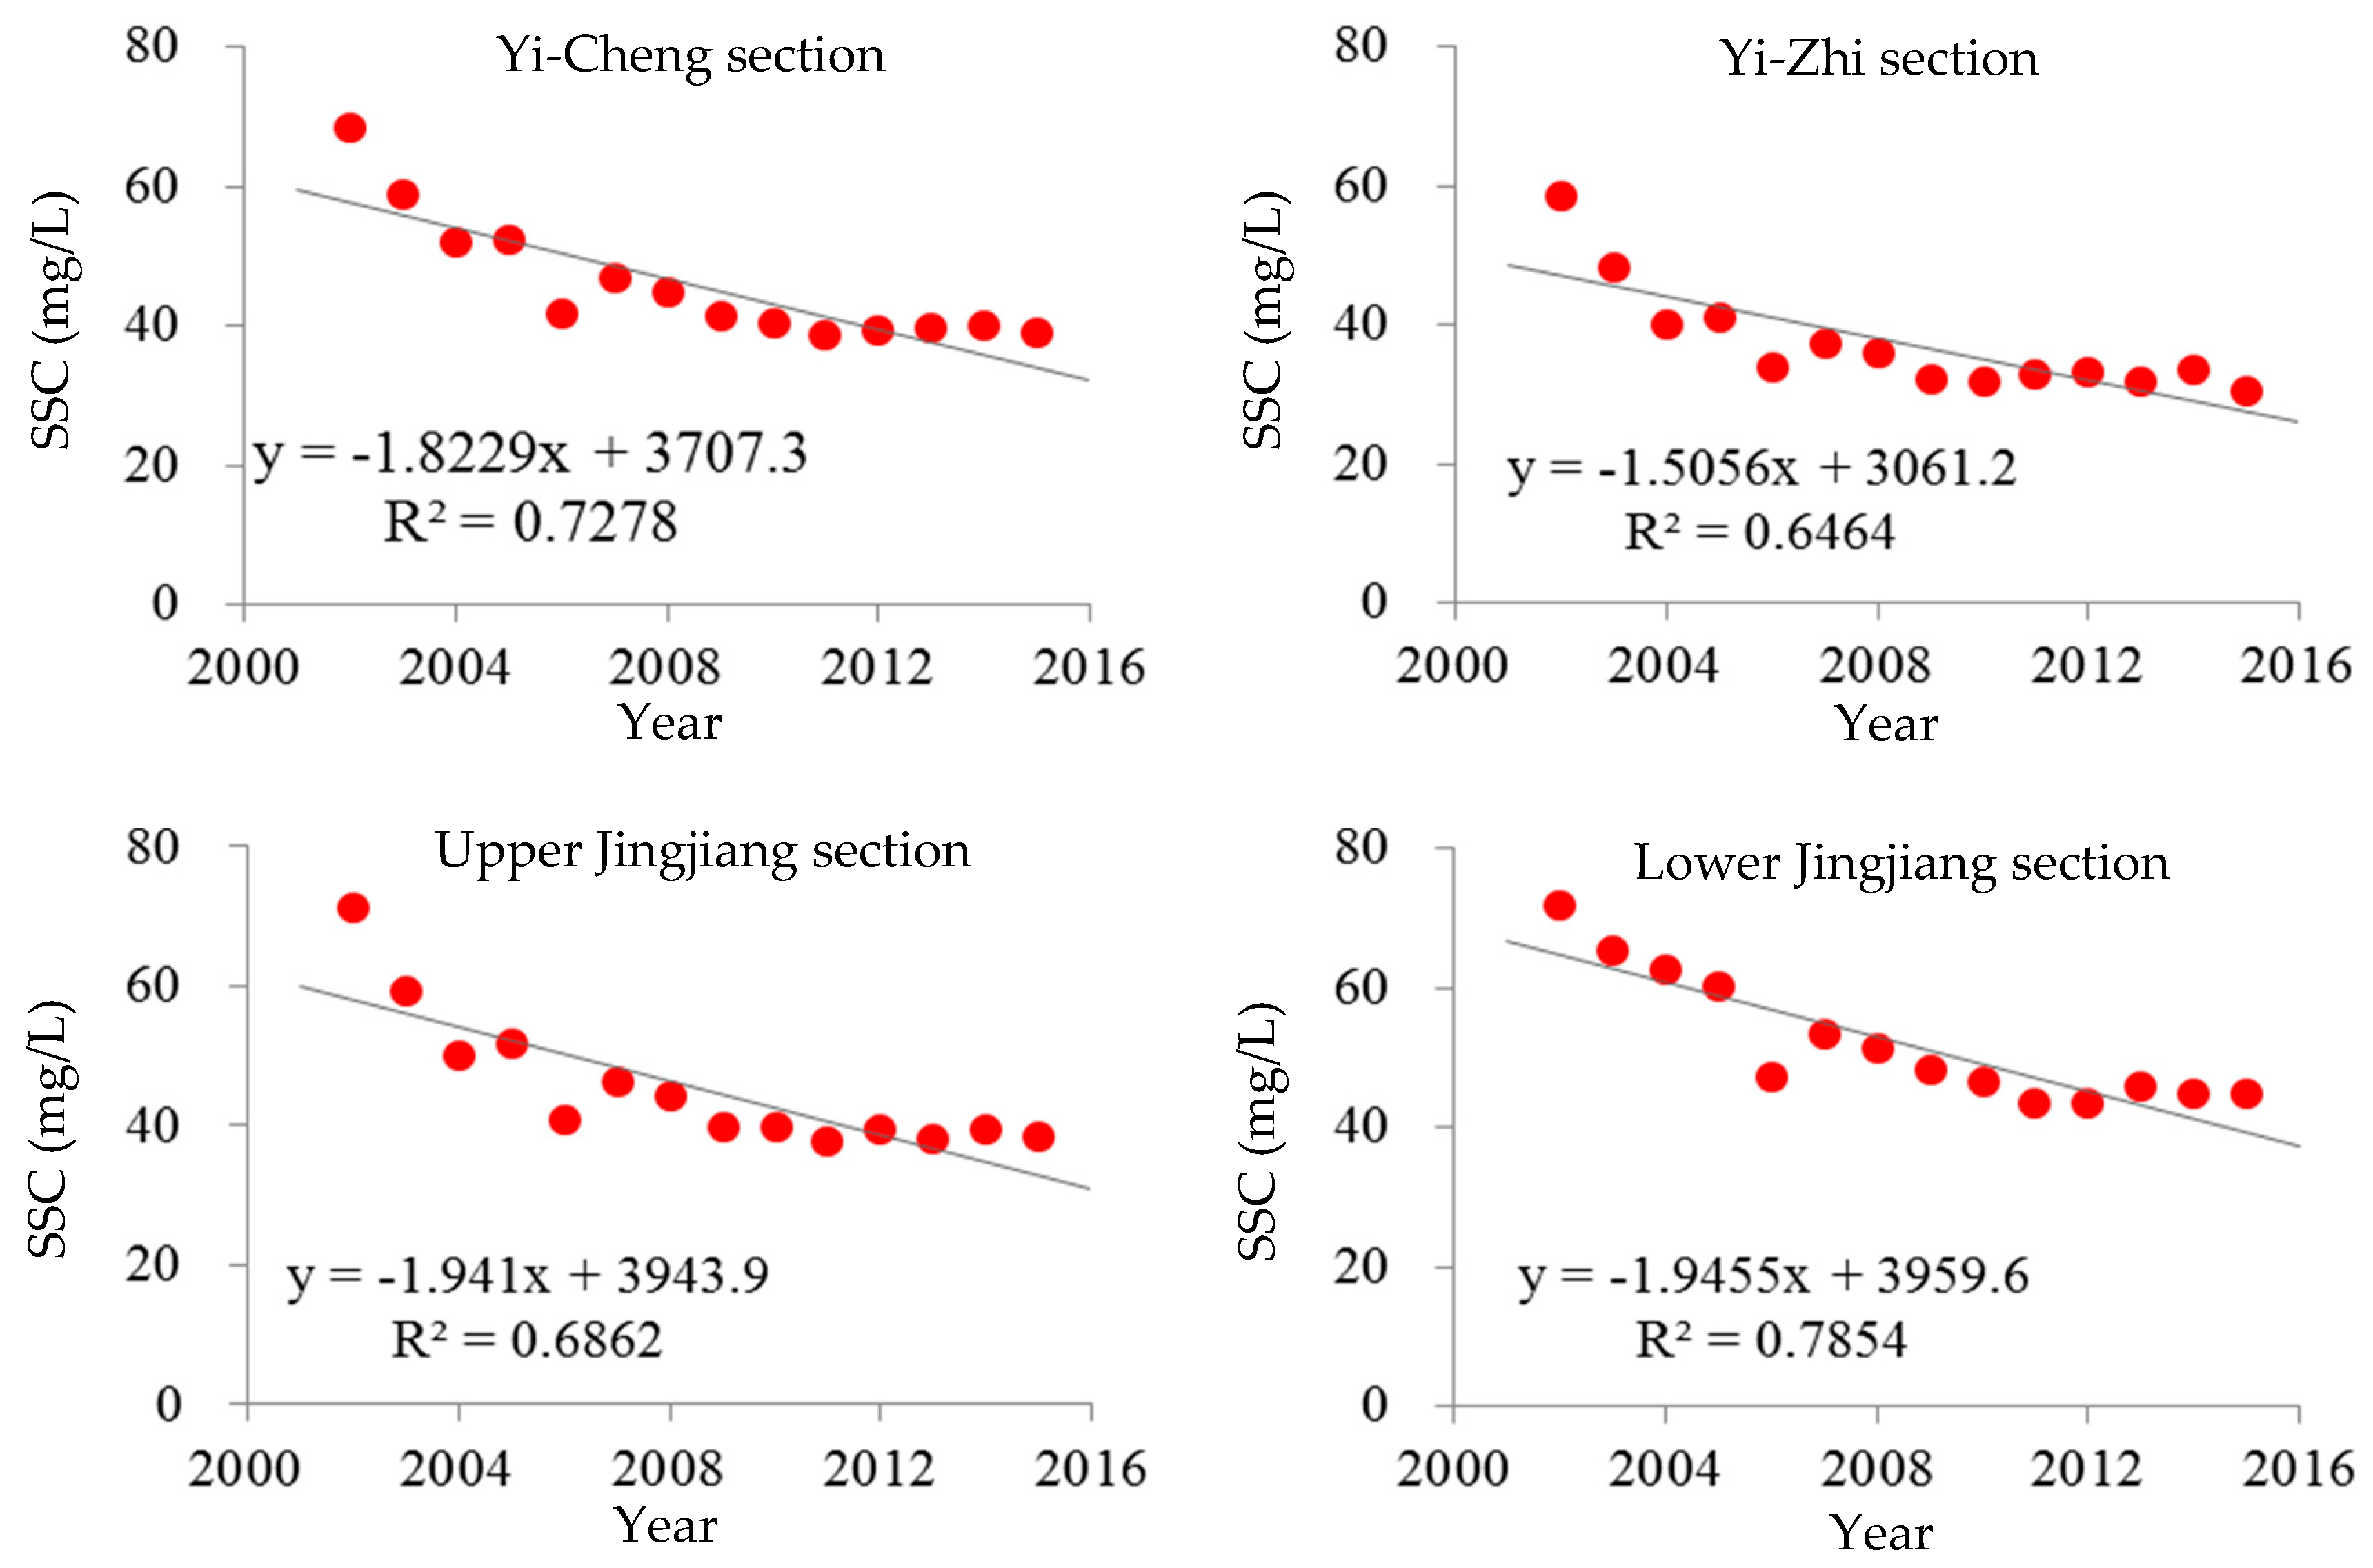
3.2.2. Annual Variations of Suspended Sediment Concentration

Annual variations of SSC at the downstream from the dam are presented (Figure 5) shows that the SSC has been in decline at the downstream areas of the dam from 2002 to 2015, indicating that the river was getting clearer along with the impoundment. The interannual rates of change of the mean SSC (as shown in Figure 5) were −1.82 mg/(L∙a), −1.51 mg/(L∙a), −1.94 mg/(L∙a) and −1.95 mg/(L∙a) for the whole Yi-Cheng section, Yi-Zhi section and the upper and lower Jingjiang sections, respectively.

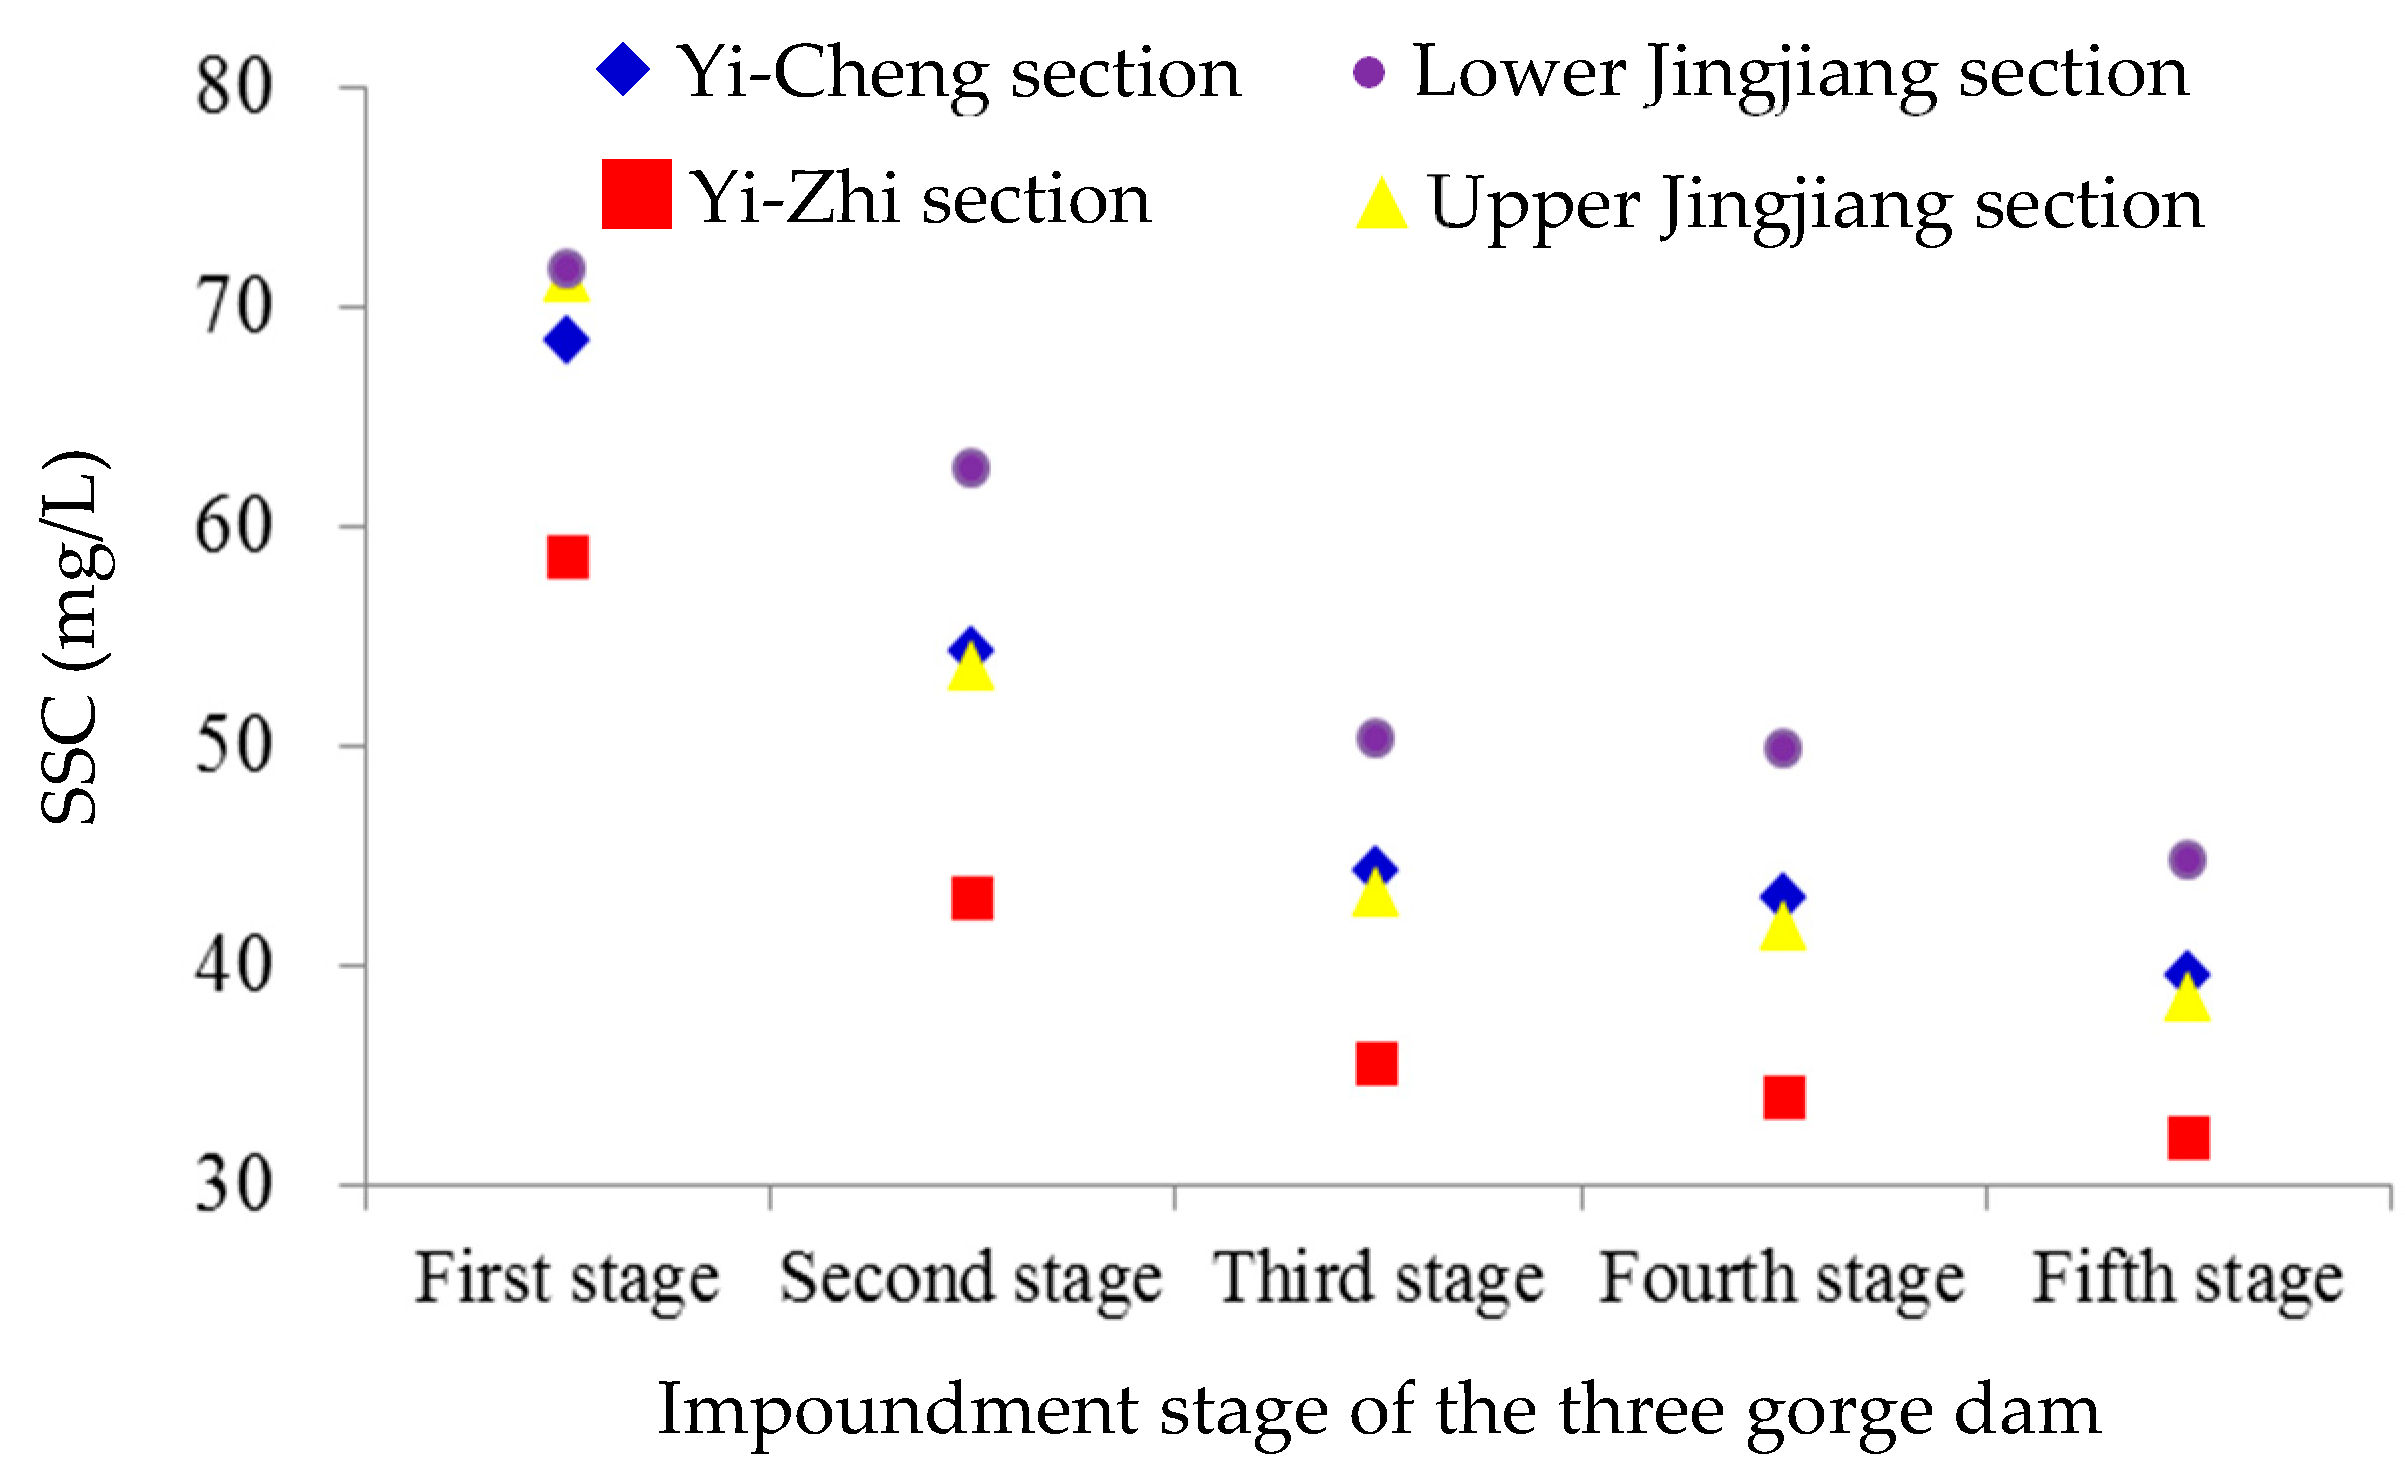
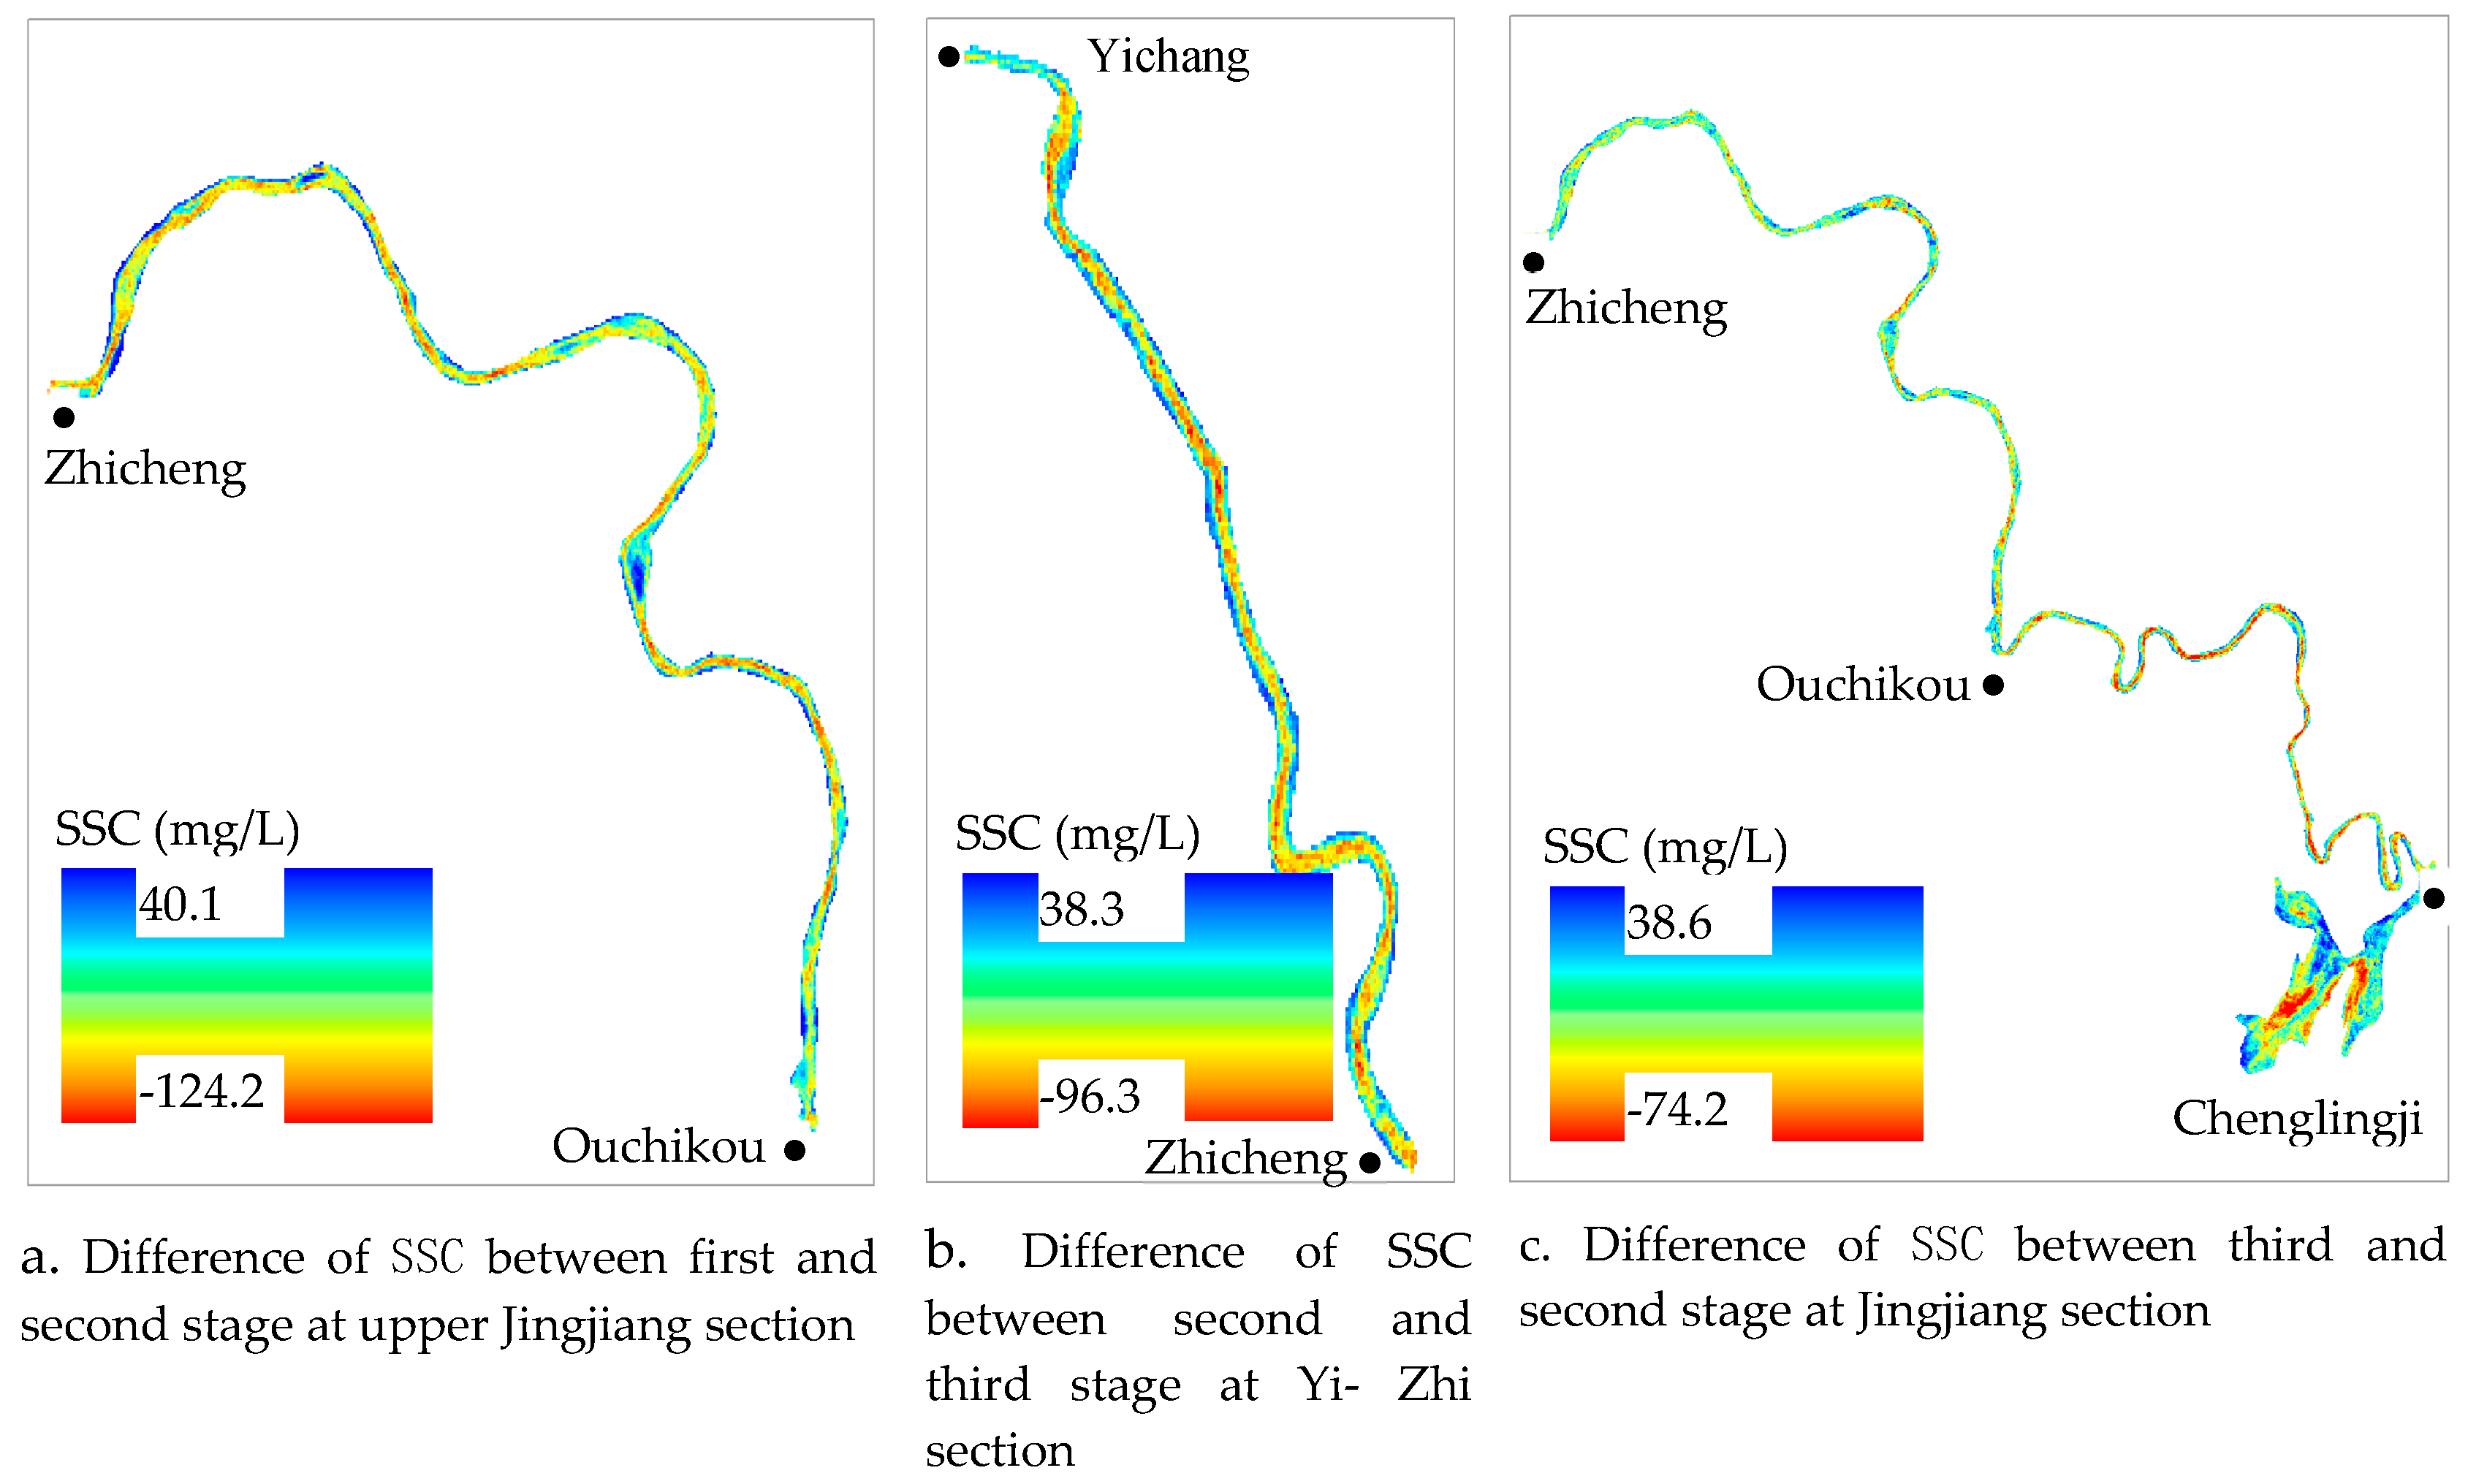
3.3. Impacts of Impoundment on the Suspended Sediment at the Downstream.

Figure 6 shows the SSC distribution patterns in the whole Yi-Cheng river section and its three sub-sections. The SSC at the downstream Yangtze River of the dam has significantly decreased after the third stage of impoundment. After the official operation of the TGD in 2009, the SSC was reduced by more than 40% during the fifth stage than that during the first stage. The most significant changes were observed in the upper Jingjiang section, where the SSC dropped by 45% (Figure 7a). Out of all stages of impoundment, the water impoundment to 135 m in 2003 had the most significant impact on suspended sediment as the SSC during the second stage decreased by 20% as compared to the first stage. The most notable changes were observed in the Yi-Zhi section where the SSC dropped by 26% (Figure 7b). After the water impoundment to 156 m in 2006, the SSC of the whole Yi-Cheng section during the third stage decreased by 18% more than during the second stage, and the most significant changes were observed in the Jingjiang section. While the SSC during the fourth stage decreased by 3% compared to the third stage, this indicated that the experimental water impoundment to 172 m in 2008 had relatively less impact on suspended sediment at the downstream Yangtze River of the dam.

4. Discussions

The impacts of TGD have been discussed since the 1950s, among which the impact on hydrological regimes in the downstream has always been one of the most controversial issues [43,44]. Consequently, the Chinese government has been very cautious from the beginning, as were many scientists involved, as to the assessment of potential impacts of the TGP on climate, ecology, and environment. By 1991, The Environmental Impact Assessment (EIA) was complete, with the conclusion that TGP had little effect on the downstream of the dam. After years of monitoring since the initially impounding of TGD, the Chinese Academy of Engineering completed the Staged Assessment (SA) report for TGP, in which the government still persisted the results regarding the effect of TGP on the downstream [45]. However, our results indicate that the TGD has a significant effect on the incoming sediment from upstream. The impacts of TGP on the sediment have been studied extensively after the impoundment of the TGD in 2003 [46,47]. However, some studies indicated that sediment deposition after the operation of the TGP was different from the previous prediction [48]. Observations showed that the incoming sediment of TGD was much less than the value of preliminary design, the rate of deposition was reduced greatly; during June 2003 to December 2015, the incoming suspended sediment of TGD is 2.1152 billion t, and the flushing value is 0.5118 billion t, the flushing ratio of sediment is only 24.2% [49], suggesting that a large amount of sediment have been retained by TGD after water impoundment. Yang et al. [50] investigated the temporal variation of sediment flux of the Yangtze River, and found that 65% of the sediment flux decline since 2003 can be attributed to the TGD. Guo et al. [44] found that sediment loads in the Yangtze River have reduced progressively since 1980s, with a notably accelerated reduction since 2003. He [51] reported that sediment in the Jingjiang section has significantly changed since the impoundment of TGD, and vertical profiles of SSC have changed accordingly. Zhou et al. [52] analyzed the hydrological series and reported that sediment deposition in the Dongting Lake decreased significantly after the impoundment of TGD. Based on the current research results, SSC tends to decline further. In the meantime, the interannual rate of change of SSC has been gradually decreasing, indicating that the comprehensive effect of TGD on the incoming upstream sediment is diminishing.
As the above findings indicated, varying degrees of SSC reductions were revealed in the downstream Yangtze River channels of the TGD. The construction, impoundment, and operation of TGD altered the hydrodynamic conditions [53] and increased the sediments deposition in TGR [49]. Hydrodynamic conditions play a vital role in the distribution and transfer of pollution sources in sediments [54]. The pollution issues in the sediments of TGR have been increasingly highlighted [55,56], and the regular analytical method [57] and artificial intelligence algorithms [58] have been extensively used to identify the pollution sources. Results at 14 stations that covered the upper to the lower reaches of the TGD showed that mean concentrations of heavy metals in the sediments were higher than the geochemical background values and those in the soils after the impoundment of the TGD [59], this is consistent with the result form Bing et al. [54] who found that concentrations of heavy metal in the sediments increased after the TGD operation
River sediment is a worldwide concern because of its significant importance in shaping the physical riverscape and regulating the associated ecological systems [4,5]. Over recent decades, many rivers have experienced decreasing SSC [60]. The SSC has led to emerging risks of bank failure, aggravated erosion of water front, and aggressive down-cutting erosion along the downstream of the dam [61,62]. Zhou et al. [52] analyzed the hydrological series and observed enhanced lakebed sediment erosion in Dongting Lake induced by the operation of TGD. Guo et al. [44] reported that channel degradation occurred in downstream Yangtze River, leading to considerable river stage drop. According to the results from aerial surveys from September to December 2014 [63], a total of 138 bank collapses were detected in the Yichang-Chenglingji section. The largest length of bank collapses is 1500 m, while the minimum length is 41 m. The bank collapse width ranges from 10 to 160 m. All the collapses located at the lower Jingjiang section where water erosion occurs more frequently than the upper sections. The collapses are mostly strip-collapses that account for 68.1% of the total (94/138). The bank collapses mainly occurred at the absence or weak parts of revetment works, where cultivated lands and shore wetlands are often located.
For the Yichang-Zhicheng section of the river, where the course is straight and the bank is stable, the prediction is that no significant changes are to be expected in the near future. As for the upper Jingjiang section, which is subjected to the scouring of the river to a certain extent, the river banks are gradually stabilizing. In the lower Jingjiang section, the overall terrain is low-lying with many river bends. Under these circumstances, river continues to scour the bank for sediment recharge. As a result, bank of the river gets scoured, large amounts of sediments enter the river and the most severe erosion is likely to happen in these regions. Under the long-term influence of impoundment regulation, great changes are expected in this section. Despite the fact that the trend of change is stabilizing in the Yichang-Zhicheng section and upper Jingjiang section, some large river islands distributed in the course of the river might be significantly affected under the long-term influence of scouring. The growth and recession of siltation is likely to develop in the near future, which will surely have impacts on the water and sediment situation. Under the combined effects of above-mentioned factors, the river course is still evolving, thus issues such as seasonal water shortage (or drought), wetland ecosystem degradation, and change of relations between rivers and lakes still call for attention of relevant government departments.
Field surveys were also carried out at the Yichang-Chenglingji section during 14–20 December 2015 (Figure 8). Currently, most of the collapses have not yet been emerged as direct threats to local communities and properties. However, the risk is rising in the near future along with the trend of decreasing SSC at these river sections.
As the largest power station in terms of installed capacity, the Three Gorges Dam/Reservoir project is of great significance to China’s water conservancy development. However, since it started storing water in 2003, clear water vents to the downstream and enhanced a long-distance, long-term scouring of the downstream channels has occurred. The discharge of clear water from the reservoir erodes relatively stronger in the lower channels, which lead to the changes in riverbed sediment erosion, siltation, and bank collapses. The cases of riverbank collapses already revealed the associated ongoing and potential social-ecological impacts, including erosion and aggravation of the shoreline, a shortage of seasonal water resources, and the degradation of the wetland ecosystem in the middle and lower reaches of the Yangtze River.
The erosion effects of clearer water are most seriously threatening to the Jingjiang section at the middle and lower reaches of the Yangtze River. In recent years, the frequency of dangers of Jingjiang’s bank collapse has increased significantly, as did the length of collapses along the bank. According to research findings, the Yangtze River riverbed will undergo long-distance scouring and lateral expansion in the near future. This would have a greater impact on river control and revetment projects, and also trigger new riverbank collapses. Therefore, more farmland, docks, wetlands and even some residential areas on the shore are exposed to risks. In addition, larger scale landslides can be caused by riverbank collapses in certain cases, which may lead to unexpected waves that bring great harm to watercraft transportation and fishing activities. With the continuing operation of the Three Gorges Project, further hydro-geological changes in some river sections are in concern of researchers and practitioners. It is therefore necessary to strengthen monitoring and research in the near future, as well as pay close attention to the development of the “scouring-sedimentation process” along the downstream of the dam.

5. Conclusions

Suspended sediment in water plays an important role in the evolution of local geomorphology, water-land interaction, dredging of navigational channels, and shaping the physical riverscape. Suspended sediment concentration is an important water-quality indicator reflecting turbidity, riverine flux, and bank erosion. The Three Gorges Dam, regarded as the world’s largest hydropower project, has affected the hydrological regime at the downstream below the dam on the Yangtze River, further resulting in the changes of SSC. Thus, it is of great significance to investigate the spatio-temporal variations of SSC of the downstream to better understand the ecological and environmental impacts of the dam.
The random forest model was developed to estimate SSC using MODIS ground reflectance products. The spatio-temporal distributions of SSC of the downstream were retrieved by this model from 2002 to 2015. Relatively, SSC during the first stage was evenly distributed in downstream Yangtze River, where the average concentration was between 70 and 90 mg/L. This spatial distribution pattern has been changed since 2003 when the reservoir started storing water. The SSC generally increased from the upper section to the lower section of the downstream, and reached the highest at Chenglingji after 2003. Overall, a W-shaped seasonal variation curve could be roughly identified for the SSC at the downstream of the dam, with the peak occurred in September and two troughs in March and November. The SSC has been in decline at the downstream of the dam from 2002 to 2015. It significantly decreased after three-stage impoundment. After the official operation of the TGD in 2009, the SSC was reduced by more than 40% during the fifth stage than the first stage. The most significant changes were found in the upper Jingjiang section, where the SSC dropped by 45%. Out of all the stages of impoundment, the water impoundment to 135 m in 2003 has the most significant impact on suspended sediment as the SSC after 2003 decreased by 20% than before, and the most notable changes were observed in the Yi-Zhi section where the SSC dropped by 26%. The decreased SSC after the water impoundment suggests that the TGD has significant blocking effect on the incoming upstream sediment. Decreased SSC has led to emerging risks of bank failure, aggravated erosion of the water front, and aggressive down-cutting erosion along the downstream Yangtze River of the dam. These impacts may further cause potential issues, such as seasonal water shortage, wetland ecosystem degradation, and change of relations between rivers and lakes which calls for more attention of management agencies.

Author Contributions

J.C. and L.E.Y. wrote the draft; X.F. and Z.W. contributed to remote sensing datasets collection, processing and modeling process; Q.C. collected the sediment concentration data; J.C., X.F., Y.H. and L.E.Y. analyzed the results; S.W. contributed to the revision of the manuscript; M.M. and L.E.Y. helped in the language edit.

Funding

This research was funded by Youth Innovation Promotion Association, Chinese Academy of Sciences, grant number 2018417. National Natural Science Foundation of China, grant number 41501096, 31601211. Open Fund Key Laboratory of Petroleum Resources of Gansu Province, grant number SZDKFJJ20160605.

Acknowledgments

We thank NASA Earth Observing System Data and Information System for providing the long-term product. We thank the Changjiang Water Resources Commission for providing the sediment concentration data.

Conflicts of Interest

The authors declare no conflict of interest.

References

  1. Dai, Z.; Fagherazzi, S.; Mei, X.; Gao, J. Decline in suspended sediment concentration delivered by the Changjiang (Yangtze) river into the east china sea between 1956 and 2013. Geomorphology 2016, 268, 123–132. [Google Scholar] [CrossRef]
  2. Chen, X.Y.; Chau, K.W. A hybrid double feedforward neural network for suspended sediment load estimation. Water Resour. Manag. 2016, 30, 2179–2194. [Google Scholar] [CrossRef]
  3. Wang, H.; Zhao, Y.; Zhou, F.; Yan, H.; Deng, Y.; Li, B. Suspended sediment distribution under varied currents in the largest river-connected lake of China. Water Science and Technology. Water Supply 2018, 18, 994–1004. [Google Scholar] [CrossRef]
  4. Béjar, M.; Vericat, D.; Batalla, R.J.; Gibbins, C.N. Variation in flow and suspended sediment transport in a montane river affected by hydropeaking and instream mining. Geomorphology 2018, 310, 69–83. [Google Scholar] [CrossRef]
  5. Turunen, M.; Warsta, L.; Paasonen-Kivekäs, M.; Koivusalo, H. Computational assessment of sediment balance and suspended sediment transport pathways in subsurface drained clayey soils. Soil Tillage Res. 2017, 174, 58–69. [Google Scholar] [CrossRef]
  6. Chen, J.; Finlayson, B.L.; Wei, T.; Sun, Q.; Webber, M.; Li, M.; Chen, Z. Changes in monthly flows in the Yangtze River, China-with special reference to the Three Gorges Dam. J. Hydrol. 2016, 536, 293–301. [Google Scholar] [CrossRef]
  7. Deng, K.; Yang, S.; Lian, E.; Li, C.; Yang, C.; Wei, H. Three gorges dam alters the Changjiang (Yangtze) river water cycle in the dry seasons: Evidence from h-o isotopes. Sci. Total. Environ. 2016, 562, 89–97. [Google Scholar] [CrossRef] [PubMed]
  8. Yang, S.L.; Milliman, J.D.; Xu, K.H.; Deng, B.; Zhang, X.Y.; Luo, X.X. Downstream sedimentary and geomorphic impacts of the three gorges dam on the Yangtze river. Earth Sci. Rev. 2014, 138, 469–486. [Google Scholar] [CrossRef]
  9. Sadeghi, S.H.; Psingh, V. Dynamics of suspended sediment concentration, flow discharge and sediment particle size interdependency to identify sediment source. J. Hydrol. 2017, 554, 100–110. [Google Scholar] [CrossRef]
  10. Oliveira, K.S.S.; Quaresma, V.D.S. Temporal variability in the suspended sediment load and streamflow of the Doce River. J. South Am. Earth Sci. 2017, 78, 101–115. [Google Scholar] [CrossRef]
  11. Zounemat-Kermani, M. Assessment of several nonlinear methods in forecasting suspended sediment concentration in streams. Hydrol. Res. 2017, 48, 1240–1252. [Google Scholar] [CrossRef]
  12. Thanh, V.Q.; Reyns, J.; Wackerman, C.; Eidam, E.F.; Roelvink, D. Modelling suspended sediment dynamics on the subaqueous delta of the Mekong river. Cont. Shelf Res. 2017, 147, 213–230. [Google Scholar] [CrossRef]
  13. Wackerman, C.; Hayden, A.; Onik, J. Deriving spatial and temporal context for point measurements of suspended-sediment concentration using remote-sensing imagery in the Mekong delta. Cont. Shelf Res. 2017, 147, 231–245. [Google Scholar] [CrossRef]
  14. Zhao, X.; Zhao, J.; Zhang, H.; Zhou, F. Remote sensing of sub-surface suspended sediment concentration by using the range bias of green surface point of airborne lidar bathymetry. Remote Sens. 2018, 10, 681. [Google Scholar] [CrossRef]
  15. Zhao, X.; Zhao, J.; Zhang, H.; Zhou, F. Remote sensing of suspended sediment concentrations based on the waveform decomposition of airborne lidar bathymetry. Remote Sens. 2018, 10, 247. [Google Scholar] [CrossRef]
  16. Milller, R.L.; Mckee, B.A. Using MODIS Terra 250 m imagery to map concentrations of total suspended matter in coastal waters. Remote Sens. Environ. 2004, 93, 259–266. [Google Scholar] [CrossRef] [Green Version]
  17. Volpe, V.; Silvestri, S.; Marani, M. Remote sensing retrieval of suspended sediment concentration in shallow waters. Remote Sens. Environ. 2011, 115, 44–54. [Google Scholar] [CrossRef]
  18. Bowers, D.; Hill, P.; Braithwaite, K. The effect of particulate organic content on the remote sensing of marine suspended sediments. Remote Sens. Environ. 2014, 144, 172–178. [Google Scholar] [CrossRef]
  19. Gullou, N.; Rivier, A.; Chapalain, G. The impact of tides and waves on near-surface suspended sediment concentrations in the English Channel. Oceanologia 2017, 59, 28–36. [Google Scholar] [CrossRef]
  20. Yang, X.P.; Sokoletsky, L.; Wei, X.D.; Shen, F. Suspended sediment concentration mapping based on the modis satellite imagery in the east china inland, estuarine, and coastal waters. Chin. J. Oceanol. Limnol. 2017, 35, 39–60. [Google Scholar] [CrossRef]
  21. Zounemat-Kermani, M.; Kişi, Ö.; Adamowski, J.; Ramezani-Charmahineh, A. Evaluation of data driven models for river suspended sediment concentration modeling. J. Hydrol. 2016, 535, 457–472. [Google Scholar] [CrossRef]
  22. Shamaei, E.; Kaedi, M. Suspended sediment concentration estimation by stacking the genetic programming and neuro-fuzzy predictions. Appl. Soft Comput. 2016, 45, 187–196. [Google Scholar] [CrossRef]
  23. Kumar, D.; Pandey, A.; Sharma, N.; Flügel, W.A. Daily suspended sediment simulation using machine learning approach. Catena 2016, 138, 77–90. [Google Scholar] [CrossRef]
  24. Yang, C.T.; Marsooli, R.; Aalami, M.T. Evaluation of total load sediment transport formulas using ANN. Int. J. Sediment Res. 2009, 24, 274–286. [Google Scholar] [CrossRef]
  25. Kisi, O. Modeling discharge-suspended sediment relationship using least square support vector machine. J. Hydrol. 2012, 456, 110–120. [Google Scholar] [CrossRef]
  26. Adib, A.; Mahmoodi, A. Prediction of suspended sediment load using ANN GA conjunction model with Markov chain approach at flood conditions. KSCE J. Civ. Eng. 2017, 21, 447–457. [Google Scholar] [CrossRef]
  27. Chen, J.L.; Li, G.S.; Xiao, B.B.; Wen, Z.F.; Lv, M.Q.; Chen, C.D.; Jiang, Y.; Wang, X.X.; Wu, S.J. Assessing the transferability of support vector machine model for estimation of global solar radiation from air temperature. Energy Convers. Manag. 2015, 89, 318–329. [Google Scholar] [CrossRef] [Green Version]
  28. Breiman, L. Random forests. Mach. Learn. 2001, 45, 5–32. [Google Scholar] [CrossRef]
  29. Gleason, C.J. Forest biomass estimation from airborne LiDAR data using machine learning approaches. Remote Sens. Environ. 2012, 125, 80–91. [Google Scholar] [CrossRef]
  30. Tian, X.; Yan, M.; Tol, C. Modeling forest above-ground biomass dynamics using multi-source data and incorporated models: A case study over the qilian mountains. Agric. For. Meteorol. 2017, 246, 1–14. [Google Scholar] [CrossRef]
  31. Wang, C.H.; Xiao, S.B.; Li, Y.C.; Zhong, H.Y.; Li, X.C.; Peng, F. Methane formation and consumption processes in Xiangxi Bay of the Three Gorges Reservoir. Sci. Rep. 2014, 4, 4449. [Google Scholar] [CrossRef] [PubMed] [Green Version]
  32. Fu, B.J.; Wu, B.F.; Lu, Y.H.; Xu, Z.H.; Cao, J.H.; Niu, D.; Yang, G.S.; Zhou, Y.M. Three Gorges Project: Efforts and challenges for the environment. Prog. Phys. Geogr. 2010, 34, 741–754. [Google Scholar] [CrossRef]
  33. Ministry of Water Resources of China. Code for River Suspended Sediment Measurement; China Planning Press: Beijing, China, 1992; GB 50159–50192.
  34. OriginLab. Origin; OriginLab: Nothampton, MA, USA, 2015. [Google Scholar]
  35. Pringle, M.J.; Denham, R.J.; Devadas, S. Identification of cropping activity in central and southern Queensland, Australia, with the aid of MODIS MOD13Q1 imagery. Int. J. Appl. Earth Obs. Géoinf. 2012, 19, 276–285. [Google Scholar] [CrossRef]
  36. MODIS Reprojection Tool (MRT); Users Guide; Release 3.2a; South Dakota School of Mines and Technology, USGS EROS Data Center: Rapid City, SD, USA, 2004; p. 58.
  37. Robert, B.; Dean, W.; Dixon, J. Simplified Statistics for Small Numbers of Observations. Anal. Chem. 1951, 23, 636–638. [Google Scholar]
  38. Smith, C.; Croke, B. Sources of uncertainty in estimating suspended sediment load. IAHS AISH Publ. 2005, 292, 136–143. [Google Scholar]
  39. Pedregosa, F.; Varoquaux, G.; Gramfort, A.; Michel, V.; Thirion, B.; Grisel, O.; Blondel, M.; Prettenhofer, P.; Weiss, R.; Dubourg, V.; et al. Scikit-learn: Machine Learning in Python. J. Mach. Learn. Res. 2011, 12, 2825–2830. [Google Scholar]
  40. Ismail, R.; Mutanga, O.; Kumar, L. Modeling the Potential Distribution of Pine Forests Susceptible to Sirex Noctilio Infestations in Mpumalanga, South Africa. Trans. GIS 2010, 14, 709–726. [Google Scholar] [CrossRef]
  41. Süli, E.; Mayers, D. An Introduction to Numerical Analysis; Cambridge University Press: Cambridge, UK, 2003; ISBN 0-521-00794-00791. [Google Scholar]
  42. Bian, M.; Skidmore, A.K.; Schlerf, M.; Wang, T.; Liu, Y.; Zeng, R.; Fei, T. Predicting foliar biochemistry of tea (Camellia sinensis) using reflectance spectra measured at powder, leaf and canopy levels. J. Photogramm. Remote Sens. 2013, 78, 148–156. [Google Scholar] [CrossRef]
  43. Jiang, H.C.; Qiang, M.S.; Fan, Q.X.; Zhang, M.Q. Scientific research driven by large-scale infrastructure projects: A case study of the Three Gorges Project in China. Technol. Forecast. Soc. Chang. 2018, 134, 61–71. [Google Scholar] [CrossRef]
  44. Guo, L.; Su, N.; Zhu, C.; He, Q. How have the river discharges and sediment loads changed in the changjiang river basin downstream of the three gorges dam? J. Hydrol. 2018, 560, 259–274. [Google Scholar] [CrossRef]
  45. Xu, X.B.; Yan, T.; Yang, G.S. Environmental impact assessments of the Three Gorges Project in China: Issues and interventions. Earth Sci. Rev. 2013, 124, 115–125. [Google Scholar] [CrossRef] [Green Version]
  46. Gao, J.H.; Jia, J.J.; Kettner, A.J.; Xing, F.; Wang, Y.P.; Xu, X.N. Changes in water and sediment exchange between the Changjiang river and Poyang lake under natural and anthropogenic conditions, China. Sci. Total. Environ. 2014, 481, 542–553. [Google Scholar] [CrossRef] [PubMed]
  47. Wang, B.Y.; Yan, D.C.; Wen, A.B.; Chen, J.C. Influencing factors of sediment deposition and their spatial variability in riparian zone of the three gorges reservoir, China. J. Mt. Sci. 2016, 13, 1387–1396. [Google Scholar] [CrossRef]
  48. Li, W.; Yang, S.; Hu, J.; Fu, X.; Zhang, P. Field measurements of settling velocities of fine sediments in three gorges reservoir using adv. Int. J. Sediment Res. 2016, 31, 237–243. [Google Scholar] [CrossRef]
  49. Zhou, Y.J.; Sun, J.; Zhang, Y.Q.; Yan, X. Analysis on the law of sediments deposition in the three gorges reservoir. IOP Conf. Ser. Earth Environ. Sci. 2017, 81, 012050. [Google Scholar] [Green Version]
  50. Yang, S.L.; Xu, K.H.; Milliman, J.D.; Yang, H.F.; Wu, C.S. Decline of Yangtze river water and sediment discharge: Impact from natural and anthropogenic changes. Sci. Rep. 2015, 5, 12581. [Google Scholar] [CrossRef] [PubMed]
  51. He, L. Quantifying the Effects of Near-Bed Concentration on the Sediment Flux after the Operation of the Three Gorges Dam, Yangtze River. Water 2017, 9, 986. [Google Scholar] [CrossRef]
  52. Zhou, Y.Q.; Li, J.B.; Zhang, Y.L.; Zhang, X.P.; Li, X.C. Enhanced lakebed sediment erosion in Dongting lake induced by the operation of the three gorges reservoir. J. Geogr. Sci. 2015, 25, 917–929. [Google Scholar] [CrossRef]
  53. Gao, B.; Gao, L.; Zhou, Y.; Xu, D.; Zhao, X. Evaluation of the dynamic mobilization of vanadium in tributary sediments of the three gorges reservoir after water impoundment. J. Hydrol. 2017, 551, 92–99. [Google Scholar] [CrossRef]
  54. Bing, H.J.; Zhou, J.; Wu, Y.H.; Wang, X.X.; Sun, H.Y.; Li, R. Current state, sources, and potential risk of heavy metals in sediments of three gorges reservoir, china. Environ. Pollut. 2016, 214, 485–496. [Google Scholar] [CrossRef] [PubMed]
  55. Zhao, X.; Gao, B.; Xu, D.; Gao, L.; Yin, S. Heavy metal pollution in sediments of the largest reservoir (three gorges reservoir) in China: A review. Environ. Sci. Pollut. Res. 2017, 24, 20844–20858. [Google Scholar] [CrossRef] [PubMed]
  56. Shi, Z.L.; Wang, Y.Y.; Wen, A.B.; Yan, D.C.; Chen, J.C. Tempo-spatial variations of sediment-associated nutrients and contaminants in the Ruxi tributary of the Three Gorges Reservoir, China. J. Mt. Sci. 2018, 15, 319–326. [Google Scholar] [CrossRef]
  57. Škrbića, B.D.; Kadokami, K.; Antića, I. Survey on the micro-pollutants presence in surface water system of northern Serbia and environmental and health risk assessment. Environ. Res. 2018, 166, 130–140. [Google Scholar] [CrossRef] [PubMed]
  58. Szewrański, S.; Chruściński, J.; van Hoof, J.; Kazak, J.K.; Świąder, M.; Tokarczyk-Dorociak, K.; Żmuda, R. A Location Intelligence System for the Assessment of Pluvial Flooding Risk and the Identification of Storm Water Pollutant Sources from Roads in Suburbanized Areas. Water 2018, 10, 746. [Google Scholar] [CrossRef]
  59. Wang, T.; Pan, J.; Liu, X. Characterization of heavy metal contamination in the soil and sediment of the three gorges reservoir, China. J. Environ. Sci. Heal. Part A 2018, 52, 201–209. [Google Scholar] [CrossRef] [PubMed]
  60. Yang, S.L.; Milliman, J.D.; Li, P.; Xu, K. 50,000 dams later: Erosion of the Yangtze River and its delta. Glob. Planet. Chang. 2011, 75, 14–20. [Google Scholar] [CrossRef]
  61. Li, N.; Wang, L.C.; Zeng, C.F.; Wang, D.; Liu, D.F.; Wu, X.T. Variations of runoff and sediment load in the middle and lower reaches of the Yangtze River, China (1950–2013). PLoS ONE 2016, 11, e0160154. [Google Scholar] [CrossRef] [PubMed]
  62. Yang, H.F.; Yang, S.L.; Xu, K.H.; Milliman, J.D.; Wang, H.J.; Yang, Z.S.; Chen, Z.Y.; Zhang, C.Y. Human impacts on sediment in the Yangtze River: A review and new perspectives. Glob. Planet Chang. 2018, 162, 8–17. [Google Scholar] [CrossRef]
  63. Changjiang Water Resources Commission. Analysis and Research Report on Riverbed Scouring in the Middle Reach of Yangtze River; Changjiang Water Resources Commission: Beijing, China, 2015.
Figure 1. Location of the Yichang-Chenglingji section in downstream of the Three Gorge Dam.
Sustainability 10 04093 g001
Figure 2. Distribution of annual suspended sediment concentration during different stages of impoundment.
Sustainability 10 04093 g002
Figure 3. Distribution of seasonal suspended sediment concentration during different stages of impoundment (YC, ZC, OCK, and CLJ represent for the Yichang, Zhicheng, Ouchikou, and Chenglingji, respectively).
Sustainability 10 04093 g003
Figure 4. Seasonal variations of suspended sediment concentration.
Sustainability 10 04093 g004
Figure 5. Interannual variations of suspended sediment concentration between 2002 and 2015.
Sustainability 10 04093 g005
Figure 6. Variations of suspended sediment concentration at different stages of impoundment.
Sustainability 10 04093 g006
Figure 7. Difference of sediment concentration between different stages of impoundment.
Sustainability 10 04093 g007
Figure 8. Cases of Riverbank collapses and the impacts along the Yichang-Chenglingji sections of the Yangtze River. Photos taken by the authors during 14–20 December 2015. (a) Riverbank collapse eroded croplands at the Ershengzhou Section (二圣洲段), left bank of the river, (b) Riverbank collapse eroded woodlands and shrubs at the Tianxinge Section (天星阁段), right bank of the river, (c) Riverbank protection project damaged due to bank collapses at the Beinianzi Section (北碾子段), left bank of the river, (d) Roads and ports facilities affected by bank collapses at the Beinianzi Section (北碾子段), left bank of the river.
Sustainability 10 04093 g008
Table 1. The potential variables of Random Forest model for the estimation of SSC.
Variables GroupEquationsVariables Number
Band(i)Bi4
EVI2.5 × (B4 − B2)/(B4 + 2.4 × B2 + 1)1
NDVI(i,j)(Bi − Bj)/(Bi + Bj)6
DVI(i,j)Bi − Bj6
RVI(i,j)Bi/Bj12

