Key Factors to Green Building Technologies Adoption in Developing Countries: The Perspective of Chinese Designers


1
School of Management, Harbin Institute of Technology, Harbin 150001, China
2
School of Civil Engineering, Harbin Institute of Technology, Harbin 150001, China
3
School of Civil Engineering, Northeast Forestry University, Harbin 150040, China
4
State Grid Liaoning Electric Power Company Limited Economic Research Institute, Shenyang 110015, China
*
Author to whom correspondence should be addressed.
Sustainability 2018, 10(11), 4135; https://doi.org/10.3390/su10114135
Submission received: 28 October 2018
/
Revised: 7 November 2018
/
Accepted: 8 November 2018
/
Published: 10 November 2018
(This article belongs to the Collection Green Building Technologies)
Abstract
:Green building is deemed an effective means to realize the sustainable development of environment, economy and society in the construction industry. Green building technologies (GBTS) are important to realize green buildings. In order to make the application of GBTS be adopted and popularized effectively, it is especially important for us to gain thorough comprehension of the key problems that affect the adoption of GBTS. The target of this paper is to better understand the adoption of GBTS from the perspective of designers. This article utilizes a questionnaire to investigate Chinese architectural designers. Through establishing a structural equation model and an analysis of the survey data, the key factors influencing the adoption of GBTS by designers in the Design Company were found out. The results denote that the adoption motivation, the capability of GBTS, the knowledge structure and the defects of GBTS are the significant factors that affect designers’ adoption behaviors. However, the management support of GBTS has no significant effect on designers’ adoption behavior. The research results are helpful to improve adoption of GBTS in design units and accelerate the transformation of GBTS achievements. Additionally, they can promote the application of GBTS in the field of construction. Based on the quantitative theoretical model (the structural equation model), this paper finds out the key factors that affect the application of GBTS from the perspective of designers, enriching the theoretical methods of GBTS research and complementing the relevant literature of GBTS research. Future research will analyze the adoption behavior of GBTS from the point of other stakeholders and from the internal level of the design units.
1. Introduction
As a resource-intensive industry, the construction industry accounts for a large proportion of global resource consumption and environmental pollution [1,2,3]. In line with statistics, the construction industry consumes 40 percent of the total energy and 30 percent of the global greenhouse gas emissions [4]. The serious impact of the construction industry on the economy, environment, public health and safety has caught increasing attention from society [5]. The implementation of sustainable development in the construction industry has been the focus of the widespread concern. As a strategy to improve the sustainable development of the construction industry, green buildings have been welcomed by all countries around the world [6]. In terms of green buildings, people remark that “During the life cycle of the entire construction project, the construction and use of buildings are environmentally responsible and improve the effective utilization of energy efficiency” [7]. Because of the negative impact of conventional buildings on both the environment and the climate, green buildings are perceived as effective substitutes for traditional buildings. It plays an important role in environmental protection and resource conservation [8,9].
GBTS are an important means to improve energy efficiency and an effective way to realize green building [10,11]. In recent years, due to its advantages, there has been some research on GBTS. From the perspective of the whole life cycle of architecture, researchers study the environmental pollution and other issues [10,11,12,13,14,15]. GBTS include solar systems, green roofs and walls, heat pumps and the application of corresponding technologies throughout the construction project delivery process [8,13,16]. Some GBTS, such as green roofs, solar energy and precast concrete, have been introduced into the development of green projects. Green buildings are required to integrate the interactions between GBTS and other building components to reduce the impact on the environment [17,18]. Building energy efficiency can be remarkably improved by the use of GBTS to renovate existing buildings [15,19]. A large number of scholars believe that GBTS diffusion is the most efficacious and convenient way to stimulate the development of the green building industry [13,15,16,20,21,22,23,24,25].
A crucial condition for the transformation of traditional buildings to green buildings is the integration and innovation of various design specialties in the application of GBTS. This means that the designer’s ability to adopt green technology and optimize the architectural design according to local conditions is highly important. Moreover, the design company needs to adopt novel GBTS actively to survive in the current construction industry environment [26]. In China’s construction market, designers are always keen on quick drawing, and they design merely by standard, as the lack of innovation and sufficient environmental support. This has led the “funnel” imbalance conditions of the Chinese green building market [27,28,29]. The funnel imbalance has two big ends, but a small middle. In the Chinese green building market, the theoretical and scientific research in the preceding period have been paid more attention to and some achievements and progress have been made. The green results and evaluation of the back-end are also of high concern and value by the government and the public. However, architectural design, as the key intermediate link between exploring green and realizing green, has been ignored by both. The transformation architectural, engineering and construction (AEC) design is the central link to ensure that GBTS can be availably applied, disseminated and popularized. Studies have shown that the performance of green buildings depends on planning and design. More than 40% of the energy saving potential comes from the initial planning and the design phase of the building plan. Dr. Pieter de Wildehas adopted a survey of 67 buildings in Europe. The result shows that, among 303 GBTS, 57% of technical measures should be implemented in the planning and design phase [30]. The adopting of GBTS advocates a participatory design process [31]. The completion of green buildings needs the participation and effective support from all owners, managers, professionals and other project stakeholders. As a result, the role of the designers is essential, for they are one of the most active participants in the adoption of GBTS [32]. At present, in the development of green buildings, the scientific research team is highly active. Nevertheless, the designers do not take the initiative to learn and master green building design technology. Professional consultants are often required to complete the design and application of GBTS in some design firms. Meanwhile, due to the failure of grasping the nature of green architectural design, there have even been cases of simply piling up green technologies and products. For instance, designers do not consider the applicability of solar energy and ground-source heat pump technology. Instead, it gives rise to a new round of waste of resources and environmental damage. The effective implementation strategy of GBTS rests upon the key factors that influence the adoption of GBTS of designers. Therefore, the research on the adoption behavior of the designers matters greatly.
In view of the benefits of sustainability, there has been a lot of research on green buildings and GBTS in recent years [33,34,35]. Promoting the adoption and popularization of GBTS are conducive to all countries. However, there are still many obstacles and challenges for GBTS adoption [36]. In order to promote the adoption and popularization of GBTS, it is of necessity to analyze and solve relevant obstacles. At the moment, there are several studies on GBTS, which are mainly focused on the research of the Chan et al. and Darko et al. They have made a series of researches on GBTS adoption, from the perspective of the world [13,18] and American experts [20]. Those papers also make a global analysis of the barriers [37] and driving factors [38] in the adoption of GBTS. For research in developing countries, they mainly extend the scope to Ghana [21]. As Darko and Chan [37] point out, there is a gap in the study of barriers on the adoption of GBTS in developing countries, which needs to be bridged to better promote the adoption and development of GBTS. The current research is completely focused on the stakeholders’ adoption behavior and solely use descriptive statistical analysis; there is an absence of targeted in-depth research from the perspective of design units in developing countries.
To fulfill this gap, the aim of this paper is to determine the key factors that affect the adoption of GBTS by Chinese design companies and to reveal its potential mechanism by establishing a structural equation model. The valid theoretical model gives an effective method to explore the mechanism of GBTS adoption in practice. Based on inferential statistics, its reliability and validity can be tested. Structural equation modeling is the logical coupling of regression analysis and factor analysis, and has been widely used in architectural, engineering and construction (AEC) areas [39]. Compared with a traditional method such as regression, Structural Equation Modeling(SEM) is a multivariate statistical technique that combines factor analysis and path analysis. It can reveal the relationship between latent variables and the measured variables, allowing the measurement errors of independent and dependent variables and estimating factor structure and factor relationship [40]. The results of this study can contribute to the improvement of other scholars’ research on GBTS adoption through filling research gaps in green building knowledge in developing countries. Furthermore, due to the important position and the role of design units in the adoption of GBTS, it is more conducive to the effective adoption and promotion of GBTS. Simultaneously, it provides a valuable reference for other stakeholders to cooperate better with the design organization and to take appropriate measures to alleviate the obstacles to the adoption of GBTS. Thus, it promotes the adoption of GBTS.
The remainder of the paper is split into four sections. In Section 2, some relevant research on GBTS is summarized and divided into five components. Then, in Section 3, the research method, which includes data collection and analysis, is introduced. In Section 4, exploratory factor analysis (EFA) and confirmatory factor analysis (CFA) are used to analyze the data. In Section 5, there is a detailed discussion of the statistical analysis and the conclusions and implications of the research are presented.
2. Literature Review
On account of the important role green building plays in environmental protection and resource conservation, more and more people have started to pay attention to it. This has been regarded as an effective solution to improve energy efficiency in the construction industry. A great deal of scholars have studied green buildings [18,21,41]. At the same time, the use of GBTS to realize green building has also been put forward and studied continuously. An increasing number of construction enterprises rely on GBTS diffusion to improve the profitability of the construction enterprises to ensure the competitive edge of enterprises [22,42]. In 1994, Braun and Wield proposed the notion of “Environmentally Sound Technology” for the first time. They defined it as “A general term for reducing environmental pollution, natural resources, raw materials, and energy consumption in processes, technologies, and products”. It incorporates recycling technology, purification technology, pollution control, ecological technology, detection and evaluation technology and many other related technologies related to environmental protection [43]. Scholars have not yet reached an agreement on the connotation of green technology. Cook suggested that all products, services or processes that use fewer resources than current standards and generate less pollution to create value can be named green technologies [44]. There are also related documents that have studied the meaning of green technology in different ways from the point of teleology andprocess theory. The respective points of view are as follows. Teleology is the perspective that green technology is the one that has been used to reduce marginal external costs of production or minimize ecological negative effects [45]. Additionally, Allan et al. proposed that green technology was characterized by reducing environmental externalities [46]. On account of process theory, green technology covers production, resource utilization, product development, management, marketing, accounting, procurement logistics, etc. [47]. Haden and Oyler believed that green technology was a process of organizational innovation and application through continuous learning, development and setting environmental goals and strategies to achieve sustainability, less pollution and competitive advantages [48]. In addition, some scholars extend from “green technology” to “green technology innovation” and interpret the meaning of green technology in combination with the specific innovation field. Rundquist believed that green technology innovation is the application and development of new product and crafts. It aims to protect the environment and reduce emissions throughout the production process and the product life cycle [49]. Sang-Ho et al. proposed that green technology innovation was gradually spreading from traditional renewable energy technology, clean energy technology and other similar environment-friendly technologies to information technology, construction technology, network technology and so on [50]. It has also been indicated by some scholars that green technological innovation, compared with the conventional technological innovation based on the excessive pursuit of economic benefits at the expense of the environment and resources, has received more attention because of its compatibility with sustainable development [51]. Ahmad et al. [31] divided GBTS into seven categories: indoor lighting technology, control technology, energy-saving and water-saving technology, renewable energy technology, energy and water recovery technology, air quality assurance technology and comfort zone temperature related technology.
Based on the above literature, we can see that there is no uniform definition on the concept of GBTS. However, we can deduce the common features as follows: (1) the aim is to reduce the environmental load and pursue sustainable development. (2) The essence is the process, technology, measures, etc., that are used to achieve the green goal. Under the context of this study, the construction industry advocates the concept of sustainable development. The adoption and application of GBTS are undoubtedly an important way to realize green buildings. This paper focuses on the designer’s willingness to adopt the GBTS during the design process. Hence, GBTS are defined in the construction industry according to the definition of green building in China [52]. After referring to the literature on the adoption of GBTS in recent years [31,53], we define GBTS in this paper as follows: it is the general term of the products, measures, processes and technical means to be employed to accomplish the aim of “energy saving, water saving, land saving, material saving and one environmental protection” during the design process.
The theory of planned behavior is classical in social psychology, and behavioral intention is one of the primary determinants of behavior [54]. Ajzen and Fishbein [54] proposed that any variable that affected a behavior should influence its intention through a behavioral attitude. The behavioral intention of designers is a key factor that affects their adoption behavior of GBTS, and then affects organizational effectiveness [55,56]. Therefore, the theory of planning behavior offers a useful theoretical framework for the research on the adoption behavior of GBTS.
There are many key factors in the adoption and successful implementation of GBTS. Based on the above-mentioned literature review, these factors can be divided into five categories: knowledge structure, capability of GBTS, management support, motivation and technical defects of GBTS.
2.1. Knowledge Structure
The rich knowledge structure is an essential factor for the successful adoption of GBTS. A large number of new technology related to GBTS [57,58] will emerge over time, which requires designers to pay more attention to the new technology of green architecture. Meanwhile, they should also widen the knowledge and concept of green design [32]. The green design technology includes the selection of green building materials, the evaluation of environmental performance and the design of costs and procedure. Designers need to embed the knowledge and intent of design in the application of GBTS well [59,60]. Designers’ tasks are relevant to the different phases of the project’s life cycle and the needs of stakeholders [61,62]. Apart from meeting the basic requirements of the developers, the design unit also needs to consider other factors, such as the ability to complete the task and the risk of rework caused by the secondary design, etc. [59]. Due to the uncertainty of the choice and implementation of GBTS, it will inevitably affect the designer’s willingness to adopt GBTS [63]. Therefore, a good knowledge structure and rich experience in GBTS adoption can guarantee the rational and effective application of GBTS, and thus, reduce the secondary design and enhance designers’ willingness to adopt GBTS [64].
In addition, there is a need for other areas of knowledge. The adoption of GBTS requires designers to have a wide range of knowledge dimensions. One dimension includes the social environment, cultural concepts, aesthetic standards and engineering design knowledge of the design project, which is aimed to better select the appropriate GBTS [26]. The knowledge dimension also requires designers to have the basic knowledge of architectural engineering safety [13,57]. The realization of green building is not a single type of work or a certain link. The designers, as the master teacher, need to not merely have the green idea and technology when working on design, but should also grasp GBTS for other professional types of work, such as Heating, Ventilating and Air Conditioning(HVAC), automation, materials and so on [26]. Designers’ knowledge frame can ensure the effective transformation of GBTS. It can also eliminate the potential unfavorable factors and losses, such as the cost increase and the duration extension caused by all project stakeholders (owners, construction units, upstream Research and Development (R&D) units, etc.), including the designer organizations. If the designer has a good knowledge structure, it can better implement the adoption of GBTS. Therefore, we propose Hypothesis 1 as follows:
Hypothesis 1 (H1).
Designers’ knowledge structure has a positive impact on their adoption of GBTS.
2.2. GBTS Capability
As an innovative model, GBTS requires effective cooperation among stakeholders in construction projects to make sure its successful adoption [65]. Project teams should have experience in collaboration, documentation and application of GBTS. Lack of interest and the ability to adopt GBTS among project team members may affect the success of its adoption [34,61,66]. However, construction process is different in each sector. As the buildings are unique, high cost, time lasting and fixed with complex environment, it has unstable and fragmentary processes [67]. During the construction process, the relationships among stakeholders are based on temporary collaboration. As the final benefits are for the end-users, suppliers and contractor always lack interest in adopting GBTS. This has led to a lack of incentive in the investment on GBTS adoption. Designers’ adoption behaviors are influenced by the adoption ability and capability of other stakeholders. Darko and Chan [12] pointed out that members of the project team cannot master the GBTS well, and some even lacked the basic GBTS training and education needed to meet their daily work needs. This leads to the fact that GBTS are not well adopted among project stakeholders. Consequently, designers’ adoption intention for GBTS is limited by the ability of other related stakeholders. Moreover, although the design team is the key stakeholder for the adoption of GBTS, they often feel a sense of powerlessness, as they do not have enough power to push the adoption of GBTS [68]. Designers have a large interest in the adoption of GBTS. However, their power is limited at the final decision. Additionally, they may focus on other aspects rather than GBTS. It can see that the more power the architect has, the easier it is to adopt GBTS [69].
Professional knowledge and expertise are crucial factors in the successful adoption of GBTS. The trend of adoption of GBTS has created a growing and urgent demand for green technology talents and workers. In order to achieve high performance results in an organization, skilled workers are needed in each sector [38]. Having designers with rich green experience and green building knowledge within the organization can reduce the difficulty and ensure smooth application of GBTS in the whole building’s life cycle [21,64]. Lack of employees with necessary skills, expertise and knowledge will make it difficult for an organization to adopt GBTS [20]. Providing extensive training for GBTS can avoid potential errors in the adoption of GBTS and difficulties in the alteration of stakeholders [70]. Therefore, if a project team has a good green building ability, designers are more likely to adopt GBTS in their work. Therefore, we propose the Hypothesis 2 as follows:
Hypothesis 2 (H2).
The GBTS capabilities of a project team will have a positive impact on the designers’ intention to adopt GBTS.
2.3. Management Support
In reality, the adoption of GBTS requires the cooperation of other stakeholders, the procurement of equipment and the introduction of technology. It will inevitably cause the increase of costs and bring about the uncertain risk of adoption, which affects the designers’ willingness of adoption. At this point, the designers’ adoption behavior can be guided to the desired idealistic direction of the organization [71] due to its support. Organizational support is an important criterion for guiding and improving the ability of designers to apply and adopt GBTS [33,37]. Without the support and commitment of top management, it would not be possible to successfully implement GBTS [72,73]. Given that GBTS are a top-down approach, senior managers have greater influence and authority than lower-level designers in the company [74]. Commitments, leadership and support from senior management and the board of directors are key conditions for the adoption of GBTS. Top management support ranges from corporate strategy to basic daily activities [48,53]. Lack of senior management support poses a major obstacle to the success of the GBTS project [13,22].
Organizational support is generally divided into two categories. One is the material resources provided by the organization to employees, such as training and rewards. The other is the spiritual support offered by the organization to employees like praise and recognition [75]. In order to achieve the objective of green design, organizations encourage designers to learn the latest green technology-related achievements and industry developments through proactive training meetings or various promotional activities [12,56]. For example, the organization formulates the design reward rule and on the like on GBTS adoption behavior. To broaden the employee’s horizons, it encourages the staff to positively participate in the topic industry development forum regarding energy conservation and the environmental protection, the special seminar salon, the green product promotion meeting and so on. As a consequence, organizational support is bound to deepen designers’ mastery of GBTS and generate the idea of adopting GBTS. This will promote designers’ perceptions about the central role of GBTS in design action, and impel designers’ active adoption and innovation of GBTS. Therefore, we propose the Hypothesis 3 as follows:
Hypothesis 3 (H3).
Management support has a positive impact on the adoption of GBTS by designers.
2.4. Motivation
The motivation is another important factor affecting the adoption of GBTS, which mainly consists of internal and external motivation [30]. The internal motivation refers to the degree of willingness of the designers to adopt GBTS. This is primarily due to the trade-offs among the technological benefits, costs and other perceived benefits of technology adoption [76]. Designers are motivated by the adoption of novel technologies and the success of their peers, and will take the initiative to learn new green technologies and current development in the construction industry.
The external motivation is caused by the requirements for the adoption of GBTS, as stipulated in the contract and that of other interested stakeholders [26,32]. It mainly stems from the pressure of peers in the green construction industry chain, partner requirements and other stakeholders’ influence [32,38]. For example, there is an increase in demand for GBTS of developers, in particular requirements in bidding campaigns in certain public projects [19,36]. Therefore, we propose the Hypothesis 4 as follows:
Hypothesis 4 (H4).
The motivation has a positive impact on the adoption of GBTS by designers.
2.5. GBTS Defects
Many studies have analyzed the obstacle that affects the adoption of GBTS [10,11,12,13,14,15]. The research shows that the cost of GBTS is one of the major defects that impede its adoption, and it has been a crucial and sensitive factor affecting the adoption of GBTS both in developing and developed countries. As we all know, the cost of GBTS is much higher than traditional technology [57,77]. Many practitioners believe that the application of GBTS can increase project costs by 10–20% [53]. For example, as a green substitute for conventional plywood, compressed wheat planks cost about 10 times as much as traditional plywood [34]. The high cost of adopting GBTS can greatly hinder the adoption of GBTS. Moreover, there are many risks and uncertainties in adopting GBTS, such as product embedding adjustment, secondary development of process design, increasing task difficulty and so on. This will make the designers hesitate to adopt GBTS.
Research has shown that the lack of a GBTS databases and information also hinders the adoption of GBTS. Practitioners in the construction market find it difficult to collect information and data related to GBTS. Moreover, there are existing problems, such as shortage of GBTS suppliers and the mismatch of technology [53]. At present, the green building market in China is imperfect, and there are problems such as poor applicability of GBTS and lack of demonstration projects, which make developers and designers fail to acquire adequate information on GBTS. Darko et al. [20] pointed out that the provision of better information is essential for the adoption of GBTS.
The difficulty of adopting GBTS caused by the complexity of green building products can easily result in the phenomenon of “knowing but not needing”. Designers’ perceptions of the usefulness of GBTS do not significantly predict its willingness to adoption. Designers have to face a lot of information processing work from the beginning period, as there are a wide variety of individual items or products in green buildings. Therefore, we propose the Hypothesis 5 as follows:
Hypothesis 5 (H5).
The GBTS defect has a negative effect on the designers’ willingness to adopt GBTS.
Based on the literature review above, we identified five factors that influence the adoption or non-adoption of GBTS by designers. They are: the knowledge structure of GBTS, the capability of GBTS, management support, the motivation and the technical defects. In the following sections, the above-mentioned five hypotheses are tested by the established structural equation model.
3. Research Method
3.1. Data Collection
Based on a comprehensive review, five factors are identified to measure the willingness of design units to adopt GBTS. The questionnaire was designed in line with identified factors, and it was discussed and revised repeatedly by five experts in the field of construction: two university professors, two senior professors in engineering from the China Institute of Architectural Design and Research and one chief engineer from the China Institute of Building Standards Design. They all have more than 20 years of work experience in the construction area and are registered with the Ministry of Housing and Urban-Rural Construction of the People’s Republic of China. In addition, a pilot survey was carried out and revised via 19 designers to ensure the feasibility of the original questionnaire. In order to improve the response rate and ensure the accuracy and understandability of the questionnaire, the design units with the Grade A qualification in Beijing were issued by means of personal distribution. In China, the Ministry of Housing and Urban-Rural Construction will divide the design companies into three different grades, A–C, according to the evaluation index. Grade A qualification design firms have the best architects and the required qualifications to do different types of buildings design work. However, the other two levels of design firms do not have the authorization to do so. Beijing is the capital of China, and the design organizations are developing rapidly for the new technology adoption and application, which provides the condition for the effective investigation of the questionnaire. The final questions in the questionnaire are in the Appendix A. The survey was conducted between 25 June 2018 and 12 August 2018, and respondents answered questions on a five-point Likert 5 scale, in which one means strong disagreement and five means strong agreement. The final questionnaire consisted of two parts, with the first part being the basic information of the respondents and the second part being the GBTS adoption questions. We distributed 400 copies, and recovered 326 copies. We received 314 valid questionnaires, and the effective rate of the questionnaire was 78.5%. Table 1 shows the demographic information obtained by the questionnaire. Among the respondents, 68.8% were male and 31.15% were female, with most respondents aged 30–40, accounting for 60.2% of the total. People with a graduate and postgraduate degree and above were dominant, accounting for 58.0% and 35.7%, respectively. This indicates that the surveyed designers have a high level of education. In the design work category, civil buildings (49.4%) and public buildings (36.9%) were the main design category.
3.2. Data Analysis
Sample data were randomly divided into two half samples. For the upper part of the sample, we used SPSS software to make the exploratory factor analysis (EFA) and analyze the reliability. For the lower part of the sample, we utilized a confirmatory factor analysis (CFA) and analyzed the reliability. Finally, through the Amos software, the whole sample was analyzed to figure out the influence factors of the GBTS adoption on the design unit.
4. Research Results
4.1. The Upper Sample
4.1.1. Exploratory Factor Analysis (EFA)
Exploratory factor analysis (EFA) is a technique used to find out the essential structure of multivariate observation variables and to cope with dimensionality reduction. EFA can integrate variables with intricate relationships into a few core factors [78]. It always uses the Kaiiser-Meyer-Olkin (KMO) and Barlett’s Test of Sphericity to test the sample’s adequacy [79]. The Bartlett’s test is to prove whether all variables are independent. If there is no refusal, there is no need for further analysis [80]. The value of KMO is between 0 and 1. The KMO value should be at least greater than 0.6 [81]. The result of the analysis is in Table 2, and the KMO value is 0.8671, which is higher than 0.6. This signifies that it is fit for the exploratory factor analysis [82]. The Bartlett’s Test of Sphericity is 2163.148 when the significance value is 0.000, which suggests that the correlation matrix is not the identity matrix. The results show that the data is acceptable and can be further analyzed [82].
The data were analyzed with SPSS software, and the results are shown in Table 3. The 23 measurement items for the adoption of GBTS were split into six factors with an explanation of the cumulative variance accounting for 74.237% of the overall sample interpretation. was is about 60 percent higher than the cumulative proportion of the variance criterion [83,84], which means the analysis result meets enough explanation of total variance.
Table 4 shows the results of rotated component matrix. It is recommended that variables with factor loadings are 0.6 or higher [83,85]. The factor loadings are between 0.698 and 0.877, which fulfills the basic requirements. It can be seen in Table 4 that all factors have good clustering, and each variable belongs to only one factor.
4.1.2. Reliability Analysis
Cronbach’s alpha is used to measure the reliability of the measurement scale in a survey questionnaire to assess the data’s reliability. The coefficient value of the Cronbach’s alpha ranges from 0 to 1, and should not be less than 0.70 [86]. The higher the Cronbach’s alpha value, the more reliable the adopted scale of measurement [87,88]. Table 5 shows the results of the Cronbach’s alpha value: all the Cronbach’s alpha values are above 0.7, which means the measure scale is reliable.
4.2. The Lower Sample
4.2.1. Confirmatory Factor Analysis (CFA)
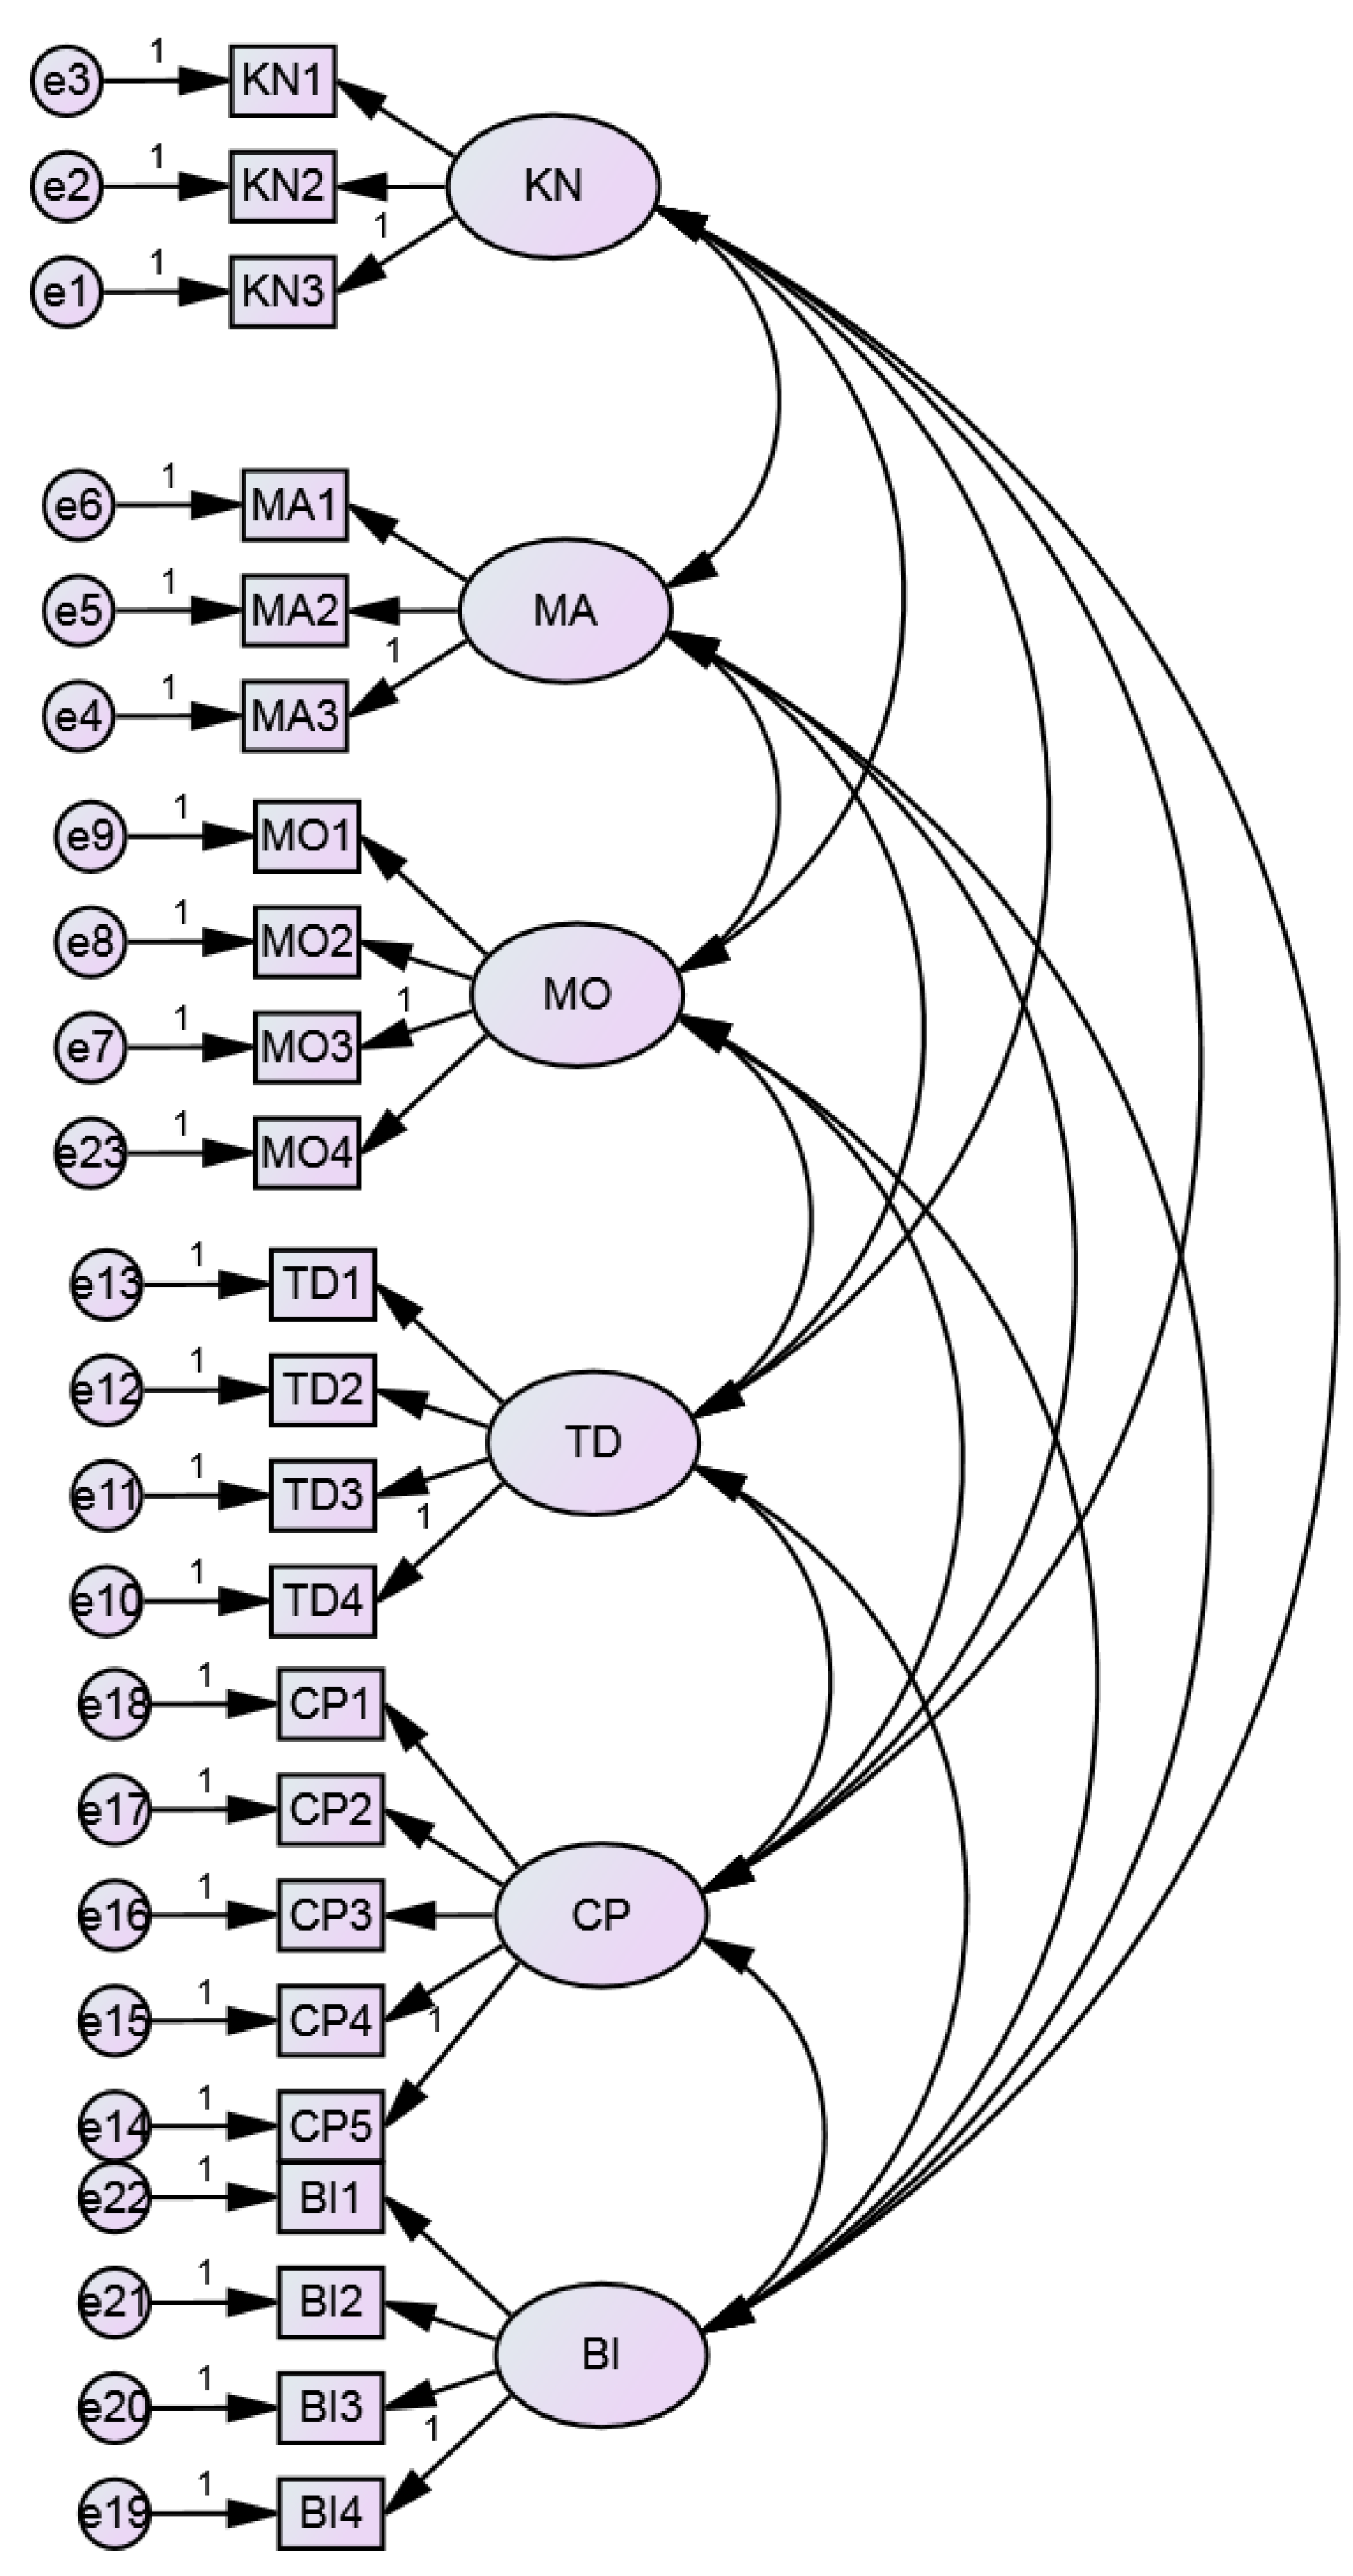
In order to ensure the structural correctness of the recognition factor, CFA is applied to verify the sample. The underlying factor structure of the hypothesis is shown in Figure 1, and the fitting results of the indicators corresponding to Figure 1 are demonstrated in Table 6. Both the absolute fit index and the incremental fit index of the model meet the basic criteria, indicating that the model is supported.
4.2.2. Reliability Analysis
4.3. Analysis of the Total Sample
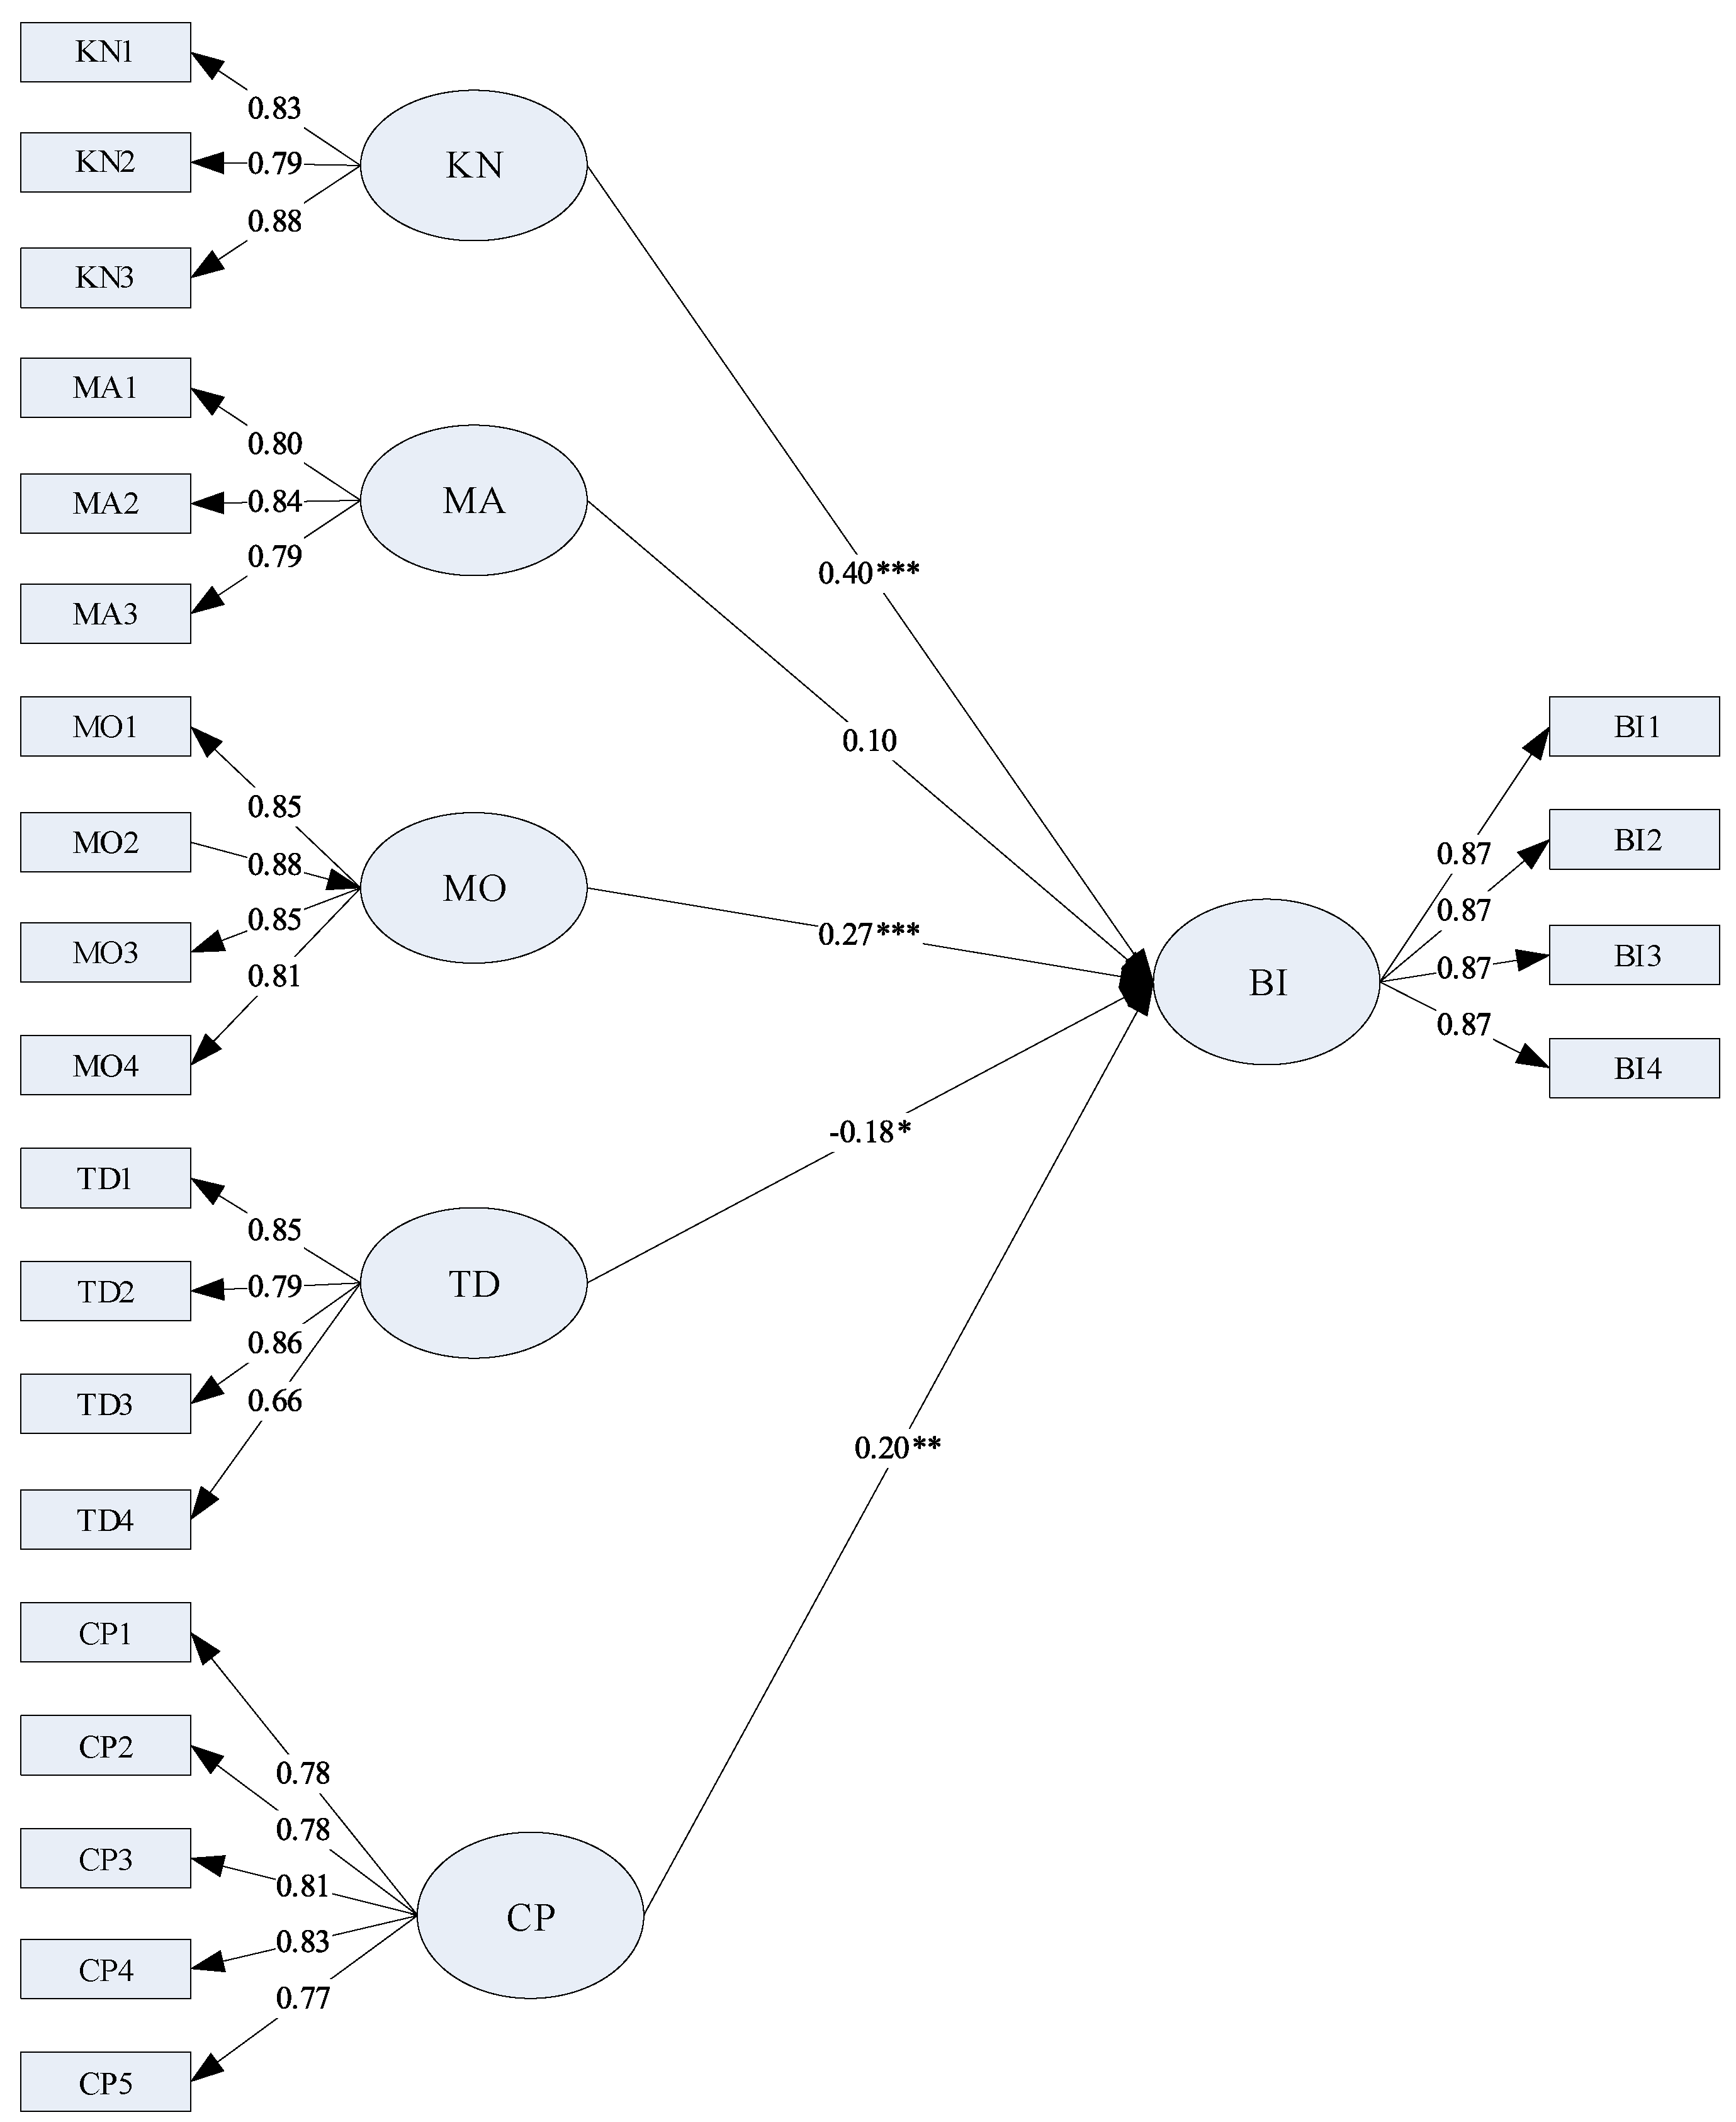
According to the above research hypothesis, the structural equation model is shown in Figure 2. To simplify the representation of the model, the basic abbreviations of the associated surfaces and variables are shown in Table 8. The fitting analysis results of the model are reflected in Table 9. The increment fit indexes and absolute fit indexes involved meet the requirements of the parameters, showing the rationality construction of the model.
The parameter coefficients of each path are shown in Figure 2 and Table 10. Factors like the motivation, knowledge structure, GBTS capability and GBTS defects are significant at 0.001 levels, 0.001 levels, 0.01 level and 0.05 level. Hypothesis H1, H3, H4 and H5 are confirmed. Factor manager support is not significant at 0.001, and hypothesis H2 is rejected.
5. Discussion
Green buildings are vertical joint production activities with different stakeholders, involving construction, design, supply of green materials, equipment, etc. Designers are the interface unit and technical intermediaries that undertake upstream products in the customer network. Designers’ willingness to adopt GBTS and the behavior of optimizing green design according to local conditions play a pivotal role in connecting all stakeholders in the project to respond together. Therefore, it is important to reveal the reasons that affect the designers’ initiative in green building design. It is a practical problem to be solved urgently to make architectural design play an important role in the development of green building. To promote the effective adoption and better application of GBTS in green building practice, we find it essential to have a better understanding of the behavior of designers in adopting GBTS. To achieve this goal, the basic method of the structural equation model was adopted in this paper to carry out the investigation and research from the perspective of architectural designers in the design company. The framework of the model was based on the Theory of Reasoned Action (TRA) theory and was verified by the SEM structural equation model.
According to the research results of the model, the motivation of designers is one of the important factors influencing the adoption of GBTS. The incentive of adopting GBTS covers the application efficiency and economic benefit of GBTS. Odysseus et al. [89] pointed out that energy saving, resource saving and waste reduction are imperative driving factors for sustainable buildings. Windapo and Goulding [90] showed that the adoption of GBTS can save costs and increase productivity, and it can also establish a good corporate image and gain the competitive edge in the construction market. To ensure the adoption and diffusion of GBTS, technology developers should thus ensure the effectiveness and economic benefits of GBTS [13,24,41]. Government departments should start demonstration projects to demonstrate the results, efficiency and economic value of GBTS adoption. They should also select green building materials and apply related technology in public procurement. At the enterprise level, design units who play an important role in technological transformation should always follow the innovation trends of the construction industry, encouraging employees to make bold attempts and innovate and integrate design. Design companies should create a good supporting atmosphere to lead the architectural design to energy conservation, environmental protection and green development direction, actively strengthening and meeting the sustainable development of the construction market to enhance the competitiveness of the organization.
The second important factor affecting the adoption of GBTS is the defects of GBTS. The difficulty of adopting green building products caused by the complexity of green building products can easily generate the phenomenon of “knowing but not using”. Even if the designers perceive the usefulness of GBTS, their willingness to adopt GBTS will still be hindered. Additionally, there is a mismatch between the suppliers and adopters of GBTS in the construction market. Academic institutions have produced abundant GBTS that fail to meet the needs of users, and design units need to carry out secondary designs when adopting them [13,24,41]. In view of this problem, government departments should actively support the transformation of scientific research achievements of GBTS [41], and strengthen the matching of the research results of academic institutions with the adoption of design units [41]. They should reduce barriers to the adoption of GBTS on both supply and demand sides [25,91,92] as well. Post-evaluation (Post Occupancy Evaluation, (POE)) is a set of systematic evaluation procedures and methods for the performance of buildings and built environments through certain program methods. It is about whether the actual use of the building meets the intended vision and the requirements and recommendations of the user after use [93]. POE has developed into a set of mature operation management feedback mechanism in European and American countries since 1960s, which has played a very important role in the benign development of the construction and planning and design industry [94]. The application of POE in the design of green building products is also the direction of development in the future [95]. In China, there is a situation where designers focus too much on design results and ignore design processes and methods. By using POE to feedback information on the architectural design, feedback of users’ demand and dissatisfaction with the process of building use can improve architectural design methods and theories, and achieve the most fundamental purpose of green building design [96]. Moreover, POE-related databases will enhance the adoption and application of GBTS by designers.
Cost barriers to GBTS are closely linked to other barriers, including lack of government incentives, financing plans, awareness of GBTS and its benefits. Although practitioners are expected to have a lot of experience, they will find it unavoidable to deal with cost barriers [18]. Incentives measurements can offset the additional costs involved in adopting GBTS. Moreover, demonstrating the true cost and benefits of GBTS adoption can also overcome cost barriers and help have successful green building projects. For the adoption behavior of design units, upstream units should make commitments of preferential price and environmental risk sharing, etc. to key customers. Additionally, they can give certain innovation space and interest incentives within the scope of the contract. These measures can fully motivate designers’ innovation and effectively reduce the risk of adopting GBTS. Additionally, the supplement of information such as product attributes, processes and usage exchanges among designers, builders, suppliers of green materials and equipment and other stakeholders can strengthen the knowledge and adoption behavior of GBTS of designers.
In order to accelerate the adoption and promotion of GBTS, it is recommended that a comprehensive national database or an information system should be developed. It is essential to provide the public with timely, accurate and up-to-date information on GBTS. In addition, industry associations can play a vital role in sharing relevant GBTS information between construction companies and government departments [97]. At the same time, establishment and popularization of third-party technical advisory services are also welcomed and encouraged [41].
Another major factor affecting designers’ adoption behavior of GBTS is the capability of the project team. The adoption of GBTS by the design organization requires the cooperation and support of other stakeholders in the project team. However, there is a general phenomenon concerning lack of knowledge and understanding of GBTS in the construction industry at present [18]. The GBTS capacity of the project team can be enhanced by providing relevant organizational education and training programs.
It has been proven that the design team has a powerful and important influence over the construction processes compared to other relative stakeholders [98]. This means that the inter-firm relationship between the design team and contractor or other stakeholders is important on the GBTS adoption. As a result, an effective organization model with favorable inter-firm relationship among stakeholders is useful for the GBTS adoption and diffusion [99].
Varun et al. [100] pointed out that the guidelines for green buildings are important measures to enhance the awareness and knowledge of developers, contractors and other participants about GBTS. Chan et al. [101] indicated that besides the basic policy guidance of government departments, both trade associations and non-governmental organizations can expand the range of education and publicity measures. In addition, from the long-term point of view, awakening the public awareness and enhancing participation on GBTS are important measures to enhance the social appeal of GBTS [77,102] and to improve the adoption and popularization of GBTS. Therefore, in order to better solve the GBTS adoption behavior of the designers, we should strengthen the GBTS-related technical ability of other relevant subjects such as green building materials suppliers, developers, construction enterprises and other relevant subjects with measurements from government, trade associations and non-governmental organizations.
In the Chinese construction market, designers often pursue “fast” standard drawing according to the traditional working mode. It lacks GBTS learning and adoption initiative, and support from organizations, making it difficult to acquire the new technology immediately and respond to green action in time. This finding is associated with phenomena in Malaysia [103] and India [104]. Arditi and Gunaydin [105] mentioned that, in order to ensure the quality of the building, the construction technology used by the contractor must be familiar to design professionals. Zhang et al. [106] pointed out that technical difficulties and lack of familiarity with GBTS may lead to delays in the design and construction of green building projects. Designers’ unfamiliarity with GBTS may, therefore, lead them to accept merely traditional construction projects involving technologies they are already most familiar with. In order to improve the knowledge dimension of designers, it is necessary to alter the cognition attitude of designers to GBTS. The design units should improve the designers’ cognition of GBTS from the angle of organizational support and reduce the designers’ reliance on traditional architectural technology. They should also discard the wrong idea of “green = high cost” and “technology piling up”, and promote the enthusiasm of active adoption and application. Secondly, at the educational level, design units should zealously promote and enrich designers’ innovative consciousness and knowledge of GBTS through enterprise meeting training, publicity activities and so on. They ought to encourage designers to participate in GBTS projects extensively to enrich their experience in the green building project, and supervise and reward the designer’s GBTS behavior through the incentive assessment measures such as design reward rules. In addition, designers should consider the professional needs and personal development, and set up a correct aesthetic value. Furthermore, they should improve the sense of social responsibility, and actively improve their own technical ability, as well as innovative awareness, and enrich personal knowledge.
It should be noted that there is no statistical significance of management support in influencing designers’ adoption behavior of GBTS. This is inconsistent with previous studies that have internationally shown the influential role of management support in GBTS applications [20,21,97]. One explanation is that designers in Beijing are aware of the advantage of GBTS in improving their competitiveness, and they are already familiar with the use of GBTS. This is because they have more opportunities and access to GBTS in consideration of the convenient location and the company. With or without the support of management, their daily experience is often about actively learning and adopting GBTS. Another explanation is that the designers in the sample come from Grade A quality architectural design companies. These design companies have a more expanded vision and thinking in the new technology such as GBTS applications; compared with other low-grade design units, they have more practical experience in GBTS applications. However, this cannot indicate that management support is inconsequential in the adoption of GBTS. In China’s present construction market, the amount of small and medium-sized, low-qualified design units are numerous. The influence of management support on the adoption of GBTS in small and medium-sized design units with low qualification is worth further studying. In addition, China has a vast territory, and certain areas, such as central and western regions and northeast regions, are limited to the level of economic development and technical capabilities. Thus, the adoption behavior of GBTS by design units with low qualification levels and different areas are worthy of further study in the future.
6. Conclusions
In the implementation of sustainability in the construction industry, the adoption of GBTS in recent years is given a lot of attention around the world. There are still many problems and obstacles in the adoption and promotion of GBTS. The design unit plays a key role in the transformation and application of GBTS. Therefore, analyzing the adoption behavior of GBT from the perspective of the design unit can help better comprehend factors affecting the adoption of new technologies and promote the diffusion of GBTS in the field of construction. The research and development of this model also provides a new research technique for other related subjects in the future. Due to space constraints, this paper simply studied the adoption of GBTS by design units in the field of architecture. Future research should continue the adoption of GBTS and other areas by developers, builders, etc.
Author Contributions
W.W. came up with this research idea, conducted literature review, performed the theoretical framework model. X.D. contributed the analysis tools and analyzed the data. Y.S. contributed to data collection and participated in the data analysis. S.Z. provided some comments and supplemented the research framework.
Funding
This research received no external funding.
Acknowledgments
This research was partly supported by the Project of the National Thirteenth Five-Year Research Program of China (2016YFC0701606). The authors are grateful to the people who helped undertake the research and improve this article. We would also like to thank the editors and reviewers of Sustainability for their insightful comments on this research.
Conflicts of Interest
The authors declare no conflict of interest.
Appendix A
Questionnaire used in the survey.
| Variables | Items | Measurement Items | 1 | 2 | 3 | 4 | 5 |
| Behavior Intention | BI1 | We are willing to introduce GBTS into our design work. | |||||
| BI2 | We are always very active in trying to adopt GBTS in our design work. | ||||||
| BI3 | We will advise project partners to apply green processes or equipment. | ||||||
| BI4 | We will often introduce GBTS or processes into our design work in the future. | ||||||
| Management support | MA1 | Senior managers expect staff to use GBTS to complete design work. | |||||
| MA2 | Employees will be rewarded for completing design work by adopting GBTS. | ||||||
| MA3 | Senior managers take the initiative to provide GBTS education and training to the employees. | ||||||
| GBTS capability | CP1 | Collaborators agree with our design’s idea of adopting GBTS. | |||||
| CP2 | If necessary, the relevant units will make efforts to provide assistance for the introduction of our GBTS design. | ||||||
| CP3 | Almost all conflicts arising from the introduction of GBTS or processes are effectively resolved. | ||||||
| CP4 | Stakeholders in a project embedded in a GBTS design have equal status and reasonable distribution of benefits. | ||||||
| CP5 | Our design company and working partners often have regular communication activities on GBTS (E. g., green technology and products promotion sessions, seminars, etc.). | ||||||
| Motivation | MO1 | Industry Management requires to actively adopt GBTS. | |||||
| MO2 | The relative cooperators request the design unit to adopt GBTS. | ||||||
| MO3 | GBTS can improve the quality of construction projects. | ||||||
| MO4 | GBTS are helpful to sustainable development of construction industry. | ||||||
| Knowledge Structure | KN1 | When GBTS are introduced into design work, we have the knowledge and ability to do it. | |||||
| KN2 | Having enough knowledge of green materials or equipment will make it easier for me to adopt GBTS. | ||||||
| KN3 | Comprehensive knowledge of other professions will help me to adopt GBTS. | ||||||
| GBTS Defects | TD1 | GTBS or integrated process design can take a lot of time to work. | |||||
| TD2 | The introduction of GBTS in design usually involves cost, technical concerns, etc. | ||||||
| TD3 | Using GTBS may not have the desired effect. | ||||||
| TD4 | The integrated GBTS design brings additional potential loss risk to project participants. |
References
- Ignatius, J.; Rahman, A.; Yazdani, M.; Saparauskas, J.; Haron, S.H. An Integrated Fuzzy Anp-Qfd Approach for Green Building Assessment. J. Civ. Eng. Manag. 2016, 22, 551–563. [Google Scholar] [CrossRef]
- IPCC (Intergovernmental Panel on Climate Change). Climate Change 2014: Synthesis Report; IPCC: Geneva, Switzerland, 2014. [Google Scholar]
- Sandanayake, M.; Zhang, G.M.; Setunge, S.; Li, C.Q.; Fang, J. Models and method for estimation and comparison of direct emissions in building construction in Australia and a case study. Energy Build. 2016, 126, 128–138. [Google Scholar] [CrossRef]
- UNEP. Sustainable Buildings and Climate Initiatives. 2011. Available online: http://www.docin.com/p-1456121389.html (accessed on 27 March 2017).
- Wang, H.; Zhang, X. An analysis on the resource consumption in the Chinese construction industry. Constr. Econ. 2008, S1, 7–11. [Google Scholar]
- Shen, L.Y.; Yan, H.; Fan, H.Q.; Wu, Y.; Zhang, Y. An integrated system of text mining technique and case-based reasoning (TM-CBR) for supporting green building design. Build. Environ. 2017, 124, 388–401. [Google Scholar] [CrossRef]
- USEPA. Definition of Green Building. 2016. Available online: https://archive.epa.gov/greenbuilding/web/html/about.html (accessed on 28 March 2017).
- Hwang, B.G.; Zhu, L.; Ming, J.T.T. Factors Affecting Productivity in Green Building Construction Projects: The Case of Singapore. J. Manag. Eng. 2017, 33, 04016052. [Google Scholar] [CrossRef]
- World GBC. What Is Green Building? Available online: https://www.worldgbc.org/what-green-building (accessed on 1 September 2017).
- Vyas, G.S.; Jha, K.N. Benchmarking green building attributes to achieve cost effectiveness using a data envelopment analysis. Sustain. Cities Soc. 2017, 28, 127–134. [Google Scholar] [CrossRef]
- Hwang, B.G.; Zhu, L.; Tan, J.S.H. Green business park project management: Barriers and solutions for sustainable development. J. Clean. Prod. 2017, 153, 209–219. [Google Scholar] [CrossRef]
- Darko, A.; Chan, A.P.C. Strategies to promote green building technologies adoption in developing countries: The case of Ghana. Build. Environ. 2018, 130, 74–84. [Google Scholar] [CrossRef]
- Chan, A.P.C.; Darko, A.; Ameyaw, E.E. Strategies for Promoting Green Building Technologies Adoption in the Construction Industry-An International Study. Sustainability 2017, 9, 969. [Google Scholar] [CrossRef]
- Yuan, Y.P.; Yu, X.P.; Yang, X.J.; Xiao, Y.M.; Xiang, B.; Wang, Y. Bionic building energy efficiency and bionic green architecture: A review. Renew. Sustain. Energy Rev. 2017, 74, 771–787. [Google Scholar] [CrossRef]
- Liu, Y.M.; Guo, X.; Hu, F.L. Cost-benefit analysis on green building energy efficiency technology application: A case in China. Energy Build. 2014, 82, 37–46. [Google Scholar] [CrossRef]
- Si, J.; Marjanovic-Halburd, L.; Nasiri, F.; Bell, S. Assessment of building-integrated green technologies: A review and case study on applications of Multi-Criteria Decision Making (MCDM) method. Sustain. Cities Soc. 2016, 27, 106–115. [Google Scholar] [CrossRef] [Green Version]
- Zainul Abidin, N.; Yusof, N.A.; Othman, A.A. Enablers and challenges of a sustainable housing industry in Malaysia. Constr. Innov. 2013, 13, 10–25. [Google Scholar] [CrossRef]
- Chan, A.P.C.; Darko, A.; Ameyaw, E.E.; Owusu-Manu, D. Barriers Affecting the Adoption of Green Building Technologies. J. Manag. Eng. 2017, 33, 04016057. [Google Scholar] [CrossRef]
- Zhang, X.L.; Shen, L.Y.; Wu, Y.Z. Green strategy for gaining competitive advantage in housing development: A China study. J. Clean. Prod. 2011, 19, 157–167. [Google Scholar] [CrossRef]
- Darko, A.; Chan, A.P.C.; Ameyaw, E.E.; He, B.J.; Olanipekun, A.O. Examining issues influencing green building technologies adoption: The United States green building experts’ perspectives. Energy Build. 2017, 144, 320–332. [Google Scholar] [CrossRef] [Green Version]
- Darko, A.; Chan, A.P.C.; Gyamfi, S.; Olanipekun, A.O.; He, B.J.; Yu, Y. Driving forces for green building technologies adoption in the construction industry: Ghanaian perspective. Build. Environ. 2017, 125, 206–215. [Google Scholar] [CrossRef]
- Sheffer, D.A.; Levitt, R.E. The Diffusion of Energy Saving Technologies in the Building Industry: Structural Barriers and Possible Solutions; Collaboratory for Research on Global Projects; Stanford University: Stanford, CA, USA, 2010. [Google Scholar]
- Deng, Y.; Wu, J. Economic returns to residential green building investment: The developers’ perspective. Reg. Sci. Urban Econ. 2014, 47, 35–44. [Google Scholar] [CrossRef]
- Johansson, O. The spatial diffusion of green building technologies: The case of Leadership in Energy and Environmental Design (LEED) in the United States. Int. J. Technol. Manag. Sustain. Dev. 2012, 10, 251–266. [Google Scholar] [CrossRef]
- Kuo, C.F.; Lin, C.H.; Hsu, M.W. Analysis of intelligent green building policy and developing status in Taiwan. Energy Policy 2016, 95, 2910303. [Google Scholar] [CrossRef]
- Murtagh, N.; Roberts, A.; Hind, R. The relationship between motivations of architectural designers and environmentally sustainable construction design. Constr. Manag. Econ. 2016, 34, 61–75. [Google Scholar] [CrossRef]
- Ye, L.; Cheng, Z.J.; Wang, Q.Q.; Lin, H.Y.; Lin, C.Q.; Liu, B. Developments of Green Building Standards in China. Renew. Energy 2015, 73, 115–122. [Google Scholar] [CrossRef]
- Geng, Y.; Dong, H.; Xue, B.; Fu, J. An Overview of Chinese Green Building Standards. Sustain. Dev. 2012, 20, 211–221. [Google Scholar] [CrossRef]
- Ding, Z.K.; Zuo, J.; Wu, J.C.; Wang, J.Y. Key factors for the BIM adoption by architects: A China study. Eng. Constr. Archit. Manag. 2015, 22, 732–748. [Google Scholar] [CrossRef]
- Fox, M.; Goodhew, S.; De Wilde, P. Building defect detection: External versus internal thermography. Build. Environ. 2016, 105, 317–331. [Google Scholar] [CrossRef] [Green Version]
- Ahmad, T.; Thaheem, M.J.; Anwar, A. Developing a green-building design approach by selective use of systems and techniques. Archit. Eng. Des. Manag. 2016, 12, 29–50. [Google Scholar] [CrossRef]
- Ahn, Y.H.; Pearce, A.R.; Wang, Y.; Wang, G. Drivers and barriers of sustainable design and construction: The perception of green building experience. Int. J. Sustain. Build. Technol. Urban Dev. 2013, 4, 35–45. [Google Scholar] [CrossRef]
- Lam, P.T.I.; Chan, E.H.W.; Chau, C.K.; Poon, C.S.; Chun, K.P. Integrating Green Specifications in Construction and Overcoming Barriers in Their Use. J. Prof. Issues Eng. Educ. Prac. 2009, 135, 142–152. [Google Scholar] [CrossRef]
- Hwang, B.G.; Tan, J.S. Green building project management: Obstacles and solutions for sustainable development. Sustain. Dev. 2012, 20, 335–349. [Google Scholar] [CrossRef]
- Shen, L.Y.; Zhang, Z.Y.; Long, Z.J. Significant barriers to green procurement in real estate development. Resour. Conserv. Recycl. 2017, 116, 160–168. [Google Scholar] [CrossRef]
- Mao, C.; Shen, Q.P.; Pan, W.; Ye, K.H. Major Barriers to Off-Site Construction: The Developer’s Perspective in China. J. Manag. Eng. 2015, 31, 04014043. [Google Scholar] [CrossRef]
- Darko, A.; Chan, A.P.C. Review of Barriers to Green Building Adoption. Sustain. Dev. 2017, 25, 167–179. [Google Scholar] [CrossRef]
- Darko, A.; Zhang, C.Z.; Chan, A.P.C. Drivers for green building: A review of empirical studies. Habitat Int. 2017, 60, 34–49. [Google Scholar] [CrossRef]
- Xiong, B.; Skitmore, M.; Xia, B. A critical review of structural equation modeling applications in construction research. Autom. Constr. 2015, 49, 59–70. [Google Scholar] [CrossRef]
- Byrne, B.M. Structural Equation Modeling with AMOS: Basic Concepts, Applications, and Programming, 2nd ed.; Taylor & Francis: New York, NY, USA, 2009. [Google Scholar]
- Yin, S.; Li, B.Z. Transferring green building technologies from academic research institutes to building enterprises in the development of urban green building: A stochastic differential game approach. Sustain. Cities Soc. 2018, 39, 631–638. [Google Scholar] [CrossRef]
- Kok, N.; McGraw, M.; Quigley, J.M. The Diffusion of Energy Efficiency in Building. Am. Econ. Rev. 2011, 101, 77–82. [Google Scholar] [CrossRef] [Green Version]
- Braun, E.; Wield, D. Regulation as a Means for the Social-Control of Technology. Tech. Anal. Strateg. Manag. 1994, 6, 259–272. [Google Scholar] [CrossRef]
- Cooke, P. Cleantech and an analysis of the platform nature of life sciences: Further reflections upon platform policies. Eur. Plan. Stud. 2008, 16, 375–393. [Google Scholar] [CrossRef]
- Xia, C.; Penglu, Z. Evolutionary Game Analysis of Enterprise Green technological Innovation Diffusion. Chinas Popul. Resour. Environ. 2015, 25, 68–75. [Google Scholar]
- Allan, C.; Jaffe, A.B.; Sin, I. Diffusion of Green Technology: An Survey. Motu Econ. Public Policy Res. 2014, 14, 1–33. [Google Scholar]
- Cong, C.; Hongming, X. Study on the relationship between Enterprise external Environment, Green Management Strategy and competitive advantage: Take Environmental benefit as regulating variable. Manag. Sci. Res. 2012, 31, 129–135. [Google Scholar]
- Haden, S.S.P.; Oyler, J.D.; Humphreys, J.H. Historical, practical, and theoretical perspectives on green management: An exploratory analysis. Manag. Decis. 2009, 47, 1041–1055. [Google Scholar] [CrossRef]
- Halila, F.; Rundquist, J. The Development and Market Success of Eco-innovations: A Comparative Study of Eco-innovations in Sweden. Eur. J. Innov. Manag. 2011, 14, 278–302. [Google Scholar] [CrossRef]
- Lee, S.H.; Park, S.; Kim, T. Review on Investment Direction of Green Technology R&D in Korea. Renew. Sustain. Energy Rev. 2015, 50, 186–193. [Google Scholar] [CrossRef]
- Yang, D.; Chai, H. Summary of the Research on the driving factors and performance impact of Enterprise Green Technology Innovation. Chinas Popul. Resour. Environ. 2015, 25, 132–134. [Google Scholar]
- Assessment Standard for Green Building. Issued by MOHURD (Ministry of Housing and Urban-Rural Development) of China. 2014. Available online: http://www.soujianzhu.cn/Norm/JzzyXq.aspx?id=299 (accessed on 10 November 2018).
- Chan, A.P.C.; Darko, A.; Olanipekun, A.O.; Ameyaw, E.E. Critical barriers to green building technologies adoption in developing countries: The case of Ghana. J. Clean. Prod. 2018, 172, 1067–1079. [Google Scholar] [CrossRef]
- Ajzen, I.; Fishbein, M. Understanding Attitudes and Predicting Social Behavior; Prentice-Hall: Prentice, NJ, USA, 1980. [Google Scholar]
- Skibniewski, M.J.; Zavadskas, E.K. Technology Development in Construction: A Continuum from Distant Past into the Future. J. Civ. Eng. Manag. 2013, 19, 136–147. [Google Scholar] [CrossRef]
- Won, J.; Lee, G.; Dossick, C.; Messner, J. Where to Focus for Successful Adoption of Building Information Modeling within Organization. J. Constr. Eng. Manag. 2013, 139, 04013014. [Google Scholar] [CrossRef]
- Kibert, C.J. Sustainable Construction: Green Building Design and Delivery; John Wiley & Sons: Hoboken, NJ, USA, 2008. [Google Scholar]
- Ozorhon, B.; Karahan, U. Critical success factors of building information modeling implementation. J. Manag. Eng. 2016, 33, 1943–5479. [Google Scholar] [CrossRef]
- Rodriguez-Nikl, T.; Kelley, J.; Xiao, Q.; Hammer, K.; Tilt, B. Structural engineers and sustainability: An opinion survey. J. Prof. Issues Eng. Educ. Prac. 2015, 141, 04014011. [Google Scholar] [CrossRef]
- Bin Esa, M.R.; Marhani, M.A.; Yaman, R.; Noor, A.A.; Rashid, H.A. Obstacles in implementing green building projects in Malaysia. Aust. J. Basic Appl. Sci. 2011, 5, 1806–1812. [Google Scholar]
- Katie, W.; Carol, D. What is stopping sustainable building in England? Barriers experienced by stakeholders in delivering sustainable developments. Sustain. Dev. 2010, 15, 135–147. [Google Scholar] [CrossRef]
- Shaikha, A. Awareness, drivers, actions, and barriers of sustainable construction in Kuwait. Procedia Eng. 2015, 118, 969–983. [Google Scholar] [CrossRef]
- Peterson, F.; Hartmann, T.; Fruchter, R.; Fischer, M. Teaching construction project management with BIM support: Experience and lessons learned. Autom. Constr. 2011, 20, 115–125. [Google Scholar] [CrossRef]
- Ozorhon, B.; Cinar, E. Critical Success Factors of Enterprise Resource Planning Implementation in Construction: Case of Turkey. J. Manag. Eng. 2015, 31, 04015014. [Google Scholar] [CrossRef]
- Mohan, K.; Peter, E.D.L.; Mohammed, D. Integrating procurement and operational innovations for construction industry development. Eng. Constr. Archit. Manag. 2004, 11, 323–334. [Google Scholar] [CrossRef]
- Hwang, B.G.; Ng, W.J. Project management knowledge and skills for green construction: Overcoming challenges. Int. J. Proj. Manag. 2013, 31, 272–284. [Google Scholar] [CrossRef]
- Berardi, U. Clarifying the new interpretations of the concept of sustainable building. Sustain. Cities Soc. 2013, 8, 72–78. [Google Scholar] [CrossRef]
- Svenfelt, A.; Engstrom, R.; Svane, O. Decreasing energy use in buildings by 50% by 2050-A backcasting study using stakeholder groups. Technol. Forecast. Soc. Chang. 2011, 78, 785–796. [Google Scholar] [CrossRef]
- Berardi, U. Stakeholders’ influence on the adoption of energy-saving technologies in Italian homes. Energy Policy 2013, 60, 520–530. [Google Scholar] [CrossRef]
- Gan, X.L.; Zuo, J.; Ye, K.H.; Skitmore, M.; Xiong, B. Why sustainable construction? Why not? An owner’s perspective. Habitat Int. 2015, 47, 61–68. [Google Scholar] [CrossRef]
- Eigenberger, R.; Fasolo, P.M.; Davis-LaMastro, V. Effects of perceived organizational support on employee diligence innovation, and commitment. J. Appl. Psychol. 1990, 53, 51–59. [Google Scholar] [CrossRef]
- Nikas, A.; Poulymenakou, A.; Kriaris, P. Investigating antecedents and drivers affecting the adoption of collaboration technologies in the construction industry. Autom. Constr. 2007, 16, 632–641. [Google Scholar] [CrossRef]
- Tao, C.; Jochen, T. Real-time resource location data collection and visualization technology for construction safety and activity monitoring applications. Autom. Constr. 2013, 34, 3–15. [Google Scholar] [CrossRef]
- Ball, J. Can ISO 14000 and eco-labelling turn the construction industry green? Build. Environ. 2002, 37, 421–428. [Google Scholar] [CrossRef]
- Zhao, X.; Hwang, B.G.; Hong, N.L. Identifying critical leadership styles of project managers for green building projects. Int. J. Proj. Manag. 2016, 16, 150–160. [Google Scholar] [CrossRef]
- Green, S.D.; Fernie, S.; Weller, S. Making sense of supply chain management: A comparative study of aerospace and construction. Constr. Manag. Econ. 2005, 23, 579–593. [Google Scholar] [CrossRef]
- Gou, Z.; Lau, S.S.; Prasad, D. Market readiness and policy implications for green buildings: Case study from Hong Kong. J. Green Build. 2013, 8, 162–173. [Google Scholar] [CrossRef]
- Carmines, E.G.; Zeller, R.A. Reliability and Validity Assessment; Sage Publication: Newbury Park, CA, USA, 1979. [Google Scholar]
- Xu, J.Y.; He, X.H. Data Statistical Analysis and the SPSS Application; Post & Telecom Press: Beijing, China, 2003. [Google Scholar]
- Field, A.P. Discovering Statistics Using SPSS for Windows: Advance Techniques for the Begineer; Sage Publication: Newbury Park, CA, USA, 2000. [Google Scholar]
- Norusis, M.J. SPSS 16.0 Statistical Procedures Companion, 2nd ed.; Prentice Hall: Prentice, NJ, USA, 2008. [Google Scholar]
- Pett, M.A.; Lackey, N.R.; Sullivan, J.J. Making Sense of Factor Analysis: The Use of Factor Analysis for Instrument Development in Health Care Research; Sage Publication: Thousand Oaks, CA, USA, 2003. [Google Scholar]
- Hair, J.F.; Black, W.C.; Babin, B.J.; Anderson, R.E. Multivariate Data Analysis; Prentice Hall: Prentice, NJ, USA, 2009. [Google Scholar]
- Malhotra, N.K. Marketing Research: An Apply Orientation, 2nd ed.; Prentice-Hall: Upper Saddle River, NJ, USA, 1996. [Google Scholar]
- Akintoye, A. Analysis of factors influencing project cost estimating practice. Constr. Manag. Econ. 2000, 18, 77–89. [Google Scholar] [CrossRef]
- Nunnally, J.C. Psychometric Theory; McGraw-Hill: New York, NY, USA, 1978. [Google Scholar]
- Santos, J.R.A. Cronbach’s alpha: A tool for assessing the reliability of scales. J. Ext. 1999, 37, 1–5. [Google Scholar]
- Netemeyer, R.G.; Bearden, W.O.; Sharma, S. Scaling Procedures: Issues and Applications; Sage Publications: Thousand Oaks, CA, USA, 2003. [Google Scholar]
- Odysseus, M.; Ioannis, T.; Alexandra, N. Sustainable construction and drivers of change in Greece: A Delphi study. Constr. Manag. Econ. 2006, 24, 113–120. [Google Scholar] [CrossRef]
- Windapo, A.O.; Goulding, J.S. Understanding the gap between green building practice and legislation requirements in South Africa. Smart Sustain. Built Environ. 2015, 4, 67–96. [Google Scholar] [CrossRef]
- Mulligan, T.D.; Mollaoglu-Korkmaz, S.; Cotner, R.; Goldsberry, A.D. Public policy and impacts on adoption of sustainable built environments: Learning from the construction industry playmakers. J. Green Build. 2014, 9, 182–202. [Google Scholar] [CrossRef]
- Nguyen, H.T.; Skitmore, M.; Gray, M.; Zhang, X.L.; Olanipekun, A.O. Will green building development take off? An exploratory study of barriers to green building in Vietnam. Resour. Conserv. Recycl. 2017, 127, 8–20. [Google Scholar] [CrossRef]
- Preiser, W.F. Building performance assessment—From POE to BPE, a personal perspective. Archit. Sci. Rev. 2005, 48, 201–204. [Google Scholar] [CrossRef]
- Pereira, N.B.; Rodrigues, R.C.; Rocha, P.F. Post-Occupancy Evaluation Data Support for Planning and Management of Building Maintenance Plans. Buildings 2016, 6, 45. [Google Scholar] [CrossRef]
- Li, P.X.; Froese, T.M.; Brager, G. Post-occupancy evaluation: State-of-the-art analysis and state-of-the-practice review. Build. Environ. 2018, 133, 187–202. [Google Scholar] [CrossRef]
- Pati, D.; Pati, S. Methodological Issues in Conducting Post-Occupancy Evaluations to Support Design Decisions. Health Environ. Res. Des. 2013, 6, 157–163. [Google Scholar] [CrossRef]
- Shi, Q.; Zuo, J.; Huang, R.; Huang, J.; Pullen, S. Identifying the critical factors for green construction—An empirical study in China. Habitat Int. 2013, 40, 1–8. [Google Scholar] [CrossRef]
- Maciel, A.A.; Ford, B.; Lamberts, R. Main influences on the design philosophy and knowledge basis to bioclimatic integration into architectural design—The example of best practices. Build. Environ. 2007, 42, 3762–3773. [Google Scholar] [CrossRef]
- Albino, V.; Berardi, U. Green Buildings and Organizational Changes in Italian Case Studies. Bus. Strateg. Environ. 2012, 21, 387–400. [Google Scholar] [CrossRef]
- Varun, P.; Matt, S.; Sinem, K. Adoption of Green Building Guidelines in Developing Countries Based on U.S. and India Experiences. J. Green Build. 2009, 4, 158–174. [Google Scholar] [CrossRef]
- Chan, E.H.W.; Qian, Q.K.; Lam, P.T.I. The market for green building in developed Asian cities-the perspectives of building designers. Energy Policy 2009, 37, 3061–3070. [Google Scholar] [CrossRef]
- Zhang, X.L. Green real estate development in China: State of art and prospect agenda—A review. Renew. Sustain. Energy Rev. 2015, 47, 1–13. [Google Scholar] [CrossRef]
- Milad, S.; Nariman, G.; Reza, E.; Parnaz, O.; Mohd, W.; Mohd, S. The Investigation of the Barriers in Developing Green Building in Malaysia. Mod. Appl. Sci. 2013, 7, 1–10. [Google Scholar] [CrossRef]
- Luthra, S.; Kumar, S.; Garg, D.; Haleem, A. Barriers to renewable/sustainable energy technologies adoption: Indian perspective. Renew. Sustain. Energy Rev. 2015, 41, 762–776. [Google Scholar] [CrossRef]
- Arditi, D.; Gunaydin, H.M. Total quality management in the construction process. Int. J. Proj. Manag. 1997, 15, 235–243. [Google Scholar] [CrossRef]
- Zhang, X.L.; Platten, A.; Shen, L.Y. Green property development practice in China: Costs and barriers. Build. Environ. 2011, 46, 2153–2160. [Google Scholar] [CrossRef]
Figure 1.
The confirmatory factory analysis (CFA) model.

Figure 2.
The structural equation model of hypotheses. *** p-value is less than 0.001; ** p-value is less than 0.01; * p-value is less than 0.05.
Figure 2.
The structural equation model of hypotheses. *** p-value is less than 0.001; ** p-value is less than 0.01; * p-value is less than 0.05.


Table 1.
Demographic characteristics of the sample.
| Title Characteristic | Category | Numbers | Percent (%) |
|---|---|---|---|
| Gender | Male | 216 | 68.8 |
| Female | 98 | 31.2 | |
| Education | Collage and below | 20 | 6.3 |
| Graduate | 182 | 58.0 | |
| Postgraduate and above | 112 | 35.7 | |
| Age | 20–30 | 82 | 26.1 |
| 30–40 | 189 | 60.2 | |
| >40 | 43 | 13.7 | |
| Main category of undertaking project | Civil building | 155 | 49.4 |
| Public building | 116 | 36.9 | |
| Others | 43 | 13.7 |
Table 2.
Kaiiser-Meyer-Olkin (KMO) and Bartlett’s Test.
| Kaiser-Meyer-Olkin Measure of Sampling Adequacy. | 0.867 | |
|---|---|---|
| Bartlett’s Test of Sphericity | Approx. Chi-Square | 2163.148 |
| df | 253 | |
| Sig. | 0.000 | |
Table 3.
Total variance explained.
| Component | Initial Eigenvalues | Extraction Sums of Squared Loadings | Rotation Sums of Squared Loadings | ||||||
|---|---|---|---|---|---|---|---|---|---|
| Total | % of Variance | Cumulative % | Total | % of Variance | Cumulative % | Total | % of Variance | Cumulative % | |
| 1 | 7.658 | 33.294 | 33.294 | 7.658 | 33.294 | 33.294 | 3.450 | 15.001 | 15.001 |
| 2 | 3.074 | 13.366 | 46.660 | 3.074 | 13.366 | 46.660 | 3.090 | 13.433 | 28.433 |
| 3 | 2.266 | 9.853 | 56.512 | 2.266 | 9.853 | 56.512 | 3.071 | 13.351 | 41.784 |
| 4 | 1.670 | 7.259 | 63.772 | 1.670 | 7.259 | 63.772 | 2.685 | 11.673 | 53.457 |
| 5 | 1.356 | 5.895 | 69.666 | 1.356 | 5.895 | 69.666 | 2.435 | 10.586 | 64.043 |
| 6 | 1.051 | 4.571 | 74.237 | 1.051 | 4.571 | 74.237 | 2.345 | 10.194 | 74.237 |
| 7 | 0.670 | 2.913 | 77.150 | ||||||
| 8 | 0.591 | 2.569 | 79.719 | ||||||
| 9 | 0.509 | 2.211 | 81.930 | ||||||
| 10 | 0.477 | 2.074 | 84.004 | ||||||
| 11 | 0.473 | 2.056 | 86.060 | ||||||
| 12 | 0.405 | 1.762 | 87.822 | ||||||
| 13 | 0.372 | 1.618 | 89.439 | ||||||
| 14 | 0.333 | 1.446 | 90.885 | ||||||
| 15 | 0.315 | 1.369 | 92.254 | ||||||
| 16 | 0.303 | 1.315 | 93.569 | ||||||
| 17 | 0.272 | 1.184 | 94.753 | ||||||
| 18 | 0.251 | 1.092 | 95.845 | ||||||
| 19 | 0.249 | 1.082 | 96.927 | ||||||
| 20 | 0.214 | 0.929 | 97.856 | ||||||
| 21 | 0.193 | 0.838 | 98.693 | ||||||
| 22 | 0.170 | 0.741 | 99.434 | ||||||
| 23 | 0.130 | 0.566 | 100.000 | ||||||
Notes: Extraction Method: Principal Component Analysis.
Table 4.
Rotated component matrix.
| Component | ||||||
|---|---|---|---|---|---|---|
| 1 | 2 | 3 | 4 | 5 | 6 | |
| BI1 | 0.172 | 0.848 | 0.210 | 0.029 | 0.103 | 0.115 |
| BI2 | 0.162 | 0.780 | 0.296 | 0.051 | 0.137 | 0.086 |
| BI3 | 0.175 | 0.799 | 0.218 | 0.062 | 0.130 | 0.081 |
| BI4 | 0.123 | 0.803 | 0.176 | 0.074 | 0.259 | 0.061 |
| TD1 | 0.209 | 0.051 | 0.143 | 0.815 | 0.148 | 0.078 |
| TD2 | 0.126 | 0.028 | 0.216 | 0.698 | 0.331 | 0.037 |
| TD3 | 0.142 | 0.093 | 0.106 | 0.824 | −0.010 | −0.028 |
| TD4 | −0.027 | 0.022 | 0.089 | 0.727 | 0.129 | 0.161 |
| CP1 | 0.824 | 0.211 | −0.057 | 0.030 | −0.070 | 0.030 |
| CP2 | 0.761 | 0.185 | 0.120 | 0.109 | 0.096 | 0.151 |
| CP3 | 0.749 | 0.149 | −0.073 | 0.013 | 0.187 | 0.225 |
| CP4 | 0.755 | 0.116 | 0.107 | 0.185 | 0.198 | 0.207 |
| CP5 | 0.766 | −0.011 | 0.034 | 0.177 | 0.117 | 0.271 |
| MO1 | −0.058 | 0.150 | 0.851 | 0.157 | 0.135 | 0.087 |
| MO2 | −0.033 | 0.250 | 0.797 | 0.173 | 0.173 | 0.199 |
| MO3 | 0.053 | 0.228 | 0.797 | 0.085 | 0.139 | 0.034 |
| MO4 | 0.125 | 0.242 | 0.797 | 0.159 | 0.065 | 0.000 |
| KN1 | 0.072 | 0.212 | 0.210 | 0.126 | 0.767 | 0.138 |
| KN2 | 0.248 | 0.142 | 0.092 | 0.240 | 0.788 | −0.025 |
| KN3 | 0.108 | 0.235 | 0.179 | 0.162 | 0.877 | 0.090 |
| MA1 | 0.198 | 0.062 | 0.089 | 0.206 | 0.082 | 0.822 |
| MA2 | 0.320 | 0.158 | 0.072 | 0.068 | −0.024 | 0.788 |
| MA3 | 0.222 | 0.083 | 0.099 | −0.027 | 0.120 | 0.846 |
Note: Rotation converged in seven iterations.
Table 5.
Reliability analysis for each scale.
| Measurement Scale | No. of Items | Cronbach’s Alpha Value | Sample Size | |
|---|---|---|---|---|
| Management support | MA | 3 | 0.848 | 157 |
| Motivation | MO | 4 | 0.890 | 157 |
| Technical defects of GBTS | TD | 4 | 0.818 | 157 |
| GBTS capability | CP | 5 | 0.876 | 157 |
| Knowledge structure | KN | 3 | 0.867 | 157 |
| Behavior intention | BI | 4 | 0.897 | 157 |
Table 6.
Goodness-of-fit measures of CFA model.
| Goodness-of-Fit Measure | Index | Basic Level | Results | Model Fitting Judgment |
|---|---|---|---|---|
| Absolute fit | x2/df | <3 | 1.345 | Accepted |
| RMSEA | <0.08 | 0.047 | Accepted | |
| Incremental fit | CFI | >0.90 | 0.974 | Accepted |
| IFI | >0.90 | 0.974 | Accepted | |
| NFI | >0.90 | 0.905 | Accepted | |
| Parsimony-adjusted comparative fit index | PGFI | >0.50 | 0.679 | Accepted |
Table 7.
Reliability analysis for second half sample.
| Measurement Scale | No. of Items | Cronbach’s Alpha | Sample Size | |
|---|---|---|---|---|
| Management support | MA | 3 | 0.849 | 157 |
| Motivation | MO | 4 | 0.923 | 157 |
| Technical defects of GBTS | TD | 4 | 0.899 | 157 |
| GBTS capability | CP | 5 | 0.913 | 157 |
| Knowledge structure | KN | 3 | 0.869 | 157 |
| Behavior intention | BI | 4 | 0.941 | 157 |
Table 8.
Glossary of abbreviations.
| Abbreviations | Constructs | Items |
|---|---|---|
| KN | knowledge structure | KN1-KN3, measurement items for KN |
| MO | motivation | MO1-MO3, measurement items for MO |
| CP | GBTS capability | CP1-CP5, measurement items for CP |
| MA | management support | MA1-MA4, measurement items for MA |
| TD | GBTS defects | TD1-TD4, measurement items for TD |
| BI | behavior intention of GBTS | BI1-BI4, measurement items for BI |
Table 9.
Comparison of goodness-of-fit measures of proposed model.
| Goodness-of-Fit Measure | Index | Basic Level | Results | Model Fitting Judgment |
|---|---|---|---|---|
| Absolute fit | x2/df | <3 | 1.506 | Accepted |
| RMSEA | <0.08 | 0.040 | Accepted | |
| Incremental fit | CFI | >0.90 | 0.977 | Accepted |
| IFI | >0.90 | 0.977 | Accepted | |
| NFI | >0.90 | 0.935 | Accepted | |
| Parsimony-adjusted comparative fit index | PGFI | >0.50 | 0.717 | Accepted |
Table 10.
Unstandardized regression weights.
| Estimate | S.E. | C.R. | P | Label | |||
|---|---|---|---|---|---|---|---|
| BI | <--- | KN | 0.456 | 0.086 | 5.322 | *** | par_1 |
| BI | <--- | MA | 0.111 | 0.085 | 1.316 | 0.188 | par_2 |
| BI | <--- | TD | −0.256 | 0.102 | −2.504 | 0.012 | par_3 |
| BI | <--- | MO | 0.306 | 0.076 | 4.010 | *** | par_4 |
| BI | <--- | CP | 0.243 | 0.092 | 2.656 | 0.008 | par_5 |
| BI1 | <--- | BI | 1.000 | ||||
| BI2 | <--- | BI | 1.065 | 0.053 | 20.259 | *** | par_6 |
| BI3 | <--- | BI | 1.030 | 0.050 | 20.515 | *** | par_7 |
| BI4 | <--- | BI | 0.964 | 0.047 | 20.311 | *** | par_8 |
| CP3 | <--- | CP | 1.000 | ||||
| CP2 | <--- | CP | 0.895 | 0.055 | 16.407 | *** | par_9 |
| CP1 | <--- | CP | 0.972 | 0.055 | 17.590 | *** | par_10 |
| MA3 | <--- | MA | 1.000 | ||||
| MA2 | <--- | MA | 1.065 | 0.073 | 14.551 | *** | par_11 |
| MA1 | <--- | MA | 1.016 | 0.072 | 14.063 | *** | par_12 |
| TD4 | <--- | TD | 1.000 | ||||
| TD3 | <--- | TD | 1.278 | 0.104 | 12.259 | *** | par_13 |
| TD2 | <--- | TD | 1.190 | 0.100 | 11.865 | *** | par_14 |
| TD1 | <--- | TD | 1.203 | 0.097 | 12.359 | *** | par_15 |
| MO4 | <--- | MO | 1.000 | ||||
| MO3 | <--- | MO | 1.058 | 0.063 | 16.783 | *** | par_16 |
| MO2 | <--- | MO | 1.135 | 0.063 | 18.027 | *** | par_17 |
| MO1 | <--- | MO | 1.083 | 0.063 | 17.129 | *** | par_18 |
| KN5 | <--- | KN | 1.000 | ||||
| KN4 | <--- | KN | 1.033 | 0.068 | 15.222 | *** | par_19 |
| KN3 | <--- | KN | 1.115 | 0.075 | 14.925 | *** | par_20 |
| KN2 | <--- | KN | 0.972 | 0.067 | 14.441 | *** | par_21 |
| KN1 | <--- | KN | 0.997 | 0.069 | 14.371 | *** | par_22 |
Note: *** p-value is less than 0.001.
© 2018 by the authors. Licensee MDPI, Basel, Switzerland. This article is an open access article distributed under the terms and conditions of the Creative Commons Attribution (CC BY) license (http://creativecommons.org/licenses/by/4.0/).
Share and Cite
MDPI and ACS Style
Wang, W.; Zhang, S.; Su, Y.; Deng, X. Key Factors to Green Building Technologies Adoption in Developing Countries: The Perspective of Chinese Designers. Sustainability 2018, 10, 4135. https://doi.org/10.3390/su10114135
AMA Style
Wang W, Zhang S, Su Y, Deng X. Key Factors to Green Building Technologies Adoption in Developing Countries: The Perspective of Chinese Designers. Sustainability. 2018; 10(11):4135. https://doi.org/10.3390/su10114135
Chicago/Turabian StyleWang, Wei, Shoujian Zhang, Yikun Su, and Xinyang Deng. 2018. "Key Factors to Green Building Technologies Adoption in Developing Countries: The Perspective of Chinese Designers" Sustainability 10, no. 11: 4135. https://doi.org/10.3390/su10114135
Note that from the first issue of 2016, this journal uses article numbers instead of page numbers. See further details here.