The Significance of the Adaptive Thermal Comfort Limits on the Air-Conditioning Loads in a Temperate Climate


1
School of Natural Resources Engineering and Management, German Jordanian University, P.O. Box 35247, Amman 11180, Jordan
2
Priority Research Centre for Frontier Energy Technologies and Utilization, The University of Newcastle, Callaghan, NSW 2308, Australia
*
Author to whom correspondence should be addressed.
Sustainability 2019, 11(2), 328; https://doi.org/10.3390/su11020328
Submission received: 8 December 2018
/
Revised: 5 January 2019
/
Accepted: 7 January 2019
/
Published: 10 January 2019
(This article belongs to the Collection Green Building Technologies)
Abstract
:The building industry is regarded a major contributor to climate change as energy consumption from buildings accounts for 40% of the total energy. The types of thermal comfort models used to predict the heating and cooling loads are critical to save energy in operative buildings and reduce greenhouse gas emissions (GHG). In this research, the internal air temperatures were recorded for over one year under the free floating mode with no heating or cooling, then the number of hours required for heating or cooling were calculated based on fixed sets of operative temperatures (18 °C–24 °C) and the adaptive thermal comfort model to estimate the number of hours per year required for cooling and heating to sustain the occupants’ thermal comfort for four full-scale housing test modules at the campus of the University of Newcastle, Australia. The adaptive thermal comfort model significantly reduced the time necessary for mechanical cooling and heating by more than half when compared with the constant thermostat setting used by the air-conditioning systems installed on the site. It was found that the air-conditioning system with operational temperature setups using the adaptive thermal comfort model at 80% acceptability limits required almost half the operating energy when compared with fixed sets of operating temperatures. This can be achieved by applying a broader range of acceptable temperature limits and using techniques that require minimal energy to sustain the occupants’ thermal comfort.
1. Introduction
The building industry is regarded a major contributor to climate change as energy consumption from buildings accounts for the release of around 33% of global greenhouse gas (GHG) emissions [1]. The effects of climate change can be lowered by low energy building design techniques that reduce greenhouse gas emissions. Many studies have shown that low consumption, energy-efficient buildings need passive design strategies and can improve indoor comfort while lowering energy consumption, allowing occupants to extend the period of non-mechanical heating or cooling [2,3].
Low energy buildings require a suitable thermal comfort model to accurately estimate the cooling and heating energy required to sustain the thermal comfort inside the building. The accuracy of the thermal comfort model is thought to be a favorable approach because it is cost-effective and reduces energy overconsumption [4].
The largest energy consumer in the European Union (EU) is the building sector, and toward the aim of more energy efficient buildings, a new revised Energy Performance of Buildings Directive in Europe (EPBD) (EU) 2018/844 working toward more energy efficient buildings has been published in the European Union Official Journal (L156) and will take effect on 9 July 2018 to hasten the pace of new energy-efficient buildings and the cost-effective renovation of current buildings’ in European Union (EU) countries. This requires EU countries to transfer the new elements of the EPBD into national law by March 2020 [5].
The application of passive design techniques requires knowledge of the climates to design an appropriate design for each climate. For instance, there are different climate zones in Australia that are similar to the major climates around the world. The cool temperate zone is mild to warm summers and cold winters, and in the higher parts of the Snowy Mountains, snow can fall at any time of the year. Space heating and cooling from different types of fuels consuming a significant amount of energy in Australia can be reduced by appropriate climate passive design such as higher thermal mass, especially to the internal walls facing north windows to absorb the heat during the winter day and reradiate it inside the building during the night; the facilitation of cross ventilation during cool summer nights; elimination of air drafts through leaky walls and windows; light colored roofs and darker walls, especially the northern walls, to absorb winter sun; shading the east and west walls in summer (i.e., trees); and bulk insulation and double glazed windows are needed.
The precise thermal comfort design and operation of buildings and systems for heating, ventilation, and air conditioning (HVAC) must consider all of the factors involved. Building designers often overlook or incorrectly apply the standards. Design input values are often regarded as widespread values rather than suggested values to be used under precise environments. At the operational level, only a few variables are considered, with erratic impacts on the calculation of thermal comfort [6].
Thermal comfort is delineated by the psychological term “condition of mind”. The comfort level of the occupants in any environment can vary and adapt over time due to psychological factors. Individual perceptions of thermal comfort can be influenced by the recollection of past experiences. Thermal comfort is the human experience of the thermal environment, and it is based on the thermal sensation of the inhabitant [7]. Adaptation occurs when experiences in a certain environment moderate future expectations. This is an important element in understanding the variance between field results and predicted theoretical/design forecasts in free-run mode buildings [8].
Hard labor in hot humid environments is a real health and economic hazard for millions of workers and their families in tropical climates when they work beyond their thermal comfort levels [9]. Seven air-conditioned buildings in South Korea were used to assess the effects of the occupants’ control on their environment and their effects on cooling energy consumption. The findings suggest that the level of control of the occupants over their thermal environment could reduce thermal energy consumption by almost 10% without impacting occupant thermal comfort [10].
The thermal comfort of the inhabitant is factored by measuring the comfort zone of a certain value for the occupant [10]. The combinations of personal factors and indoor thermal environment that form the thermal conditions suitable to the majority of the occupants are categorized and called the thermal environmental conditions for human occupancy developed by the American Society of Heating, Refrigerating (ASHRAE) and HVAC Engineers.
The ISO, CEN, and ASHRAE Standards deal with comfort matters in a similar way to providing standards (EN ISO 7730: 2005 and ASHRAE 55: 2017). These standards outline the classification of combinations of indoor thermal environments and their personal aspects, creating thermal environments suitable for the general population [11].
There are two main thermal comfort modules used by ISO, CEN, and ASHRAE:
- The predicted mean vote (PMV) and the predicted percentage dissatisfied (PPD) models.
- Adaptive thermal comfort models.
EN15251 specifies the “indoor environmental input parameters for the design and assessment of the energy performance of buildings addressing indoor air quality, thermal environment, lighting, and acoustics” as a European standard that comprises standards for the four indoor environmental factors of thermal comfort, air quality, lighting, and acoustics. This standard has been widely used in practice, and several scientific papers on issues related to the adequacy of the standard have been published [12,13,14].
The PMV is based on the principles of heat balance and data collected in a climate controlled environment under stable conditions. The PMV index predicts the public’s mean response, as per the ASHRAE thermal sensation scale (−1 = slightly cool, −2 = cool, −3 = cold, 0 = neutral, +1 = slightly warm, +2 = warm, +3 = hot). Note that ASHRAE (and CEN) provides a comfort zone consistent with 80% of satisfied people. This “could” be compared with a percentage of dissatisfied people equal to 20% (PMV from −0.85 to 0.85) [10]. Six variables distinguish PMV thermal comfort: air temperature, relative air velocity, mean radiant temperature, mean air humidity, clothing insulation, and metabolic rate. Many of these variables are obtained by means of sensors; but the assessment of metabolic rate and insulation of clothing depends on the individual standards: ISO 9920 (clothing), ISO 8996 (metabolic rate), and ISO 7726 (instruments and methods) [15,16,17,18].
The PMV model has strengths and limitations. For example, [19] determined the predicted mean vote (PMV/PPD) for metabolic rates and the insulation of clothing is difficult to accurately estimate. The PMV for thermal comfort also tries to find the response of environmentally friendly occupants in terms of heat transfer physiology and physics, which is a complex procedure. It does not take into account the psychological factors that play an important role in controlling thermal comfort conditions. Many field studies have found that PMV is difficult to use in the real world and can lead to inaccuracies in terms of predicting comfortable conditions as it depends on the respondents’ physiology and subjective perception [20].
A field study in an air-conditioned office building showed that the adaptive model improved the thermal acceptance of occupants when compared to the PMV/PPD model with lower energy consumption [21]. Surveys on many buildings have shown that acceptable indoor conditions are often not met, which suggests that the entire construction industry needs more precise methods for designing and studying indoor environments [22,23,24]. Many studies have focused on helping building and operators of building and HVAC systems meet different and complex standards for improving energy efficiency and indoor environmental quality [6].
The adaptive thermal comfort method was developed as a result of the above complications to help designers find the comfortable operative internal air temperature in free-run buildings. Note that the adaptive thermal comfort method only works in free-run buildings and not in air-conditioned buildings, whereas PMV/PPV only works well in air-conditioned buildings and not in free-running buildings [25].
This adaptive module has been developed by various empirical and experimental investigations; the internal air temperature can be calculated successfully by taking into account several factors such as the interaction of the inhabitants with their surroundings including when they change their clothes, opening/closing windows, the use of low-energy fans, drinking water, and drawing shades. One of the key results of adaptive theory is that people living in warmer climates can tolerate warmer temperatures indoors than those living in colder climates [26].
The comfort zone is around the neutrality/comfort line and represents the comfortable upper and lower temperature. The acceptability of 90% and 80% limits a comfort zone with an ideal comfort temperature of 2–3 °C on either side of the comfort line, which is considered an acceptable limit. If fans are available, a further 2 °C on both sides can be added to calculate the comfort zone value for very hot, dry, climate conditions. For humid climates, 1 °C can be added to determine the value of the comfort zone value on both sides [27]. The temperature range identified corresponds to 90% and 80% acceptability limits and could reach approximately 30 °C according to the ASHRAE 55-2017 Standard [28].
While the constant air-conditioning operational temperature (thermostat setting) in a temperate climate/Newcastle area in Australia was fixed during the whole year, the operational temperatures were between 18 °C and 24 °C. This narrow range of the thermostat setting causes the system to be active most of the time because the building’s interior air temperature is outside the operational temperatures the majority of the time, which requires a significant amount of energy.
Increasing the thermal comfort criteria by reducing the acceptability limits from 90% to 70% has a major impact on space-cooling energy consumption (saving more than 40%) in tropical regions and regions with a hot summer climate [29].
One benefit of an adaptive thermal comfort module is the inclusion of air velocity and humidity for operative temperature calculation requirements. However, research suggests that to analyze the impact of these two factors on the thermal comfort of the occupant, data from the occupants related to windows and doors opened or fans running were taken into account [30]. In 26 air-conditioned and 10 naturally ventilated classrooms, field experiments were conducted using surveys and physical measurements, and showed that humidity had a minimal impact on thermal comfort [31,32].
Naturally ventilated buildings consume less than half the energy of air-conditioned buildings as the inhabitants adapt to a much wider range of temperatures outside the comfort zone defined by the PMV model [10]. The PMV model also predicts that occupants will feel warmer than they are, thus encouraging the over-use of air conditioning [28].
The adaptive thermal comfort model (by ASHRAE Standard 55-2017 and EN 15251) is used for naturally ventilated buildings, while the PMV/PPD model can be applied in air-conditioned buildings as the thermal comfort between the two is inaccurately compared. Fanger recommended the expectation factor, “e”, to grasp the mean thermal sensation in a warm climate of the inhabitants of the actual non-air-conditioned building. The factor “e” varies between 1 and 0.5. It is 1 for air-conditioned buildings and for non-air-conditioned buildings, the expectancy factor depends on the duration of the warm weather annually, and whether these structures can be compared with air-conditioned buildings in the region; so it may be between 0.8 and 0.9 [33]. Mechanical temperature control can be lowered when people accept broader internal air temperatures, occasioning in lower energy usage and running costs; thus, it enhances the building’s economic and environmental performance [34,35].
Inhabitants with greater individual environmental control tend to accept a wider range of indoor temperatures. On average, they accept a lower operating temperature of 2.6 °C and showed a lower motivation to change their current environment when compared to those without personal control. Residents are recommended to interact with their thermal environment through openable windows and doors, low-energy fans, and to minimize the use of governable heating and cooling systems [36]. A case study in southern Spain involved a high-tech energy-efficient skyscraper which saved occupation hours, reducing the use of air-conditioning equipment by 28% and significantly reducing the energy consumption overall [37].
This research examined the effect of applying adaptive thermal comfort operative temperature on cooling and heating loads. The adaptive thermal comfort results were compared with the real data from the housing modules with installed air-conditioning systems with fixed sets of operation temperatures based on the predicted mean vote model.
2. Materials and Methods
Observations from the full-scale housing test modules were used to provide the weather data and the internal air temperatures. These data were used to estimate the time where cooling and heating are essential to maintain thermal comfort for the occupants using two types of operational temperatures: the adaptive thermal model and the sets of real temperatures used on the site for the air-conditioning systems.
2.1. Adaptive Thermal Comfort and the Indoor Operative Air Temperature
In this paper, four full-scale test modules (Insulated Cavity Brick (InsCB), Insulated Reverse Brick Veneer (InsRBV), Cavity Brick (CB), and Insulated Brick Veneer (InsBV)) were used to compare the time where cooling and heating is essential to obtain thermal comfort using the adaptive thermal comfort model and air-conditioning systems installed on the site.
The European thermal adaptive comfort standard BS EN 15251 is based on ASHRAE 55, and the comfort temperature is calculated in the same way (similar equations but with different coefficients). As there is currently no Australian standard, ASHRAE 55 was used. The adaptive thermal comfort temperature for free-running buildings (the comfort temperature Tc) can be calculated through this equation [27]:
where,
Tc = 17.8 + 0.31 × To
- To: Outdoor Running mean temperature (°C).
- Tc: Operative temperature (°C).
To find the adaptive thermal comfort 80% acceptability limits inside the building where at least 80% of the occupants are satisfied with these temperature ranges [27], we used Equation (2):
80% acceptability limits implies to Tc ± 3.5 °C
In the adaptive thermal approach, occupants are required to wear suitable clothing. Clothing insulation (Clo) used in these calculations was between 0.5 m2·°C/W for the hot days and 1.3 m2·°C/W for the cold days, however, these values were not corrected by the effect of air and movement [38].
In this research, the adaptive thermal comfort model was used to establish new occupant thermal comfort limits to estimate the time (number of hours) where heating and cooling was required. The reason for using the adaptive thermal comfort model over other thermal comfort modules (i.e., the predicted mean vote (PMV) and predicted percentage dissatisfied (PPD)) was because it uses a wider range of operative temperature and minimum energy techniques to sustain the occupants’ thermal comfort instead of mechanical heating or cooling.
2.2. Full-Scale Test Modules
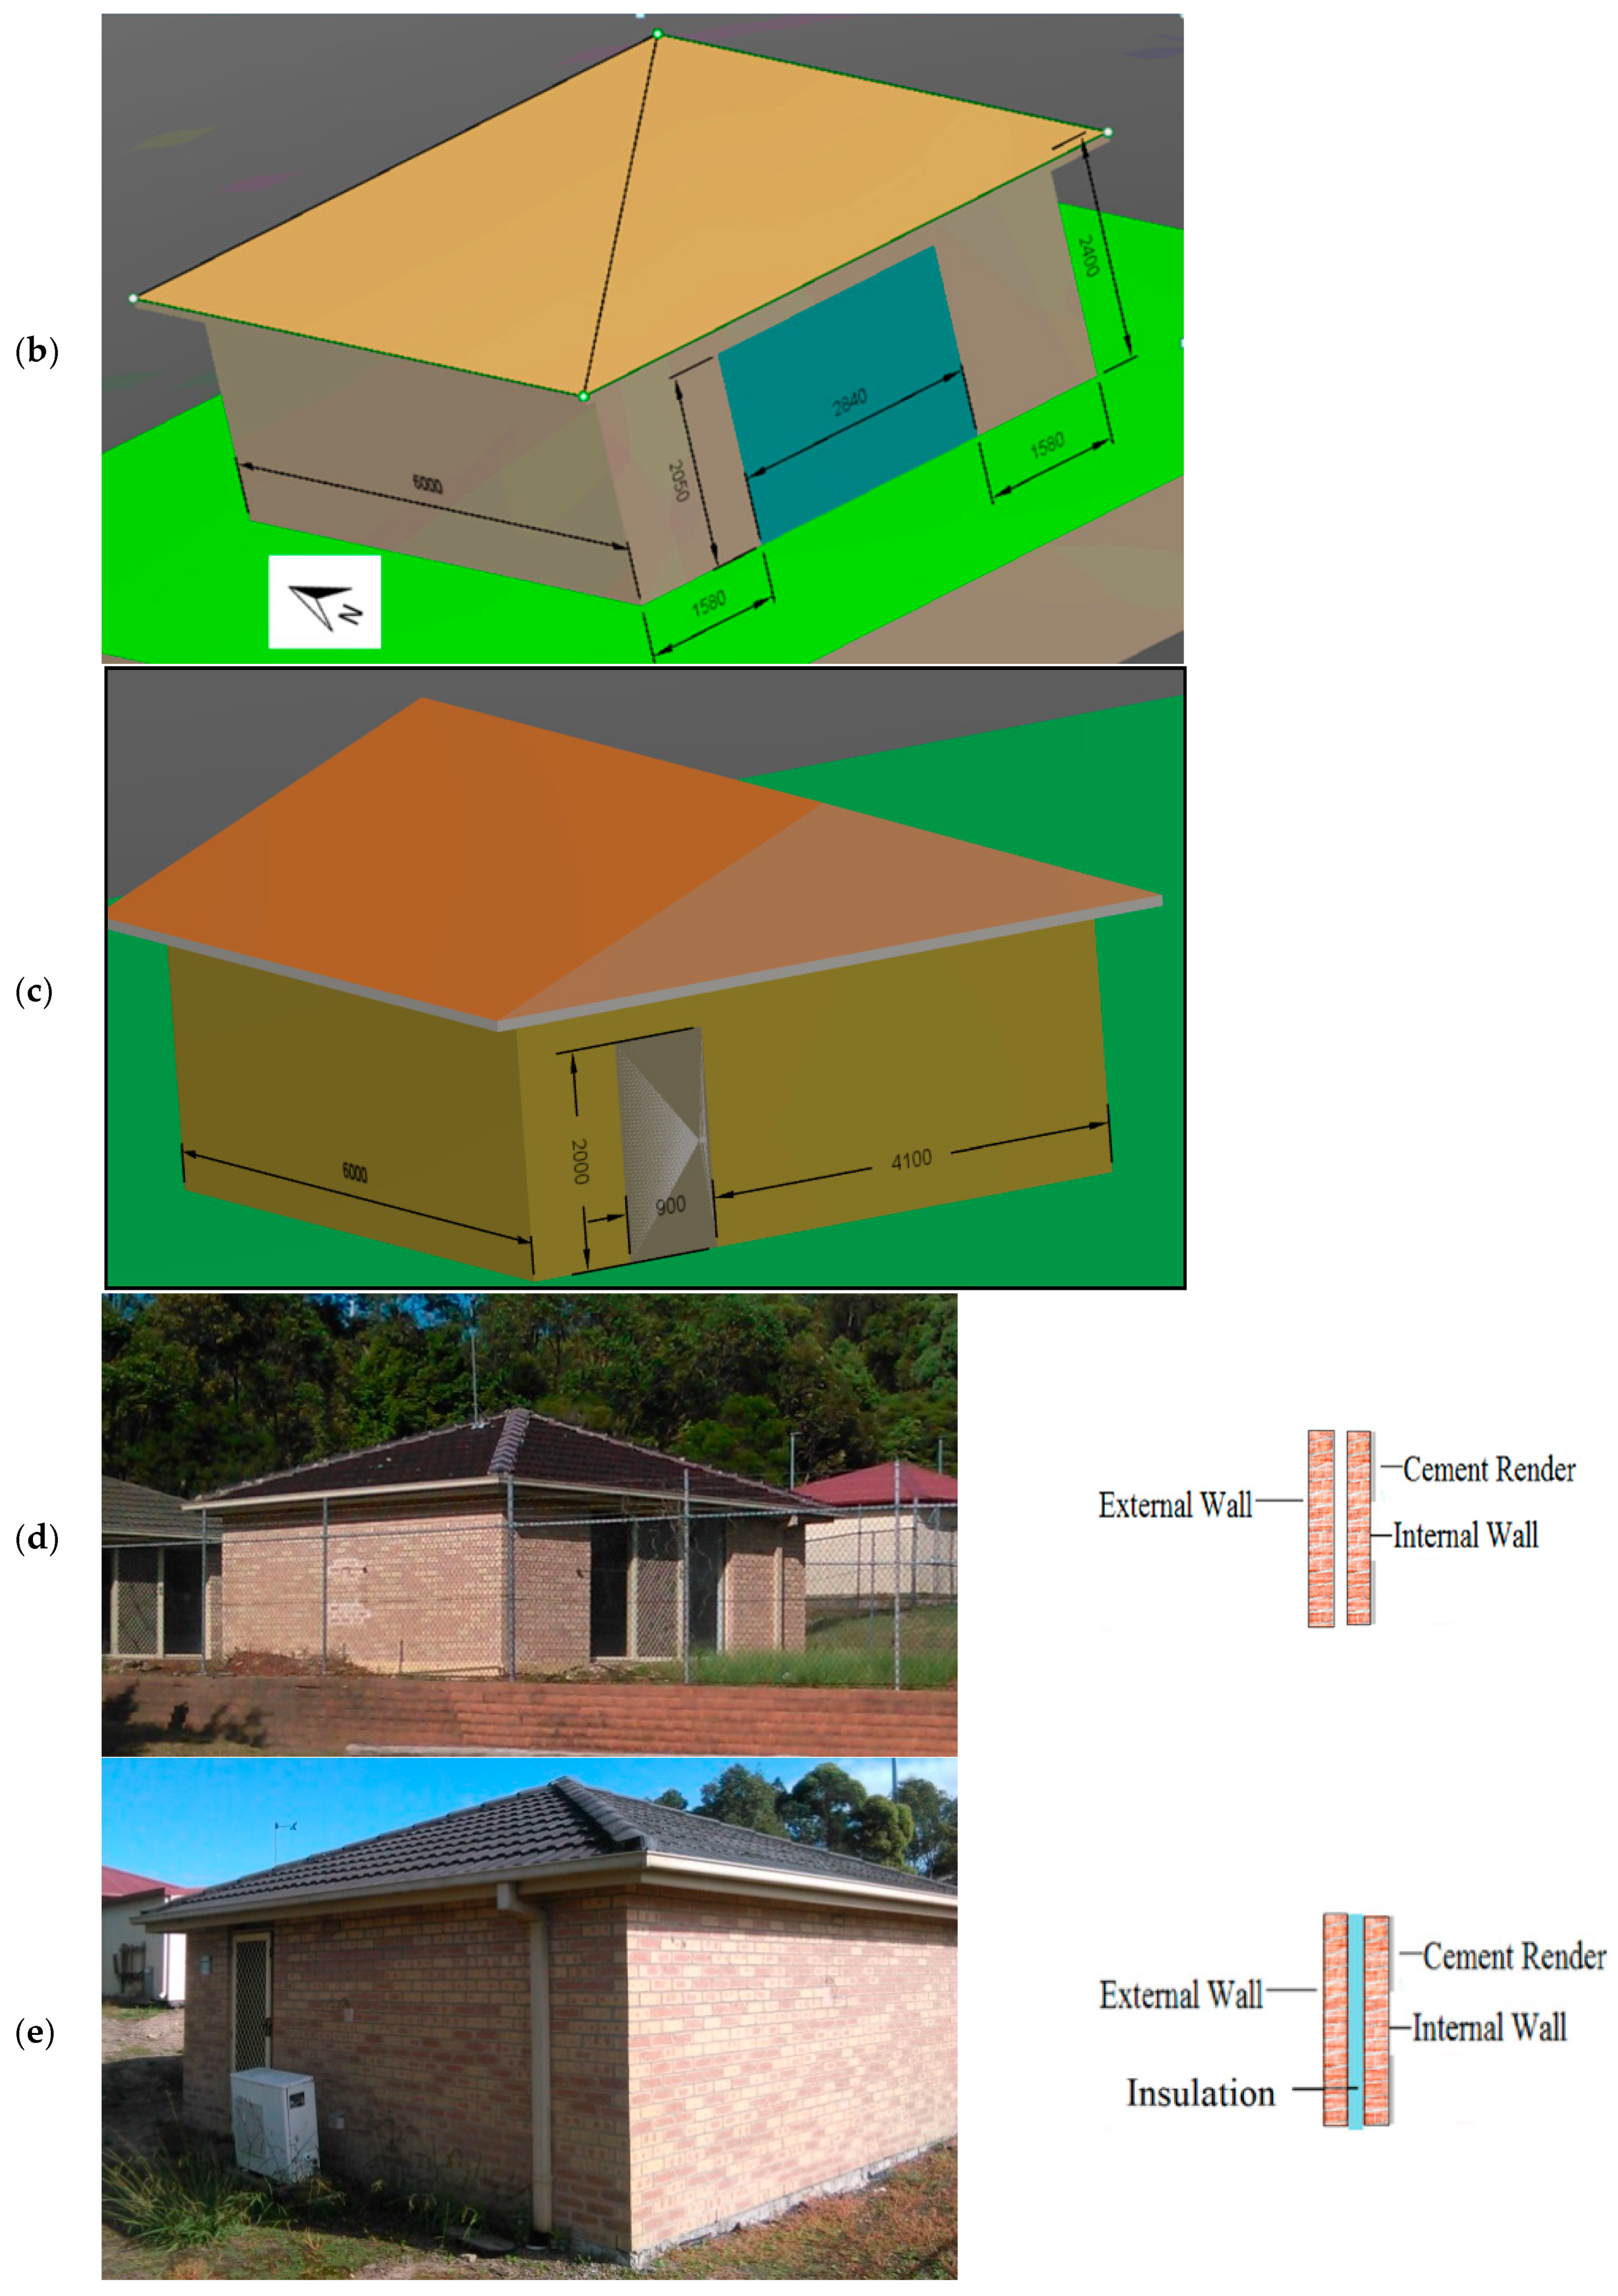
At the University of Newcastle, Australia, an extensive research program has been proceeding for the past decade on the thermal performance of Australian housing. This has included building and observing the performance of four housing modules under a range of different weather conditions. Four modules were built at the University of Newcastle, Callaghan Campus (longitude 151.7 and latitude −32.91). The housing test modules were chosen to represent typical forms of construction in Australia [39,40,41,42,43].
All modules had a square floor plan of 6 m × 6 m as shown in Figure 1 and were 7 m apart to minimize wind blockage and evade shading. A fan coil unit for heating or cooling was installed in each of the modules to maintain a thermal comfort level. For cooling, chilled water was pumped into the modules where the temperature rise through the heat exchanger coil and the water flow rate were measured. For heating, the energy consumed by the heater and the air circulation fan was measured together [40].
All modules shared these construction materials: clay tiles for the InsCB and CB modules, concrete tiles for the InsBV module, and coated corrugated sheets for the InsRBV with a 10 mm plasterboard ceiling with glass wool batts (R3.5 insulation) between rafters, and a 6.38 mm laminated clear glass window in a light colored aluminum frame installed in the northern wall of each module [44]. There was a heavily insulated door in the southern wall to eliminate any heat losses and provide access to the building [45].
The main difference between the modules was the walling systems, so each module was named based on their walling system. Note: the R-value is the thermal resistance for each walling system, also called R (K·m2/W) [46].
A total of 105 sensors were fitted in each module to record the internal and external conditions every 5 min for 24 h/day over the testing period using Datataker DT600 data loggers (Data Electronics (Aust.) Pty Ltd 7 Seismic Court Rowville, VIC, 3178 Australia). The external weather conditions (air temperature, wind speed and direction, relative humidity, ground temperature, incident solar radiation on each wall surface and roof) were recorded for each module [39]. The internal environment conditions (temperature and heat flux profiles through the walls, slab and ceiling, internal air temperature and relative humidity) were also recorded. The internal temperature was measured at a 1200 mm height inside the building with no ventilation inside the modules [45]. The sensors were installed in each module with a minimum of 40 sensors as required by ASHRAE 55 to measure the thermal comfort performance of a small room. The sensors were distributed on the walls and in the middle of the module away from the occupied boundary, radiation, and diffusers.
The data were recorded using Datataker DT600 data loggers every 5 min for 24 h/day over the testing period. In this research, the mean radiant temperature was calculated by finding the average temperature of all sensors located inside the room and the operative temperature was calculated by finding the average air temperature for the sensors located in the middle of the building at different heights of 0.5 m, 1 m, and 1.5 m. The accuracy of the PMV values was adequate only when the difference between the mean radiant temperature and the air temperature was less than 5 °C [47].
Several experiments were made to examine the thermal performance of the housing modules using air-conditioning systems by maintaining the internal air temperature of each module within fixed temperature ranges (between 18 °C and 24 °C). Heating was turned on when the module’s internal air temperature dropped below 18 °C and the heating system continued until 20 °C was reached, with the cooling being activated at 24 °C and continuing until 22 °C was reached [46].
3. Results and Discussion
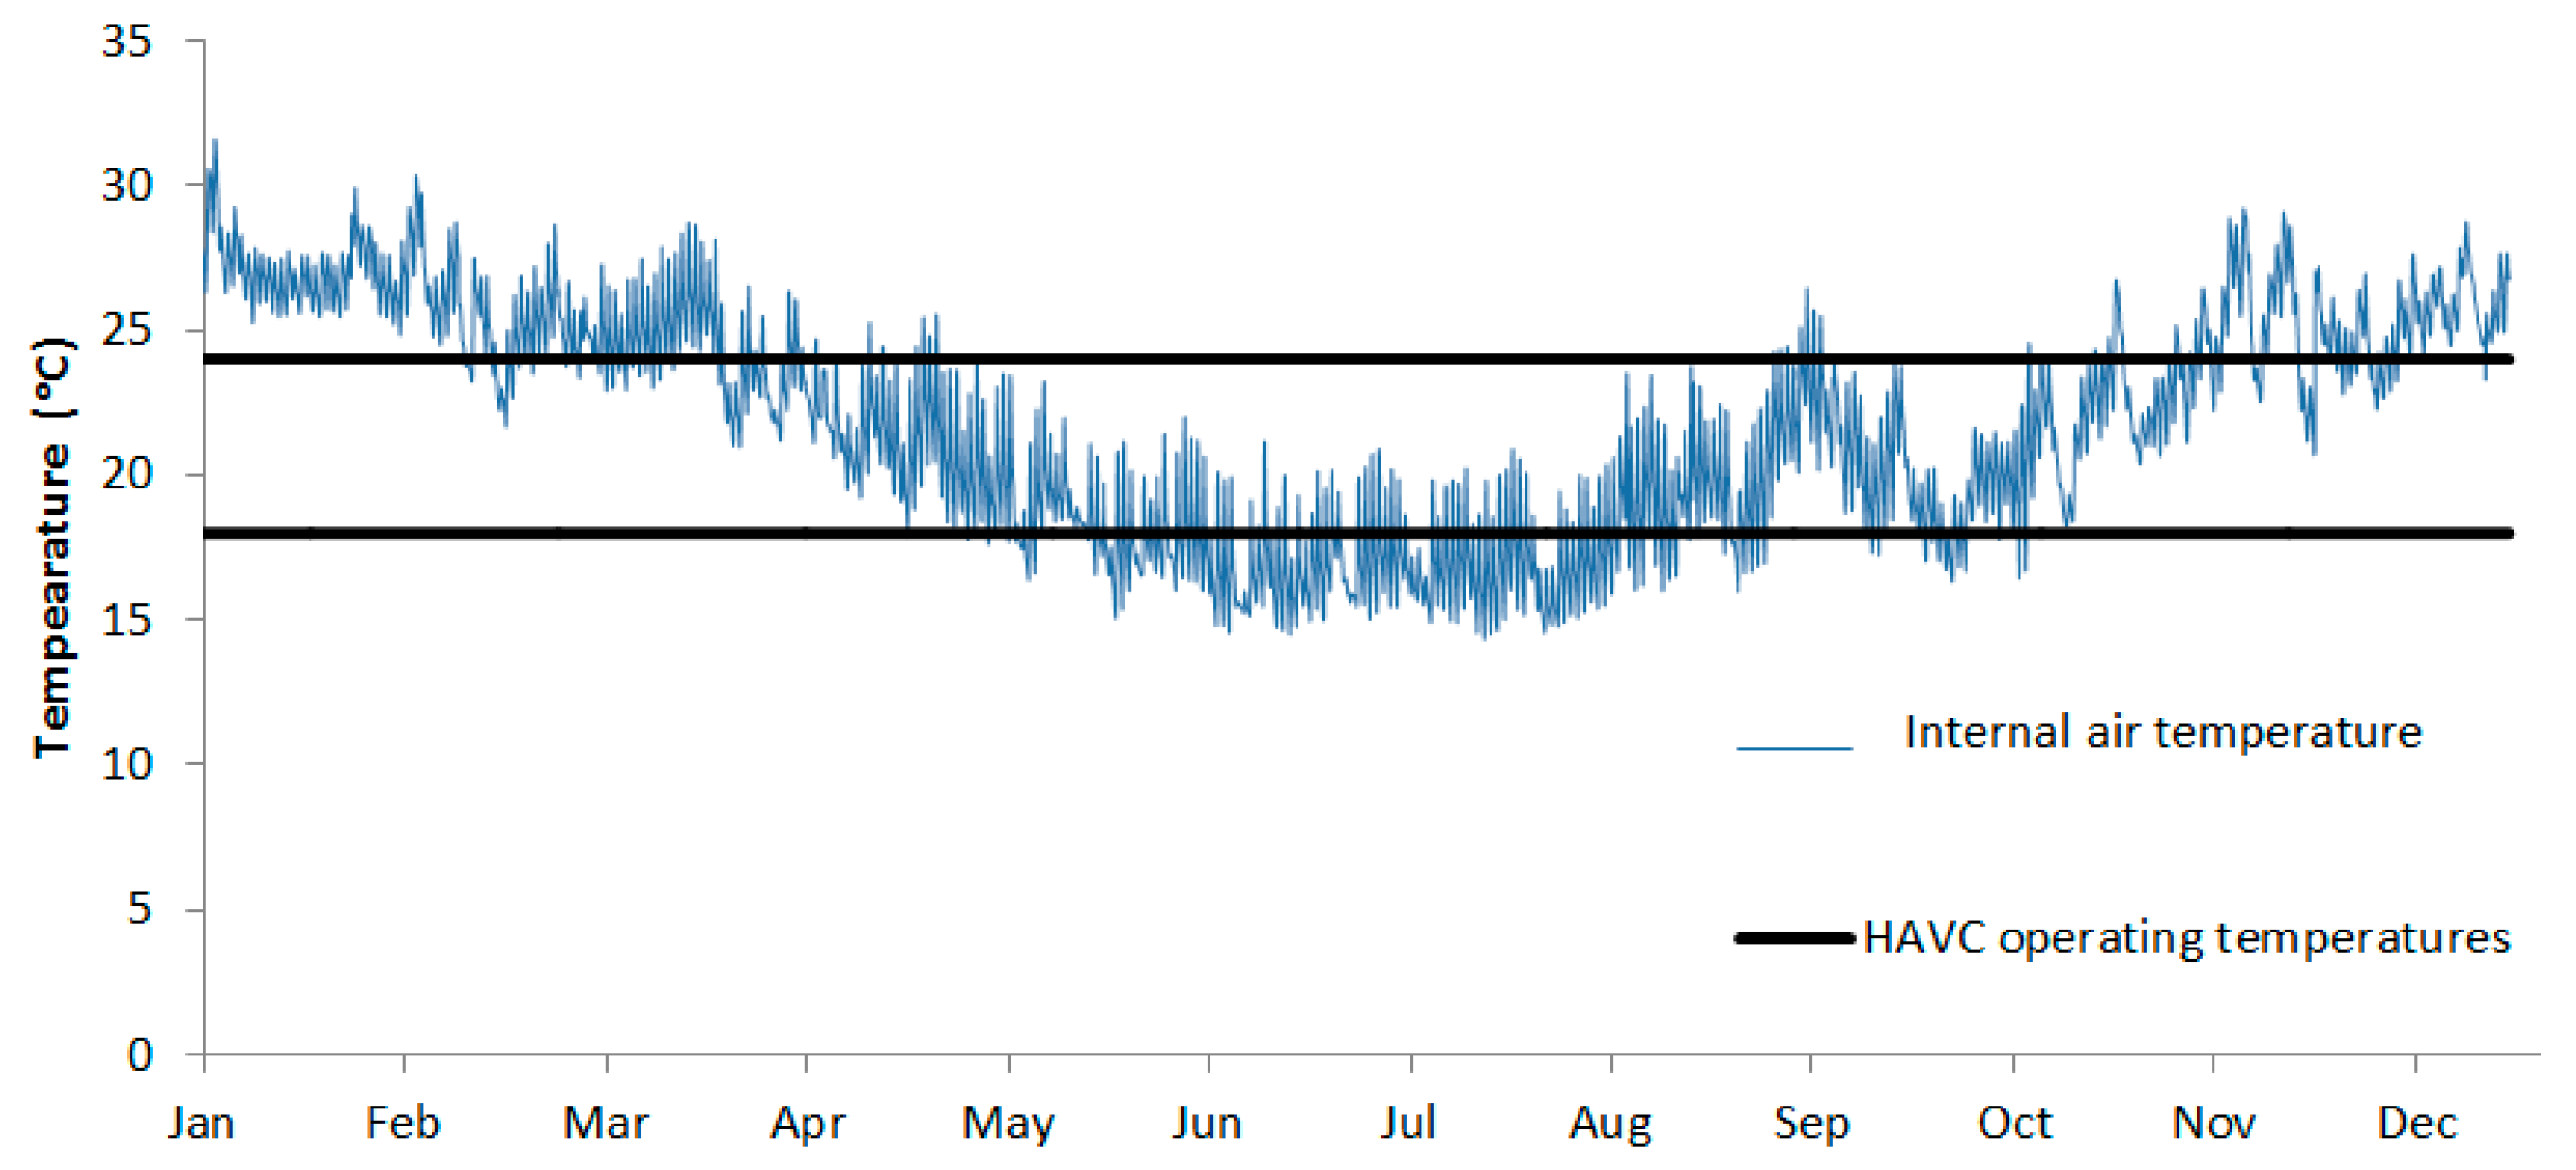
The average internal and external air temperatures recorded over one year were used for the validation and are presented in Figure 2; the black lines indicate the air-conditioning operation temperatures. The narrow temperatures for the thermostat setting caused the internal air temperatures to fall outside the operation temperatures of the air-conditioning system most of the time and required cooling or heating. The thermostat settings were constant for winter and summer and did not interact with the external environment. The air-conditioning systems inside the modules in the Newcastle area had temperature settings between 18 °C to 24 °C.
The number of hours outside the thermal comfort zone for the Cavity Brick (CB), Insulated Reverse Brick Veneer (InsRBV), Insulated Brick Veneer (InsBV), and Insulated Cavity Brick (InsCB), modules were 5139, 4498, 4476, and 3805, respectively, for these temperature settings, as shown in Figure 3. For more than half of the year, a mechanical system was required with almost two times more time needed for cooling than heating due to the low temperature settings of maximum 24 °C (the cooling mode was activated).
The fixed set of temperatures for air-conditioning systems within 18 °C and 24 °C maintained thermal comfort. Interestingly, the cooling mode was also activated when the temperature exceeded 24 °C even in the winter season because the modules experienced the warmer internal air temperature due to solar ingress and this desired energy was removed. The temperature then dropped down to 22 °C and the system consumed extra energy for cooling in winter.
This indicates that the fixed thermostat settings affect the overall energy consumptions of the modules and in some scenarios may provide false estimations of the thermal performance of the modules. This may work against some modules (e.g., the InsBV module) since the warmer module at day time in winter activated the air-conditioning unit to cool it down, and again, the unit activated the heating mode overnight to compensate for the lost energy.
In more detail, the fixed set of temperatures for air-conditioning systems within 18 °C and 24 °C maintained thermal comfort. Interestingly, the cooling mode was also activated when the temperature exceeded 24 °C even in the winter season because the modules experienced a warmer internal air temperature due to solar ingress and this desired energy was removed. The temperature then dropped down to 22 °C and the system consumed extra energy for cooling in winter.
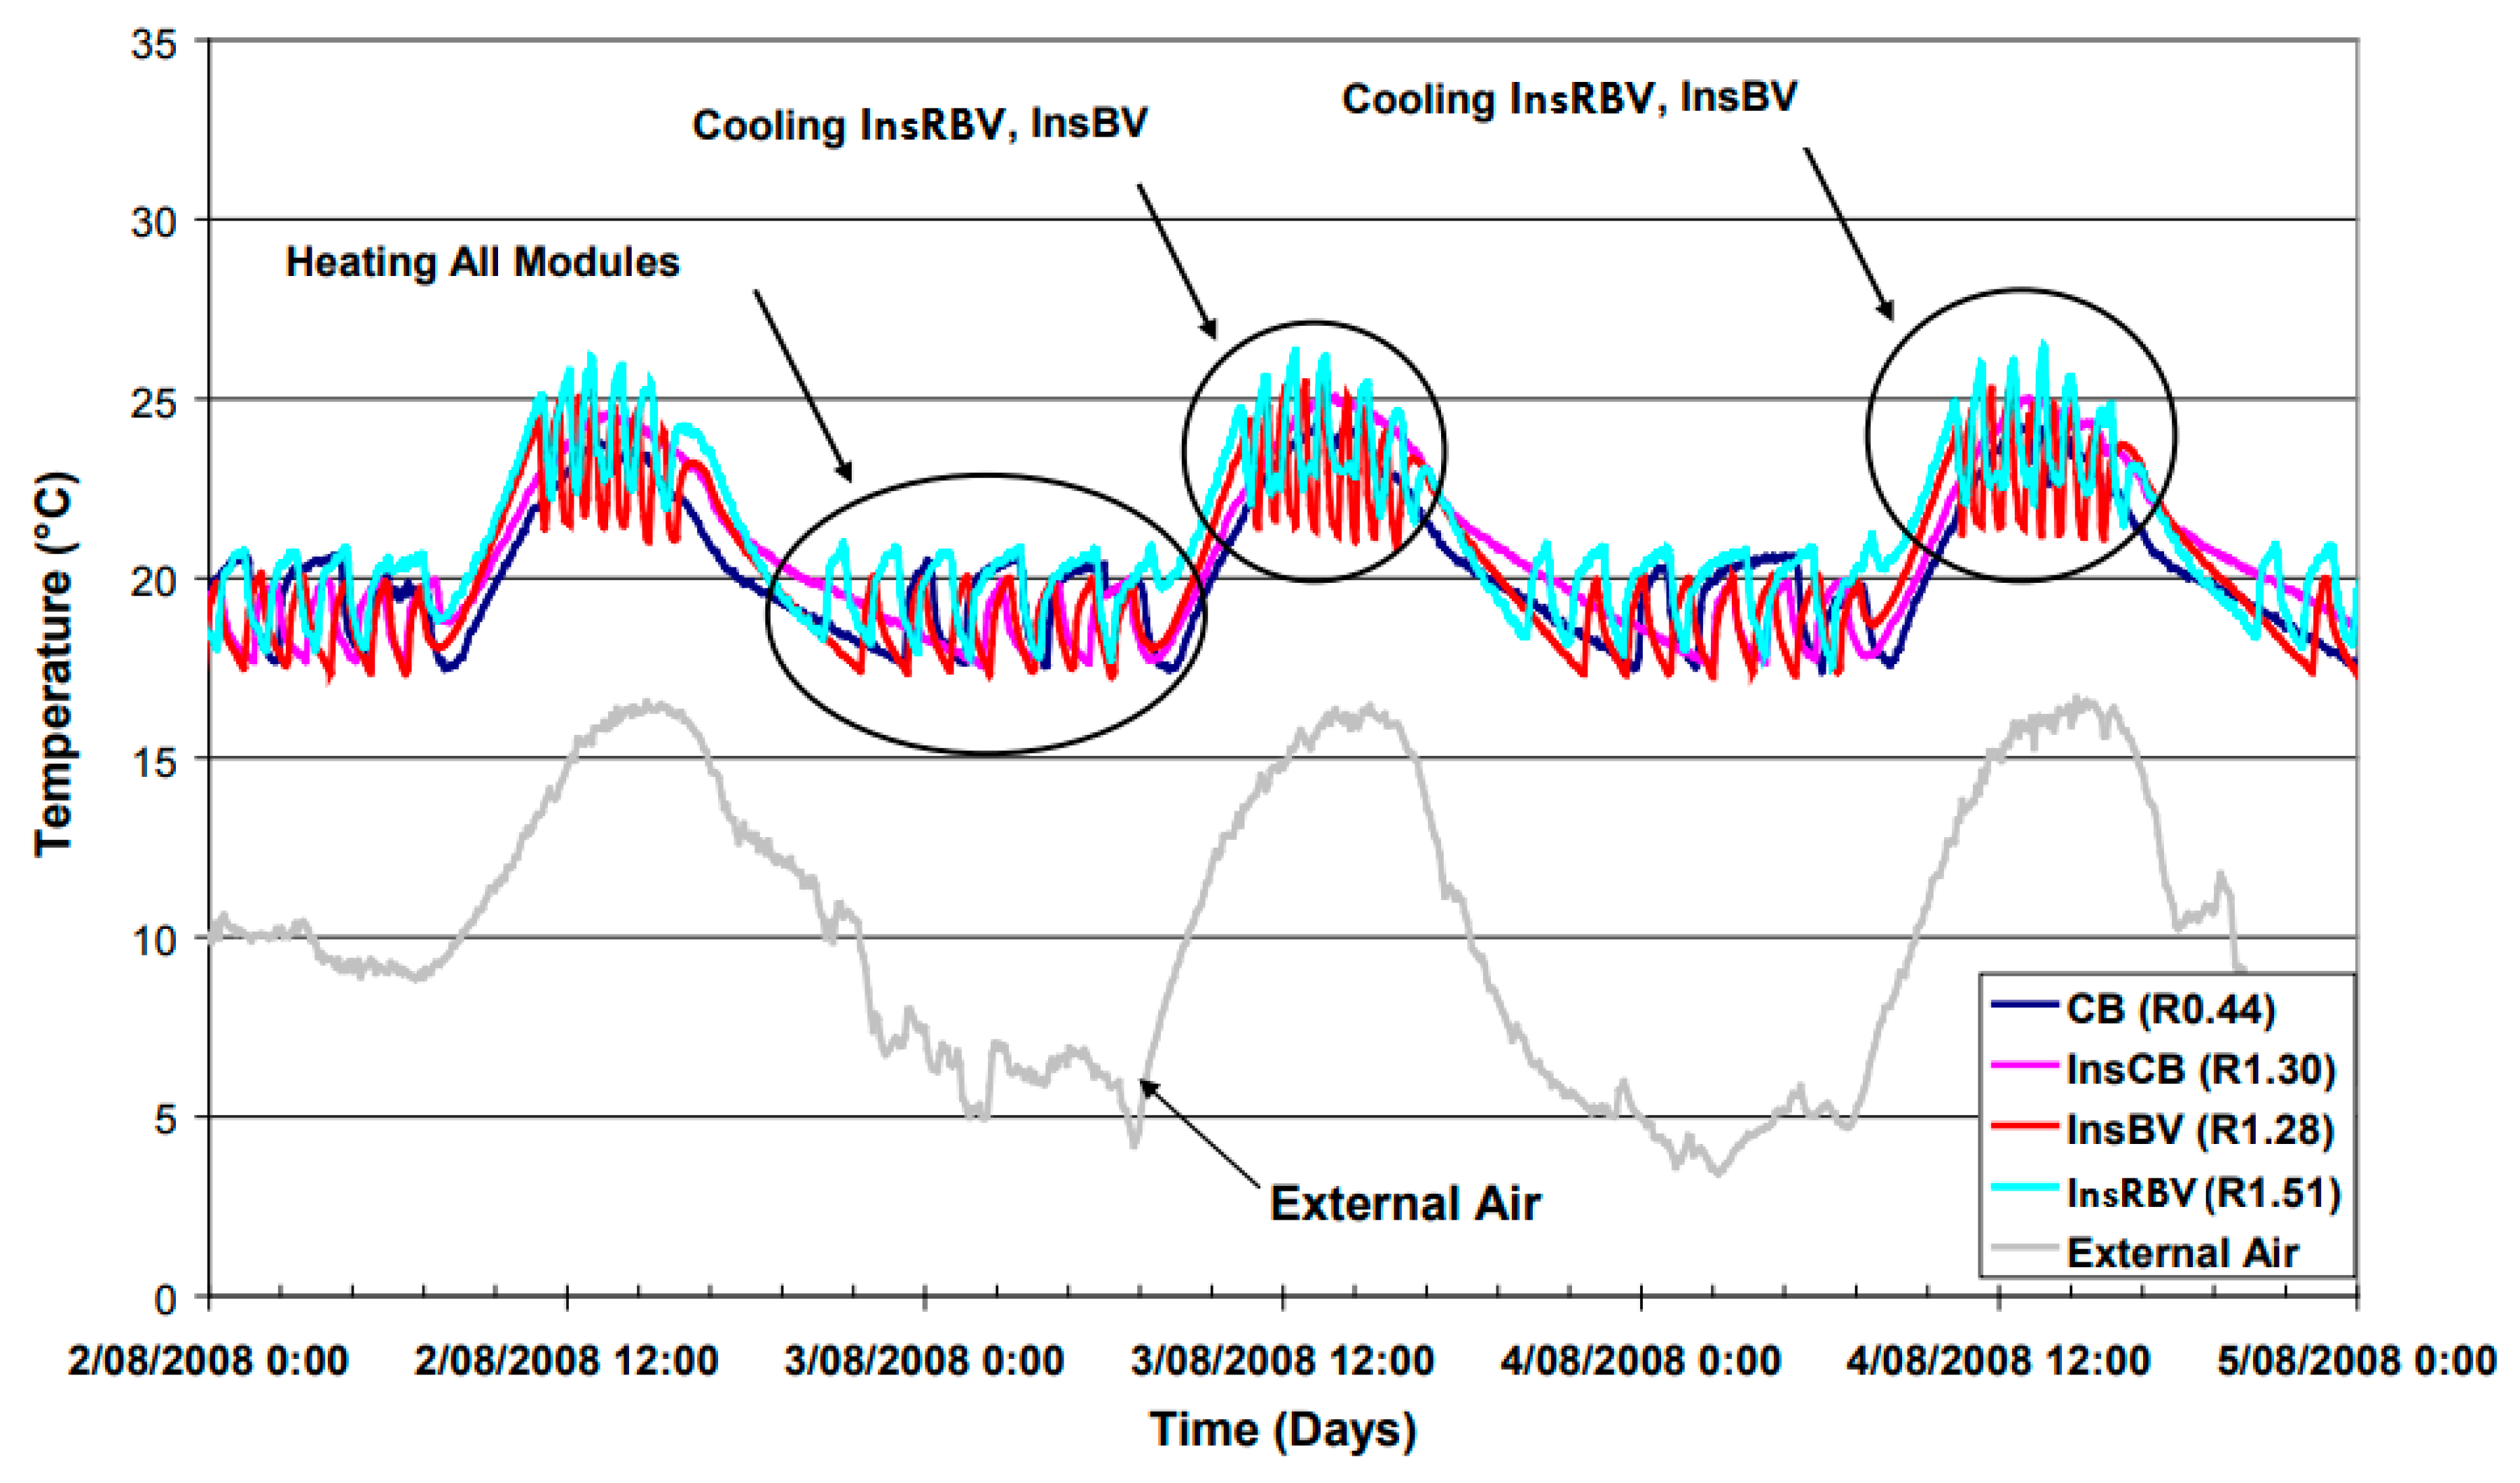
For example, the following results were for the winter period from early August (southern hemisphere). The internal air temperature of the modules for a three day period under controlled conditions is shown in Figure 4 for different test modules, together with the corresponding variations in external temperature. There were less heating/cooling interventions for the CB and InsCB modules as a result of the internal thermal mass dampening the internal temperature fluctuations, but overall, the energy use was of a significantly higher magnitude for InsBV and InsRBV. This indicates that the fixed thermostat settings affected the overall energy consumptions of the modules and in some scenarios may have provided false estimations of the thermal performance of the modules. This may work against some modules (e.g., the InsBV module) since the warmer module at day time in winter activated the air-conditioning unit to cool it down, and again, the unit activated the heating mode overnight to compensate for the lost energy as shown in Figure 4.
The average internal and external air temperatures were used again to estimate the occupants’ adaptive thermal comfort range. The adaptive thermal comfort settings occurred to be more flexible due to a wider range of internal air temperature limits.
The external and internal temperatures and the adaptive thermal comfort ranges of the 80% acceptability limit were calculated for all modules. The black lines show the higher and lower 80% acceptability limits for the CB module as seen in Figure 5. The thermal comfort temperature zones were expanded to 22.7 °C and 29.7 °C in summer and 19.6 °C to 26.6 °C in winter. These wider ranges saved massive amounts of operational energy. The indoor air temperature for all housing test modules fell outside the thermal comfort ranges only in June and July, remaining within that range for the rest of the year.
The total number of hours per year with the internal temperatures outside the occupants’ thermal comfort zone for the modules is shown in Figure 6. Mechanical heating or cooling was required for 2623, 2499, 2119, and 1921 h per year for the Cavity Brick (CB), Insulated Reverse Brick Veneer (InsRBV), Insulated Brick Veneer (InsBV), and Insulated Cavity Brick (InsCB), respectively. Just a quarter of the year was required for heating and cooling using the adaptive approach.
It was again confirmed that all of the modules performed poorly from April until September so heating was required, and this trend was noticed for both approaches (adaptive thermal and with the fixed air-conditioning thermostat settings).
Significant savings in cooling energy usage were observed in the summer months when compared with the air-conditioning fixed thermostat setting due to the wider range of temperatures for the adaptive thermal model (22.7 °C–29.7 °C). The percentage of time for cooling dropped by a staggering ratio of 97%, 92%, 96%, and 92% for the CB, InsBV, InsRBV, and InsCB, respectively. These could be easily achieved by small extra actions taken by the occupants to restore the acceptable thermal comfort in summer months including natural ventilation (cool air at night), suitable clothes, drinking more water, and shading to prevent the direct sun from entering the building.
The adaptive thermal comfort limits applied for the air-conditioning system reduced the total number of hours required for artificial heating and/or cooling from 5139, 4498, 4476, and 3805 to 2623, 2499, 2119, and 1921 h per year for the CB, InsBV, InsRBV, and InsCB, respectively, as shown in Figure 7 and Figure 8. This means that the total energy consumption needed for cooling and heating was also significant.
During the winter months in the Southern Hemisphere (April to October), the adaptive thermal comfort limits required a slightly higher amount of time where heating was required when compared with the air-conditioning limits due to the lower adaptive thermal comfort limit of 19.6 °C when compared with 18 °C for the air-conditioning limits. While for the cooling loads, the adaptive thermal comfort limits significantly reduced the number of hours where cooling was required due to the higher upper limit which reached almost 29.7 °C in January while the air-conditioning upper limit temperature required cooling at 24 °C, which required cooling most of the summer months as shown in Figure 9 and Figure 10.
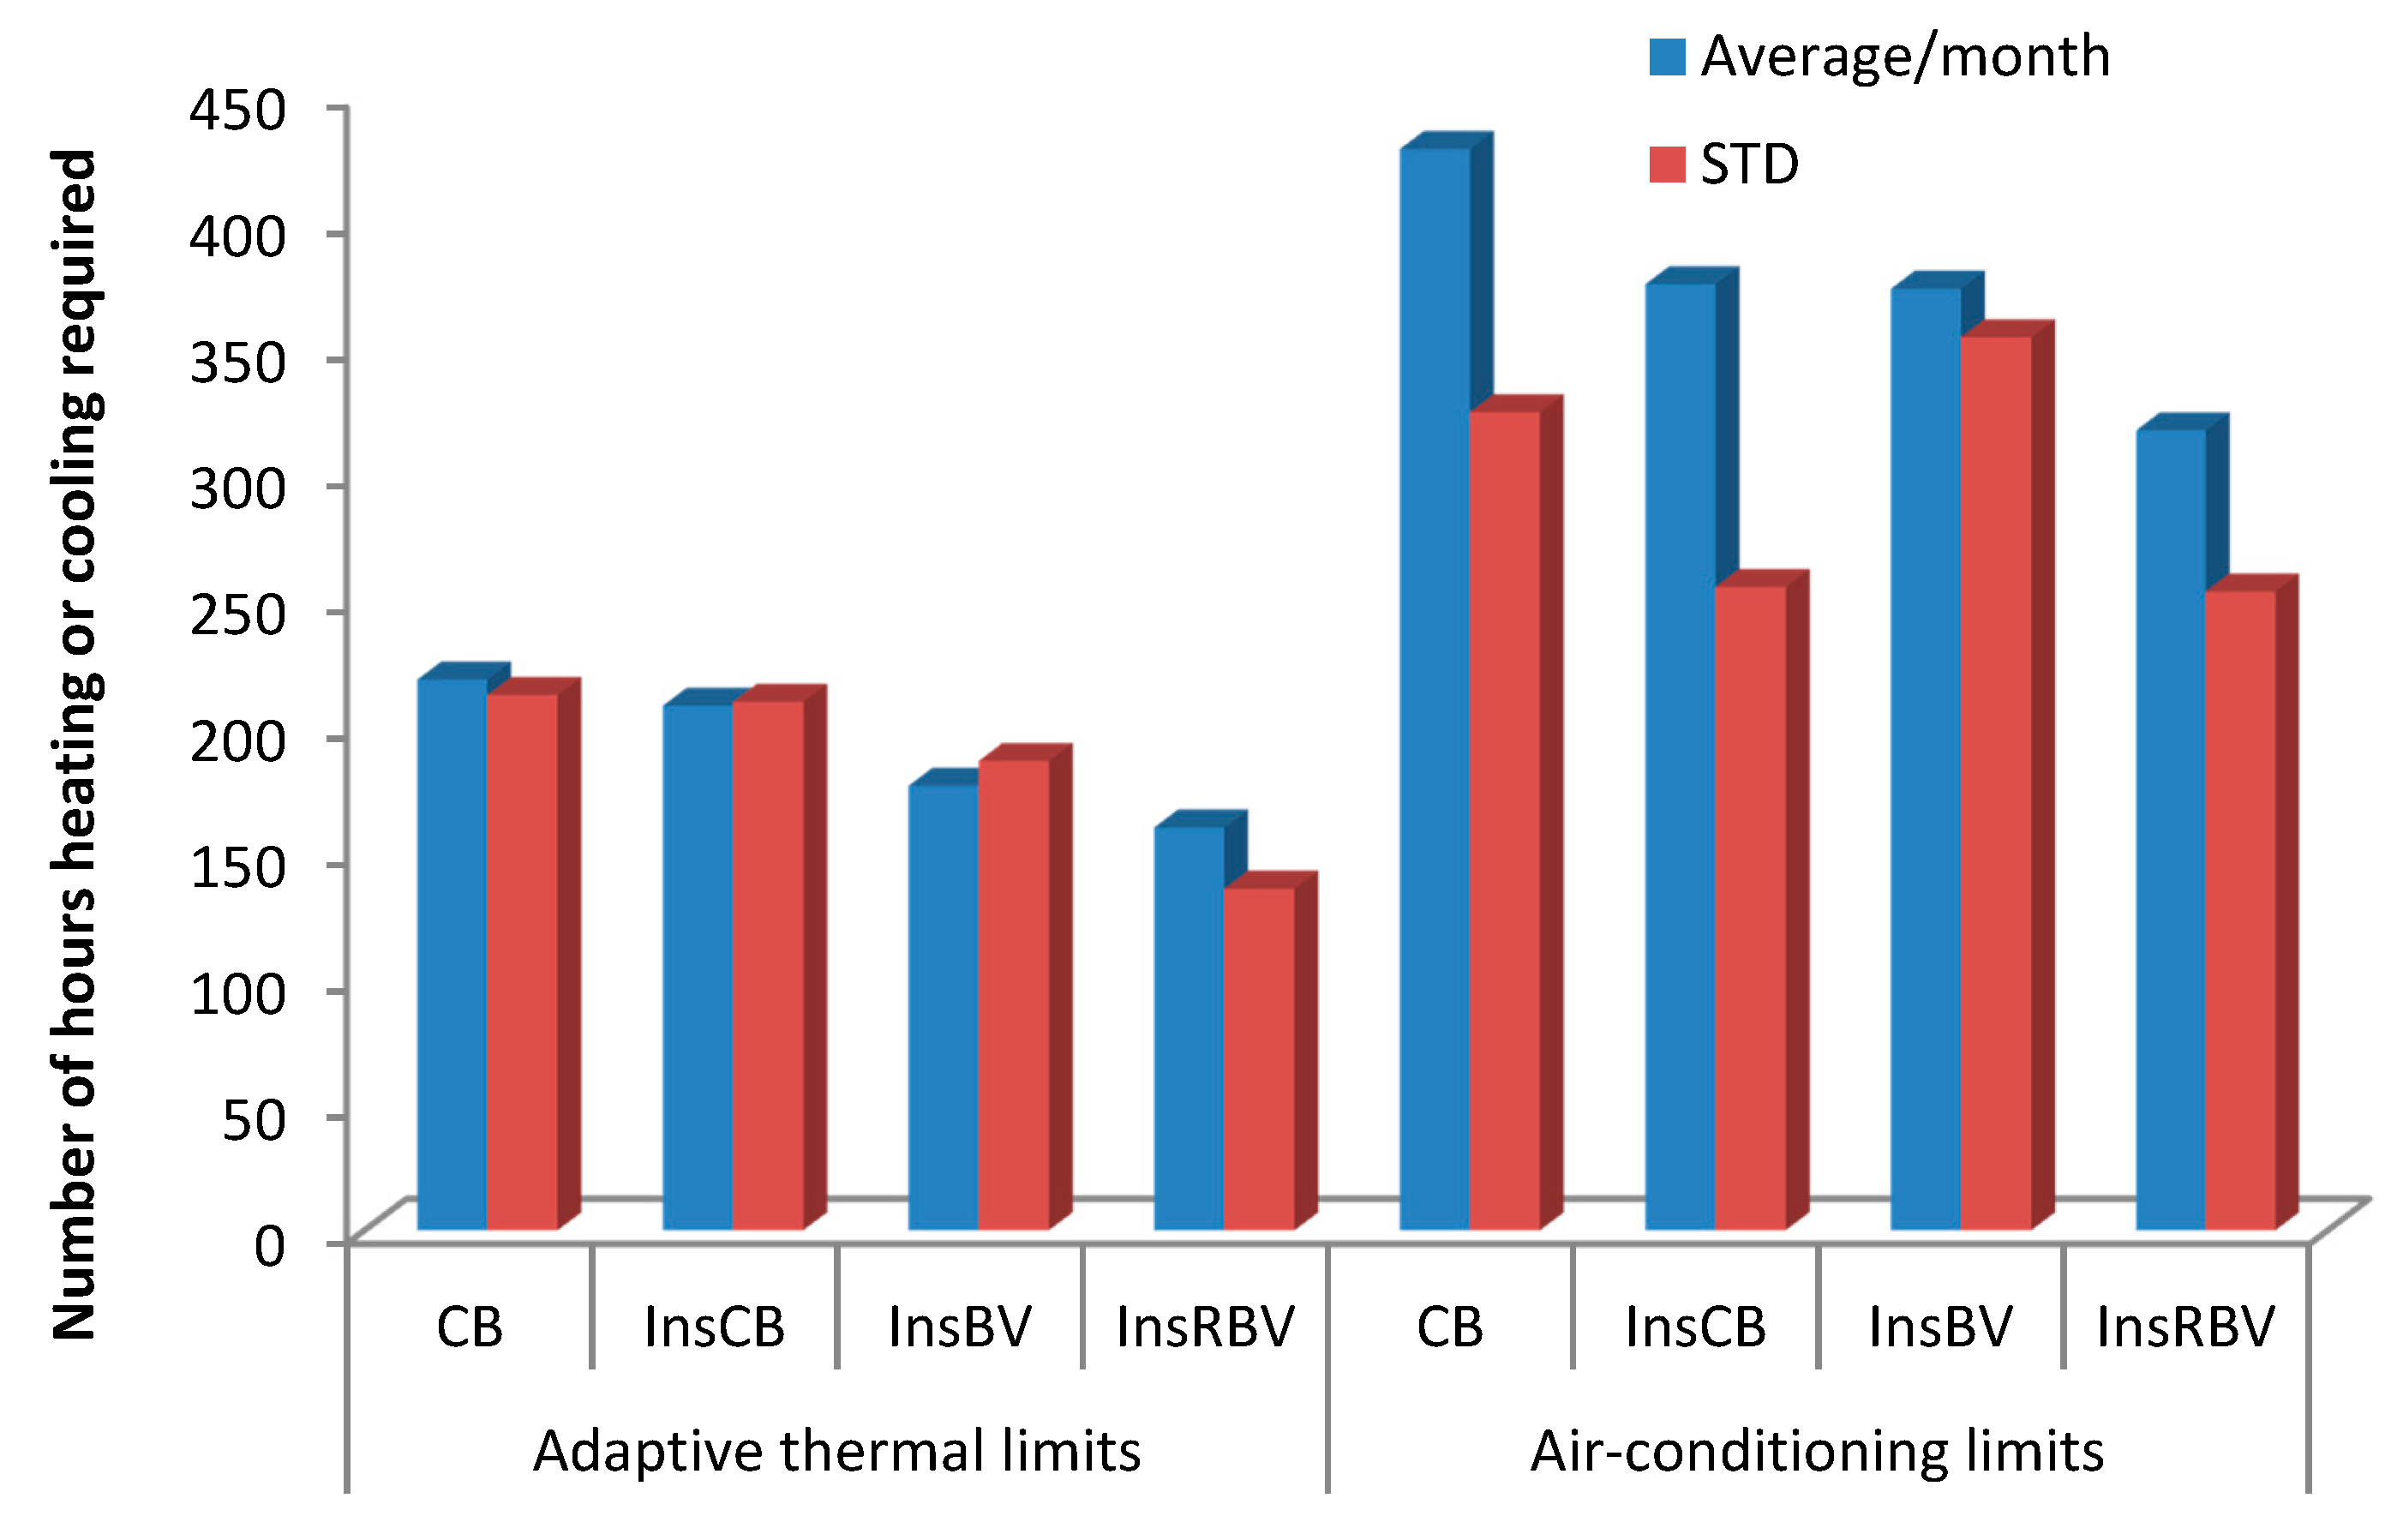
Comparing the average hours required for heating and cooling showed that the monthly average time for the adaptive thermal limits was almost half that of the average monthly time for the air-conditioning limits where it was 160 h per month for InsRBV and reached a peak of 220 h per month for the CB module while for the air-conditioning limits, it ranged from 320 h for InsRBV to up 430 h per month for the CB module. These also applied to the standard deviation which indicated that the data points were spread out over a wider range of values for the air-conditioning limits when compared with the adaptive thermal limits as shown in Figure 11.
Using the adaptive thermal comfort limits over a fixed thermostat setting used by the air-conditioning systems gives the occupants the chance to control their environment and use low energy solutions to obtain and sustain their thermal comfort. These measures will ultimately reduce the overall heating and cooling energy requirements.
4. Conclusions
The thermal comfort model has a direct impact on the prediction of the operational heating and cooling loads for the buildings. Using the adaptive thermal approach adjusts the comfortable temperature ranges for an air-conditioning system, thus saving significant amounts of energy. The occupants have more options to adjust their desired thermal comfort by using easy actions such as ventilation, suitable clothes, and opening windows instead of using energy. The adaptive thermal comfort model saves more energy in buildings that are naturally ventilated when compared to air conditioned buildings as residents adjust to wider indoor temperatures than the peripheral thermal comfort zones determined by the PMV model. The PMV model also presumes that residents will believe that it is hotter than it really is, which gives the air-conditioning units false data to reduce operative temperatures and ultimately increases energy consumption.
There are issues associated with using the fixed temperature settings for an air-conditioning system, for example, the system activated cooling mode in winter for the InsBV module when the temperature exceeded 24 °C. This accelerated the rate of valuable energy lost and the heating was required after a few hours to compensate for the heat lost during the cooling mode. This resulted in higher energy requirements for the InsBV module when compared with the other modules despite its good performance in winter days.
The fixed temperature used by air-conditioning systems to maintain thermal comfort inside the modules significantly increased the overall energy usage, especially in the summer season. This was due to the setting of a cut-off point at 22 °C on hot summer days, which required a massive amount of energy to reach that point. However, the adaptive thermal comfort approach allowed for a broader range of temperatures (23 °C–30 °C) and required a little amount of energy for the occupants’ thermal comfort.
The adaptive thermal comfort decreased the requirement for heating or cooling by almost 50% of the time when compared with the fixed settings of temperature limits for air-conditioning units. This may ultimately lead to reduced energy consumption, running costs, and a reduction of the GHG over the lifecycle of the building.
Author Contributions
Conceptualization, A.A. and D.A.; Methodology, A.A. and D.A.; Validation, A.A. and D.A.; Formal analysis, A.A.; Investigation, A.A. and D.A.; Resources, A.A. and D.A.; Data curation, A.A. and D.A.; Writing, A.A.; Preparation, A.A., D.A., A.P. and B.M.; Writing—review and editing, A.A., D.A., A.P. and B.M.; Visualization, A.A., D.A., A.P. and B.M.; Supervision, A.A., D.A., A.P. and B.M.; Project administration, A.A., D.A., A.P. and B.M.; Funding acquisition, A.A., D.A., A.P. and B.M.
Funding
This research received no external funding.
Conflicts of Interest
The authors declare no conflicts of interest.
References
- Office of Energy Efficiency & Renewable Energy (EERE). Buildings Energy Data Book; US Department of Energy: Washington, DC, USA, 2009.
- Maleviti, E.; Wehrmeyer, W.; Mulugetta, Y. An Empirical Assessment to Express the Variability of Buildings’ Energy Consumption. Int. J. Energy Optim. Eng. 2013, 2, 55–67. [Google Scholar]
- Yao, R.; Costanzo, V.; Li, X.; Zhang, Q.; Li, B. The effect of passive measures on thermal comfort and energy conservation. A case study of the hot summer and cold winter climate in the Yangtze River region. J. Build. Eng. 2018, 15, 298–310. [Google Scholar]
- Ferreira, P.M.; Ruano, A.E.; Silva, S.; Conceicao, E.Z.E. Neural networks based predictive control for thermal comfort and energy savings in public buildings. Energy Build. 2012, 55, 238–251. [Google Scholar] [Green Version]
- Directive (EU) 2018/844 of the European Parliament and of the Council of 30 May 2018 Amending Directive 2010/31/EU on the Energy Performance of Buildings and Directive 2012/27/EU on Energy Efficiency. Available online: https://eur-lex.europa.eu/legal-content/EN/TXT/?uri=uriserv:OJ.L_.2018.156.01.0075.01.ENG&toc=OJ:L:2018:156:FULL (accessed on 29 September 2018).
- D’Ambrosio Alfano, F.R.; Olesen, B.W.; Palella, B.I.; Riccio, G. Directive 2012/27/EU. Thermal comfort: Design and Assessment of Energy Saving. Energy Build. 2014, 81, 326–336. [Google Scholar]
- Yang, W.; Moon, H.J. Cross-modal effects of noise and thermal conditions on indoor environmental perception and speech recognition. Appl. Acoust. 2018, 141, 1–8. [Google Scholar]
- De Dear, R.; Brager, G.S. Developing an Adaptive Model of Thermal Comfort and Preference; American Society of Heating, Refrigerating and Air-Conditioning Engineers: New York, NY, USA, 1998; Volume 104. [Google Scholar]
- Parsons, K. Human Thermal Environments: The Effects of Hot, Moderate, and Cold Environments on Human Health, Comfort, and Performance; CRC Press: Boca Raton, FL, USA, 2014. [Google Scholar]
- Yun, G.Y. Influences of perceived control on thermal comfort and energy use in buildings. Energy Build. 2018, 158, 822–830. [Google Scholar]
- Handbook, ASHRAE Fundamentals. American Society of Heating, Refrigerating and Air-Conditioning Engineers; American Society of Heating, Refrigerati ng and Air-Conditioning Engineers Inc.: Atlanta, GA, USA, 2009; Available online: http://shop.iccsafe.org/media/wysiwyg/material/8950P217-toc.pdf (accessed on 9 October 2017).
- CEN, the European Committee for Standardization. EN ISO 17772-1 Energy Performance of Buildings—Indoor Environmental Quality—Part 1: Indoor Environmental Input Parameters for the Design and Assessment of Energy Performance of Buildings; International Standardization Organization: Geneva, Switzerland, 2017. [Google Scholar]
- EN 15251: 2007 Indoor Environmental Input Parameters for Design and Assessment of Energy Performance of Buildings Addressing Indoor Air Quality, Thermal Environment, Lighting and Acoustics; Brussels, Belgium, 2007. Available online: http://www.buildup.eu/en/practices/publications/information-paper-en-15251-indoor-environmental-input-parameters-design-and (accessed on 9 January 2019).
- Olesen, B.W. Revision of EN 15251: Indoor environmental criteria. REHVA J. 2012, 49, 6–12. [Google Scholar]
- International Organization for Standardization. Ergonomics of the Thermal Environment: Analytical Determination and Interpretation of Thermal Comfort Using Calculation of the PMV and PPD Indices and Local Thermal Comfort Criteria; International Organization for Standardization: London, UK, 2005. [Google Scholar]
- ISO. Ergonomics of the Thermal Environment–Instruments for Measuring Physical Quantities; ISO Standard 7726; International Standardization Organization: Geneva, Switzerland, 1998. [Google Scholar]
- ISO. Ergonomics of the Thermal Environment e Determination of Metabolic Rate; ISO Standard 8996; International Standardization Organization: Geneva, Switzerland, 2004. [Google Scholar]
- ISO. Ergonomics of the Thermal Environment and Estimation of the Thermal Insulation and Evaporative Resistance of a Clothing Ensemble; ISO Standard 9920; International Standardization Organization: Geneva, Switzerland, 2007. [Google Scholar]
- Van Hoof, J. Forty years of Fanger’s model of thermal comfort: Comfort for all? Indoor Air 2008, 18, 182–201. [Google Scholar]
- Nicol, J.F.; Humphreys, M.A. Adaptive thermal comfort and sustainable thermal standards for buildings. Energy Build. 2002, 34, 563–572. [Google Scholar]
- Wu, T.; Cao, B.; Zhu, Y. A field study on thermal comfort and air-conditioning energy use in an office building in Guangzhou. Energy Build. 2018, 168, 428–437. [Google Scholar]
- Mora, R.; Bean, R. Thermal Comfort: Designing for People. ASHRAE J. 2018, 60, 40–46. [Google Scholar]
- ASHRAE. Thermal environmental conditions for human occupancy. In ANSI/ASHRAE Standard 55; American Society of Heating, Refrigerating and Air Conditioning Engineers: Atlanta, GA, USA, 2017. [Google Scholar]
- ASHRAE. Guideline 10-2016—Interactions Affecting the Achievement of Acceptable Indoor Environments; American Society of Heating, Refrigerating and Air Conditioning: Atlanta, GA, USA, 2016. [Google Scholar]
- D’Ambrosio Alfano, F.R.; Olesen, B.W.; Palella, B.I.; Riccio, G. Povl Ole Fanger’s impact ten years later. Energy Build. 2017, 152, 243–249. [Google Scholar] [CrossRef]
- Soebarto, V.; Bennetts, H. Thermal comfort and occupant responses during summer in a low to middle income housing development in South Australia. Build. Environ. 2014, 75, 19–29. [Google Scholar] [CrossRef]
- De Dear, R.J.; Brager, G.S.; Reardon, J.; Nicol, F. Developing an adaptive model of thermal comfort and preference/discussion. ASHRAE Trans. 1998, 104, 145. [Google Scholar]
- Nicol, F.; Humphreys, M. Derivation of the adaptive equations for thermal comfort in free-running buildings in European standard EN15251. Build. Environ. 2010, 45, 11–17. [Google Scholar] [CrossRef]
- Ren, Z.; Chen, D. Modelling study of the impact of thermal comfort criteria on housing energy use in Australia. Appl. Energy 2018, 210, 152–166. [Google Scholar] [CrossRef]
- Hwang, R.L.; Lin, T.P.; Kuo, N.J. Field experiments on thermal comfort in campus classrooms in Taiwan. Energy Build. 2006, 38, 53–62. [Google Scholar] [CrossRef]
- Fanger, P.O. The effect of air humidity in buildings on man’s comfort and health. In Proceedings of the CISCO-ITBTP Seminar Humidity in Building, Saint Remy les Chevreuse, France, November 1982. [Google Scholar]
- Fanger, P.O. Air Humidity, Comfort and Health; Technical University of Denmark: Kongens Lyngby, Denmark, 1971; pp. 192–195. [Google Scholar]
- Fanger, P.O.; Toftum, J. Extension of the PMV model to non-air-conditioned buildings in warm climates. Energy Build. 2002, 34, 533–536. [Google Scholar] [CrossRef]
- Moujalled, B.; Cantin, R.; Guarracino, G. Comparison of thermal comfort algorithms in naturally ventilated office buildings. Energy Build. 2008, 40, 2215–2223. [Google Scholar] [CrossRef]
- Holopainen, R.; Tuomaala, P.; Hernandez, P.; Häkkinen, T.; Piira, K.; Piippo, J. Comfort assessment in the context of sustainable buildings: Comparison of simplified and detailed human thermal sensation methods. Build. Environ. 2014, 71, 60–70. [Google Scholar] [CrossRef]
- Ji, W.; Cao, B.; Luo, M.; Zhu, Y. Influence of short-term thermal experience on thermal comfort evaluations: A climate chamber experiment. Build. Environ. 2017, 114, 246–256. [Google Scholar] [CrossRef]
- Castaño-Rosa, R.; Rodríguez-Jiménez, C.; Rubio-Bellido, C. Adaptive Thermal Comfort Potential in Mediterranean Office Buildings: A Case Study of Torre Sevilla. Sustainability 2018, 10, 3091. [Google Scholar] [CrossRef]
- D’Ambrosio Alfano, F.R.; Palella, B.I.; Riccio, G.; Malchaire, J. On the effect of Thermophysical properties of clothing on the heat strain predicted by PHS model. Ann. Occup. Hyg. 2015, 60, 231–251. [Google Scholar] [CrossRef] [PubMed]
- Albatayneh, A.; Alterman, D.; Page, A.; Moghtaderi, B. Assessment of the Thermal Performance of Complete Buildings Using Adaptive Thermal Comfort. Procedia-Soc. Behav. Sci. 2016, 216, 655–661. [Google Scholar] [CrossRef] [Green Version]
- Albatayneh, A.; Alterman, D.; Page, A.; Moghtaderi, B. The Significance of Temperature Based Approach Over the Energy Based Approaches in the Buildings Thermal Assessment. Environ. Clim. Technol. 2017, 19, 39–50. [Google Scholar] [CrossRef] [Green Version]
- Albatayneh, A.; Alterman, D.; Page, A.; Moghtaderi, B. Temperature versus energy based approaches in the thermal assessment of buildings. Energy Procedia 2017, 128, 46–50. [Google Scholar] [CrossRef]
- Albatayneh, A.; Alterman, D.; Page, A.; Moghtaderi, B. Thermal Assessment of Buildings Based on Occupants Behavior and the Adaptive Thermal Comfort Approach. Energy Procedia 2017, 115, 265–271. [Google Scholar] [CrossRef]
- Albatayneh, A.; Alterman, D.; Page, A.; Moghtaderi, B. Renewable Energy Systems to Enhance Buildings Thermal Performance and Decrease Construction Costs. Energy Procedia 2018, 152, 312–317. [Google Scholar] [CrossRef]
- Albatayneh, A.; Alterman, D.; Page, A.; Moghtaderi, B. The Impact of the Thermal Comfort Models on the Prediction of Building Energy Consumption. Sustainability 2018, 10, 3609. [Google Scholar] [CrossRef]
- Albatayneh, A.; Alterman, D.; Page, A.; Moghtaderi, B. The Significance of the Orientation on the Overall buildings Thermal Performance-Case Study in Australia. Energy Procedia 2018, 152, 372–377. [Google Scholar] [CrossRef]
- Page, A.; Moghtaderi, B.; Alterman, D.; Hands, S. A Study of the Thermal Performance of Australian Housing; University of Newcastle: Callaghan, Australia, 2011. [Google Scholar]
- D’Ambrosio Alfano, F.R.; Palella, B.I.; Riccio, G. The role of measurement accuracy on the thermal environment assessment by means of PMV index. Build. Environ. 2011, 46, 1361–1369. [Google Scholar] [CrossRef]
Figure 1.
(a) Full scale test modules; (b) North side for all modules; (c) South side for all modules; (d) Cavity Brick (CB) with walling layout; (e) Insulated Cavity Brick (InsCB) with walling layout; (f) Insulated Brick Veneer (InsBV) with walling layout; and (g) Insulated Reverse Brick Veneer (InsRBV) with walling layout.


Figure 2.
Internal air temperatures and temperature ranges between 18 °C and 24 °C when using the air-conditioning systems for the CB module.
Figure 2.
Internal air temperatures and temperature ranges between 18 °C and 24 °C when using the air-conditioning systems for the CB module.

Figure 3.
Number of hours per year required for heating and cooling and the total for heating and cooling using air-conditioning to maintain temperatures between 18 °C and 24 °C inside each module.
Figure 3.
Number of hours per year required for heating and cooling and the total for heating and cooling using air-conditioning to maintain temperatures between 18 °C and 24 °C inside each module.

Figure 4.
Internal air temperatures of all modules under controlled air conditions [46].
Figure 4.
Internal air temperatures of all modules under controlled air conditions [46].

Figure 5.
Internal air temperatures and thermal comfort ranges (80% acceptability higher/lower) limits for the CB module for one year.
Figure 5.
Internal air temperatures and thermal comfort ranges (80% acceptability higher/lower) limits for the CB module for one year.

Figure 6.
Number of hours for heating, cooling, and the total time (heating + cooling) for each module using the 80% acceptability limits for the adaptive thermal comfort approach.
Figure 6.
Number of hours for heating, cooling, and the total time (heating + cooling) for each module using the 80% acceptability limits for the adaptive thermal comfort approach.

Figure 7.
Number of hours required for heating or cooling using air-conditioning and the adaptive thermal comfort approach.
Figure 7.
Number of hours required for heating or cooling using air-conditioning and the adaptive thermal comfort approach.

Figure 8.
Number of hours required for heating or cooling using air-conditioning and the adaptive thermal comfort approach for each month.
Figure 8.
Number of hours required for heating or cooling using air-conditioning and the adaptive thermal comfort approach for each month.

Figure 9.
Number of hours of heating required during the winter months.

Figure 10.
Number of hours of cooling required during the summer months.

Figure 11.
Monthly average and standard deviations for each module.

© 2019 by the authors. Licensee MDPI, Basel, Switzerland. This article is an open access article distributed under the terms and conditions of the Creative Commons Attribution (CC BY) license (http://creativecommons.org/licenses/by/4.0/).
Share and Cite
MDPI and ACS Style
Albatayneh, A.; Alterman, D.; Page, A.; Moghtaderi, B. The Significance of the Adaptive Thermal Comfort Limits on the Air-Conditioning Loads in a Temperate Climate. Sustainability 2019, 11, 328. https://doi.org/10.3390/su11020328
AMA Style
Albatayneh A, Alterman D, Page A, Moghtaderi B. The Significance of the Adaptive Thermal Comfort Limits on the Air-Conditioning Loads in a Temperate Climate. Sustainability. 2019; 11(2):328. https://doi.org/10.3390/su11020328
Chicago/Turabian StyleAlbatayneh, Aiman, Dariusz Alterman, Adrian Page, and Behdad Moghtaderi. 2019. "The Significance of the Adaptive Thermal Comfort Limits on the Air-Conditioning Loads in a Temperate Climate" Sustainability 11, no. 2: 328. https://doi.org/10.3390/su11020328
Note that from the first issue of 2016, this journal uses article numbers instead of page numbers. See further details here.