Do Urban Subway Openings Reduce PM2.5 Concentrations? Evidence from China

1
Economics and Management School, Wuhan University, Wuhan 430072, China
2
School of Public Finance and Taxation, Zhongnan University of Economics and Law, Wuhan 430073, China
*
Authors to whom correspondence should be addressed.
Sustainability 2018, 10(11), 4147; https://doi.org/10.3390/su10114147
Submission received: 15 October 2018
/
Revised: 7 November 2018
/
Accepted: 9 November 2018
/
Published: 11 November 2018
(This article belongs to the Special Issue Characteristics, Health Risk Assessment and Sustainable Management of Air Pollutants in Asia)
Abstract
:With the fast-growing consumption of automobiles in China, vehicle fumes appear to be one of the major contributors to PM2.5 (fine particles with a diameter of 2.5 μm or less) emissions. As a type of green transportation, Chinese urban subway transit has developed rapidly in recent years. This paper estimates the effect of urban subway openings on PM2.5 concentrations in Chinese cities. Using daily air quality data for 29 Chinese cities from 2013 to 2018, and using regression discontinuity design, we find that new subway openings reduce PM2.5 concentrations by an average of 18 μg/m3. The potential mechanism for this emission reduction is due to the offset in on-road transportation, and the use of cleaner energy. Also, central heating in winter, population scale, and city tier play crucial roles in the emission-reducing effect of subway openings. A series of robustness tests are conducted to support the fundamental empirical results. Targeted policy implications, such as optimizing the planning of urban subway construction and road network, fostering awareness of green travel, and promoting the innovation of emission-reducing technologies, are suggested for sustainable development in Chinese cities.
1. Introduction
Urban on-road transportation generates several negative externalities, the most important of which are traffic congestion (time delay and extra fuel consumption), air pollution, and traffic accidents [1,2,3,4]. Numerous cities around the world have adopted a wide range of policies to address these problems, such as road pricing, driving restrictions, investment in public transit infrastructure, and an increasing supply of public transit services. However, much attention among previous studies has focused on the theory and practice of road pricing and the effect of driving restrictions [5,6,7]. Systematic empirical evidence on the effect of subway openings on air pollution remains relatively scant.
In the current work, we study the effect of urban subway openings on PM2.5 (fine particles with a diameter of 2.5 μm or less) concentrations in Chinese cities. There are three main reasons for this focus. First, China ranks first in subway mileage all over the world due to the large-scale subway construction in recent years. The effect of subway openings in the largest developing country is a significant and remarkable topic. Large-scale subway construction in a variety of cities also provides a new opportunity to analyze the heterogeneities among cities, such as central heating and population scale. Second, China has become the largest automobile market, with a fast-growing rate of consumption of automobiles in Chinese cities. Intensive fuel consumption causes numerous externalities, such as air pollution [2,3]. On-road transport has become one of main sources of air pollution [8]. According to the statistics of the Beijing Environmental Protection Bureau and the Tianjin Environmental Protection Bureau, vehicles are responsible for at least 20 percent of particulate matter (PM2.5). Subways become an attractive alternative for on-road vehicles, especially automobiles. Third, PM2.5 is one of the major air pollutants, and it affects citizens’ health because it consists of especially fine particulate matter that might cause cardiovascular and cerebrovascular diseases [9,10,11]. The serious air pollution not only increases human health risk, but also damages the home environment [12,13,14,15]. The 2010 Global Burden of Disease Study reveals that air pollution is the fourth leading health risk factor for Chinese people [16]. PM2.5 emission has become an extremely serious issue in China over the past few years. In January 2013, large-scale hazes enveloped 30 provinces of China four times. In particular, there were only five days in Beijing without haze in that month. This makes subway construction of great policy relevance. As a type of green traffic, subway openings may reduce PM2.5 concentrations, and thereby improve the health of many Chinese people.
As one of the proposed solutions to the issue of this type of air pollution, new subway openings can only reduce PM2.5 concentrations if: (1) subways provide an attractive alternative to on-road driving, thus freeing up the roads, and (2) subways generate less pollution than road transportation.
First, since the value of time spent in traveling is significant [17,18,19], subway transit can serve as an effective way to reduce the demand for roadway travel, such as private driving and taxi driving. On-road vehicles are one of the major contributors to urban air pollution. For example, vehicles are responsible for at least 20 percent of particulate matter (PM2.5), 74 percent of hydrocarbons (HC), 63 percent of carbon monoxide (CO), and 37 percent of nitrogen oxides (NOx) in urban China. It is well known that gasoline vehicles emit CO, NOx, and HC, and that these emissions reduce visibility. Moreover, NOx and HC also react to form particulate matter, which leads to secondary pollution. The number of automobiles is significantly correlated with PM2.5 [20]. Therefore, the first hypothesis is that subway substitutions for on-road vehicles will reduce PM2.5 concentrations in cities. However, it is not intuitively clear how well people in various cities will respond to subway openings. In other words, it is necessary to estimate the substitutability of subways for road transportation. Some previous studies have shown that many subway users used their cars rather than available carpools or buses before they were subway users [21,22]. Consequently, the substitution effect may directly cause a change from private cars to the subway. As for the second hypothesis, underground transportation performs better than road transportation with respect to environmental externalities, since the use of electric energy is cleaner than using fossil fuels in automobiles [23,24,25,26]. For most pollutants, the specific emissions for railways are lower than those for automobiles.
The Chinese urban subway system developed slowly before 2007. However, since 2007, it has developed rapidly. The first subway in China was the Beijing Subway, which was opened in January 1971. By the end of the 1980s, the subway mileage was only 47.4 km long, and only two cities throughout China opened subways. Unfortunately, since a notice that suspended the approval of urban underground rail transit projects was issued by the General Office of the State Council, Chinese urban subway construction began to stagnate. Beginning in 2007, a great upsurge in the expansion of subway systems occurred again. Consequently, ten cities opened subways in 2008, with a total mileage of 776 km. By the end of 2017, 31 cities in mainland China had opened subways, and subway mileage reached 3884 km [27] (see Table A1 in Appendix A). Meanwhile, new subway lines in 53 cities were under construction, the mileage of which was about 5770 km [28]. Moreover, Shanghai’s subway mileage reached 617 km in March 2017, which is the largest in total in the world. According to statistics, half of all Shanghai passengers choose the subway over all other types of public transportation [29].
As the country that ranks first in subway mileage, the impact of Chinese subway openings is worthy of analysis. The objectives of this study were: (I) to identify the effect of subway openings on urban PM2.5 emissions in China, and to provide powerful evidence on the environmental effects of urban subway openings in the largest developing country; (II) to analyze the heterogeneity effects in various types of cities, and the potential mechanisms for the emission-reducing effects of new subway openings; (III) to formulate targeted policy recommendations for green transportation and sustainable development in Chinese cities.
The rest of paper is organized as follows. Section 2 reviews the literature on green transport and the effects of public transportation policies. Section 3 introduces data sets and Section 4 provides the framework for empirical analysis. Section 5 reports the results and Section 6 discusses the results. The last section concludes.
2. Literature Review
Our study contributes to two strands of literature: studies regarding green transport as well as the connected decision problems, and studies that examine the effects of public policies and regulations to address the negative externalities that are generated by road transportation.
Some studies investigated the policy decision problems regarding green transport, how to reduce transport energy and emissions efficiently, and achieve better sustainability performance [30,31,32]. Governments have the duty to implement policy strategies, such as adoption of “clean energy technologies”, to improve air pollution caused by vehicles [33,34,35]. The achievement of green goals is not always easy, and more specific analyses are necessary. Klumpp [36,37,38] analyzed the reasons behind the failure of green logistics by drawing on political, economic, and business as well as social motivations and examples, and investigated how to improve sustainability performance and efficiency. Two ways were proposed including public control and restriction, as well as public investment in low-emission transport infrastructure. Some literature also focused on the transport behavior, which concluded that major transport policy that could reduce passenger travel levels would be most effective in transport emission cuts [22,39,40,41].
Much attention among previous studies has focused on the effects of road pricing and driving restrictions, the results of which are contradictory in various cities [5,6,7,42,43,44]. Johansson-Stenman [45] reviewed the theory of congestion pricing for roads and suggests that improved public transport or frequent use of public transport are potentially important policy complements to road pricing. As for other road and transport policies, Wang et al. [46] found that road patterns have a significant effect on PM2.5 concentrations. A tight network, and a high percentage of branch roads and secondary roads could decrease PM2.5 concentrations. Wang and Yang [47] examined the impact of freight transport policies in China from 1999 to 2016 and found that the modal shift of freight from road to rail decreases PM2.5 concentrations not only in a province, but also in neighboring provinces.
Unfortunately, studies on the environmental effect of public transit and green transport are also ambiguous at this point in time. Some studies mentioned that mass transit systems attracted a disproportionately high share of public funds, but that passenger use of public transportation (buses, subways, etc.) constituted a negligible fraction of total passenger trips [48], which indicated that the actual effect of public transit might not be as great as expected [49,50]. Moreover, investments in transportation infrastructure may induce more travel demand, which has an important influence on subsequent studies, and the net effect of the automobile is unclear [51,52]. Beaudoin et al. [53] provided a framework for evaluating public transit investments, taking into account the effects of transit investment on traffic congestion and air quality. As we can see, the mixed evidence in related literature may again imply that there is heterogeneity in the relationship between urban transportation and air quality. Empirical evidence on the impact of public transportation on air pollution has also been unclear. Adler and Ommeren [54] used quasi-natural experimental data on citywide public transit strikes for Rotterdam and found that congestion relief by public transit is substantial. Qiu et al. [55,56] proposed a new concept of “pollution rebound effect” and found that the direct air pollution rebound effect did not exist in the road passenger transport sector in China during the period 1986–2014, and the green traffic pilot program was associated with reductions in annual concentration of air pollutants. Yang et al. [57] evaluated the impact of urban transportation investment on SO2 emissions and found that urban transportation investment increases SO2 emissions in the short run, but the urban transportation investment has a positive impact on reducing SO2 emissions in the long run.
Different from on-road public transportation such as buses, the subway is an underground rapid transit system, and it generally uses cleaner power. However, there are few studies that specifically focus on the effect of urban subway openings, and the effects on the different types of pollutants are unclear. Chen and Whalley [58] quantified the effects of urban rail transit in Taipei and found that the opening of the Metro reduced air pollution for one key tailpipe pollutant, carbon monoxide (CO), by five to 15 percent. However, there is little evidence to show that ground-level ozone pollution was affected by the metro opening. Lalive et al. [59] found that increasing the rail service by 10 percent reduced carbon monoxide (CO) and nitrogen oxide (NOx) pollution by around one percent and two percent, respectively, but there was little evidence showing that sulfur dioxide (SO2) and ozone (O3) are reduced with increases in rail service. This study extends previous work by comparing the heterogeneity effects of subway openings in 29 cities, analyzing the potential mechanism and including PM2.5 concentration as a main outcome, which were not available before.
Chinese urban subway expansions have become extremely large-scale operations in recent years, and they are expected to accelerate over the next few years. However, there are few similar studies on the effect of subway openings on urban PM2.5 concentrations conducted in China. This paper uses data sets, including the openings of new subway lines in Chinese cities from 2013 to 2017, to identify this effect. It demonstrates that the opening of new-built subway lines significantly reduces PM2.5 concentrations, thereby improving air quality. Therefore, this study enriches previous related literature on the effect of public transportation policies, by showing how Chinese subway openings have affected PM2.5 concentrations over the past five years, which could also provide empirical evidence on the emission-reducing effects of subway openings for other countries.
3. Data
To analyze the impact of urban subway openings on PM2.5 emissions, we used three main data sets, which contain indicators of new subway openings, the daily air quality index (AQI), and the daily weather conditions for sample cities in China. The sample period in this paper is from 1 December 2013 to 30 January 2018.
We manually collected the opening dates of new subway lines in Chinese cities, from December 2013 to December 2017. This paper only chose newly built subway lines. We excluded the expansion of lines and cross-city lines. The data were collected primarily from the China Metro website and official websites of subway operating companies in sample cities.
Air quality data are published daily and hourly by the Ministry of Environmental Protection (MEP). Following the new ambient air quality standards (GB 3095-2012), the MEP stopped publishing the API and switched to a new AQI for 74 cities from 1 January 2013. Since 1 January 2016, the new standards have been implemented nationwide. Therefore, the AQI data now covers 338 prefectures. The aggregate AQI ranges from 0 to 500, and it depends on the concentrations of six pollutants measured at monitoring stations within that city (The evaluation process of the AQI is in Appendix A): sulfur dioxide (SO2), nitrogen dioxide (NO2), carbon monoxide (CO), ozone (O3), coarse particles with a diameter between 2.5 and 10 μm (PM10), fine particles with a diameter of 2.5 μm or less (PM2.5). The AQI is divided into six categories: excellent (0–50), good (51–100), mildly polluted (101–150), moderately polluted (151–200), heavily polluted (201–300) and severely polluted (>300). A higher AQI indicates more air pollution and more harmful effects. In our analysis, the key pollutants were PM2.5, and the daily PM2.5 data for sample cities have been available on MEP’s website since December 2013. Next, we focused on the sample period from 1 December 2013 to 30 January 2018. We used both PM2.5 concentration and AQI to test the effects of the new subway openings.
Weather conditions influence PM2.5 emissions and air quality. Temperature, wind speed, and precipitation exert the largest controls on PM2.5 concentrations. Some studies have shown that PM2.5 concentrations are robustly negatively related to precipitation and wind speed, while they are positively associated with temperature [60,61,62]. Of note also, ozone is not easily formed on rainy, windy, and cool days. Daily weather data consists mainly of temperature, precipitation, wind speed, and these historical data were collected from 2345 weather websites. We also collected historical visibility data from the website “www.wunderground.com”. According to Malm [63], visibility is defined as the greatest distance at which an observer can exactly see a black object viewed against the horizon sky. Particulate matter is defined as any material, that is not combined with water, that exists in the solid or liquid state in the atmosphere or as a gas stream at standard condition. Particles scatter and absorb light, and impair visibility; thus, there is a negative relationship between visibility and PM2.5 concentration. Visibility has been used in many environmental economic studies as a proxy for air pollution [64]. Therefore, we also use visibility as an alternative to test the effect of new subway openings in the robustness checks.
Merging data sets of urban subway openings, PM2.5 concentration, air quality index, and weather conditions provided a final sample of 37 newly built subway lines in 29 cities between December 2013 and December 2017. Table 1 presents the summary statistics of key variables, and the differences between major air pollutants and weather conditions before and after the openings of new subway lines.
4. Model Specifications
One must first estimate the annual average emission-reducing effect of subway openings using the ordinary least squares (OLS) regression with PM2.5 concentrations or the AQI as the dependent variable, and subway mileage or passenger flow as the independent variable. However, the results based on this approach are likely to be biased, because other observable and unobservable characteristics might affect both the dependent and independent variables. Besides, there might be more congestion and air pollution in the cities whose subways are under construction. To address these endogeneity concerns, we selected the regression discontinuity design (RDD) as our primary model specification [65,66], which implies sharp discontinuities in AQI or PM2.5 concentrations on the opening dates of new subway lines.
Our main model was the following sharp regression discontinuity design:
where the dependent variable is PM2.5 in city i on day t, and we also estimate the effect of subway openings on AQI, visibility, and other air pollutants (SO2, NO2, CO, O3, PM10) in further regressions. Independent variables and control variables are defined as follows:
subwayopenit: a dummy variable (a binary variable) set to 1 if on day t new subway line opened in city i, indicating whether new subway lines opened in city i on day t.
f(xit): a flexible polynomial function that is used to control for time-series variations in daily PM2.5 concentrations, or unobserved confounding factors that may affect daily PM2.5 concentrations. xit is a running variable representing the time trend, which is the difference in the number of days between the day of subway openings and day t. Before the date of subway opening, xit is negative; after the opening, xit is positive.
Wit: a vector of daily weather variables for city i on day t including rain dummy (set to 1 if on day t there was precipitation in city i), wind (representing the speed of wind), temph (representing the highest temperature), and templ (representing the lowest temperature).
Zit: a vector of other control variables, including heating (indicating whether central heating was provided in city i on day t), population scale, city tier, weekend dummy, holiday dummy (representing major holidays in China including New Year’s Day, Spring Festival, Tomb-Sweeping Day, Labor Day, Dragon Boat Festival, Mid-Autumn Festival, National Day), month dummies, season dummies, and year dummies.
δi: city-fixed effects, controlling for unobserved, time-unvarying city attributes that affect PM2.5 concentrations.
εi: the error term.
β1, β2, β3, α, and γ are coefficient vectors to be estimated. The key coefficient is β1, which is the local average treatment effect of new subway openings.
Ideally, the changes of the fuel standard should also be included. However, there were only two changes in two cities in the sample period and the impact was negligible; thereby their changes were not coincident with the most periods. Besides, the flexible time trends and year fixed effects could absorb these fuel standard shocks well.
There are some special cases based on Model (1). First, we chose a small window before and after the opening day of a new subway line, and the bandwidth was set to 20 days. Such an estimation could show whether the trend of PM2.5 concentrations had a jump after the new subway openings. Second, we considered the factor of central heating in Northern China, and we tested this heterogeneity effect by estimating Model (1) for two subsamples of heating and non-heating. Third, the regional heterogeneity was tested by population size and city tier. Fourth, robustness checks were conducted. Last, the mechanism of this effect was tested by substitutions for on-road transportation.
5. Results
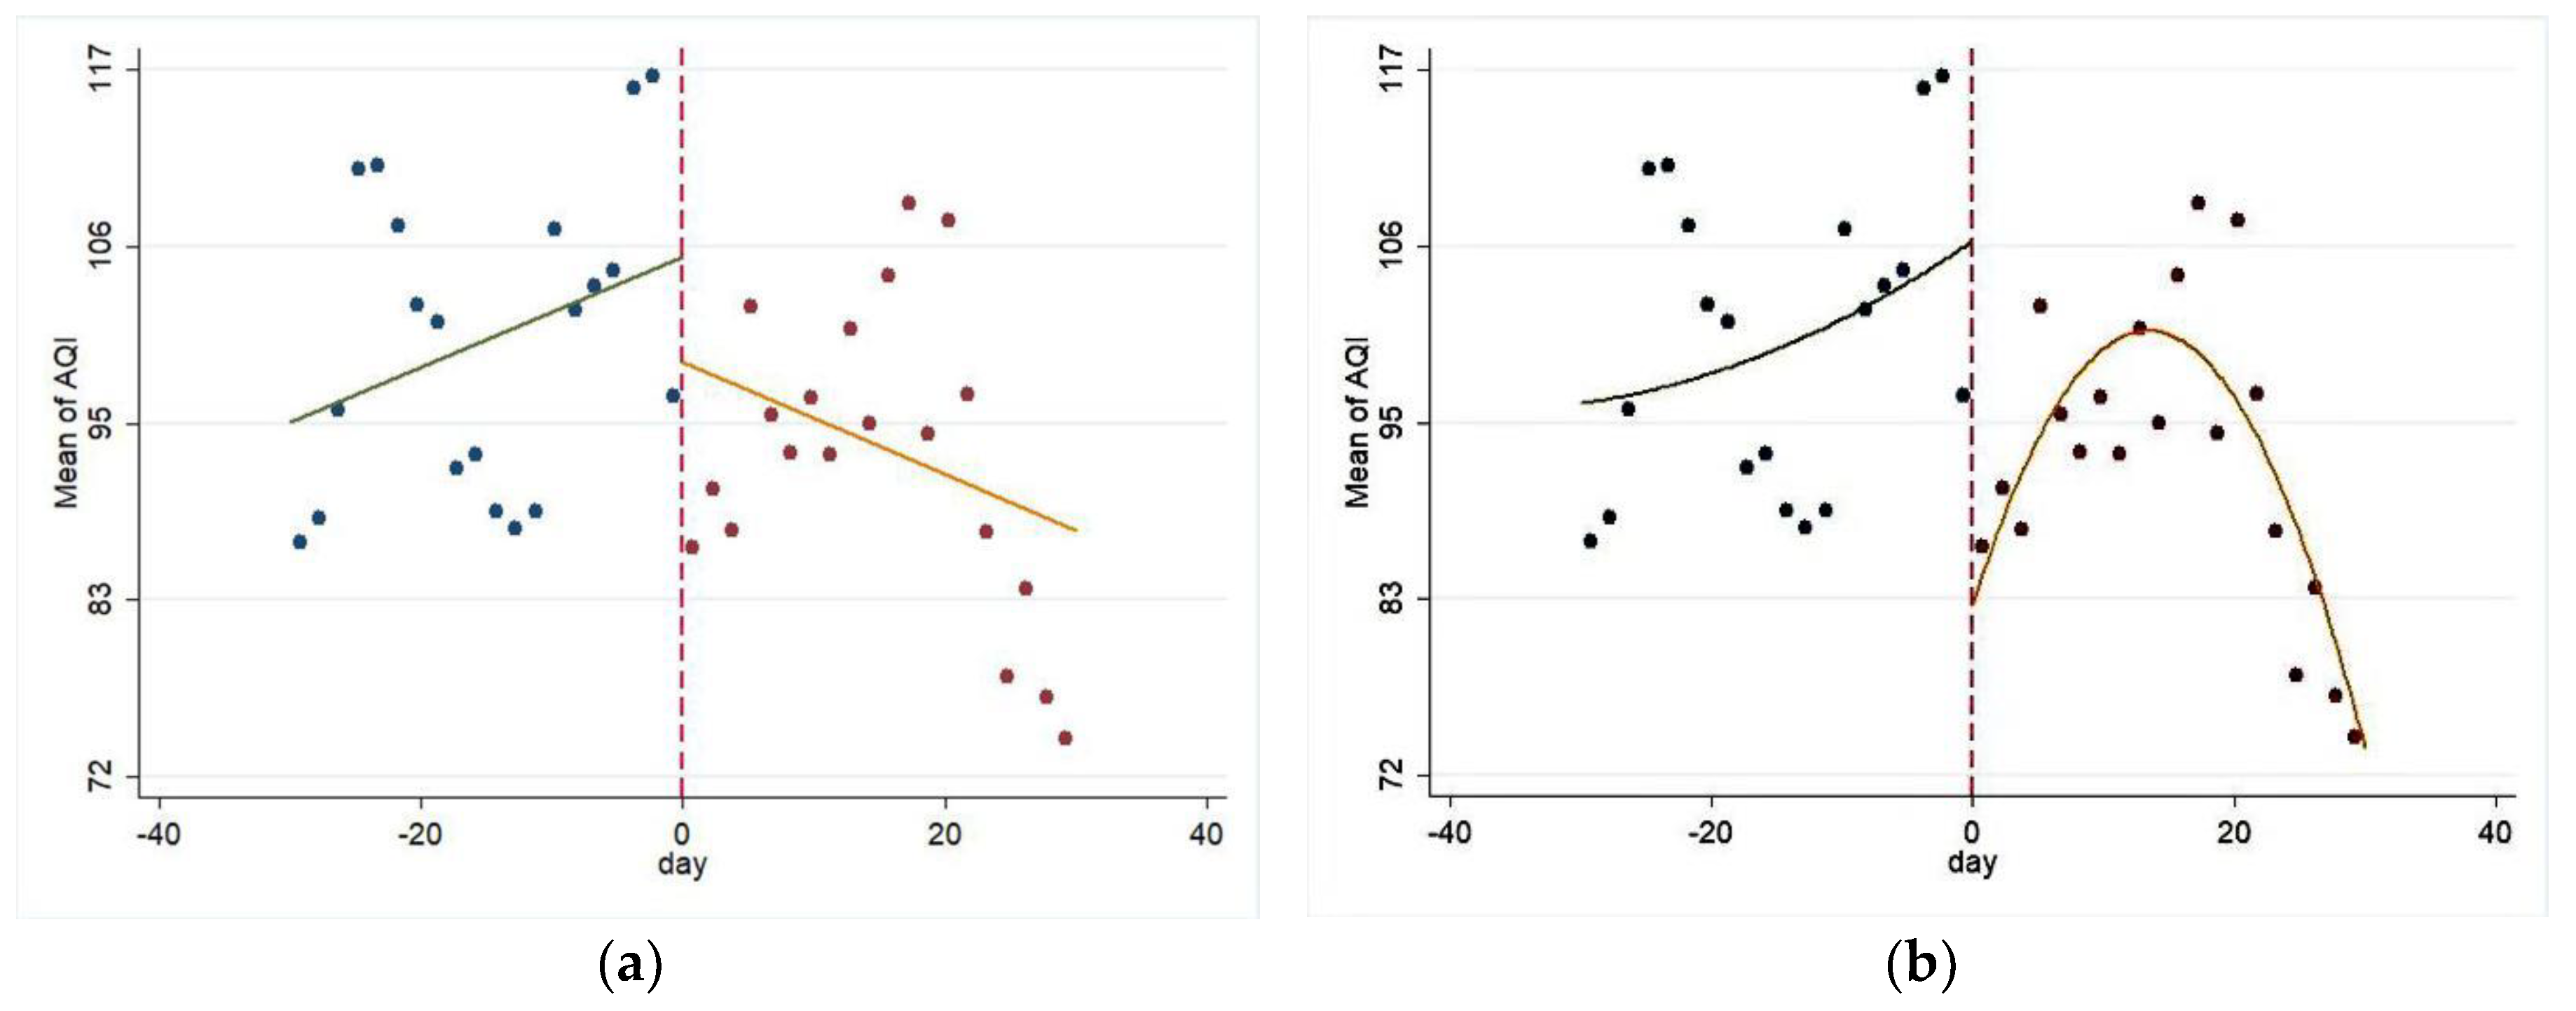
We used a regression discontinuity approach to estimates the effect of new subway openings on urban PM2.5 concentrations. First, as a visual demonstration, Figure 1 show the symmetric linear and quadratic trends before and after the new subway openings. There was a sharp discontinuity around the day of subway opening.
5.1. Regression Discontinuity Results
We now employ the RDD method with a local polynomial regression to estimates the variety in PM2.5 concentrations before and after new subway openings with a symmetric window (20 days). Specifically, we regressed PM2.5 on the subwayopen dummy, weather variables, weekend dummy, holiday dummy, month dummies, year dummies, city-fixed effects, and a flexible polynomial time trend. We considered a constant time trend, which excludes the interaction between the subwayopen variable and the time trend term, and a varying time trend, which includes the interaction between the subwayopen variable and the time trend term.
Table 2 reports the results. Columns 1–3 include polynomial time trends from the first order to third order. Panel A is based on constant time trends, while Panel B is based on varying time trends. The results show that new subway openings had a significantly negative effect on PM2.5 concentrations, both under constant time trends and varying time trends. These estimates were robust up to the third order time trend [67,68]. According to Figure 1, this paper mainly focused on linear and quadratic trends in the relative short term. The results show that urban PM2.5 concentrations decreased by at least 18 μg/m3 on average after new subway openings. As for weather variables, precipitation and wind speed were both negatively related with PM2.5 concentrations, and stable under different time trends, which is consistent with our intuition and previous studies. Moreover, it is obvious that the choices of production and consumption activities changed during weekends and holidays, which indicated that the proportion of production activities were cut down, and that the proportion of consumption and leisure activities increased. That change may affect PM2.5 concentrations [69]. However, the coefficients of weekend were very small and insignificant over all three columns, suggesting that pollution on weekends was similar to that on workdays. The coefficients of holiday were positive but not statistically significant.
5.2. Regression Discontinuity Results
5.2.1. Heterogeneity by Central Heating in Northern Cities
The effect of new subway openings may vary across cities, due to the heterogeneity of central heating in winter, population scale, city tier, and so on. First, we re-estimated Model (1) for two subsamples, to test whether central heating impaired the emission-reducing effect: cities with central heating in winter and cities with non-heating in winter. There were five cities with central heating whose dates of subway openings were exactly in winter. The results in Table 3 reflect that the statistical significance of the subwayopen coefficients in Panel A were not as good as that in Panel B, which means that new subway openings are more effective cities with non-heating. Also, we conducted Chow’s structural change test, the results of which indicated that the differences in the two panels were significant.
Winter heating contributed significantly to PM2.5 concentrations in cities with central heating, and the effect of new subway openings was offset to some extent. According to previous studies, central heating in Chinese cities increases average PM2.5 concentrations substantially, compared to the period with non-heating, while the air quality index decreases due to the decrease in coal-fired power at the end of heating period. Therefore, the polluting effect of central heating caused by coal-based energy might exceed the emission-reducing effect of new subway openings, creating the alternatives for the on-road vehicles in winter. These findings suggest that a shift from mainly coal-based energy consumption to much cleaner alternatives such as coal-to-gas in cities with central heating should be an effective solution to improve air quality in winter.
5.2.2. Heterogeneity by Population Scale
We then analyzed the role of population scale on the effect of new subway openings. On the one hand, with the increase in population, the emission-reducing effect of subway transit will enhance due to increasing returns to scale. On the other hand, when a city has an oversized population, the supply of the subway transit cannot meet the large travel demand. In this case, substitution for on-road transportation was insufficient, so that the emission-reducing effect of subway openings is not as significant as expected. In China, cities with a permanent resident population of over 10,000,000 are classified as supercities. Meanwhile, the population scale is also one of key factors and standards that affected urban subway construction. Two subsamples were then divided by the population scale, to test the heterogeneity of emission-reducing effects among these cities.
Table 4 reports the results. The cities with a population of less than 10,000,000 had greater significant coefficients of subwayopen than those supercities. This difference between the cities with different population scales indicated that the emission-reducing effect of the urban subway transit may exist as an inflection point regarding population scale. When the urban population scale was below the potential critical point, the increasing returns to scale for subway construction made the effects of new subway openings significant. While the population scale exceeds the critical point, the gap between travel demand and supply led to an insufficient effect of subway openings, so that the results of Panel A were not stable.
5.2.3. Heterogeneity by City Tier
Not only does urban population scale affect subway construction, but also the area of the city, the level of economic development, fiscal revenue capability, passenger flow, and other factors affect urban subway construction. Therefore, we chose a more comprehensive standard by which to estimate the city heterogeneity, which was the city tier. In China, cities are divided into six tiers according to five dimensions regarding commercial resource concentration, urban hub, urban vitality, life style diversity and future plasticity. There were three panels in our samples, first-tier cities (Beijing, Shanghai, Guangzhou, Shenzhen), new first-tier cities (14 cities), and second-tier cities (11 cities). We regressed Model (1) for three panels, respectively.
Let us see the results in Table 5. The coefficients of subwayopen in Panel A were not statistically significant in all the three columns, and the coefficient was even positive in the first column. Considering the results in Table 4, these cities all had extremely large population scales, and the results in Panel A reinforces the assumptions about the population scale’s role in the former analyses. However, Panel B showed that new subway openings reduced PM2.5 concentrations substantially in new first-tier cities, which was greater than Panel C, and the coefficients in the first and second columns were statistically significant at the 1% level. Panel C shows that in second-tier cities, new subway openings also exerted a significantly negative impact on PM2.5 concentrations under the quadratic time trends. These findings show that subway openings in new first-tier cities have the most effective environmental performances and suggest that transportation infrastructure is of importance to urban development, by improving traffic condition, meeting citizens’ traveling demands, promoting an urban environment and higher quality of life.
5.3. Robustness Test
5.3.1. Bandwidth Sensitivity
The estimated results by regression discontinuity method not only depended on the choice of curve-fitting, but also relied on the choice of bandwidths. We then re-estimated Model (1) under different bandwidths to test the effect of new subway openings more accurately. We chose 10 days, 15 days, 25 days, and 30 days before and after the day of subway opening to estimate the treatment effect, which included narrower and wider windows before and after new subway openings. Based on the previous analyses, we used linear and quadratic time trends to regress PM2.5 on subwayopen to test the robustness of the previous results.
Table 6 report the results based on different bandwidths. We could see that the coefficients of subwayopen in all the columns were significantly negative, which indicated that the estimated results in Table 2 were robust. The emission-reducing effect of new subway openings is statistically significant under different bandwidths.
5.3.2. AQI and Visibility
Previous studies have proven the positive relationship between AQI and PM2.5, and the negative relationship between visibility and PM2.5 [63,70]. PM2.5 is also an important index to calculate the air quality index in Chinese new ambient air quality standards (GB 3095-2012). In this part, we chose AQI and visibility as the alternatives for PM2.5 to test the robustness of the results in the fundamental regression.
Table 7 reports the effect of new subway opening using the Model (1) with AQI as the dependent variable. The coefficients of subwayopen were stable, and their significant levels were also consistent with the results in Table 2. New subway openings decreased urban AQI by about 18 to 24 μg/m3. The results also proved that PM2.5 is the main air pollutant in Chinese cities, which increases the risk of cardiopulmonary disease and mortality to citizens. We also examined effects on other air pollutants (Table A2 in the Appendix A).
Table 7 also reports on the effect of new subway openings on visibility, where the dependent variable in Model (1) has been replaced by visibility level. The coefficients of subwayopen were positive, which were opposite to the coefficients in Table 2, and consistent with the significance level in Table 2. Visibility is an important factor for on-road driving, which affects the speed of automobiles, the articulation and distance of drivers’ views, and vehicle accidents. These findings therefore imply that urban subway openings not only have an emission-reducing effect, but also contribute to the safety and commercial speed of urban on-road traffic.
5.3.3. Air Quality Data Manipulation
To incentivize air pollution abatement in Chinese cities, performance evaluations of local officials included the number of “blue-sky days”, which are days with an air pollution index or air quality index below 100. Some studies [71,72] show that Chinese cities reported dubious air pollution levels around the critical value of “blue-sky days” (AQI < 100), which means that the data in the interval around the critical value might be biased. Therefore, we put this question to another robustness test by dropping the intervals of the AQI between 95 and 105, to between 90 and 100, to re-estimate Model (1) to reduce the impact of potential data manipulation.
Table 8 reports the results after dropping the potential fraud interval of AQI data. The coefficients of subwayopen were still statistically significant, both in panel A and panel B, especially with better significant levels after dropping the AQI interval to between 90 and 110, compared to Table 2. The results show that new subway openings do reduce urban PM2.5 concentrations.
5.4. Mechanism Analysis
We assumed that subways can only reduce PM2.5 concentrations if: (1) subways provide an attractive alternative to on-road driving, freeing up the road, and if (2) subways generate less pollution than road transportation. The second hypothesis is obvious because subways powered by electricity are much cleaner than gasoline-powered vehicles. We then test the first hypothesis.
Carbon monoxide (CO) is the major pollutant emitted by motor vehicles. In 2016, the preliminary accounting of vehicle emissions in China was 44,725 million tons. There were 34.19 million tons of carbon monoxide (CO), 4.22 million tons of hydrocarbons (HC), 5.78 million tons of nitrogen oxides (NOx) and 0.53 million tons of particulate matter (PM) [73]. Therefore, we estimated the effect of new subway openings on CO, to test the alternatives of subway transit for on-road transportation. The results in Table 9 show that the emission-reducing effects of new subway openings on carbon monoxide were statistically significant under linear and quadratic time trends. These results proved that subway transit substitutes on-road transportation to some extent.
In addition, we also considered the heterogeneity of car ownership in sample cities, to further test the substitutions of subways for cars. By the end of 2016, the vehicle population of China reached 290,000,000, and the car ownership reached 194,000,000 [74]. We collected data on car ownership in these cities and divided them into cities with high car ownership and low car ownership, based on whether the amount was more than two million. The results in Table 10 show that cities with high car ownership had a better emission-reducing effect than the cities with low car ownership, which indicates that the substitution effect is larger in cities with high car ownership. These findings suggest that the subway openings affect citizens’ travel modes to some extent and prove the first hypothesis in the former assumptions.
6. Discussion
We presented the results based on a regression discontinuity design in the Section 5. The results were robust and indicated that new subway openings in Chinese cities reduced PM2.5 concentrations significantly during the period 2013–2017. As mentioned above, the most straightforward and feasible approach may be the basic OLS estimates, to examine the relationship between subway mileage and air pollution. We then used the OLS estimates as comparison, with subway mileage (the length of total subway lines), new-built mileage (the length of new-built subway lines), daily passenger flow (the average number of passengers in a day), or intensity of passenger flow (the ratio of passenger flow and subway mileage, indicating the number of passengers per kilometer) as the independent variables in this section. The data sets of subway mileage, new-built mileage, daily passenger flow and intensity of passenger flow were manually collected from the statistical report by Urban Metro Transportation Association of China. The sample period is consistent with the fundamental RDD estimates before.
Table 11 reports the results from the OLS estimates, and the coefficients were negative from regressions based on different indicators. The result indicated that the total subway mileage, daily passenger flow and intensity of passenger flow were negatively related to PM2.5 concentrations, while the relationship between new-built mileage and PM2.5 concentrations was not statistically significant. The effect on AQI was similar to PM2.5 concentrations. These indicators provided us with opportunities to discuss the effects of urban subway network from other method and perspectives. The results in Panel A and B supported the emission-reducing effect of subway openings to some degree. The results in Panel C and D could be compared with the effect heterogeneity by population scale and city tier above and suggest that the development planning of subway construction should adapt to regional characteristics, balance the supply of subway network and the real demand of passengers as well.
We expected the coefficients could verify the emission-reducing effect of subway openings. However, there are the following reasons why the OLS estimates are biased and the test statistics are invalid. First, these independent variables are likely to be endogenously related with dependent variables. As a type of green transportation, governments have the motivation to construct new subway lines and increase subway mileages in face of high level of traffic congestion and air pollution. Individuals could optimize their behavior by choosing the types of transportation less exposed to ambient pollution as well, such as the subway. The substitution effect has become more noticeable after the open access to real-time air quality index, because individuals could see the publication of urban PM2.5 concentrations any place any time. In these cases, the coefficients in the OLS regressions would be biased. Second, omitting important explanatory variables also lead to the biased estimation. The economic and social conditions may vary over a relatively long time, the OLS method cannot cover the other observable and unobservable characteristics that might affect both air pollution and subway mileage. In addition, there appears to be more congestion and air pollution when subways are under construction, the OLS method based on the annual data cannot separate this impact of the construction process on PM2.5 concentrations from subway openings, thus causing the biased estimates. Most previous studies on the effect of subway construction or the development of the subway network chose regression discontinuity approach as the main empirical method, to address the problems of endogeneity and omitting important explanatory variables [58,66,75]. The RDD method based on high frequency data was under a narrow window, in which the other conditions remain approximately unchanged, that is, there is nearly impossible a sudden and large discontinuous change in economic or social activities on the date of subway opening.
Some previous studies [5,7,58,66,75] on green transport mostly chose only one city to investigate, while this study chose a sample of 29 Chinese cities due to the rapid development of subway network, which has been amazing and unique. Thereby, the results in our work were average effect of subway openings rather than the effect of one city. Different from other studies, we included PM2.5 concentration as a main outcome, which were not available before, and our results showed that new subway openings in Chinese cities reduce PM2.5 concentrations by an average of 18 μg/m3. As for the same pollutants (CO, NOx, O3) as other studies, our result showed that new subway openings reduced CO significantly, and little evidence to show that the ozone pollution was affected by subway openings, which was consistent with the previous studies [58,59]; while the emission-reducing effect on NOx was significant in our study, which was different from other studies. We also extended previous work by comparing the heterogeneity effects of subway openings in 29 cities, our findings show that subway openings in new first-tier cities have the most effective environmental performances and suggest that subway infrastructure is of importance to urban development, by improving traffic condition, and meeting citizens’ traveling demands. In addition, we considered the impact of central heating in northern China, which even exceeded the emission-reducing effect of new subway openings and suggest that the shift to clean energy plays a prominent role in PM2.5 reduction.
7. Conclusions and Policy Recommendations
Urban on-road transportation generates several negative externalities. Urban subway openings can reduce PM2.5 concentrations, because subways provide an attractive alternative to on-road driving, freeing up the road, and generating less pollution than road transportation. We find that new subway openings in Chinese cities from 2013 to 2017 reduce PM2.5 concentrations by an average of 18 μg/m3 and improve air quality significantly.
We provide further evidence to show that central heating in northern China impairs the effect of new subway openings. The polluting effect of firing coal exceeds the emission-reducing effect of subway openings. Therefore, a shift from mainly coal-based energy consumption to much cleaner alternatives such as coal-to-gas in those cities with central heating should be an effective way to improve air quality in winter.
We also consider the role of population scale and city tier. The results show that the emission-reducing effect of urban subway transit may exist as an inflection point regarding population scale, and that the effect depends on travel demand and supply to a large extent. Moreover, new subway openings in new first-tier cities have the most effective environmental performance, and green transportation infrastructure is of importance for urban sustainable development.
Some robustness tests are also conducted. Based on different bandwidths (10 days, 15 days, 25 days, and 30 days), the emission-reducing effect of new subway openings is statistically significant. We chose AQI and visibility to replace PM2.5, and the results show that new subway openings decrease AQI and increase visibility significantly. After dropping the potential fraud interval of the AQI data, the results are still robust.
As for the mechanism analysis, we prove these two hypotheses: (1) that subways provide an attractive alternative to on-road driving, freeing up the road, and (2) that subways generate less pollution than road transportation. Although, due to data availability, we are unable to test this mechanism directly, this study does provide empirical evidence for the effect of large-scale subway construction in Chinese cities on PM2.5 concentrations over the past few years. Our study also provides a useful reference for the next round of subway construction, and the development of green transportation in Chinese cities. Based on these valuable results above, we put forward the following policy implications.
- (1)
- Optimize planning of the urban subway construction and road network: With the acceleration of urbanization, subways will become the most important form of urban traffic infrastructure in Chinese cities, especially megacities. As we know, the subway is evidently superior to private automobiles and traditional buses, in terms of travel speed, passenger volume, and operation mode. It is also energy-saving, less polluting, and it has little influence on the ground (such as not encroaching on the ground space or obstructing the urban landscape). Therefore, subway construction is crucial for the planning of urban road networks and traffic in the next several years. According to our results, new subway openings significantly reduce PM2.5 concentrations and improve the air quality. It is beneficial to increase the subway scale and to take environmental factors as the priority in the planning of urban subway construction. In addition, subways should connect with other types of transportation properly, and integrate with urban traffic networks. As for the planning of road networks, the government should conduct overall planning of transportation resources, make full use of existing routes, and use urban land intensively. Planners must strengthen and implement the concept of environmental protection and low-carbon development.
- (2)
- Adjust measures to local conditions in urban subway construction: As our empirical results show, regional heterogeneity causes a variation in emission-reducing effects among sample cities. Consequently, the development planning of subway construction should adapt to regional characteristics. For first-tier cities, the existing subway lines cannot still meet the large travel demand, so that the solution to traffic congestion and air pollution from fumes should not only depend on subway construction. Those cities have large migrant populations, which challenge public service systems such as public transportation in the cities that they flow into. Not only should local governments of first-tier cities accelerate subway system expansions in phases, but they should also increase the frequency of subway provision during rush hour to satisfy citizens’ demands. Regulation measures, such as driving restrictions and congestion fees, are needed as well, to reduce the polluting fumes produced by cars. For new first-tier cities, which have rapid growth and are becoming the most promising cities in China, their present subway construction has the most effective emission-reducing performance and contributes to economic and social development. There is no doubt that these cities should continue to attach importance to subway construction and promote supporting facilities and technology. For second-tier cities, subway construction started relatively late, and resources are relatively limited compared to first-tier cities. They should focus on overall development, and planning of subway construction should take into full account their development stages, population scale, fiscal capacity, and basic requirements.
- (3)
- Foster awareness of green travel and regulate on-road transportation properly: The degree of alternatives for on-road transportation, particularly private automobiles, determines the emission-reducing effect of subway openings. This calls for people’s awareness of green travel. Only by the joint efforts of the whole society can the concept of green and sustainable development be the common perspective of the people. The Chinese government should strengthen green transportation construction, use cleaner power, advocate green travel including subways, bicycles, or walking, and decrease the ticket prices of subways, thereby enhancing the proportion of green and low-carbon transportation modes in central urban areas. As for on-road transportation, the government should adopt some regulatory measures such as raising the taxes on gasoline, vehicle restrictions to alleviate traffic pressure in rush hours, and increase the supply of public transportation. Activities such as propaganda month on green travel and public service advertisements should be carried out by local governments to make green travel become everyone’s responsibility and a new trend in society. Although the emission-reducing effect of subway openings has been proven in the short term, citizen awareness of green travel will indeed change travel modes and reduce the usages of private cars, which will lead to improvements in air quality and urban green developments in the long term.
- (4)
- Increase the use of clean energy and promote the innovation of emission-reducing technologies: As shown in the empirical analysis, the polluting effects of central heating caused by coal-based energy might exceed the emission-reducing effects of new subway openings, so that subway openings fail to reduce PM2.5 concentrations in winter. This shift of energy plays a fundamental role in improving the air quality. Fortunately, the Chinese government has taken actions such as a coal-to-gas switch, to reduce pollution by central heating. Moreover, traditional on-road transportation modes also involve a shift of power. Generally, PM2.5 emissions from fumes are partly caused by incomplete combustion of dirty fuels. Therefore, the government should focus on the innovation of green technologies and the development of green cars and green buses, which are a key solution to reducing emissions and saving energy.
Author Contributions
H.L. organized this study, provided core advice on the idea and comments on initial drafts. Y.Z. contributed to the idea of the paper, led data collection, performed the raw data analysis, and wrote the first draft. Y.Q. and J.Y. contributed to the econometric models, gave advice on the codes and critical analysis of the data, and revised the drafts. All read and approved the final manuscript.
Funding
This study was financially supported by the National Social Science Fund of China (grant number 15ZDB158), the National Natural Science Foundation of China (grant number 71573194), the National Social Science Fund of China (grant number 15FJY014), and HongKong Scholar Program (grant number XJ2016005).
Acknowledgments
The authors extend their deep gratitude to editors and anonymous reviewers for their valuable and constructive comments and suggestions on the manuscript. Besides, the authors would like to express their deep gratitude to Fei Li, Yinmei Wang and Yukun Sun at Zhongnan University of Economics and Law, Tylor Claggett at Salisbury University and professors at the Department of Public Finance and Taxation of Wuhan University for very helpful and constructive suggestions.
Conflicts of Interest
The authors declare no conflict of interest.
Appendix A
According to new ambient air quality standards (GB 3095-2012), technical regulation for ambient air quality assessment (HJ 663-2013), the AQI ranges from 0 to 500 and depends on the concentrations of six pollutants measured at monitoring stations within a city: sulfur dioxide (SO2), nitrogen dioxide (NO2), carbon monoxide (CO), ozone (O3), coarse particles with a diameter between 2.5 and 10 μm (PM10), fine particles with a diameter of 2.5 μm or less (PM2.5). As the concentration limits of six pollutants are different, the first step is to calculate IAQI (Individual Air Quality Index) based on the targeted concentration limits of each pollutants:
where IAQIk is the IAQI of pollutant K, Ck is the actual concentration of K. BPHi (the concentration limit that is equal or greater than Ck), BPLo (the concentration limit that is less than Ck), IAQIHi (the IAQI that maps BPHi) and IAQILo (the IAQI that maps BPLo) are from the table of individual air quality index and corresponding pollutant’s concentration limits issued by environmental monitoring central station, which indicate classification of concentration limits. Then the AQI is the maximum value of IAQIk:
when AQI is more than 50, the corresponding pollutant is the primary pollutant.

Table A1.
The overview of urban subway constructions in China by December 2017.
| City | Subway Mileages (km) | City | Subway Mileages (km) |
|---|---|---|---|
| Beijing | 588.5 | Tianjin | 115.2 |
| Shanghai | 637.3 | Guangzhou | 353.2 |
| Wuhan | 196.5 | Shenzhen | 285.9 |
| Nanjing | 176.8 | Chengdu | 175.1 |
| Shenyang | 54 | Chongqing | 165.6 |
| Xi’an | 89 | Suzhou | 120.7 |
| Kunming | 88.7 | Hangzhou | 103.7 |
| Ha’erbin | 22.7 | Qingdao | 44.8 |
| Zhengzhou | 93.6 | Changsha | 48.8 |
| Ningbo | 74.5 | Wuxi | 55.7 |
| Dalian | 54.1 | Changchun | 18.1 |
| Nanchang | 48.5 | Fuzhou | 24.6 |
| Dongguan | 37.8 | Nanning | 53.1 |
| Hefei | 52.3 | Shijiazhuang | 28.4 |
| Guiyang | 12.8 | Xiamen | 30.3 |
| Foshan | 33.5 |
Table A2.
The effects of new subway openings on other air pollutants.
| Variable | 1 | 2 | 3 |
|---|---|---|---|
| Panel A: PM10 | |||
| subwayopen | −18.723 *** | −27.027 *** | −21.517 ** |
| (−3.64) | (−3.66) | (−2.14) | |
| R2 | 0.546 | 0.547 | 0.548 |
| Panel B: NO2 | |||
| subwayopen | −2.315 | −5.595 ** | −3.140 |
| (−1.38) | (−2.32) | (−0.96) | |
| R2 | 0.612 | 0.613 | 0.615 |
| Panel C: O3 | |||
| subwayopen | −1.667 | −3.393 | −2.572 |
| (−0.53) | (−0.75) | (−0.42) | |
| R2 | 0.700 | 0.701 | 0.703 |
| Panel D: SO2 | |||
| subwayopen | −2.106 * | −3.747 ** | −2.285 |
| (−1.78) | (−2.20) | (−0.99) | |
| R2 | 0.7850 | 0.7853 | 0.7856 |
Figure A1.
Time trends of the AQI before and after the new subway openings ((a) allows for linear time trend of the AQI before and after the new subway openings, and (b) allows for quadratic time trend of the AQI before and after the new subway openings; the blue scatter plot and fitted line demonstrate the daily mean of AQI before the new subway openings, and the red scatter plot and fitted line demonstrate the daily mean of AQI after the new subway openings).
References
- Huang, J.; Li, F.; Zeng, G.; Huang, X.; Liu, W.; Wu, H.; Li, X. Integrating hierarchical bioavailability and population distribution into potential eco-risk assessment of heavy metals in road dust: A case study in Xiandao District, Changsha city, China. Sci. Total Environ. 2016, 541, 969–976. [Google Scholar] [CrossRef] [PubMed]
- Parry, W.H.I.; Walls, M.; Harrington, W. Automobile Externalities and Policies. J. Econ. Lit. 2007, 45, 373–399. [Google Scholar] [CrossRef]
- Anas, A.; Lindsey, R. Reducing urban road transportation externalities: Road pricing in theory and in practice. Rev. Env. Econ. Policy 2011, 5, 66–88. [Google Scholar] [CrossRef]
- Romem, I.; Shurtz, I. The accident externality of driving: Evidence from observance of the Jewish Sabbath in Israel. J. Urban Econ. 2016, 96, 36–54. [Google Scholar] [CrossRef]
- Davis, L. The effect of driving restrictions on air quality in Mexico city. J. Polit. Econ. 2008, 116, 38–81. [Google Scholar] [CrossRef]
- Currie, J.; Walker, R. Traffic congestion and infant health: Evidence from E-ZPass. Am. Econ. J.-Appl. Econ. 2011, 3, 65–90. [Google Scholar] [CrossRef]
- Viard, V.B.; Fu, S. The effect of Beijing’s driving restrictions on pollution and economic activity. J. Public Econ. 2015, 125, 98–115. [Google Scholar] [CrossRef]
- Ministry of Environmental Protection of the People’s Republic of China. Chinese Vehicle Environmental Management Annual Report. 2016. Available online: http://www.mep.gov.cn/gkml/hbb/qt/201606/t20160602353152.htm (accessed on 15 November 2017).
- Yang, J.; Zhang, B. Air pollution and healthcare expenditure: Implication for the benefit of air pollution control in China. Environ. Int. 2018, 120, 443–455. [Google Scholar] [CrossRef] [PubMed]
- Samet, J.M. Traffic, air pollution, and health. Inhal. Toxicol. 2007, 19, 1021–1027. [Google Scholar] [CrossRef] [PubMed]
- Hystad, P.; Villeneuve, P.J.; Goldberg, M.S.; Crouse, D.L.; Johnson, K.; Canadian Cancer Registries Epidemiology Research Group. Exposure to traffic-related air pollution and the risk of developing breast cancer among women in eight Canadian provinces: A case-control study. Environ. Int. 2015, 74, 240–248. [Google Scholar] [CrossRef] [PubMed]
- Li, F.; Xiao, M.; Zhang, J.; Yang, J.; Zhu, L. Health risk assessment on tunnel workers’ exposure to PM10 based on triangular fuzzy numbers. AIP Conf. Proc. 2017, 1820, 040011. [Google Scholar] [CrossRef]
- Chen, X.; Li, F.; Liu, C.; Yang, J.; Zhang, J.; Peng, C. Monitoring, Human Health Risk Assessment and Optimized Management for Typical Pollutants in Indoor Air from Random Families of University Staff, Wuhan City, China. Sustainability 2017, 9, 1115. [Google Scholar] [CrossRef]
- Zhang, J.; Zhu, L.; Li, F.; Liu, C.; Qiu, Z.; Xiao, M.; Cai, Y. Comparison of Toxic Metal Distribution Characteristics and Health Risk between Cultured and Wild Fish Captured from Honghu City, China. Int. J. Environ. Res. Public Health 2018, 15, 334. [Google Scholar] [CrossRef] [PubMed]
- Cai, Y.; Li, F.; Zhang, J.; Wu, Z. Occupational Health Risk Assessment in the Electronics Industry in China Based on the Occupational Classification Method and EPA Model. Int. J. Environ. Res. Public Health 2018, 15, 2061. [Google Scholar] [CrossRef] [PubMed]
- Yang, G.; Wang, Y.; Zeng, Y.; Gao, G.F.; Liang, X.; Zhou, M.; Wan, X.; Yu, S.; Jiang, Y.; Naghavi, M.; et al. Rapid health transition in China, 1990–2010: Findings from the Global Burden of Disease Study 2010. Lancet 2013, 381, 1987–2015. [Google Scholar] [CrossRef]
- Beesley, M. The value of time spent in travelling: Some new evidence. Economica 1965, 32, 174–185. [Google Scholar] [CrossRef]
- Cristóbal, T.; Padrón, G.; Lorenzo-Navarro, J.; Quesada-Arencibia, A.; García, C.R. Applying Time-Dependent Attributes to Represent Demand in Road Mass Transit Systems. Entropy 2018, 20, 133. [Google Scholar] [CrossRef]
- Cheng, G.; Zhao, S.; Huang, D. Understanding the Effects of Improving Transportation on Pilgrim Travel Behavior: Evidence from the Lhasa, Tibet, China. Sustainability 2018, 10, 3528. [Google Scholar] [CrossRef]
- Wu, J.; Zhang, P.; Yi, H.; Qin, Z. What Causes Haze Pollution? An Empirical Study of PM2.5 Concentrationsin Chinese Cities. Sustainability 2016, 8, 132. [Google Scholar] [CrossRef]
- Evans, J.E., IV. Transit Scheduling and Frequency—Traveler Response to Transportation System Changes, Transit Cooperative Research Program (TCRP) Report 95, Chapter 9. Available online: https://www.worldtransitresearch.info/research/3051/ (accessed on 21 August 2018).
- Moriarty, P.; Honnery, D. Greening passenger transport: A review. J. Clean. Prod. 2013, 54, 14–22. [Google Scholar] [CrossRef]
- Li, Y.; Bao, L.; Li, W.; Deng, H. Inventory and Policy Reduction Potential of Greenhouse Gas and Pollutant Emissions of Road Transportation Industry in China. Sustainability 2016, 8, 1218. [Google Scholar] [CrossRef]
- Muslim, N.H.; Keyvanfar, A.; Shafaghat, A.; Abdullahi, M.M.; Khorami, M. Green Driver: Travel Behaviors Revisited on Fuel Saving and Less Emission. Sustainability 2018, 10, 325. [Google Scholar] [CrossRef]
- Li, W.; Li, Y.; Deng, H.; Bao, L. Planning of Electric Public Transport System under Battery Swap Mode. Sustainability 2018, 10, 2528. [Google Scholar] [CrossRef]
- Liu, L.; Kong, F.; Liu, X.; Peng, Y.; Wang, Q. A review on electric vehicles interacting with renewable energy in smart grid. Renew. Sustain. Energy Rev. 2015, 51, 648–661. [Google Scholar] [CrossRef]
- 2017 Statistical Report by Urban Metro Transportation Association of China. Available online: http://www.camet.org.cn/index.php?m=content&c=index&a=show&catid=18&id=13532 (accessed on 19 April 2018). (In Chinese).
- The 12th China International Railway Construction Fair. 2017. Available online: http://www.cnsubway.com/index.php?m=newscon&id=410&aid=42504 (accessed on 18 June 2018). (In Chinese).
- 10 Chinese Cities Had the Subway Mileage of More Than 100 Kilometers, and Shanghai is the Largest in Total in the World. Available online: http://finance.ifeng.com/a/20170817/15584627_0.shtml (accessed on 7 April 2018). (In Chinese).
- Staš, D.; Lenort, R.; Wicher, P.; Holman, D. Green Transport Balanced Scorecard Model with Analytic Network Process Support. Sustainability 2015, 7, 15243–15261. [Google Scholar] [CrossRef] [Green Version]
- McManners, P.J. Developing policy integrating sustainability: A case study into aviation. Environ. Sci. Policy 2016, 57, 86–92. [Google Scholar] [CrossRef]
- Oltean-Dumbrava, C.; Watts, G.; Miah, A. Towards a more sustainable surface transport infrastructure: A case study of applying multi criteria analysis techniques to assess the sustainability of transport noise reducing devices. J. Clean. Prod. 2016, 112, 2922–2934. [Google Scholar] [CrossRef]
- Logo, M.; Yaïci, W.; Zaninelli, D. “Team Play” between Renewable Energy Sources and Vehicle Fleet to Decrease Air Pollution. Sustainability 2016, 8, 27. [Google Scholar] [CrossRef] [Green Version]
- Wang, C.-N.; Ho, H.-X.T.; Luo, S.-H.; Lin, T.-F. An Integrated Approach to Evaluating and Selecting Green Logistics Providers for Sustainable Development. Sustainability 2017, 9, 218. [Google Scholar] [CrossRef]
- Wątróbski, J.; Ziemba, P.; Jankowski, J.; Zioło, M. Green Energy for a Green City—A Multi-Perspective Model Approach. Sustainability 2016, 8, 702. [Google Scholar] [CrossRef]
- Klumpp, M. To Green or Not to Green: A Political, Economic and Social Analysis for the Past Failure of Green Logistics. Sustainability 2016, 8, 441. [Google Scholar] [CrossRef]
- Klumpp, M. Do Forwarders Improve Sustainability Efficiency? Evidence from a European DEA Malmquist Index Calculation. Sustainability 2017, 9, 842. [Google Scholar] [CrossRef]
- Klupp, M. How to Achieve Supply Chain Sustainability Efficiently? Taming the Triple Bottom Line Split Business Cycle. Sustainability 2018, 10, 397. [Google Scholar] [CrossRef]
- Guzman, L.A.; Oviedo, D.; Cardona, R. Accessibility Changes: Analysis of the Integrated Public Transport System of Bogotá. Sustainability 2018, 10, 3958. [Google Scholar] [CrossRef]
- D’Acierno, L.; Botte, M. A Passenger-Oriented Optimization Model for Implementing Energy-Saving Strategies in Railway Contexts. Energies 2018, 11, 2946. [Google Scholar] [CrossRef]
- Wang, X.; Yao, E.; Liu, S. Travel Choice Analysis under Metro Emergency Context: Utility? Regret? Or Both? Sustainability 2018, 10, 3852. [Google Scholar] [CrossRef]
- Cropper, M.L.; Jiang, Y.; Alberini, A.; Baur, P. Getting Cars Off the Road: The Cost-Effectiveness of an Episodic Pollution Control Program. Environ. Resour. Econ. 2014, 57, 117–143. [Google Scholar] [CrossRef]
- Mitchell, G.; Namdeo, A.; Milne, D. Forecasting environmental equity: Air quality responses to road user charging in Leeds, UK. Atmos. Environ. 2005, 39, 6231–6241. [Google Scholar] [CrossRef]
- Attrd, M.; Ison, S.G. The implementation of road user charging and the lessons learnt: The case of Valletta, Malta. J. Transp. Geogr. 2010, 18, 14–22. [Google Scholar] [CrossRef]
- Johansson-Stenman, O. Optimal environmental road pricing. Econ. Lett. 2006, 90, 225–229. [Google Scholar] [CrossRef] [Green Version]
- Wang, F.; Peng, Y.; Jiang, C. Influence of Road Patterns on PM2.5 Concentrations and the Available Solutions: The Case of Beijing City, China. Sustainability 2017, 9, 217. [Google Scholar] [CrossRef]
- Wang, Y.; Yang, D. Impacts of Freight Transport on PM2.5 Concentrations in China: A Spatial Dynamic Panel Analysis. Sustainability 2018, 10, 2865. [Google Scholar] [CrossRef]
- Anderson, M. Subways, strikes, and slowdown: The impacts of public transit on traffic congestion. Am. Econ. Rev. 2014, 104, 2763–2796. [Google Scholar] [CrossRef]
- Lopes Toledo, A.L.; Lèbre La Rovere, E. Urban Mobility and Greenhouse Gas Emissions: Status, Public Policies, and Scenarios in a Developing Economy City, Natal, Brazil. Sustainability 2018, 10, 3995. [Google Scholar] [CrossRef]
- Johannes, E.; Ekman, P.; Huge-Brodin, M.; Karlsson, M. Sustainable Timber Transport—Economic Aspects of Aerodynamic Reconfiguration. Sustainability 2018, 10, 1965. [Google Scholar] [CrossRef]
- Vickrey, W.S. Congestion Theory and Transport Investment. Am. Econ. Rev. 1969, 59, 251–260. Available online: https://www.jstor.org/stable/1823678 (accessed on 24 March 2018).
- Mohring, H. Optimization and scale economies in urban bus transportation. Am. Econ. Rev. 1972, 62, 591–604. Available online: http://www.jstor.org/stable/1806101 (accessed on 24 March 2018).
- Beaudoin, J.; Farzin, Y.H.; Lin Lawell, C.C. Public transit investment and sustainable transportation: A review of studies of transit’s impact on traffic congestion and air quality. Res. Transp. Econ. 2015, 52, 15–22. [Google Scholar] [CrossRef]
- Adler, M.; Ommeren, J. Does public transit reduce car travel externalities? quasi-natural experiments’ evidence from transit strikes. J. Urban Econ. 2016, 92, 106–119. [Google Scholar] [CrossRef]
- Qiu, L.-Y.; He, L.-Y. Policies Effective? A New Perspective from Direct Pollution Rebound Effect, and Empirical Evidence Are Chinese Green Transport from the Road Transport Sector. Sustainability 2017, 9, 429. [Google Scholar] [CrossRef]
- Qiu, L.-Y.; He, L.-Y. Can Green Traffic Policies Affect Air Quality? Evidence from A Difference-in-Difference Estimation in China. Sustainability 2017, 9, 1067. [Google Scholar] [CrossRef]
- Yang, M.; Ma, T.; Sun, C. Evaluating the impact of urban traffic investment on SO2 emissions in China cities. Energy Policy 2018, 113, 20–27. [Google Scholar] [CrossRef]
- Chen, Y.; Whalley, A. Green infrastructure: The effects of urban rail transit on air quality. Am. Econ. J.-Econ. Policy 2012, 4, 58–97. [Google Scholar] [CrossRef]
- Lalive, R.; Luechinger, S.; Schmutzler, A. Does expanding regional train service reduce air pollution? J. Environ. Econ. Manag. 2017, in press. [Google Scholar] [CrossRef]
- Westervelt, D.; Horowitz, L.; Naik, V.; Tai, A.; Fiore, A.; Mauzerall, D. Quantifying PM2.5-meteorology sensitivities in a global climate model. Atmos. Environ. 2016, 142, 43–56. [Google Scholar] [CrossRef]
- Tai, A.; Mickley, L.; Jacob, D. Correlations between fine particulate matter (PM2.5) and meteorological variables in the United States: Implications for the sensitivity of PM2.5 to climate change. Atmos. Environ. 2010, 44, 3976–3984. [Google Scholar] [CrossRef]
- Mainka, A.; Zajusz-Zubek, E.; Kaczmarek, K. PM2.5 in Urban and Rural Nursery Schools in Upper Silesia, Poland: Trace Elements Analysis. Int. J. Environ. Res. Public Health 2015, 12, 7990–8008. [Google Scholar] [CrossRef] [PubMed]
- Introduction to Visibility. Available online: https://www.epa.gov/visibility/introduction-visibility (accessed on 11 July 2018).
- Liang, C.; Duan, F.; He, K.; Ma, Y. Review on recent progress in observations, source identifications and countermeasures of PM2.5. Environ. Int. 2016, 82, 150–170. [Google Scholar] [CrossRef] [PubMed]
- Lee, D.; Lemieux, T. Regression discontinuity designs in economics. J. Econ. Lit. 2010, 48, 281–355. [Google Scholar] [CrossRef]
- Yang, J.; Chen, S.; Qin, P.; Lu, F.; Liu, A.A. The effect of subway expansions on vehicle congestion: Evidence from Beijing. J. Environ. Econ. Manag. 2018, 88, 114–133. [Google Scholar] [CrossRef]
- Fu, S.; Gu, Y. Highway toll and air pollution: Evidence from Chinese cities. J. Environ. Econ. Manag. 2017, 83, 32–49. [Google Scholar] [CrossRef]
- Gelman, A.; Imbens, G. Why High-Order Polynomials Should Not Be Used in Regression Discontinuity Designs. NBER Working Paper 2014, No. 20405. Available online: http://www.nber.org/papers/w20405.pdf (accessed on 7 April 2018).
- Li, Z.; Xu, N.; Yuan, J. New evidence on trade-environment linkage via air visibility. Econ. Lett. 2015, 128, 72–74. [Google Scholar] [CrossRef]
- Chen, J.; Qiu, S.; Shang, J.; Wilfrid, O.; Liu, X.; Tian, H.; Boman, J. Impact of relative humidity and water soluble constituents of PM2.5 on visibility impairment in Beijing, China. Aerosol Air Qual. Res. 2014, 14, 260–268. [Google Scholar] [CrossRef]
- Andrews, S. Inconsistencies in air quality metrics: ‘Blue Sky’ days and PM10 concentration in Beijing. Environ. Res. Lett. 2008, 3, 1–14. [Google Scholar] [CrossRef]
- Ghanem, D.; Zhang, J. ‘Effortless Perfection:’ Do Chinese cities manipulate air pollution data? J. Environ. Econ. Manag. 2014, 68, 203–225. [Google Scholar] [CrossRef]
- Motor Vehicle Pollution is an Important Source of Air Pollution. Available online: http://www.sohu.com/a/145892207_351301 (accessed on 1 April 2018). (In Chinese).
- Visual Report on Chinese Car Ownership Data in 2017. Available online: http://auto.sina.com.cn/zz/2017-04-27/detail-ifyetxec6692261.shtml (accessed on 30 March 2018). (In Chinese).
- Gallego, F.; Montero, J.P.; Salas, C. The effect of transport policies on car use: Evidence from Latin American cities. J. Public Econ. 2013, 107, 47–62. [Google Scholar] [CrossRef]
Figure 1.
Time trends of PM2.5 concentrations before and after the new subway openings ((a) allows for linear time trend of PM2.5 concentrations before and after the new subway openings, and (b) allows for quadratic time trend of PM2.5 concentrations before and after the new subway openings; the blue scatter plot and fitted line demonstrate the daily mean of PM2.5 concentrations before the new subway openings, and the red scatter plot and fitted line demonstrate the daily mean of PM2.5 concentrations after the new subway openings).
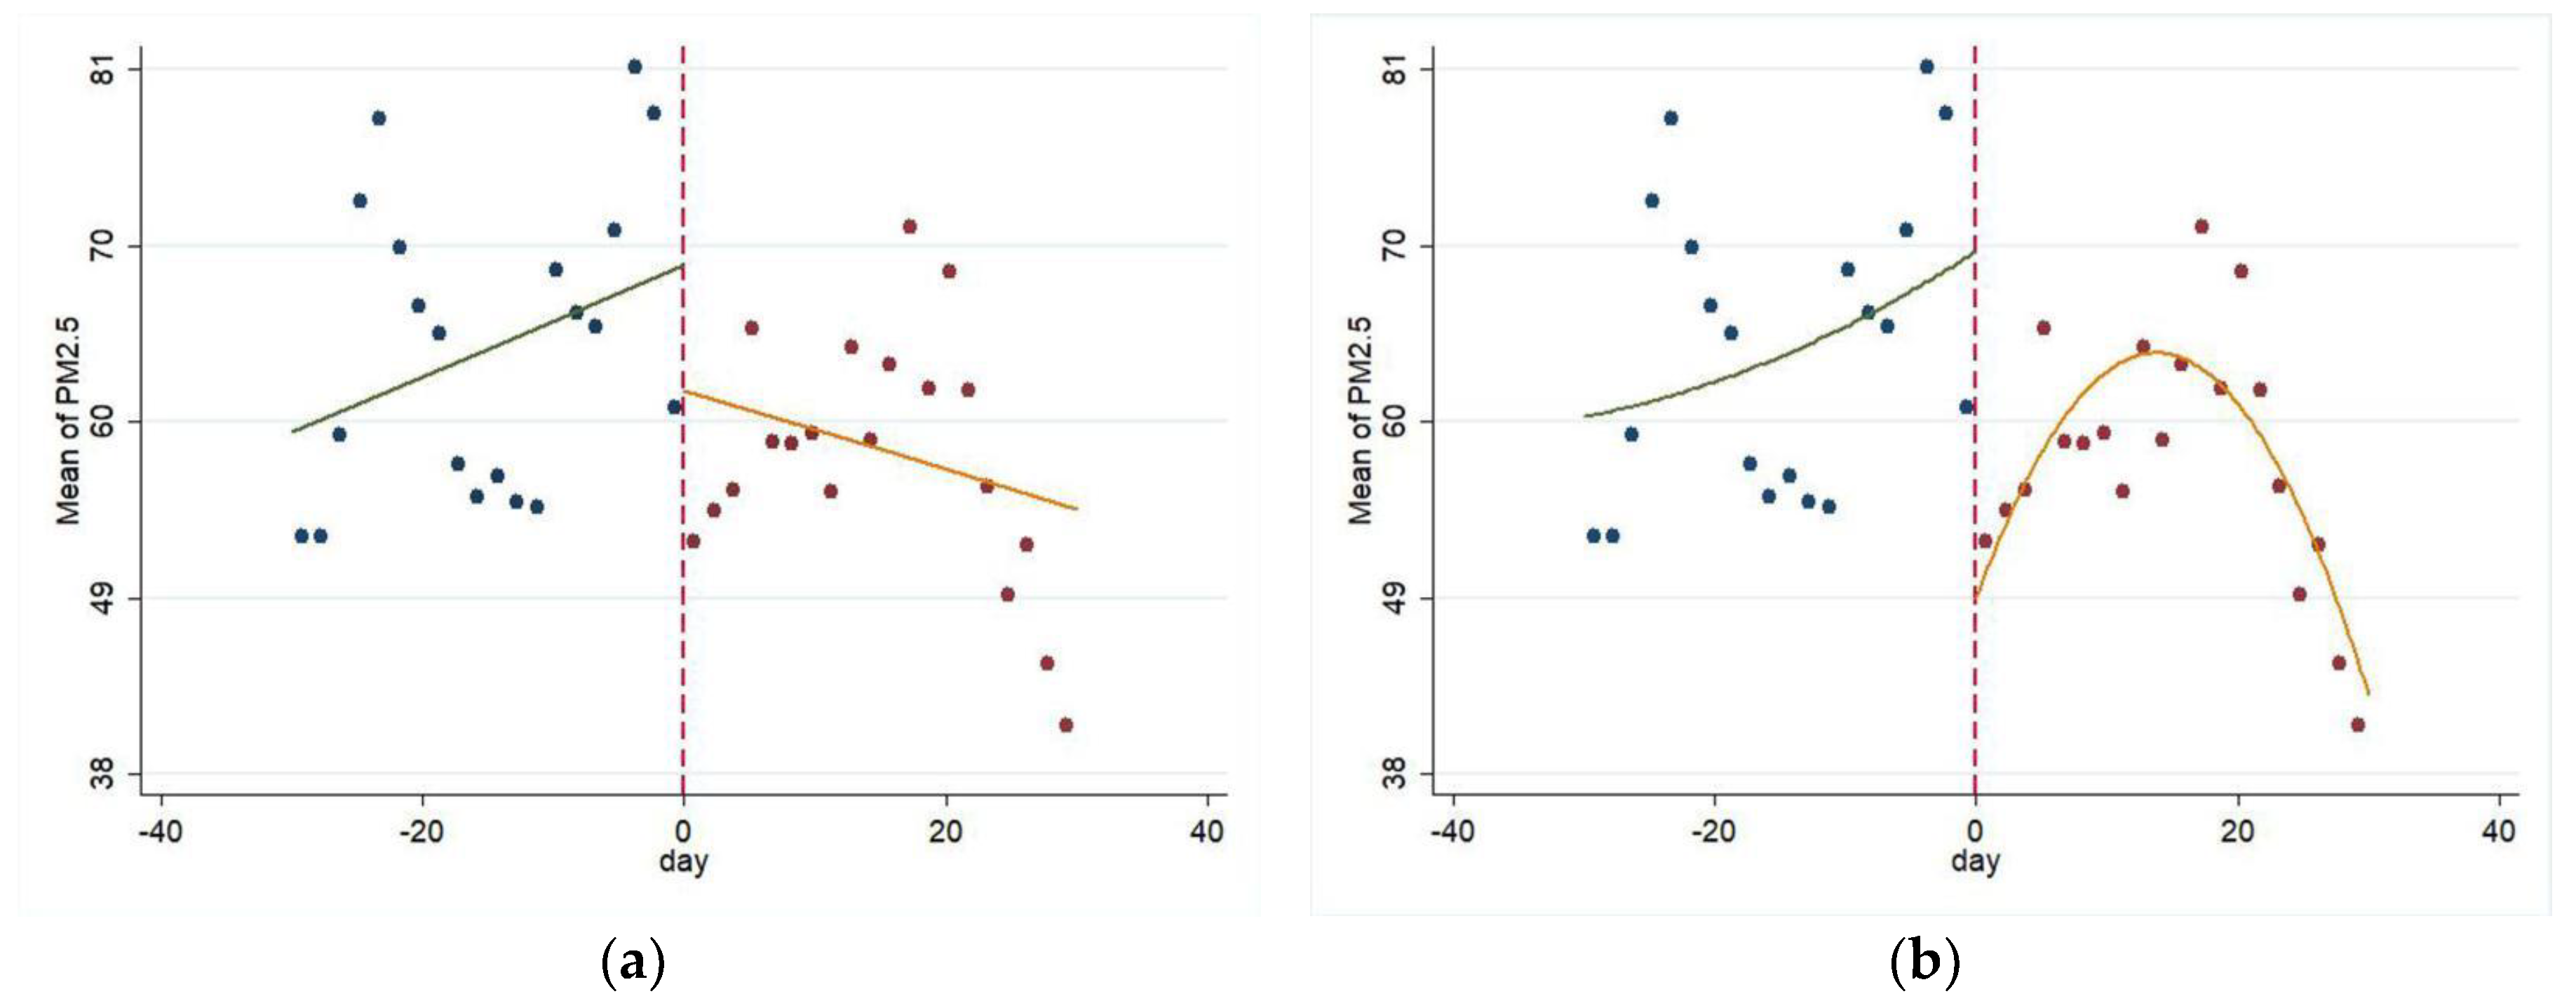
Table 1.
Summary Statistics.
| Variable | Full Sample | Before Openings | After Openings | t-Test |
|---|---|---|---|---|
| PM2.5 (μg/m3) | 61.0350 (55.7874) | 64.4662 | 57.7203 | 6.7459 *** |
| AQI | 96.5732 (61.9621) | 100.3811 | 92.8945 | 7.4866 *** |
| PM10 (μg/m3) | 93.7991 (67.9898) | 98.4977 | 89.2601 | 9.2376 *** |
| SO2 (μg/m3) | 21.9877 (22.1942) | 22.8890 | 21.1171 | 1.7719 * |
| CO (mg/m3) | 1.1402 (0.6430) | 1.1520 | 1.1288 | 0.0232 |
| NO2 (μg/m3) | 46.5791 (23.5737) | 47.8335 | 45.3673 | 2.4662 ** |
| O3 (μg/m3) | 83.9264 (50.3359) | 85.6420 | 82.2690 | 3.3730 |
| Rain dummy | 0.3423 (0.4746) | 8.8513 | 8.7616 | 0.0897 |
| Wind scale | 2.7449 (1.0191) | 0.3312 | 0.3530 | −0.0218 |
| Highest temperature (°C) | 19.7418 (11.2472) | 20.0204 | 19.4727 | 0.5476 |
| Lowest temperature (°C) | 11.7236 (11.6352) | 11.8945 | 11.5585 | 0.3360 |
| Heating dummy | 0.1718 (0.3773) | |||
| Weekend dummy | 0.3027 (0.4595) | |||
| Holiday dummy | 0.0532 (0.2244) |
Note: Standard deviations are in the parentheses. The t-test statistics in the fourth column test whether the means of variables before and after subway openings are equal. Superscripts ***, **, * indicate significance at the 1%, 5%, and 10% levels, respectively.
Table 2.
Effects of new subway openings on PM2.5 concentrations.
| Variable | 1 | 2 | 3 |
|---|---|---|---|
| Panel A: constant time trend | |||
| subwayopen | −18.175 *** | −18.185 *** | −21.940 *** |
| (−4.59) | (−4.58) | (−4.33) | |
| rain | −2.256 | −2.256 | −2.161 |
| (−0.91) | (−0.91) | (−0.87) | |
| wind | −7.670 *** | −7.671 *** | −7.712 *** |
| (−4.83) | (−4.83) | (−4.86) | |
| temph | 2.103 *** | 2.103 *** | 2.098 *** |
| (4.50) | (4.50) | (4.49) | |
| templ | 0.583 | 0.582 | 0.569 |
| (1.03) | (1.02) | (1.00) | |
| weekend | −1.439 | −1.438 | −1.469 |
| (−0.67) | (−0.67) | (−0.68) | |
| holiday | 6.381 | 6.370 | 6.604 |
| (1.33) | (1.32) | (1.37) | |
| R2 | 0.577 | 0.577 | 0.577 |
| Panel B: varying time trend | |||
| subwayopen | −18.341 *** | −23.247 *** | −12.880 * |
| (−4.60) | (−4.05) | (−1.65) | |
| rain | −2.256 | −2.121 | −2.024 |
| (−0.91) | (−0.85) | (−0.81) | |
| wind | −7.682 *** | −7.680 *** | −7.626 *** |
| (−4.84) | (−4.84) | (−4.79) | |
| temph | 2.104 *** | 2.100 *** | 2.053 *** |
| (4.50) | (4.49) | (4.39) | |
| templ | 0.572 | 0.535 | 0.591 |
| (1.00) | (0.94) | (1.04) | |
| weekend | 2.104 *** | 2.100 *** | 2.053 *** |
| (4.50) | (4.49) | (4.39) | |
| holiday | 0.572 | 0.535 | 0.591 |
| (1.00) | (0.94) | (1.04) | |
| R2 | 0.577 | 0.577 | 0.579 |
Note: Dependent variable is PM2.5. All models also include month dummies, season dummies, year dummies, and city-fixed effects. Column 1 includes linear trends before and after new subway openings; Column 2 includes the quadratic time trends; Column 3 includes the third order time trends. t statistics are in parentheses. Superscripts ***, **, * indicate significances at the 1%, 5%, 10% levels, respectively, which are the same in the following tables.
Table 3.
Effect heterogeneity by central heating.
| Variable | 1 | 2 | 3 |
|---|---|---|---|
| Panel A: central heating in winter | |||
| subwayopen | −14.011 * | −33.630 *** | −12.577 |
| (−1.67) | (−2.90) | (−0.80) | |
| rain | −5.352 | −4.187 | −4.403 |
| (−0.96) | (−0.76) | (−0.80) | |
| wind | −10.317 *** | −10.058 *** | −10.446 *** |
| (−3.47) | (−3.42) | (−3.56) | |
| temph | 2.133 ** | 2.085 ** | 1.800 * |
| (2.23) | (2.20) | (1.89) | |
| templ | 2.289 ** | 2.484 ** | 2.009 * |
| (1.97) | (2.16) | (1.78) | |
| weekend | −0.855 | −0.739 | −0.673 |
| (−0.20) | (−0.17) | (−0.16) | |
| holiday | −5.328 | −7.409 | −6.854 |
| (−0.54) | (−0.75) | (−0.68) | |
| R2 | 0.549 | 0.561 | 0.558 |
| Panel B: non-heating in winter | |||
| subwayopen | −19.962 *** | −18.975 *** | −17.817 * |
| (−4.56) | (−2.98) | (−1.96) | |
| rain | −1.249 | −1.269 | −3.029 |
| (−0.47) | (−0.48) | (−1.09) | |
| wind | −4.917 *** | −4.909 *** | −4.665 ** |
| (−2.67) | (−2.66) | (−2.38) | |
| temph | 2.294 *** | 2.283 *** | 2.100 *** |
| (4.38) | (4.35) | (3.81) | |
| templ | −0.285 | −0.212 | −2.010 *** |
| (−0.45) | (−0.33) | (−3.12) | |
| weekend | −2.408 | −2.477 | −2.538 |
| (−1.01) | (−1.04) | (−1.00) | |
| holiday | 13.739 ** | 14.203 *** | 15.348 *** |
| (2.55) | (2.63) | (2.75) | |
| R2 | 0.579 | 0.579 | 0.525 |
| Chow test | 19.22 *** | 15.68 *** | 14.28 *** |
Table 4.
Effect heterogeneity by population scale.
| Variable | 1 | 2 | 3 |
|---|---|---|---|
| Panel A: population > 10,000,000 | |||
| subwayopen | −14.011 * | −33.630 *** | −16.422 |
| (−1.67) | (−2.90) | (−1.04) | |
| rain | −5.352 | −4.187 | −4.363 |
| (−0.96) | (−0.76) | (−0.79) | |
| wind | −10.317 *** | −10.058 *** | −9.876 *** |
| (−3.47) | (−3.42) | (−3.36) | |
| temph | 2.133 ** | 2.085 ** | 1.968 ** |
| (2.23) | (2.20) | (2.07) | |
| templ | 2.289 ** | 2.484 ** | 2.616 ** |
| (1.97) | (2.16) | (2.27) | |
| weekend | −0.855 | −0.739 | −0.826 |
| (−0.20) | (−0.17) | (−0.19) | |
| holiday | −5.328 | −7.409 | −6.902 |
| (−0.54) | (−0.75) | (−0.69) | |
| R2 | 0.549 | 0.561 | 0.563 |
| Panel B: population < 10,000,000 | |||
| subwayopen | −19.962 *** | −18.975 *** | −17.817 * |
| (−4.56) | (−2.98) | (−1.96) | |
| rain | −1.249 | −1.269 | −3.029 |
| (−0.47) | (−0.48) | (−1.09) | |
| wind | −4.917 *** | −4.909 *** | −4.665 ** |
| (−2.67) | (−2.66) | (−2.38) | |
| temph | 2.294 *** | 2.283 *** | 2.100 *** |
| (4.38) | (4.35) | (3.81) | |
| templ | −0.285 | −0.212 | −2.010 *** |
| (−0.45) | (−0.33) | (−3.12) | |
| weekend | −2.408 | −2.477 | −2.538 |
| (−1.01) | (−1.04) | (−1.00) | |
| holiday | 13.739 ** | 14.203 *** | 15.348 *** |
| (2.55) | (2.63) | (2.75) | |
| R2 | 0.579 | 0.579 | 0.575 |
| Chow test | 7.51 *** | 6.47 *** | 5.50 *** |
Table 5.
Effect heterogeneity by city tier.
| Variable | 1 | 2 | 3 |
|---|---|---|---|
| Panel A: first-tier cities | |||
| subwayopen | 1.589 | −26.386 | −23.546 |
| (0.11) | (−1.51) | (−0.99) | |
| rain | −22.609 ** | −22.046 ** | −24.108 ** |
| (−2.25) | (−2.28) | (−2.49) | |
| wind | −8.215 * | −7.579 * | −7.223 * |
| (−1.87) | (−1.79) | (−1.71) | |
| temph | 0.367 | 0.396 | 0.608 |
| (0.22) | (0.25) | (0.38) | |
| templ | 5.649 ** | 6.267 *** | 6.538 *** |
| (2.60) | (2.97) | (3.11) | |
| weekend | −3.816 | −3.204 | −4.151 |
| (−0.55) | (−0.48) | (−0.63) | |
| holiday | 16.915 | 7.351 | 7.756 |
| (1.17) | (0.51) | (0.54) | |
| R2 | 0.447 | 0.492 | 0.505 |
| Panel B: new first-tier cities | |||
| subwayopen | −29.734 *** | −29.965 *** | −18.871 |
| (−4.90) | (−3.37) | (−1.54) | |
| rain | −0.826 | −0.925 | −0.890 |
| (−0.21) | (−0.24) | (−0.23) | |
| wind | −2.063 | −2.052 | −2.114 |
| (−0.74) | (−0.73) | (−0.75) | |
| temph | 2.196 *** | 2.202 *** | 2.121 *** |
| (3.16) | (3.16) | (3.05) | |
| templ | 0.408 | 0.458 | 0.494 |
| (0.48) | (0.53) | (0.58) | |
| weekend | −1.467 | −1.533 | −1.862 |
| (−0.43) | (−0.45) | (−0.55) | |
| holiday | 5.104 | 5.306 | 4.540 |
| (0.64) | (0.67) | (0.57) | |
| R2 | 0.581 | 0.581 | 0.584 |
| Panel C: second-tier cities | |||
| subwayopen | −6.323 | −12.590 * | −0.737 |
| (−1.26) | (−1.82) | (−0.08) | |
| rain | −1.037 | −0.974 | −0.624 |
| (−0.37) | (−0.34) | (−0.22) | |
| wind | −12.109 *** | −12.094 *** | −12.048 *** |
| (−6.94) | (−6.93) | (−6.83) | |
| temph | 2.461 *** | 2.482 *** | 2.428 *** |
| (4.23) | (4.27) | (4.18) | |
| templ | 0.180 | 0.197 | 0.353 |
| (0.26) | (0.28) | (0.50) | |
| weekend | 0.938 | 0.965 | 1.013 |
| (0.37) | (0.38) | (0.40) | |
| holiday | 2.332 | 1.634 | 2.697 |
| (0.41) | (0.29) | (0.47) | |
| R2 | 0.587 | 0.589 | 0.592 |
Table 6.
Effects of new subway opening on PM2.5 concentration (different bandwidths).
| Variable | ±10 | ±15 | ±25 | ±30 | ||||
|---|---|---|---|---|---|---|---|---|
| subwayopen | −19.947 *** | −18.431 ** | −21.991 *** | −20.111 *** | −15.281 *** | −29.883 *** | −7.170 ** | −21.132 *** |
| (−3.60) | (−2.17) | (−5.01) | (−3.10) | (−3.71) | (−5.09) | (−2.17) | (−4.44) | |
| rain | −2.627 | −2.648 | −1.820 | −1.811 | −3.384 | −3.115 | −0.683 | −0.390 |
| (−0.70) | (−0.70) | (−0.65) | (−0.65) | (−1.30) | (−1.20) | (−0.34) | (−0.20) | |
| wind | −5.517 ** | −5.404 ** | −6.392 *** | −6.331 *** | −7.201 *** | −7.291 *** | −6.918 *** | −7.000 *** |
| (−2.32) | (−2.25) | (−3.55) | (−3.50) | (−4.46) | (−4.53) | (−5.51) | (−5.59) | |
| temph | 1.366 * | 1.375 * | 2.524 *** | 2.498 *** | 1.922 *** | 1.823 *** | 1.894 *** | 1.825 *** |
| (1.86) | (1.87) | (4.71) | (4.65) | (4.06) | (3.86) | (5.08) | (4.91) | |
| templ | 1.663 * | 1.641 * | −0.206 | −0.178 | 1.375 ** | 1.329 ** | 1.061 ** | 1.072 ** |
| (1.90) | (1.87) | (−0.32) | (−0.27) | (2.42) | (2.35) | (2.39) | (2.42) | |
| weekend | −6.026 * | −6.032 * | −3.371 | −3.428 | −0.953 | −0.877 | 0.262 | 0.200 |
| (−1.94) | (−1.94) | (−1.40) | (−1.42) | (−0.43) | (−0.40) | (0.15) | (0.11) | |
| holiday | 6.139 | 5.815 | 9.914 * | 9.962 * | 5.225 | 5.622 | 5.569 | 6.757 * |
| (0.89) | (0.83) | (1.77) | (1.77) | (1.07) | (1.15) | (1.51) | (1.82) | |
| time trend | 1st order | 2nd order | 1st order | 2nd order | 1st order | 2nd order | 1st order | 2nd order |
| R2 | 0.611 | 0.611 | 0.601 | 0.601 | 0.563 | 0.566 | 0.523 | 0.528 |
Table 7.
Effects of new subway openings on air quality and visibility.
| Variable | AQI | visibility | ||
|---|---|---|---|---|
| subwayopen | −18.482 *** | −24.101 *** | 1.760 *** | 1.595 ** |
| (−3.97) | (−3.60) | (3.61) | (2.29) | |
| rain | −7.323 ** | −7.195 ** | −1.669 *** | −1.684 *** |
| (−2.52) | (−2.47) | (−5.52) | (−5.58) | |
| wind | −8.926 *** | −8.943 *** | 0.630*** | 0.622 *** |
| (−4.82) | (−4.82) | (3.30) | (3.26) | |
| temph | 3.728 *** | 3.724 *** | 0.164 *** | 0.165 *** |
| (6.83) | (6.82) | (2.93) | (2.96) | |
| templ | 0.323 | 0.293 | −0.478 *** | −0.471 *** |
| (0.49) | (0.44) | (−6.99) | (−6.89) | |
| weekend | −2.282 | −2.276 | 0.102 | 0.094 |
| (−0.91) | (−0.90) | (0.39) | (0.36) | |
| holiday | 5.624 | 5.558 | −2.527 *** | −2.313 *** |
| (1.00) | (0.98) | (−4.20) | (−3.83) | |
| time trend | 1st order | 2nd order | 1st order | 2nd order |
| R2 | 0.550 | 0.551 | 0.544 | 0.548 |
Table 8.
Results after dropping the potential fraud interval of AQI data.
| Variable | 1 | 2 | 3 | 4 |
|---|---|---|---|---|
| Panel A: drop (95,105) | Panel B: drop (90,110) | |||
| subwayopen | −19.566 *** | −25.015 *** | −21.651 *** | −28.671 *** |
| (−4.67) | (−4.16) | (−4.98) | (−4.58) | |
| rain | −3.236 | −3.144 | −3.728 | −3.595 |
| (−1.23) | (−1.20) | (−1.36) | (−1.31) | |
| wind | −7.822 *** | −7.825 *** | −8.244 *** | −8.211 *** |
| (−4.72) | (−4.72) | (−4.70) | (−4.68) | |
| temph | 2.280 *** | 2.275 *** | 2.312 *** | 2.316 *** |
| (4.57) | (4.56) | (4.44) | (4.45) | |
| templ | 0.374 | 0.340 | 0.291 | 0.239 |
| (0.61) | (0.56) | (0.45) | (0.37) | |
| weekend | −2.025 | −1.991 | −2.176 | −2.216 |
| (−0.89) | (−0.88) | (−0.92) | (−0.93) | |
| holiday | 7.332 | 6.999 | 10.971 ** | 10.623 ** |
| (1.46) | (1.39) | (2.10) | (2.02) | |
| time trend | 1st order | 2nd order | 1st order | 2nd order |
| R2 | 0.589 | 0.590 | 0.609 | 0.610 |
Table 9.
Effects of new subway openings on carbon monoxide.
| Variable | 1 | 2 | 3 |
|---|---|---|---|
| subwayopen | −0.137 *** | −0.210 *** | −0.102 |
| (−3.10) | (−3.31) | (−1.18) | |
| rain | 0.054 * | 0.055 ** | 0.056 ** |
| (1.95) | (2.00) | (2.03) | |
| wind | −0.086 *** | −0.087 *** | −0.087 *** |
| (−4.91) | (−4.93) | (−4.92) | |
| temph | 0.018 *** | 0.018 *** | 0.018 *** |
| (3.51) | (3.50) | (3.42) | |
| templ | 0.011 * | 0.010 | 0.011 * |
| (1.67) | (1.62) | (1.71) | |
| weekend | −0.019 | −0.019 | −0.021 |
| (−0.78) | (−0.78) | (−0.86) | |
| holiday | 0.053 | 0.053 | 0.058 |
| (0.98) | (0.99) | (1.07) | |
| R2 | 0.648 | 0.649 | 0.649 |
Note: Dependent variable is CO.
Table 10.
Effect heterogeneity by car ownership.
| Variable | 1 | 2 | 3 |
|---|---|---|---|
| Panel A: cities with high car ownership | |||
| subwayopen | −11.420 ** | −25.938 *** | −22.722 ** |
| (−1.99) | (−3.20) | (−1.97) | |
| rain | −4.895 | −4.445 | −7.146 * |
| (−1.31) | (−1.19) | (−1.86) | |
| wind | −2.268 | −2.370 | −2.319 |
| (−1.01) | (−1.06) | (−1.00) | |
| temph | 1.799 *** | 1.760 *** | 1.658 ** |
| (2.68) | (2.64) | (2.39) | |
| templ | 2.363 *** | 2.205 *** | 1.033 |
| (2.85) | (2.67) | (1.23) | |
| weekend | 0.380 | 0.570 | 0.962 |
| (0.12) | (0.19) | (0.30) | |
| holiday | 5.031 | 3.958 | 2.278 |
| (0.63) | (0.50) | (0.28) | |
| R2 | 0.574 | 0.580 | 0.543 |
| Panel B: cities with low car ownership | |||
| subwayopen | −24.377 *** | −21.557 *** | −6.629 |
| (−4.33) | (−2.67) | (−0.61) | |
| rain | −1.114 | −1.172 | −0.983 |
| (−0.33) | (−0.34) | (−0.29) | |
| wind | −11.984 *** | −12.047 *** | −12.022 *** |
| (−5.17) | (−5.19) | (−5.16) | |
| temph | 2.474 *** | 2.466 *** | 2.442 *** |
| (3.66) | (3.64) | (3.61) | |
| templ | −0.433 | −0.409 | −0.376 |
| (−0.53) | (−0.50) | (−0.46) | |
| weekend | −3.082 | −3.180 | −3.702 |
| (−1.01) | (−1.04) | (−1.21) | |
| holiday | 10.146 | 10.810 * | 11.953 * |
| (1.64) | (1.74) | (1.92) | |
| R2 | 0.576 | 0.576 | 0.579 |
| Chow test | 5.69 *** | 5.20 *** | 4.48 *** |
Table 11.
Effect of urban subway network on PM2.5 concentrations, AQI and CO: OLS estimates.
| Variable | PM2.5 | AQI | CO |
|---|---|---|---|
| Panel A: subway mileage | |||
| mileage | −0.150 *** | −0.095 *** | −0.001 *** |
| (−2.77) | (−3.66) | (−3.22) | |
| R2 | 0.078 | 0.127 | 0.1015 |
| Panel B: mileage of new-built lines | |||
| new-built mileage | −0.040 | −0.026 | −0.001 ** |
| (−0.594) | (−0.72) | (−2.54) | |
| 0.051 | 0.030 | 0.0655 | |
| Panel C: passenger flow | |||
| passenger flow | −0.110 ** | −0.066 *** | −0.001 ** |
| (−2.28) | (-2.79) | (−2.14) | |
| R2 | 0.054 | 0.080 | 0.048 |
| Panel D: intensity of passenger flow | |||
| intensity | −16.029 * | −8.881 ** | −0.003 |
| (−1.85) | (−2.08) | (−0.05) | |
| R2 | 0.037 | 0.057 | 0.088 |
© 2018 by the authors. Licensee MDPI, Basel, Switzerland. This article is an open access article distributed under the terms and conditions of the Creative Commons Attribution (CC BY) license (http://creativecommons.org/licenses/by/4.0/).
Share and Cite
MDPI and ACS Style
Lu, H.; Zhu, Y.; Qi, Y.; Yu, J. Do Urban Subway Openings Reduce PM2.5 Concentrations? Evidence from China. Sustainability 2018, 10, 4147. https://doi.org/10.3390/su10114147
AMA Style
Lu H, Zhu Y, Qi Y, Yu J. Do Urban Subway Openings Reduce PM2.5 Concentrations? Evidence from China. Sustainability. 2018; 10(11):4147. https://doi.org/10.3390/su10114147
Chicago/Turabian StyleLu, Hongyou, Yunchan Zhu, Yu Qi, and Jinliang Yu. 2018. "Do Urban Subway Openings Reduce PM2.5 Concentrations? Evidence from China" Sustainability 10, no. 11: 4147. https://doi.org/10.3390/su10114147
Note that from the first issue of 2016, this journal uses article numbers instead of page numbers. See further details here.