The Concentrations and Removal Effects of PM10 and PM2.5 on a Wetland in Beijing


 and
and
Abstract
:1. Introduction
2. Experiments
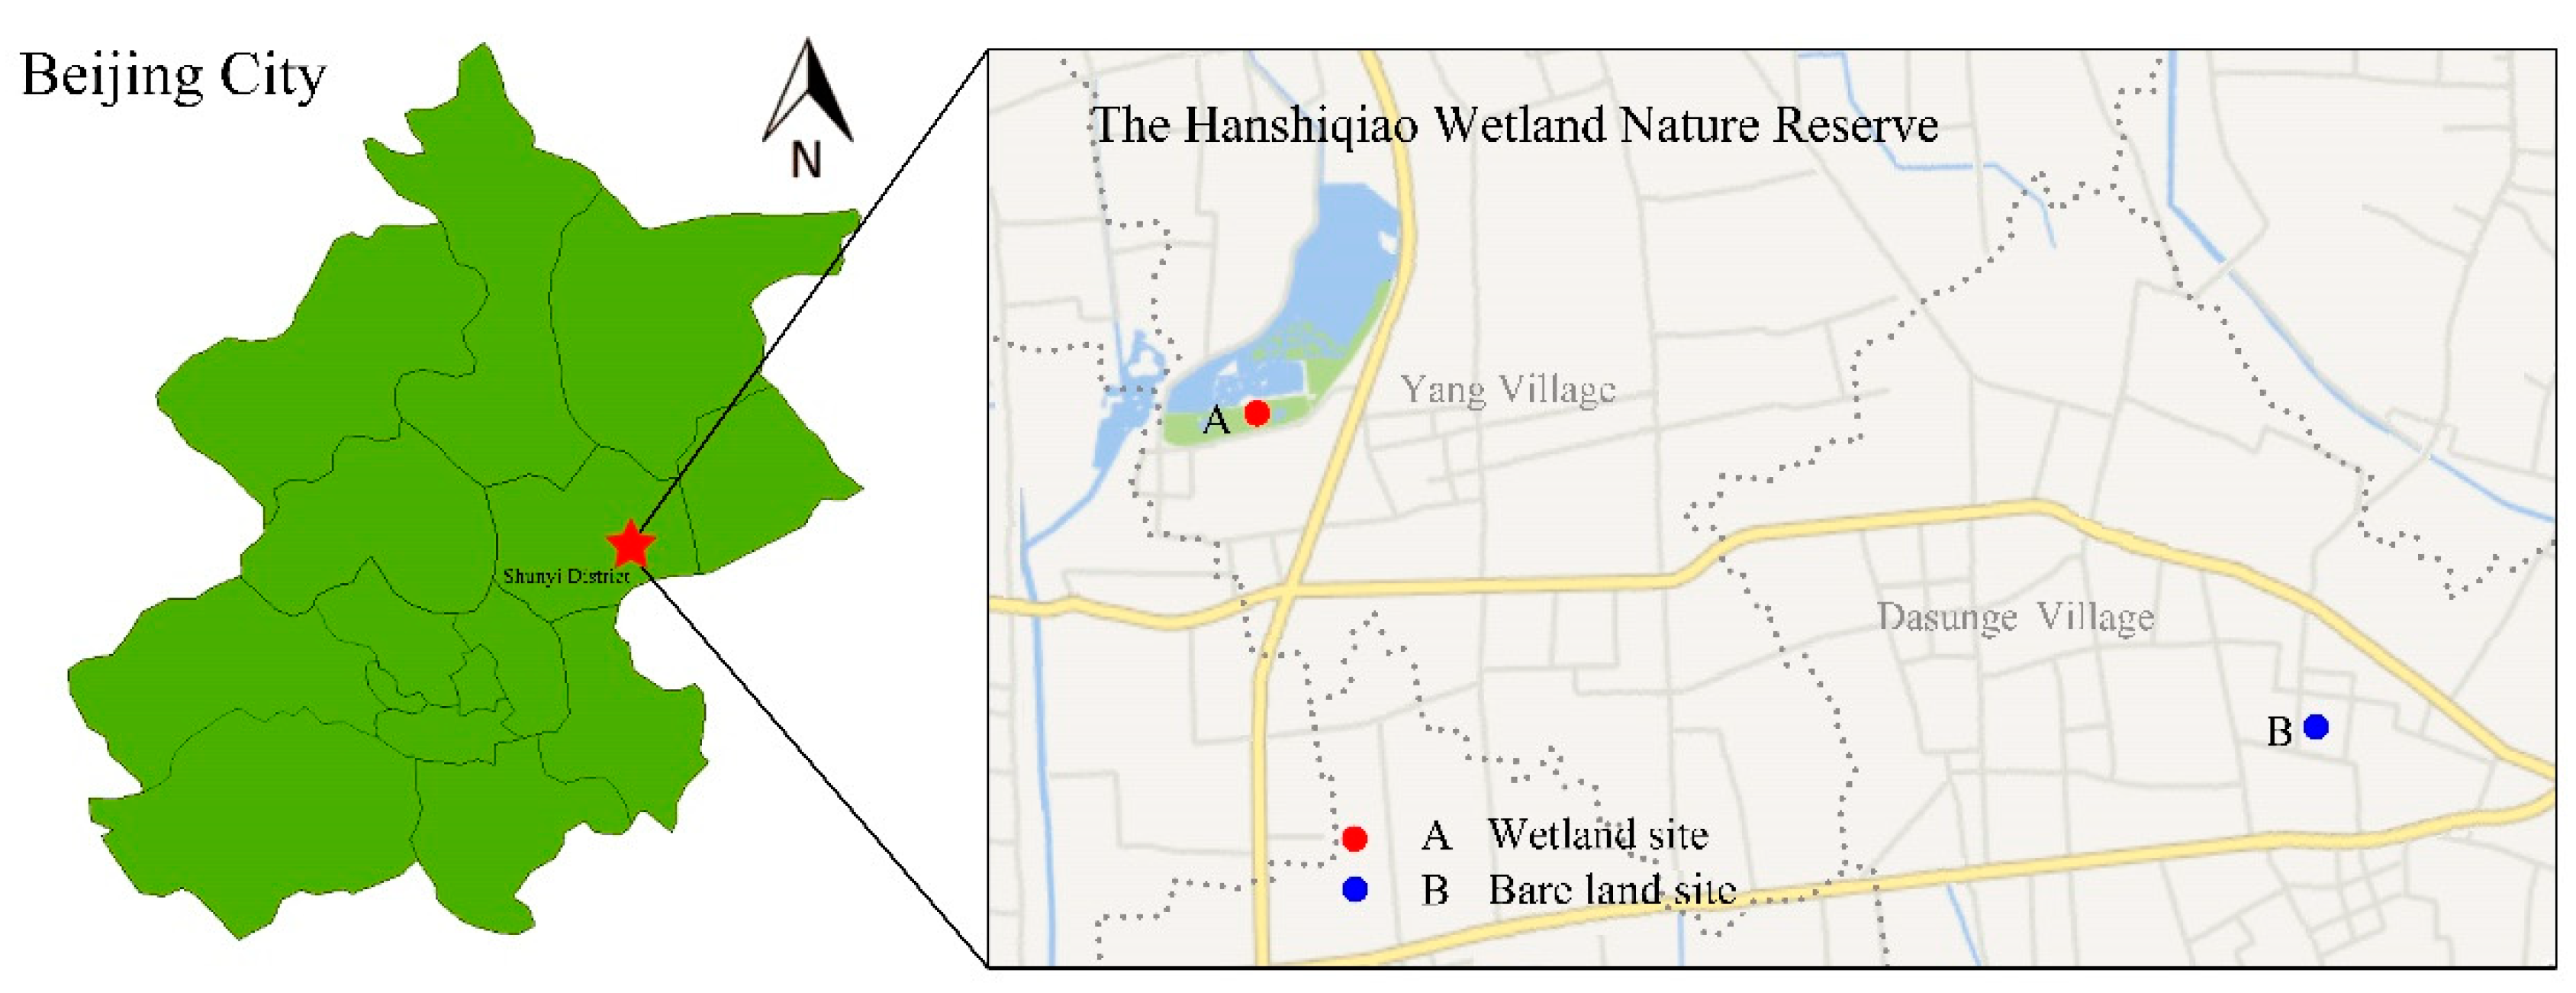
2.1. Study Area
2.2. Measurements
2.3. Estimating of the Dry Removal Efficiency of PM10 and PM2.5
2.4. Statistical Analysis
3. Results and Discussion
3.1. Meteorological Factors
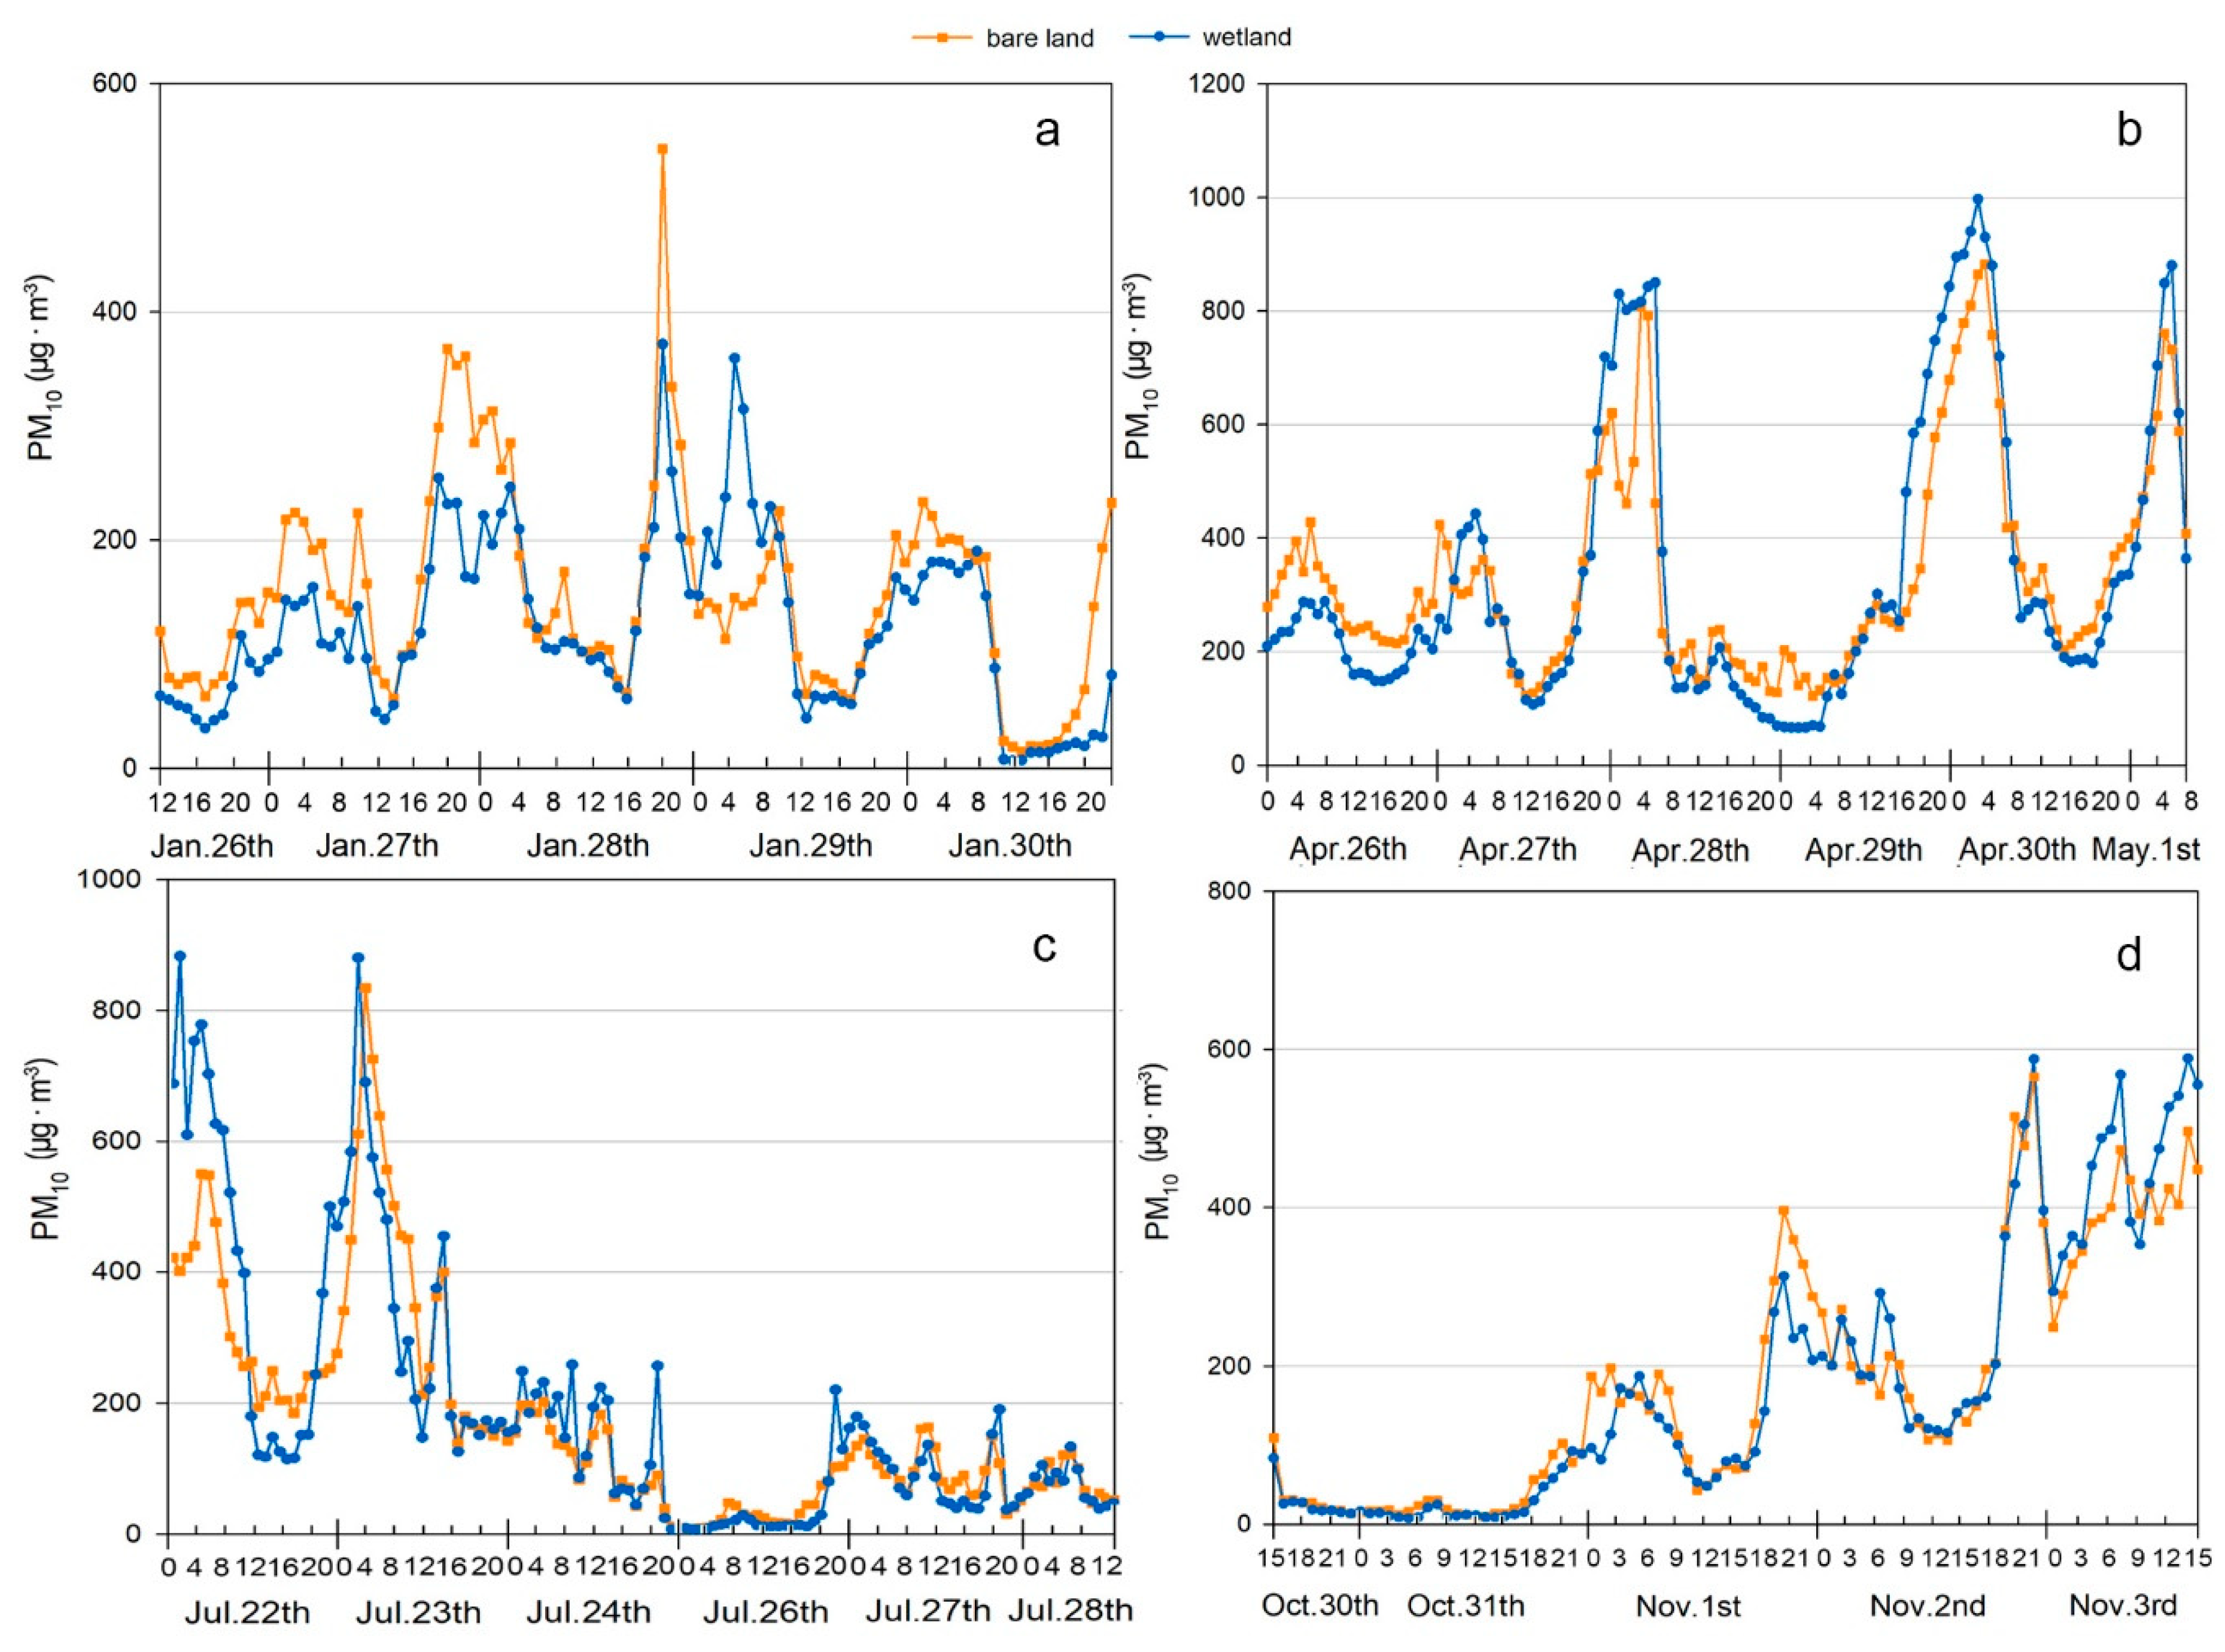
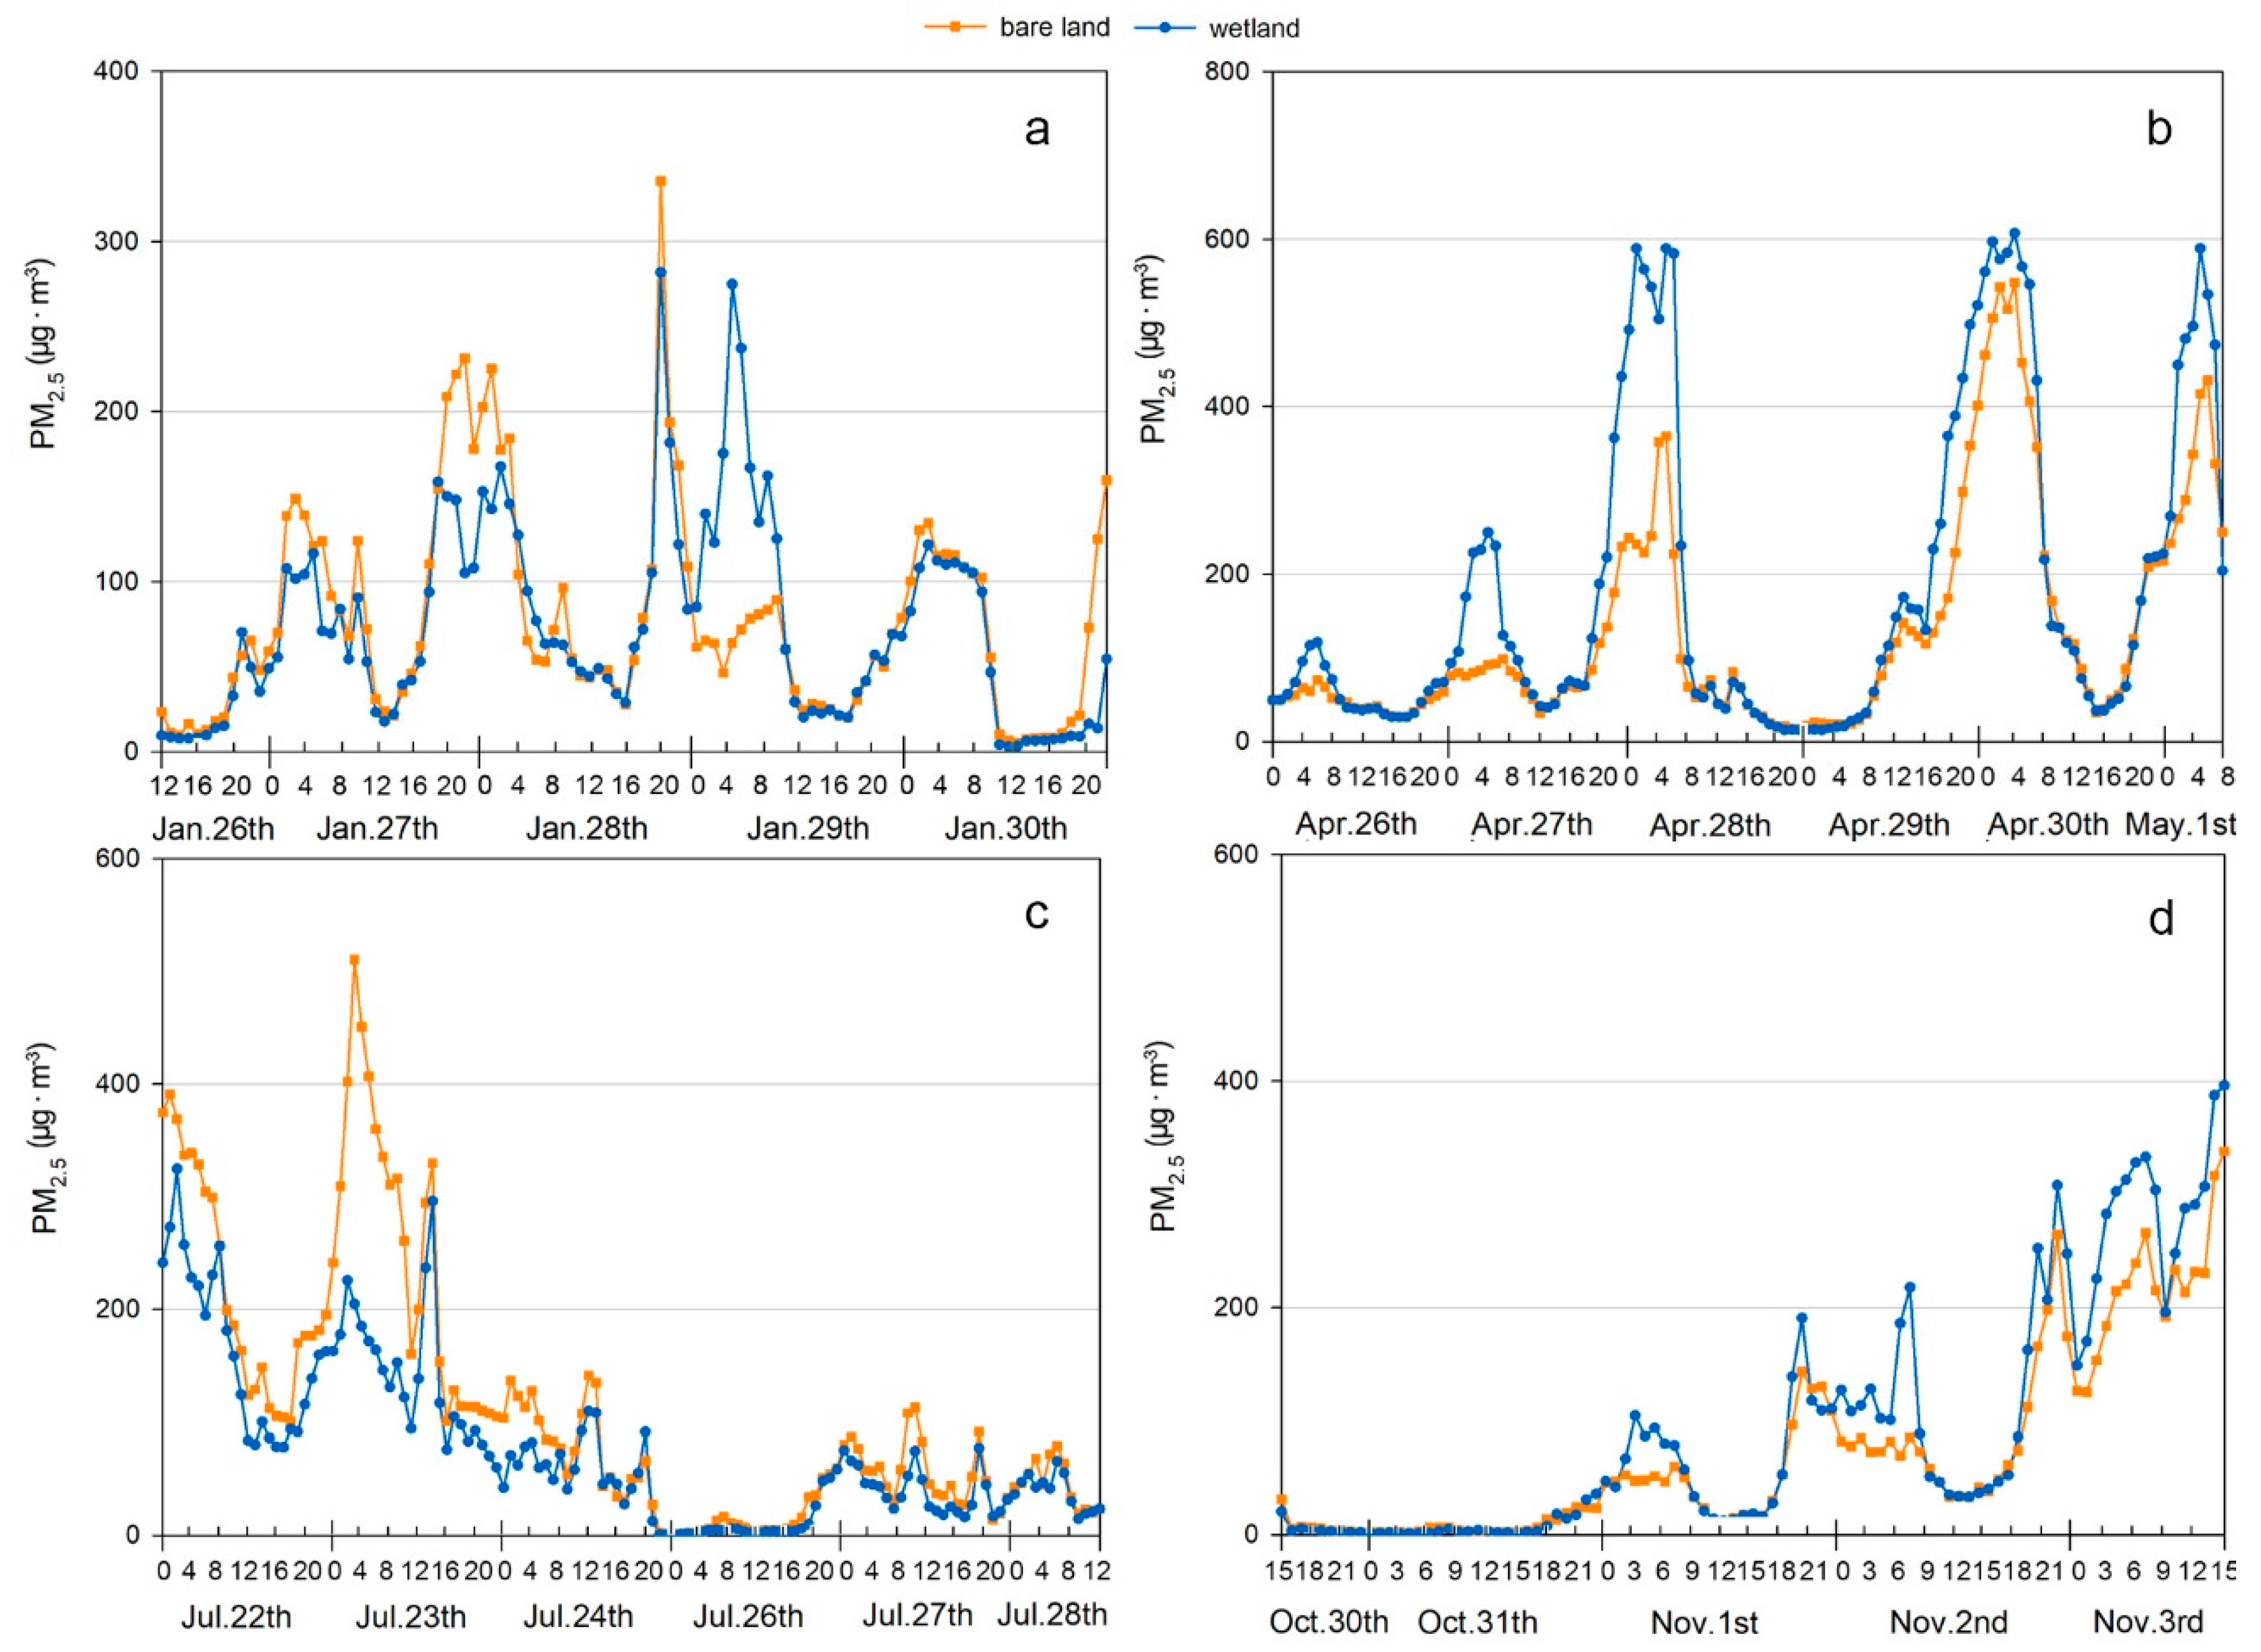
3.2. PM Mass Concentration
3.3. Effect of Meteorological Factors on PM10 and PM2.5 Concentrations
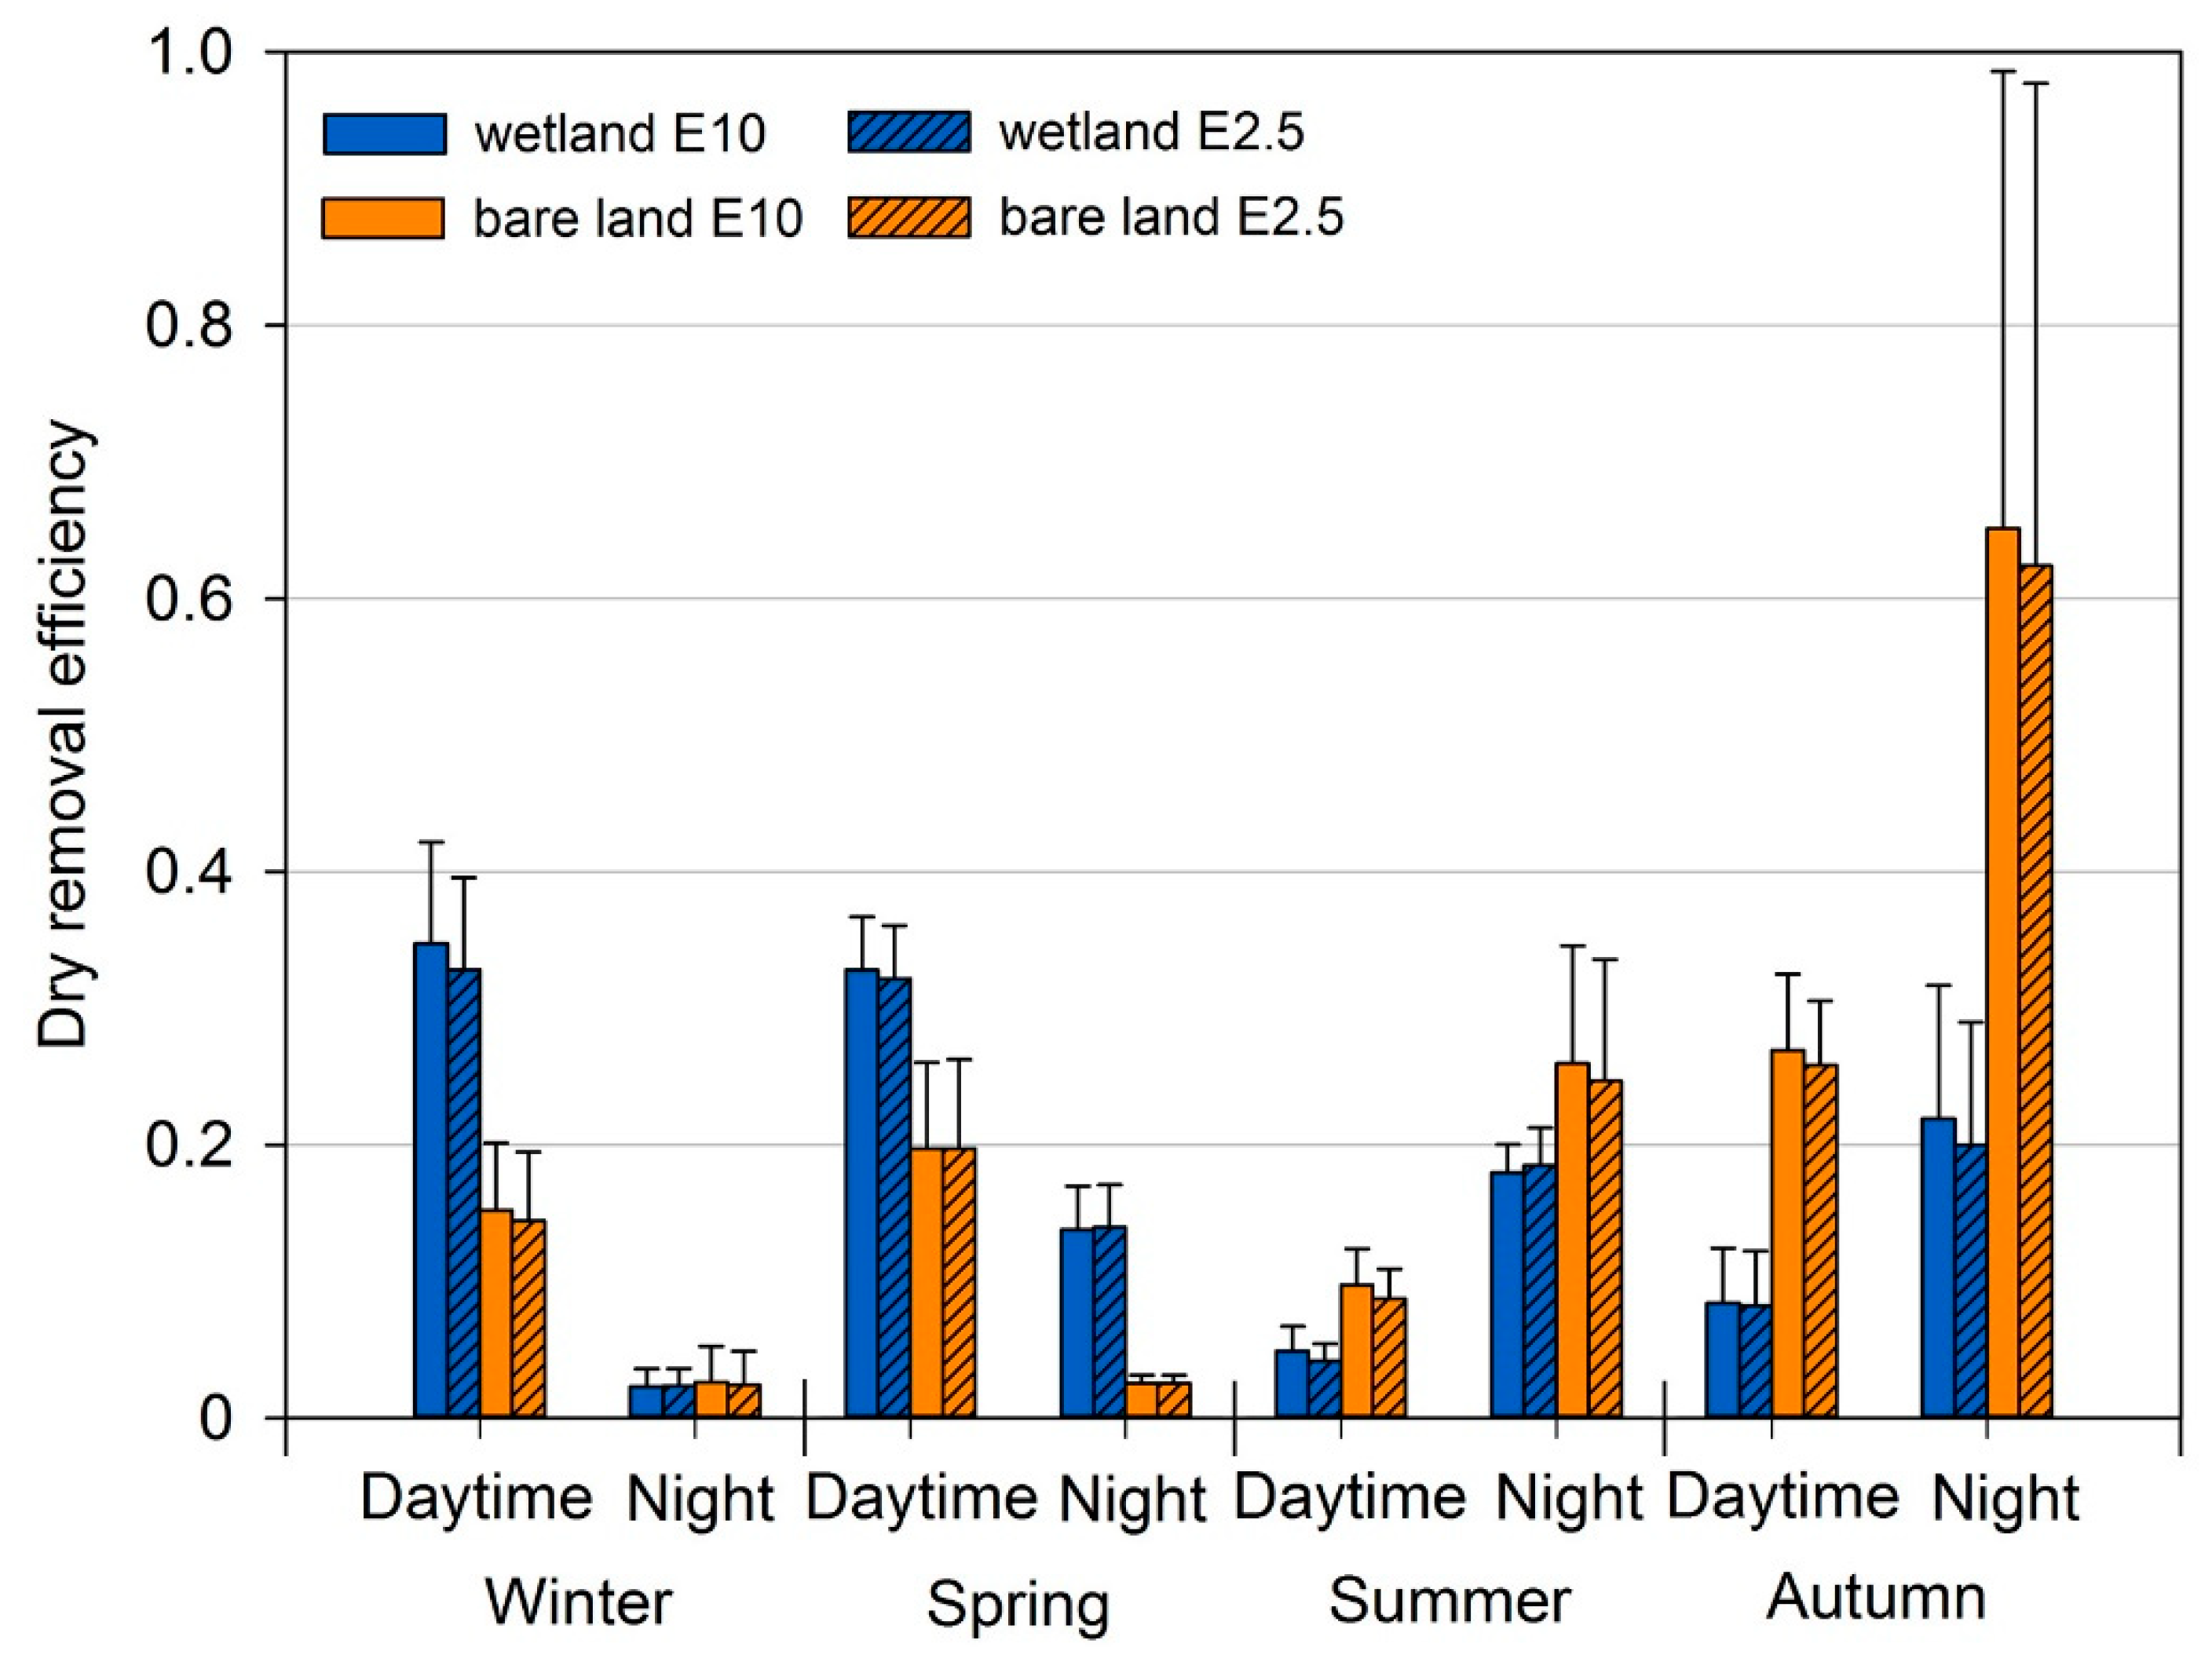
3.4. Removal Effects
4. Conclusions
Author Contributions
Funding
Acknowledgments
Conflicts of Interest
References
- Park, S.H.; Ko, D.W. Investigating the Effects of the Built Environment on PM2.5 and PM10: A Case Study of Seoul Metropolitan City, South Korea. Sustainability 2018, 10, 4552. [Google Scholar] [CrossRef]
- Beckett, K.P.; Freer-Smith, P.H.; Taylor, G. Urban woodlands: Their role in reducing the effects of particulate pollution. Environ. Pollut. 1998, 99, 347–360. [Google Scholar] [CrossRef]
- Tiwari, S.; Srivastava, A.K.; Singh, A.K.; Singh, S. Identification of aerosol types over Indo-Gangetic Basin: Implications to optical properties and associated radiative forcing. Environ. Sci. Pollut. Res. 2015, 22, 12246–12260. [Google Scholar] [CrossRef] [PubMed]
- Lipfert, F.W. An assessment of air pollution exposure information for health studies. Atmosphere 2015, 6, 1736–1752. [Google Scholar] [CrossRef]
- Yang, F.M.; Ma, Y.L.; He, K.B. A brief introduction to PM2.5 and related research. World Environ. 2000, 4, 32–34. [Google Scholar]
- Wang, L.L.; Wang, Y.S.; Wang, Y.H.; Sun, Y.; Ji, D.S.; Ren, Y.F. Relationship between different synoptic weather patterns and concentration of NOX, O3 and PM2.5/10 in beijing during summer and autumn. China Environ. Sci. 2010, 30, 924–930. [Google Scholar] [CrossRef]
- Yarnal, B. Synoptic climatology in environmental analysis, a primer. J. Prev. Med. Inf. 1993, 347, 170–180. [Google Scholar]
- Li, H.; Duan, F.; He, K.; Ma, Y.; Kimoto, T.; Huang, T. Size-dependent characterization of atmospheric particles during winter in beijing. Atmosphere 2016, 7, 36. [Google Scholar] [CrossRef]
- Wu, J.; Xu, C.; Wang, Q.; Cheng, W. Potential sources and formations of the pm2.5 pollution in urban hangzhou. Atmosphere 2016, 7, 100. [Google Scholar] [CrossRef]
- Beckett, K.P.; Freer-Smith, P.; Taylor, G. Effective tree species for local air quality management. J. Arboric. 2000, 26, 12–19. [Google Scholar]
- Nowak, D.J.; Crane, D.E.; Stevens, J.C. Air pollution removal by urban trees and shrubs in the United states. Urban For. Urban Green. 2006, 4, 115–123. [Google Scholar] [CrossRef]
- Petroff, A.; Mailliat, A.; Amielh, M.; Anselmet, F. Aerosol dry deposition on vegetative canopies. Part I: Review of present knowledge. Atmos. Environ. 2008, 42, 3625–3653. [Google Scholar] [CrossRef]
- Wang, Y.C. Carbon sequestration and foliar dust retention by woody plants in the greenbelts along two major Taiwan highways. Ann. Appl. Biol. 2011, 159, 244–251. [Google Scholar] [CrossRef]
- Dzierżanowski, K.; Popek, R.; Gawrońska, H.; Sæbø, A.; Gawroński, S.W. Deposition of particulate matter of different size fractions on leaf surfaces and in waxes of urban forest species. Int. J. Phytoremed. 2011, 13, 1037–1046. [Google Scholar] [CrossRef] [PubMed]
- Wang, X.F. Determination of concentrations of elements in the atmospheric aerosol of the urban and rural areas of Beijing in winter. Biol. Trace Element Res. 1999, 71, 203–208. [Google Scholar] [CrossRef]
- Edwards, R. Smog blights babies in the womb. New. Sci. 1996, 152, 4. [Google Scholar]
- Chen, J.G.; Yu, X.X.; Sun, F.B.; Lun, X.L.; Fu, Y.; Jia, G.D.; Zhang, Z.M.; Liu, X.H.; Mo, L.; Bi, H.X. The concentrations and reduction of airborne particulate matter (pm10, pm2.5, pm1) at shelterbelt site in beijing. Atmosphere 2015, 6, 650–676. [Google Scholar] [CrossRef]
- Nieuwstadt, F. The Turbulent Structure of the Stable, Noctural Boundary Layer. J. Atmos. Sci. 1984, 41, 2202–2216. [Google Scholar] [CrossRef]
- Hao, Y.B.; Cui, X.Y.; Wang, Y.F.; Mei, X.R.; Kang, X.M. Predominance of precipitation and temperature controls on ecosystem CO2 exchange in Zoige alpine wetlands of southwest China. Wetlands 2011, 31, 413–422. [Google Scholar] [CrossRef]
- Kang, X.M.; Wang, Y.F.; Chen, H.; Tian, J.Q.; Rui, Y.C.; Zhong, L.; Paul, K.; Hao, Y.B.; Xiao, X.M. Modeling carbon fluxes using multi temporal MODIS imagery and CO2 eddy flux tower data in Zoige alpine wetland, south-west China. Wetlands 2014, 34, 603–618. [Google Scholar] [CrossRef]
- Qiu, D.D.; Liu, J.K.; Zhu, L.J.; Mo, L.C.; Zhang, Z.M. Particulate matter assessment of a wetland in Beijing. J. Environ. Sci. 2015, 36, 93–101. [Google Scholar] [CrossRef] [PubMed]
- Liu, J.K.; Zhu, L.J.; Wang, H.H.; Yang, Y.L.; Liu, J.T.; Qiu, D.D.; Ma, W.; Zhang, Z.M.; Liu, J.L. Dry deposition of particulate matter at an urban forest, wetland and lake surface in Beijing. Atmos. Environ. 2016, 125, 178–187. [Google Scholar] [CrossRef]
- Liu, J.K.; Mo, L.C.; Zhu, L.J.; Yang, Y.L.; Liu, J.T.; Qiu, D.D.; Zhang, Z.M.; Liu, J.L. Removal efficiency of particulate matters at different underlying surfaces in Beijing. Environ. Sci. Pollut. Res. 2016. [Google Scholar] [CrossRef] [PubMed]
- Hao, L.S.; Min, J.Z.; Duan, Y.; Wang, J.H.; Wang, J.H.; Wu, Z.H.; Shi, L.X. Observational research on distribution of aerosols observational research on distribution of aerosols over the Hengshui Lake Area. J. Nanjing Inst. Meteorol. 2008, 31, 109–115. [Google Scholar]
- Sun, R.; Chen, A.; Chen, L.; Lu, Y.H. Cooling effects of wetlands in an urban region: The case of Beijing. Ecol. Indic. 2012, 20, 57–64. [Google Scholar] [CrossRef]
- Dockery, D.W.; Pope, C.A.; Xu, X.; Spengler, J.D.; Ware, J.H.; Fay, M.E. An association between air pollution and mortality in six US cities. N. Engl. J. Med. 1993, 329, 1753–1759. [Google Scholar] [CrossRef] [PubMed]
- Li, C.Y.; Cui, L.J.; Zhang, X.D.; Zhu, Y.N.; Li, W.; Lei, Y.R.; Kang, X.M. Particulate matter adsorption capacity of 7 species of wetland plants in Beijing. Ecol. Environ. Sci. 2016, 25, 1967–1973. [Google Scholar]
- Escobedo, F.J.; Nowak, D.J. Spatial heterogeneity and air pollution removal by an urban forest. Landsc. Urban Plan. 2009, 90, 102–110. [Google Scholar] [CrossRef]
- Tallis, M.; Taylor, G.; Sinnett, D. Estimating the removal of atmospheric particulate pollution by the urban tree canopy of London under current and future environments. Landsc. Urban Plan. 2011, 103, 129–138. [Google Scholar] [CrossRef]
- Kim, M.; Ohba, R.; Oura, M.; Kato, S. Study on long-term radiation exposure analysis after the Fukushima Dai-ichi nuclear power plant accident: Validation of the EU long-term radiation exposure model (ERMIN). J. Nucl. Sci. Technol. 2016, 53, 774–782. [Google Scholar] [CrossRef]
- Freer-Smith, P.; El-Khatib, A.; Taylor, G. Capture of particulate pollution by trees: A comparison of species typical of semi-arid areas with european and north american species. Water Air Soil Pollut. 2004, 155, 173–187. [Google Scholar] [CrossRef]
- Pullman, M. Conifer PM2.5 Deposition and Re-Suspension in Wind and Rain Events; Cornell University: Ithaca, NY, USA, 2009. [Google Scholar]
- Beckett, K.P.; Freer-Smith, P.H.; Taylor, G. Particulate pollution capture by urban trees: Effect of species and wind speed. Glob. Chang. Biol. 2000, 6, 995–1003. [Google Scholar] [CrossRef]
- Zhu, L.; Liu, J.; Cong, L.; Ma, W.; Ma, W.; Zhang, Z. Spatiotemporal characteristics of particulate matter and dry deposition flux in the Cuihu wetland of Beijing. PLoS ONE 2016, 11, e0158616. [Google Scholar] [CrossRef] [PubMed]
- Zhang, L.; Gong, S.; Padro, J.; Barrie, L. A size-segregated particle dry deposition scheme for an atmospheric aerosol module. Atmos. Environ. 2001, 35, 549–560. [Google Scholar] [CrossRef]
- Gong, X.L.; Wang, Y.Y.; Nie, X.; Yin, X.M. Differences in air temperature and relative humidity between a marsh wetland and its surrounding dry farmland. J. Northeast For. Univ. 2011, 39, 93–96. [Google Scholar]
- Wu, D.; Zhang, F.; Ge, X.; Yang, M.; Xia, J.; Liu, G.; Li, F. Chemical and Light Extinction Characteristics of Atmospheric Aerosols in Suburban Nanjing, China. Atmosphere 2017, 8, 149. [Google Scholar] [CrossRef]
- Whitlow, T.H.; Hall, A.; Zhang, K.M.; Anguita, J. Impact of local traffic exclusion on near-road air quality: Findings from the New York City “Summer Streets” campaign. Environ. Pollut. 2011, 159, 2016–2027. [Google Scholar] [CrossRef] [PubMed]
- Nguyen, T.; Yu, X.; Zhang, Z.; Liu, M.; Liu, X. Relationship between types of urban forest and PM2.5 capture at three growth stages of leaves. J. Environ. Sci. 2015, 27, 33–41. [Google Scholar] [CrossRef] [PubMed]
- Witkowska, A.; Lewandowska, A.U.; Saniewska, D.; Falkowska, L.M. Effect of agriculture and vegetation on carbonaceous aerosol concentrations (PM2.5 and PM10) in Puszcza Borecka National Nature Reserve (Poland). Air Qual. Atmos. Health 2016, 9, 761–773. [Google Scholar] [CrossRef] [PubMed]
- Wang, J.; Ogawa, S. Effects of meteorological conditions on PM2.5 concentrations in Nagasaki, Japan. Int. J. Environ. Res. Public Health 2015, 12, 9089–9101. [Google Scholar] [CrossRef] [PubMed]
- Liu, Z.; Hu, B.; Wang, L.; Wu, F.; Gao, W.; Wang, Y. Seasonal and diurnal variation in particulate matter (PM10 and PM2.5) at an urban site of beijing: Analyses from a 9-year study. Environ. Sci. Pollut. Res. 2015, 22, 627–642. [Google Scholar] [CrossRef] [PubMed]
- Chen, L.; Peng, S.; Liu, J.; Hou, Q. Dry deposition velocity of total suspended particles and meteorological influence in four locations in Guangzhou, China. J. Environ. Sci. 2012, 24, 632–639. [Google Scholar] [CrossRef]
- Katata, G.; Kajino, M.; Matsuda, K.; Takahashi, A.; Nakaya, K. A numerical study of the effects of aerosol hygroscopic properties to dry deposition on a broad-leaved forest. Atmos. Environ. 2014, 97, 501–510. [Google Scholar] [CrossRef]
- Liu, J.; Zhai, J.; Zhu, L.; Yang, Y.; Liu, J.; Zhang, Z. Particle removal by vegetation: Comparison in a forest and a wetland. Environ. Sci. Pollut. Res. 2017, 24, 1597–1607. [Google Scholar] [CrossRef] [PubMed]
- Zhao, H.; Zheng, Y.; Li, C. Spatiotemporal Distribution of PM2.5 and O3 and Their Interaction During the Summer and Winter Seasons in Beijing, China. Sustainability 2018, 10, 4519. [Google Scholar] [CrossRef]
- Ruijgrok, W.; Tieben, H.; Eisinga, P. The dry deposition of particles to a forest canopy: A comparison of model and experimental results. Atmos. Environ. 1997, 31, 399–415. [Google Scholar] [CrossRef]
- Tofful, L.; Perrino, C. Chemical composition of indoor and outdoor PM2.5 in three schools in the city of Rome. Atmosphere 2015, 6, 1422–1443. [Google Scholar] [CrossRef]
- Wu, R.D.; Zhou, X.H.; Wang, LP.; Wang, Z.; Zhou, Y.; Zhang, J.; Wang, W.X. Pm2.5 characteristics in qingdao and across coastal cities in china. Atmosphere 2017, 8, 77. [Google Scholar] [CrossRef]
- Qi, L.; Chen, M.D.; Ge, X.L.; Zhang, Y.F.; Guo, B.F. Seasonal variations and sources of 17 aerosol metal elements in suburban nanjing, china. Atmosphere 2016, 7, 153. [Google Scholar] [CrossRef]
- Matsuda, K.; Watanabe, I.; Wingpud, V.; Theramongkol, P.; Ohizumi, T. Deposition velocity of O3 and SO2 in the dry and wet season above a tropical forest in northern Thailand. Atmos. Environ. 2006, 40, 7557–7564. [Google Scholar] [CrossRef]
- Wesely, M.L.; Cook, D.R.; Hart, R.L. Measurement and parameterization of particulate sulfur dry deposition over grass. J. Geophys. Res. 1985, 90, 2131–2143. [Google Scholar] [CrossRef]
- Williams, R.M. A model for the dry deposition of particles to natural water surfaces. Atmos. Environ. 1982, 16, 1933–1938. [Google Scholar] [CrossRef]
- Shahin, U.M.; Holsen, T.M.; Odabasi, M. Dry deposition measured with a water surface sampler: A comparison to modeled results. Atmos. Environ. 2002, 36, 3267–3276. [Google Scholar] [CrossRef]
- Erisman, J.W.; Draaijers, G. Deposition to forests in Europe: Most important factors influencing dry deposition and models used for generalisation. Environ. Pollut. 2003, 124, 379–388. [Google Scholar] [CrossRef]
- Mammarella, I.; Rannik, Ü.; Aalto, P.; Keronen, P.; Vesala, T.; Kulmala, M. Longterm aerosol particle flux observations. Part II: Particle size statistics and deposition velocities. Atmos. Environ. 2011, 45, 3794–3805. [Google Scholar] [CrossRef]
- Wesely, M.L.; Hicks, B.B. A review of the current status of knowledge on dry deposition. Atmos. Environ. 2000, 34, 2261–2282. [Google Scholar] [CrossRef]
- Liu, J.; Yan, G.; Wu, Y.; Zhang, Z.; Zhang, M. Wetlands with greater degree of urbanization improve PM2.5 removal efficiency. Chemosphere 2018, 207, 601–611. [Google Scholar] [CrossRef] [PubMed]
- Garratt, J.R. Surface influence upon vertical profiles in the atmospheric near-surface layer. Quart. J. R. Met. Soc. 1980, 106, 803–819. [Google Scholar] [CrossRef]
- Wu, Y.N.; Liu, J.K.; Zhai, J.X.; Cong, L.; Wang, Y.; Ma, W.M.; Zhang, Z.M.; Li, C.Y. Comparison of dry and wet deposition of particulate matter in near-surface waters during summer. PLoS ONE 2018, 13, e0199241. [Google Scholar] [CrossRef] [PubMed]
- Yang, T.Y.; Wang, Y.; Wu, Y.N.; Zhai, J.X.; Cong, L.; Yan, G.X.; Zhang, Z.M.; Li, C.Y. Effect of the wetland environment on particulate matter and dry deposition. Environ. Technol. 2018. [Google Scholar] [CrossRef] [PubMed]
- Croxford, B.; Penn, A.; Hillier, B. Spatial distribution of urban pollution: Civilizing urban traffic. Sci. Total Environ. 1996, 189, 3–9. [Google Scholar] [CrossRef]
- Baumgardner, D.; Varela, S.; Escobedo, F.J.; Chacalo, A.; Ochoa, C. The role of a peri-urban forest on air quality improvement in the Mexico City megalopolis. Environ. Pollut. 2012, 163, 174–183. [Google Scholar] [CrossRef] [PubMed]
- Erisman, J.W.; Draaijers, G.P.J. Atmospheric Deposition in Relation to Acidification and Eutrophication; Elsevier Science B.V.: Amsterdam, The Netherlands, 1995. [Google Scholar]
- Hicks, B.B.; Baldocchi, D.D.; Meyers, T.P.; Hosker, R.P.; Matt, D.R. A preliminary multiple resistance routine for deriving dry deposition velocities from measured quantities. Water Air Soil Pollut. 1987, 36, 311–330. [Google Scholar] [CrossRef]


| Type | Season | Temperature (°C) | Humidity (%) | Wind Speed (m/s) |
|---|---|---|---|---|
| Wetland | Winter | −6.43 ± 0.47 | 52.38 ± 3.01 | 0.32 ± 0.05 |
| Spring | 17.27 ± 0.47 | 55.49 ± 2.63 | 0.38 ± 0.04 | |
| Summer | 26.92 ± 0.31 | 67.19 ± 2.45 | 0.06 ± 0.01 | |
| Autumn | 1.98 ± 0.51 | 50.89 ± 3.69 | 0.16 ± 0.03 | |
| Bare land | Winter | −3.95 ± 0.42 | 38.37 ± 1.53 | 0.19 ± 0.03 |
| Spring | 18.94 ± 0.46 | 40.48 ± 1.63 | 0.19 ± 0.03 | |
| Summer | 28.41 ± 0.36 | 67.85 ± 2.08 | 0.23 ± 0.04 | |
| Autumn | 3.42 ± 0.47 | 49.22 ± 2.92 | 0.38 ± 0.06 |
| Type | Season | Particulate | Parameters | Climate Factors | ||
|---|---|---|---|---|---|---|
| Temperature | Humidity | Wind Speed | ||||
| Wetland | Winter | PM10 | R | −0.495 ** | 0.700 ** | −0.553 ** |
| p Value | 0.000 | 0.000 | 0.000 | |||
| PM2.5 | R | −0.540 ** | 0.729 ** | −0.541 ** | ||
| p Value | 0.000 | 0.000 | 0.000 | |||
| Spring | PM10 | R | −0.391 ** | 0.797 ** | −0.442 ** | |
| p Value | 0.000 | 0.000 | 0.000 | |||
| PM2.5 | R | −0.400 ** | 0.816 ** | −0.454 ** | ||
| p Value | 0.000 | 0.000 | 0.000 | |||
| Summer | PM10 | R | −0.239 ** | 0.526 ** | −0.149 | |
| p Value | 0.006 | 0.000 | 0.088 | |||
| PM2.5 | R | −0.115 | 0.412 ** | −0.087 | ||
| p Value | 0.188 | 0.000 | 0.319 | |||
| Autumn | PM10 | R | −0.068 | 0.594 ** | −0.446 ** | |
| P Value | 0.511 | 0.000 | 0.000 | |||
| PM2.5 | R | −0.109 | 0.595 ** | −0.404 ** | ||
| p Value | 0.286 | 0.000 | 0.000 | |||
| year | PM10 | R | 0.100 * | 0.555 ** | −0.238 ** | |
| p Value | 0.031 | 0.000 | 0.000 | |||
| PM2.5 | R | −0.003 | 0.544 ** | −0.260 ** | ||
| p Value | 0.941 | 0.000 | 0.000 | |||
| Bareland | Winter | PM10 | R | −0.369 ** | 0.506 ** | −0.385 ** |
| p Value | 0.000 | 0.000 | 0.000 | |||
| PM2.5 | R | −0.407 ** | 0.472 ** | −0.355 ** | ||
| p Value | 0.000 | 0.000 | 0.000 | |||
| Spring | PM10 | R | −0.340 ** | 0.813 ** | −0.347 ** | |
| p Value | 0.000 | 0.000 | 0.000 | |||
| PM2.5 | R | −0.229 ** | 0.801 ** | −0.220 * | ||
| p Value | 0.009 | 0.000 | 0.012 | |||
| Summer | PM10 | R | −0.131 | 0.457 ** | −0.393 ** | |
| p Value | 0.133 | 0.000 | 0.000 | |||
| PM2.5 | R | −0.134 | 0.467 ** | −0.392 ** | ||
| p Value | 0.123 | 0.000 | 0.000 | |||
| Autumn | PM10 | R | −0.081 | 0.725 ** | −0.535 ** | |
| p Value | 0.432 | 0.000 | 0.000 | |||
| PM2.5 | R | 0.006 | 0.632 ** | −0.431 ** | ||
| p Value | 0.952 | 0.000 | 0.000 | |||
| year | PM10 | R | 0.076 | 0.402 ** | −0.385 ** | |
| p Value | 0.103 | 0.000 | 0.000 | |||
| PM2.5 | R | 0.121 ** | 0.511 ** | −0.329 ** | ||
| p Value | 0.009 | 0.000 | 0.000 | |||
© 2019 by the authors. Licensee MDPI, Basel, Switzerland. This article is an open access article distributed under the terms and conditions of the Creative Commons Attribution (CC BY) license (http://creativecommons.org/licenses/by/4.0/).
Share and Cite
Li, C.; Huang, Y.; Guo, H.; Wu, G.; Wang, Y.; Li, W.; Cui, L. The Concentrations and Removal Effects of PM10 and PM2.5 on a Wetland in Beijing. Sustainability 2019, 11, 1312. https://doi.org/10.3390/su11051312
Li C, Huang Y, Guo H, Wu G, Wang Y, Li W, Cui L. The Concentrations and Removal Effects of PM10 and PM2.5 on a Wetland in Beijing. Sustainability. 2019; 11(5):1312. https://doi.org/10.3390/su11051312
Chicago/Turabian StyleLi, Chunyi, Yilan Huang, Huanhuan Guo, Gaojie Wu, Yifei Wang, Wei Li, and Lijuan Cui. 2019. "The Concentrations and Removal Effects of PM10 and PM2.5 on a Wetland in Beijing" Sustainability 11, no. 5: 1312. https://doi.org/10.3390/su11051312
APA StyleLi, C., Huang, Y., Guo, H., Wu, G., Wang, Y., Li, W., & Cui, L. (2019). The Concentrations and Removal Effects of PM10 and PM2.5 on a Wetland in Beijing. Sustainability, 11(5), 1312. https://doi.org/10.3390/su11051312