Sustainable Peach Compote Production: A Life Cycle Thinking Approach


Department of Mechanical Engineering, University of Western Macedonia, Bakola and Salviera, 50100 Kozani, Greece
*
Author to whom correspondence should be addressed.
Sustainability 2018, 10(11), 4229; https://doi.org/10.3390/su10114229
Submission received: 15 September 2018
/
Revised: 12 November 2018
/
Accepted: 13 November 2018
/
Published: 16 November 2018
(This article belongs to the Section Sustainable Agriculture)
Abstract
:Peach production as well as the fruit canning industry is one of the most important agricultural supply chain sectors in Greece. In 2016 Greek canned peach production reached 300,000 tones. In this study we perform an environmental analysis of a peach compote production system in Greece, using Life Cycle Assessment. The system studied includes the stages of cultivation, transportation of peaches to the peach compote plant, the canning and finally packaging. The data used were collected directly from an orchard located in Larissa, in central Greece, and covers the production year of 2016. The functional unit adopted is the production of one paper box containing 24 cans of peach compotes. The Life Cycle Analysis results indicate that 48.41%, 25% and 20.98% of the environmental burdens are attributed to the acidification potential, global warming potential and particular matter formation impact categories, respectively; whereas eutrophication impact potential and photochemical oxidation formation impact accounted for 5.38% and 0.23%, respectively. The results of this study provide an understanding of the key environmental impact issues related to peach compote production in Greece.
1. Introduction
Agriculture historically has been used in Europe, in order to cover food needs. In an attempt to cover the growing demand of an increasing population, during the past twenty years, agriculture became more intensive. Nonetheless this shift was not beneficial to the environment, due to the increased use of nutrients in agricultural production. The environmental impacts of agriculture practices vary around the world, depending mainly on the production practices of the system used. The change from traditional farming practices to intensive production has led to important environmental problems such as: soil erosion, water pollution, over-exploitation of water resources, and loss of biodiversity, pesticides damage and risk for human health. According to Sanye-Mengual et al. [1], the intensification of agricultural production has led not only to the degradation of ecosystems but also to serious ecological imbalances that accentuate acute environmental problems inherited from industrialization (i.e., over-exploitation of land, pollution of ground and surface water, etc.). As per IPCC’s [2] report, the direct impact of agriculture is estimated to be about 10–12% of the global anthropogenic greenhouse gases emissions. In recognition of the above, the European Commission, in an attempt to promote sustainable agriculture [3], has encouraged farmers to adopt integrated and organic production practices.
Global production of peach and nectarine increased from 10.8 Mt in 1993 to 21.1 Mt in 2012. Asia is the greatest producer of peach followed by Europe [4]. Peach production is of great importance in the Mediterranean area. In recent years, Spain has been the biggest producer and exporter of peaches and nectarines, due to its early season harvest and yielding varieties. In regards to Greece, it is noted that the country is in the lead of European Union (EU) peach processes [5]. It should be mentioned that since the 1950s, the cultivation of peaches has been one of the main agricultural activities in Northern Greece—approximately 48,000 hectares currently are cultivated for the production of peaches and nectarines [5]. Greek farms are typically up to five hectares, much smaller than the average size in either the rest of the EU or the United States. Most of the crop is harvested in June and July. Production of fresh peaches and nectarines in 2016 in Greece reached 788,120 MT. In 2016, Greece exported 169,264 MT of fresh peaches and nectarines, mainly to Romania, Bulgaria, Germany and Ukraine. Greek exports of peaches and nectarines to Serbia increased almost 300% in 2016, resulting in the main EU supplier for Serbia. Greece imported 2670 MT of fresh peaches and nectarines, mainly from Bulgaria and Spain [5]. It is noted that within the fruit processing sector, peach canning holds a great percentage of the production and export levels. To be more specific, the exports of Greek canned peaches climbed by 30% during the first four months of 2015 compared with the same period in 2014 [6].
Many environmental systems analysis tools have been introduced during recent decades in order to estimate the environmental burdens linked to fruit production. These include inter alias Environmental Impact Assessment (EIA), Environmental Auditing (EA), System of Economic and Environmental Accounting (SEEA), Material Flow Analysis (MFA), as well as Life Cycle Assessment (LCA) [7]. Out of these methods, LCA seems to have been used in many studies for the assessment of the environmental burdens linked to fruit production [8,9,10,11]. It is mentioned that LCA originates from “net energy analysis” studies, first published in the 70s [12,13,14].
The performance of LCA regarding the agricultural sector takes into consideration the following impact categories: global warming, acidification, eutrophication, depletion of fossil, phosphate and potash resources [15]. These impact categories are directly correlated to the environmental and human health categories such as global warming, acidification and eutrophication [16]. In regards to the assessment of peach production, LCA has been previously employed in order to assess the environmental impacts associated with the production of peaches. These include inter alias the studies of Vinyes et al. [17], who evaluated the environmental impacts of peach production in North Spain, over a period of 15 years. According to their findings, fertigation has the highest contribution in all impact categories. Ingrao et al. [18] used the LCA methodology in order to assess the environmental impacts of peach orchards in South Italy. According to the results of their analysis, Greenhouse Gas Emissions (GHG) can be reduced through the improvement of irrigation practices. De Menna et al. [19]. studied the environmental impacts of nectar production; the authors showed that using byproducts from the nectar chain to produce bioenergy, which is then consumed to substitute heat and electricity, can reduce up to 37% of total non-renewable energy consumption.
To the best knowledge of authors, no previous work has been reported on the environmental impacts relevant to the industry of Greek peach compote production. Thus, this study aims to assess and quantify the environmental impacts from cradle to grave of peach compote production in Greece using the LCA methodology. To be more specific, LCA has been applied to the production of peach compote in plants in the area of Larissa, located at central Greece. The life cycle stages taken into consideration include the following stages: peach cultivation, transportation of peaches to the plant as well as process and package of final product. The environmental impacts are calculated for each of the abovementioned stages. The functional unit refers to the production of 1 paper box which contains 24 cans of peach compotes of 1 kg each one.
2. Materials and Methods
LCA tools have become more efficient and robust for the process of identification and quantification of potential environmental burdens and impacts of a product, process or an activity [20]. During recent decades, this methodology has been applied in different sectors including the field of agricultural, engineering and material sciences, thereby becoming an invaluable decision-support tool for manufacturers, policy-makers and other stakeholders. In this study, LCA is performed in order to evaluate the environmental impacts associated with the production of peach compotes in Greece according to ISO 14040-14044 [21,22,23,24,25]. In this regard, the following phases are taken into consideration: (1) Goal and scope definition; (2) Life Cycle Inventory (LCI) analysis; (3) Life Cycle Impact Assessment (LCIA); and finally, Life Cycle Interpretation.
The environmental impact categories considered in the study were selected according to ISO 14040 recommendations, system boundaries, and data availability. The following environmental impact indicators are taken into consideration: Global Warming (GW), Acidification Potential (AP), Eutrophication Potential (EP), Particular Matter Formation (PMF) and Photochemical Oxidant Formation (POF). The area under study is located in Larissa, in central Greece; the orchard comprises of an area of 1000 m2 with 40 planted peach trees, whereas the can production plant is located at a distance of 170 km from the peach orchard (39°42′06.5″ N 22°29′35.0″ E). The climate of the study area is typically Mediterranean with hot and dry summers, and mild and rainy winters. The winter is fairly mild, and some snowstorms may occur. The summer is particularly hot, and temperatures of 40 °C (104 °F) may occur. Thunderstorms or heavy rain may cause agricultural damage. Larissa receives 450 mm (18 in) of rain per year [26]. The city is the capital and largest city of the Thessaly region of Greece and capital of the Larissa regional unit. It has a municipality density is 480/km2. It is a principal agricultural center and a national transportation hub, linked by road and rail with the port of Volos, the city of Thessaloniki and Athens. Larissa, within its municipality, has 146,926 inhabitants, while the regional unit of Larissa reached a population of 162,591 [27].
2.1. Goal Definition and Functional Unit
The goal of this study is to assess the environmental impacts of a canned peach production system in Greece. The results of such an analysis can be useful to farmers, as well as technicians and local politicians involved in the fresh fruit production. The functional unit (FU) provides the reference to which all data and impact categories in the assessment are normalized. In this study, a paper box containing 24 cans of peach compotes is selected as a functional unit. The paper box contains 24 cans of peach compotes of 1 kg each. According to ISO 14040:2006 [21], LCA analysis evaluates the potential environmental impacts throughout a product’s life cycle from cradle-to-grave.
In order to obtain information about the environmental performance of the system under study the following environmental impacts categories were considered: Global Warming (GW), Acidification Potential (AP), Eutrophication Potential (EP), Particular Matter Formation (PMF) and Photochemical Oxidant Formation (POF). It should be noted that the selection of the impact categories was made on the basis of the typical impact categories, which quantify effects on ecosystems rather than those on resource consumption or human toxicity, with particular attention on the potential for global warming, eutrophication and acidification. In addition, the impacts of eutrophication and acidification are generally more related to the use of fertilizers and pesticides [28] and thus depend on the farming practices used and climate conditions.
In this study, modelling was performed using the LCA software Sima Pro 7.1.8 [29] which depends on the incorporated lifecycle inventory database of Eco- Indicator 95 [30] covering a variety of agricultural procedures and impacts. SimaPro is a tool that helps to analyze and monitor the sustainability performance data of the system under study. The software can be used for a variety of applications, such as sustainability reporting, carbon and water footprinting, product design, generating environmental product declarations as well as determining key performance indicators.
2.2. System Boundaries
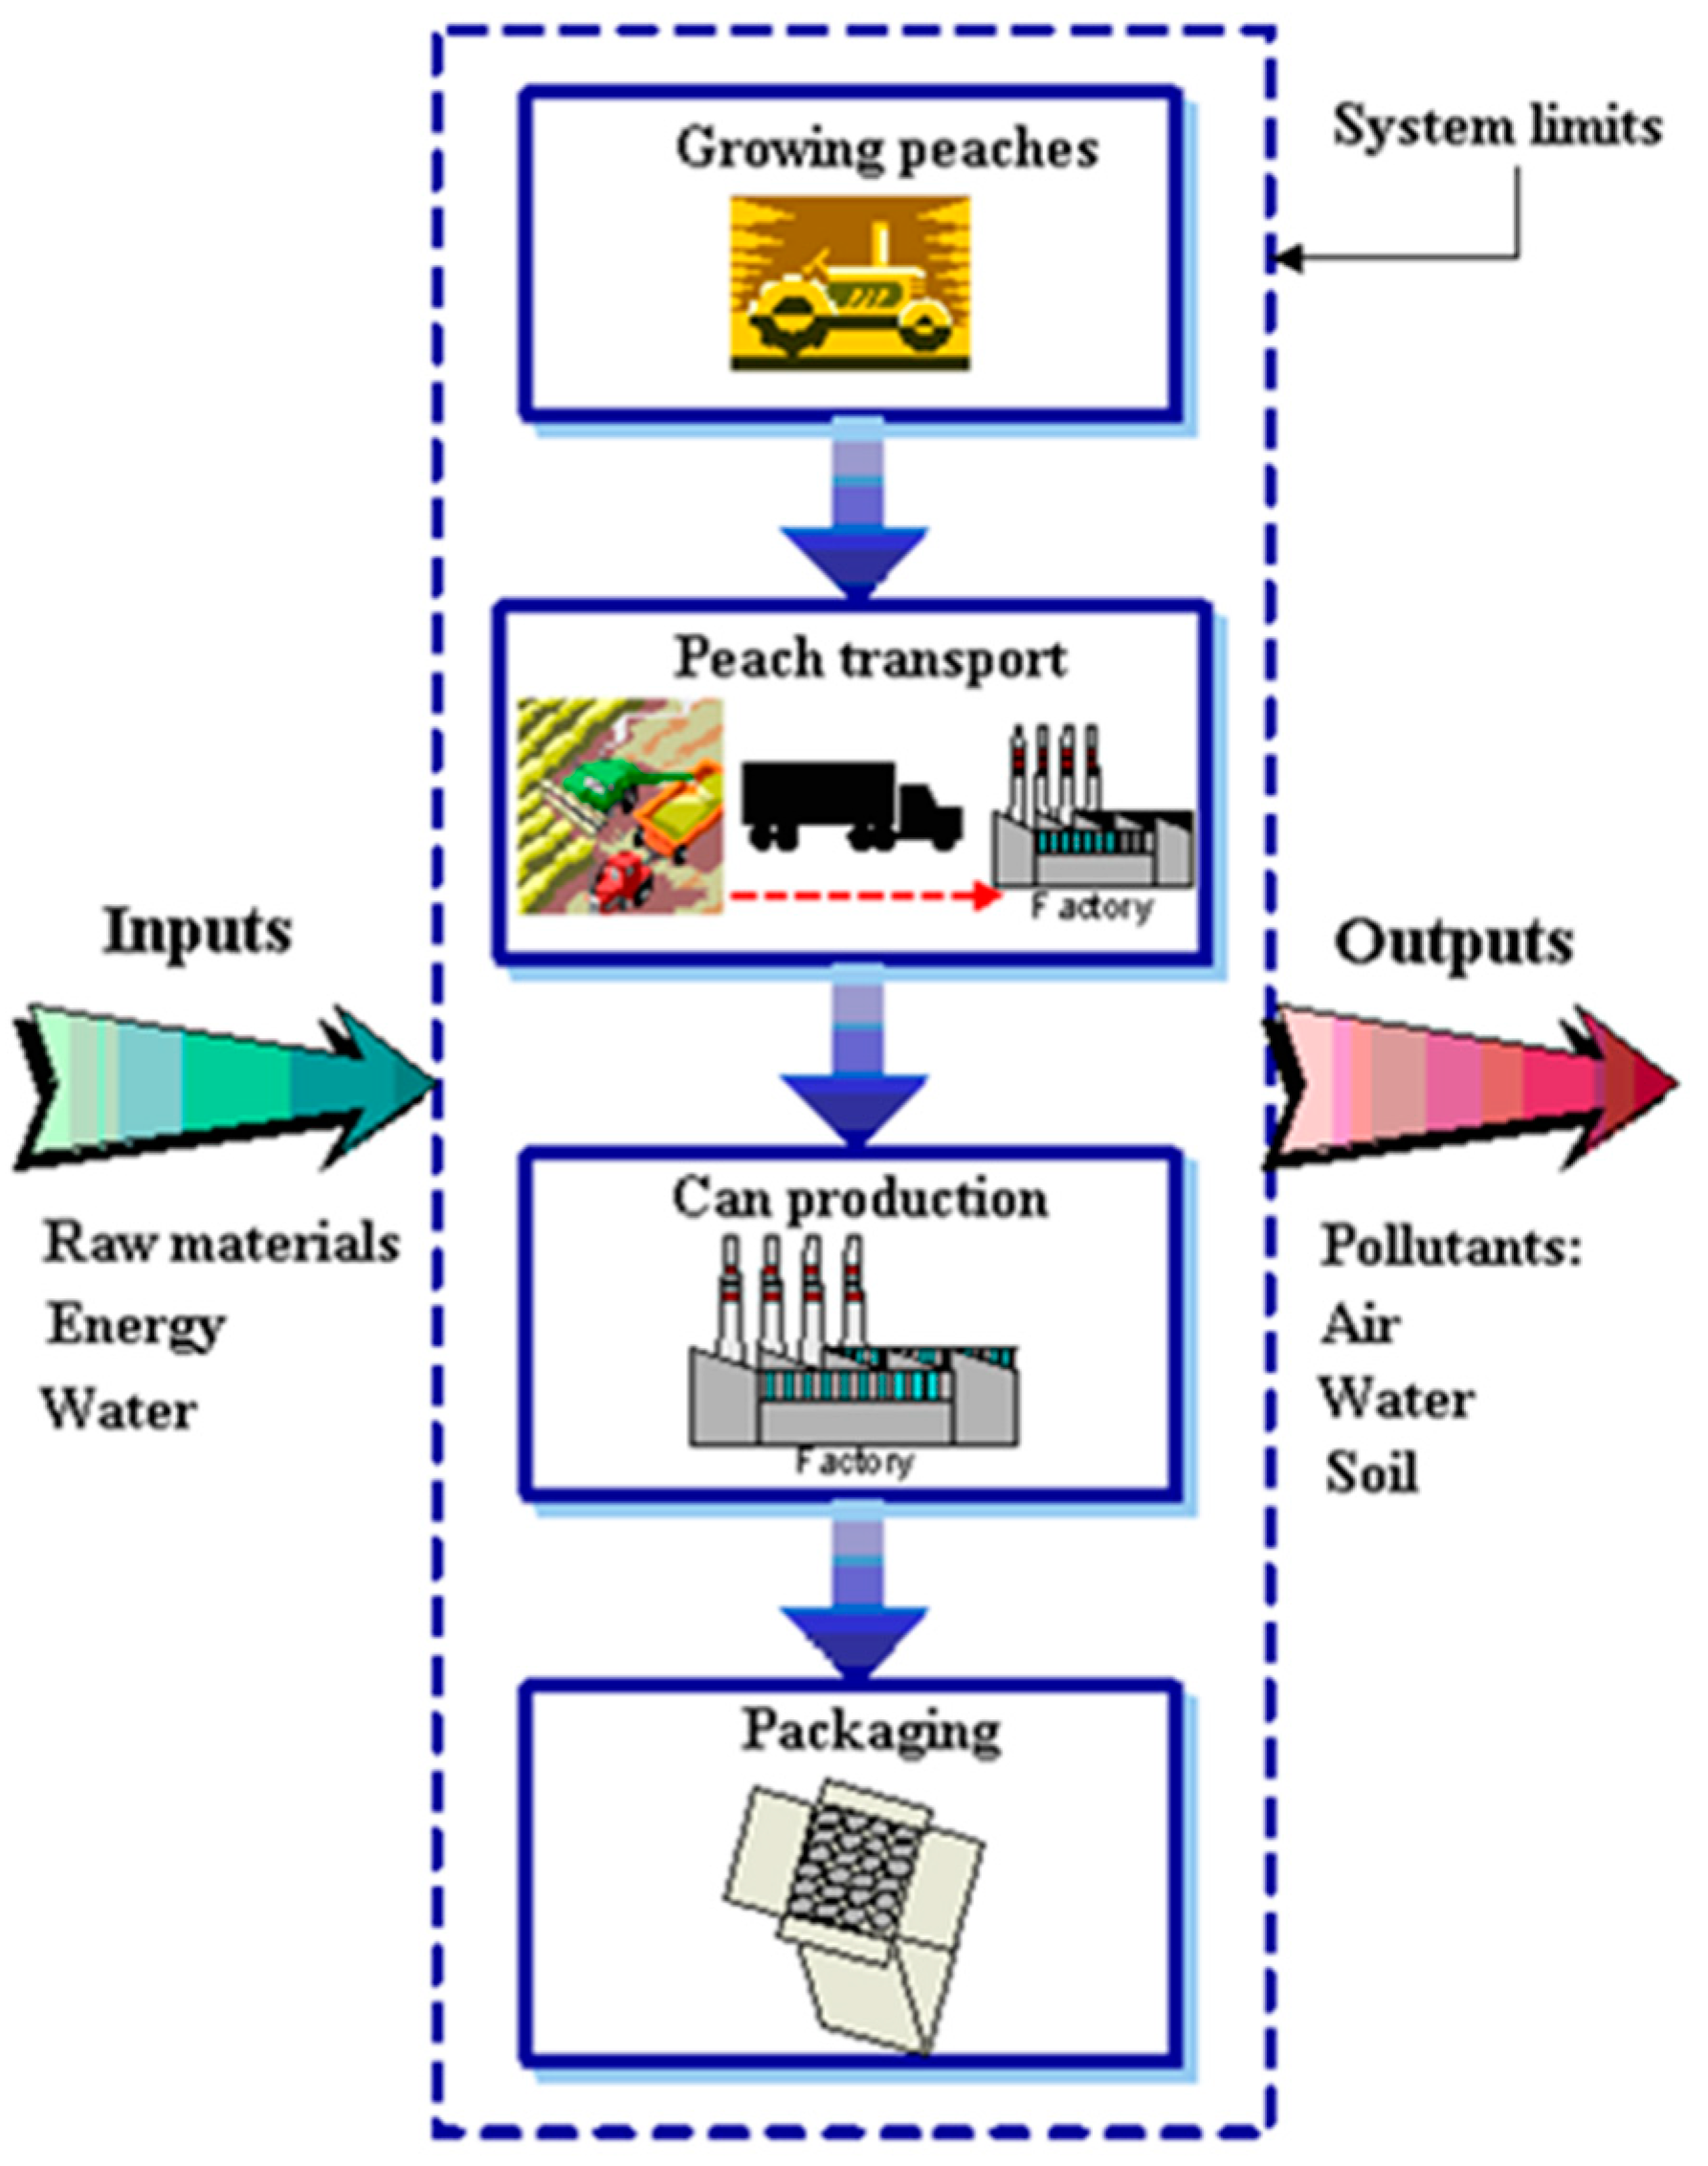
Figure 1 illustrates the boundaries of the system analyzed and the stages considered. The study considers the entire production cycle, including the following stages: cultivation of peaches, peach transportation as well as production of can and packaging.
In order to calculate the environmental impacts related to each stage, it is important to know the inputs involved. The inputs to the system under study include raw materials, energy as well as water; whereas the outputs of the system include air emissions as well as solid and liquid waste. The orchard has a planting frame of 4 × 5 m, the plot is designed with 20 rows of 20 trees (400 trees/10,000 m2). The emitted pollutants of the system are estimated for the production of one paper box, which contains 24 cans of peach compotes. Air emissions as well as water and soil pollutants resulting from the input material are adapted from Ecoivent database [31] available in SimaPro 7.1.8 [29]. Emission coefficients are applied according to previous studies [14,32,33,34].
2.2.1. Cultivation
The stage of cultivation includes the following tasks: soil preparation and plantation, fertilization plus irrigation (fertigation) and harvest. The nursery stage is excluded, mainly due to the lack of reliable data regarding this phase of fruit-growing. Soil preparation, plantation tasks, agrochemicals dosage and weed moving are performed mechanically with tractors. Harvesting is carried out manually using an elevation platform to collect the fruit and a tractor to transport the fruit to the storehouse. Fertilizer dosage is applied through the irrigation system with electric pumps. Pruning was performed manually (wood was crushed and incorporated into the soil). For all these tasks, the following inputs are considered: production of fertilizers and their application to the field, machinery manufacture and implements used with their transport to the orchard, water use, energy use (from irrigation pumps and input manufacturing). Machinery production emissions and diesel consumed for machinery operation are also taken from the Ecoinvent database v.3.0 [31].
2.2.2. Transportation
The fruits are delivered to the peach processing plants by lorries and are usually placed in crates, boxes or small punnets depending on their susceptibility to damage. This distance from the orchard to the plant does not exceed 170 km. Taking into account that the vehicles are performing also the return trip (from the plant to the orchard), out of the 340 km, only 50% of the distance is covered by full load (as the vehicle is empty at the return trip).
2.2.3. Peach Compote Production in the Plant
The canned peach production includes the following processes: factory reception, washing, cutting in halves and removing the kernels, peeling (removal of residual chemicals), washing, sorting, cup-up, cup-down, filling with fruit, addition of syrup, degassing, closing, pasteurizing, cooling pelletizing and labeling.
Once peaches are introduced in the production lines, they are immersed into high capacity holding tanks filled with warm water (20–30 °C) for 10–15 min. This processing step aims at removing foreign materials, such as leaves, insects, debris etc. The washed fruits are then cut in halves using cutting machines, while the kernels are being simultaneously removed. Peaches may be peeled by hand, as well as by chemical or mechanical methods. The most commonly employed method for peeling is the immersion of fruits in an alkaline solution (chemical method), using sodium or potassium hydroxide, at 95 °C for 4–5 min. A visual inspection follows, so as to ensure that any remaining skin from the fruit, has been removed. Following peeling, the fruits are washed, so as to remove any residual chemicals from the flesh. Usually, the washing process is carried out at 25 °C for 1 min. The washed fruits are then sorted according to size. This is followed by cup-up and cup-down, in order to remove any residual kernels and improve quality of the product. Fruits that are undersized or damaged are rejected and destined for other types of products, such as peach puree. The cans are then filled with the peeled peach halves with a filling machine.
The syrup is prepared by dissolving sugar in water and maintaining the temperature of the resulting solution at 65 °C prior filling. The concentration of the solution, however, depends on the cultivar used for peach canning. Typically, cultivars with high soluble and total solids require less sugar to sweeten the product to the desired level [34]. The fruits are covered with syrup using a vacuum syruping machine and the mixture (peach halves and syrup) is subjected to degassing in order to remove air, which aims at reducing microbial growth and, therefore, extending the shelf life of the final product [35].
The filled cans are then closed by placing a lid on top of each can and sealing it to the body (double seam formation). Then, the product is pasteurized until the temperature at the center reaches 85 °C and cooled down at room temperature. It is noted that after cooling, the cans are stored at a cool and dry place, so as to decrease the corrosion rate of the box as well as the risk of contamination by thermophilic bacteria. The final product is being held in a dry environment for 3 weeks, which allows the contents of the can to reach equilibrium. Can labelling takes place immediately after placing an order. Labeled cans are packed in a paper box, which is usually made of corrugated carton—weighting more than 250 gr/m2. Finally, the labeled cans that have been packaged in carton boxes are packed on pallets—usually wrapped with stretch film, so as to stabilize them.
2.3. Inventory Analysis
Detailed analysis of the energy inputs and emission outputs of the system under study is presented in Figure 2, which illustrates the overall results for the production of 1 kg paper box containing 24 cans of peach compotes. Table 1, Table 2 and Table 3 present the inventory considered in the study for each stage—as this is described in Section 2.2. Data were obtained directly from Greek fruit companies, retail companies and other agents involved. It covers a year of real production of peach production and consumption.
2.3.1. Cultivation
In order to produce a paper box, which contains 24 cans of peach compotes, 11.5 kg of peaches are required. In an area of 1000 m2 about 40 peach trees are planted. This will result in about 3000 kg peaches. Therefore, the 11.5 kg peaches are produced from 3.8 m2. The cultivation of an area of 1000 m2 of peaches (from which 3000 kg of peaches are produced) requires 68 liters of oil. In order to fill a paper box with 24 cans of peach compotes, 11.5 kg peaches are required. Thus, for the cultivation of the above quantity, 0.26 liters of oil are consumed.
Emissions from the usage of agricultural machinery are calculated using the COPERT database [36] and taken into consideration that diesel vehicles run with an average speed of 10 km/h and weigh more than 3.5 t. The distance covered by the agricultural machine is calculated by taking into account that the distance between planting lines is 5 m and that the machine covers two lines each time. So, for 1000 m2 (1000 m2 = (31.62 × 31.62) m2) the agricultural machine covers almost 120 m. From 1000 m2, 3000 kg of peaches are produced. Therefore, the production of 11.5 kg peaches covers a distance of 0.46 m.
2.3.2. Transportation
In regards to the transportation of peaches, these are carried by 3.5 t trucks. The capacity of the trucks was chosen considering the most similar options from the database. The transport distance and fuel efficiency are set to 20 km and 1.5 km/L respectively. This distance refers to the transfer of 14,400 kg peaches. In order to produce a paper box with 24 cans of peach compotes, a quantity of 11.5 kg peaches is required. Calculations of emissions are based on distances covered by trucks with and without load.
2.3.3. Peach Compote Production in the Plant—Tin Can Production and Packaging
The plant operates seasonally from the period of July till October. Canning of peach compotes takes place during the period of July–September (40 days). During this period, the unit operates 24 h per day in three shifts. Table 1 shows the inputs required to produce of one carton box containing 24 cans of peaches. The amount of electricity consumption for the plant’s operation during the period of July–October is 966,000 kWh per month; whereas the quantity of consumed steam, coming from the boiler (production capacity of 48,000 kg/h) is 36,000 kg/h.
In regards to the functional unit, it is noted that for the production of 1 carton box of 24 cans, 0.85 kg of fuel oil is required for the combustion process and 0.95 kWh of electricity. Table 2 lists the produced air emissions from the combustion process during plant operation.
The energy requirements for the production of one can, used as packaging material, are listed in Table 3. The calculation takes into consideration the following processes: production of the final shaping of the metal box, transportation of raw materials, production—shaping of metal box as well as transportation of empty metal box to the canning facilities. The amount of electricity consumption for the production of a can of 1 kg is 0.00058 kWh.
Emissions from the production of tinplate cans result from the consumption of natural gas (used to produce steam) and the electricity consumption (used for the operation of production line machinery). Emissions from natural gas consumption are calculated from SAEFL report [38]. Taking into consideration the fact that one paper box contains 24 cans of peach compotes, an amount of 0.0051 m3 is required for the production of 24 tinplate cans.
For the packaging of 24 cans, a paper box of 420 gr (403 cm long, 240 cm height, 303 cm wide) is required. The type of carton belongs to the GD/GT (duplex/triplex board). Based on the type of carton, emissions are calculated from the SAEFL report [38].
2.4. Impact Assessment
Based on the stages of the system described above, the procedures presented in Figure 1 are quantified and the environmental impacts based on the Eco Indicator 95 database [31] are estimated. Life cycle impact assessment (LCIA) is conducted in order to connect each inventory analysis result to the corresponding environmental impact. To achieve that, ISO 14042 defines the following steps: selection and definition of the impact categories of interest, assignment of the inventory data to the chosen impact categories (classification), and calculation of impact category indicators using characterization factors (characterization) [22,23,24,25,26,27,28]. The calculation of total environmental impact takes into consideration the impact from all the aforementioned stages. Based on the methodology of LCA, the stages of normalization and valuation follow. The emissions are being converted with the use of weighting factors (normalization and valuation factors) to scores that can easily be aggregated and compared and notice their contribution to various environmental impacts. Each type of waste has a different impact contribution on the environment. The equation used is:
Total assessment = Σi (Total Emissioni × Normalization factor × Valuation factor)
The normalization factors of global warming, acidification potential, eutrophication potential, PMF and POF impact categories for Greece are considered 0.000742; 0.00888; 0.0262; 0.0106 and 0.0507 respectively [35]. Weighting factors for the above-mentioned impact categories are 2.5; 10; 5; 5 and 2.5 respectively [35]. The impacts are normalized and evaluated based on these weighting factors. At the final step, the valuation scores are added up to give the total impact of the system under study.
3. Results
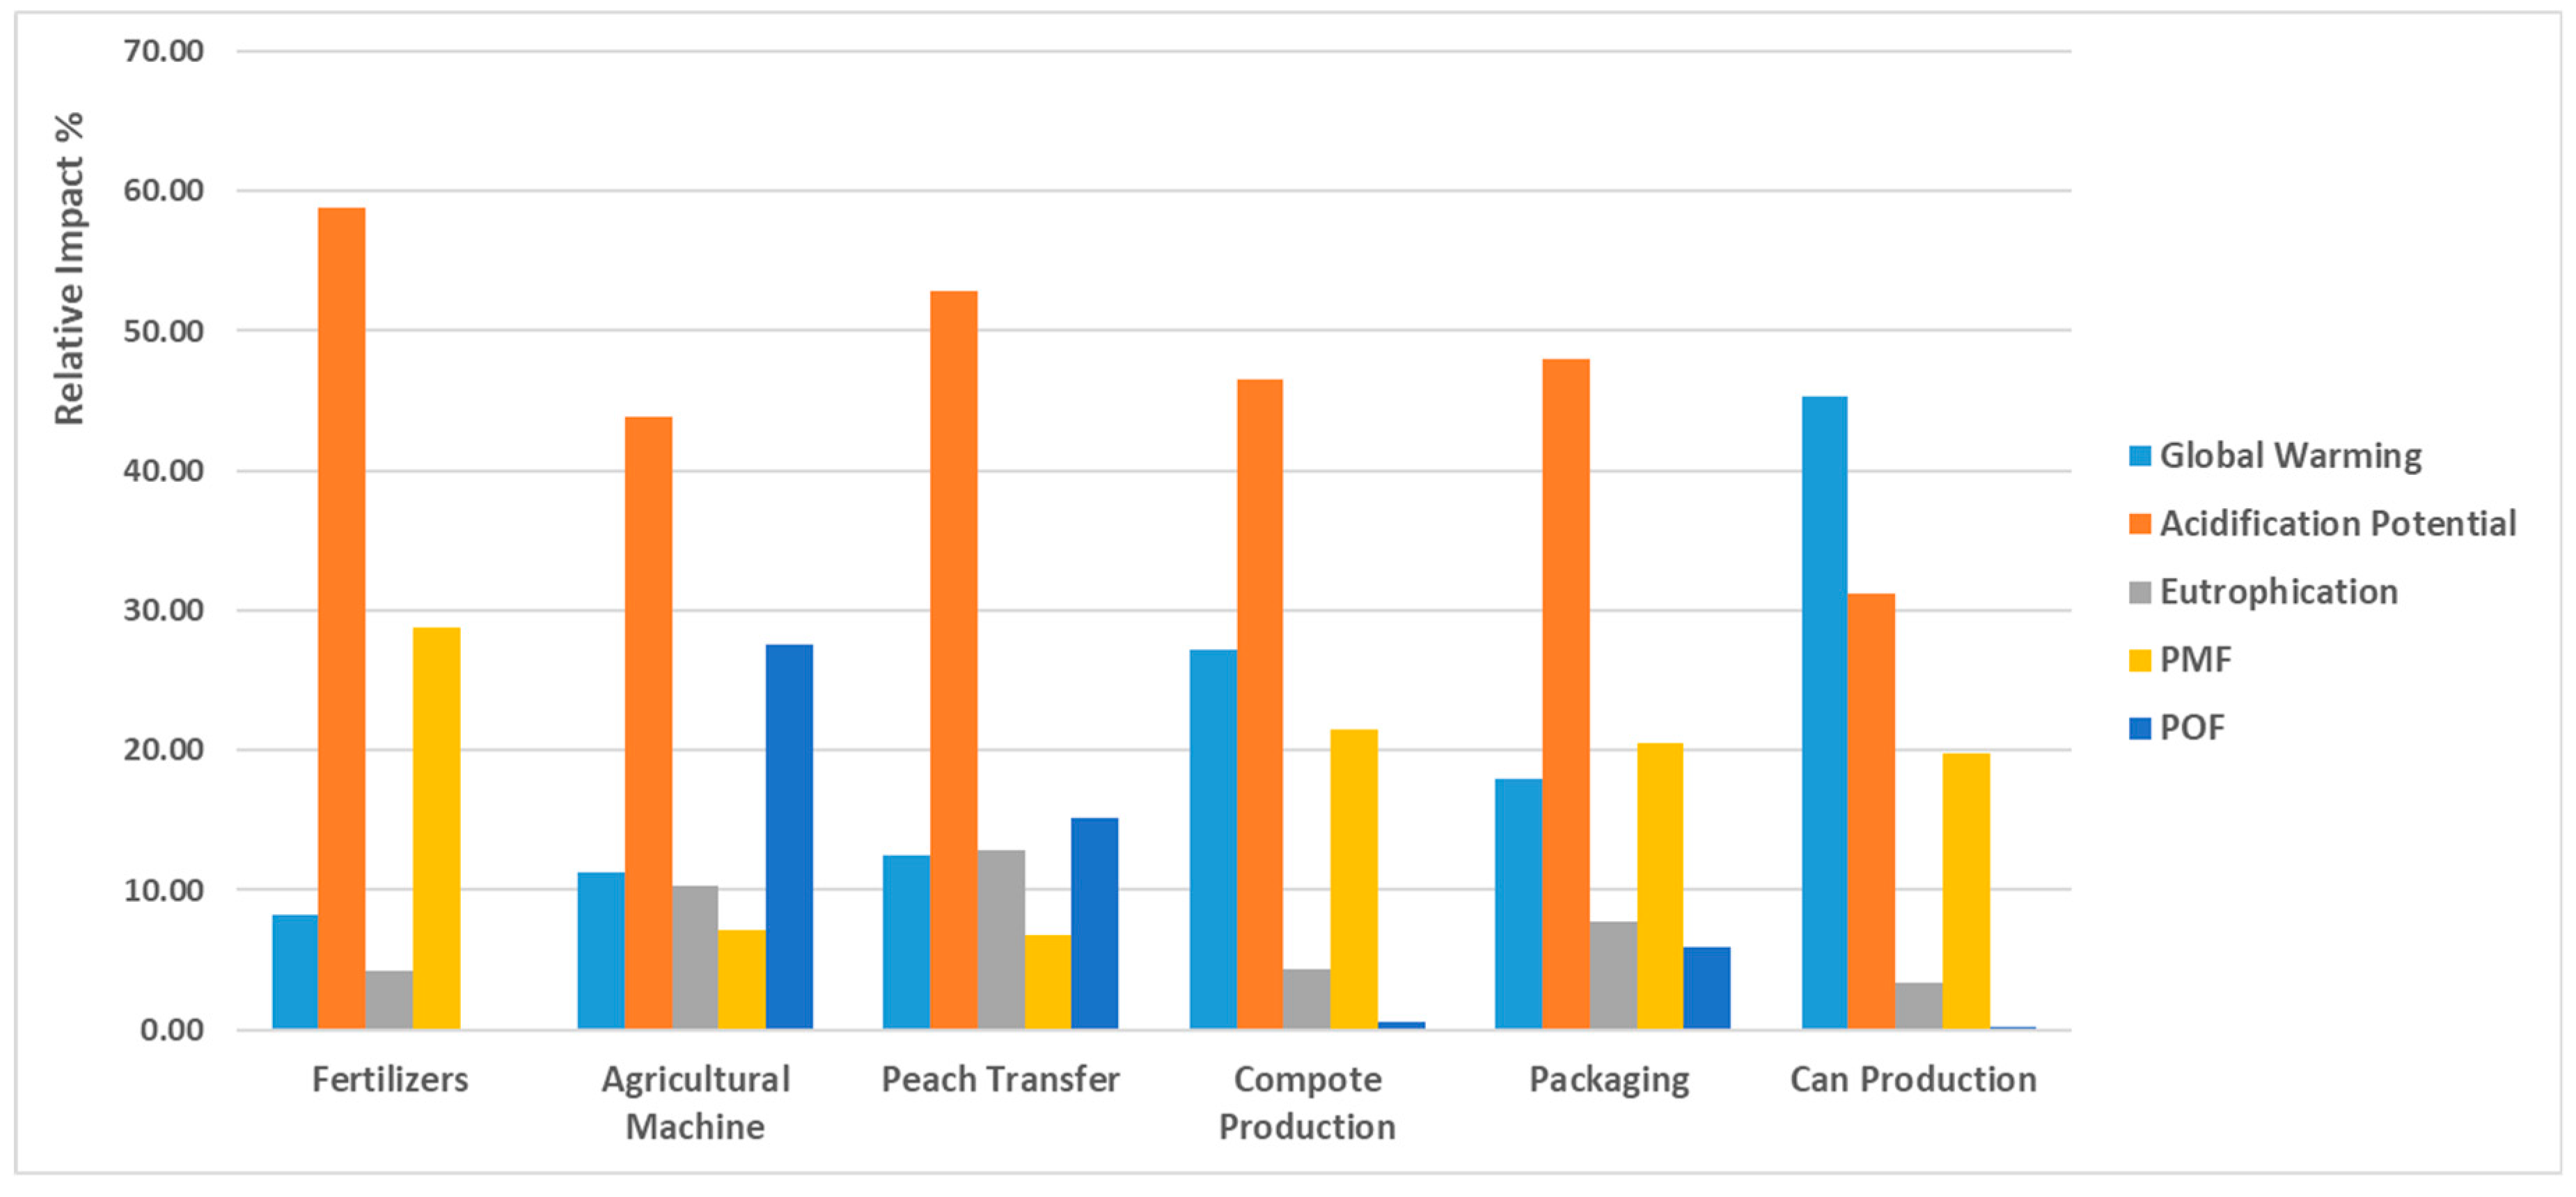
Based on the abovementioned, Figure 3, which illustrates the results of LCIA, suggests that the emissions generated by cultivation activities are mainly driven by the use of fertilizers, which contribute to the AP (58.77%) and PMF (28.74%) as well as by the use of agricultural machines, which contribute to the AP (43.84%) and POF (27.54%); while peach transfer to the plant contributes significantly to AP (52.79%). Nitrogenous emissions resulting from the application of fertilizers on orchards lead to the majority of burdens for acidification in the cultivation stage (58.77% and 43.84% respectively). Specifically, NH3 emissions to air contribute most substantially to acidification potential; whereas the volatilization of NO and NH3 to air contribute to particulate matter formation. In addition, the production of N-fertilizers and associated N2O emissions contribute to GWP (8.88% for fertilizers). It should also be mentioned that due to the low fuel consumption of the agricultural machinery the impacts to GWP come up to 11.22%.
Fuel use in the plant for the production of peach compote contributes most significantly to AP (46.51%), GW (27.19%), and PMF (21.46%). These are mainly attributed to the combustion of fuel oil as well as electricity consumption in the plant emitting CO2 and NOx as well as of SPM and SOx. Concerning the production of tinplate cans, the categories with the highest environmental impact were GW (45.35%), AP (31.17%) and PMF (19.83%) due to the emissions of greenhouse gases, such as carbon dioxide, nitrogen oxides and methane (CO2, NOx, CH4), and heavy metals in the can production. The environmental burdens caused by the production of a paper packaging box are driven mainly by the AP (48.01%), PMF (20.45%) and GW (17.95%).
Total emissions refer to the equivalent emissions. Figure 4 illustrates the quantitative effect of these emissions on the environment for the system under investigation. It is noted that the global environmental impacts after weighting need to be interpreted with caution. The environmental impacts analyzed include the categories of global warming acidification potential, eutrophication potential, particulate matter formation as well as this of photochemical oxidation formation. The results of the LCA for the system under study indicate that 48.41%, 25% and 20.98% of the environmental burdens are attributed to the acidification potential, global warming potential and particular matter formation impact categories, respectively. The eutrophication impact potential and photochemical oxidation formation impact categories accounted for 5.38% and 0.23% respectively.
Regarding GWP, contribution analysis showed that tinplate can production is the most impactful phase for the system under study, accounting for 39% of the impacts (Figure 5). The phase of tinplate can production and peach compote production allocated the highest share of the GWP, due to the big quantities of fossil fuels required for manufacture/production operations.
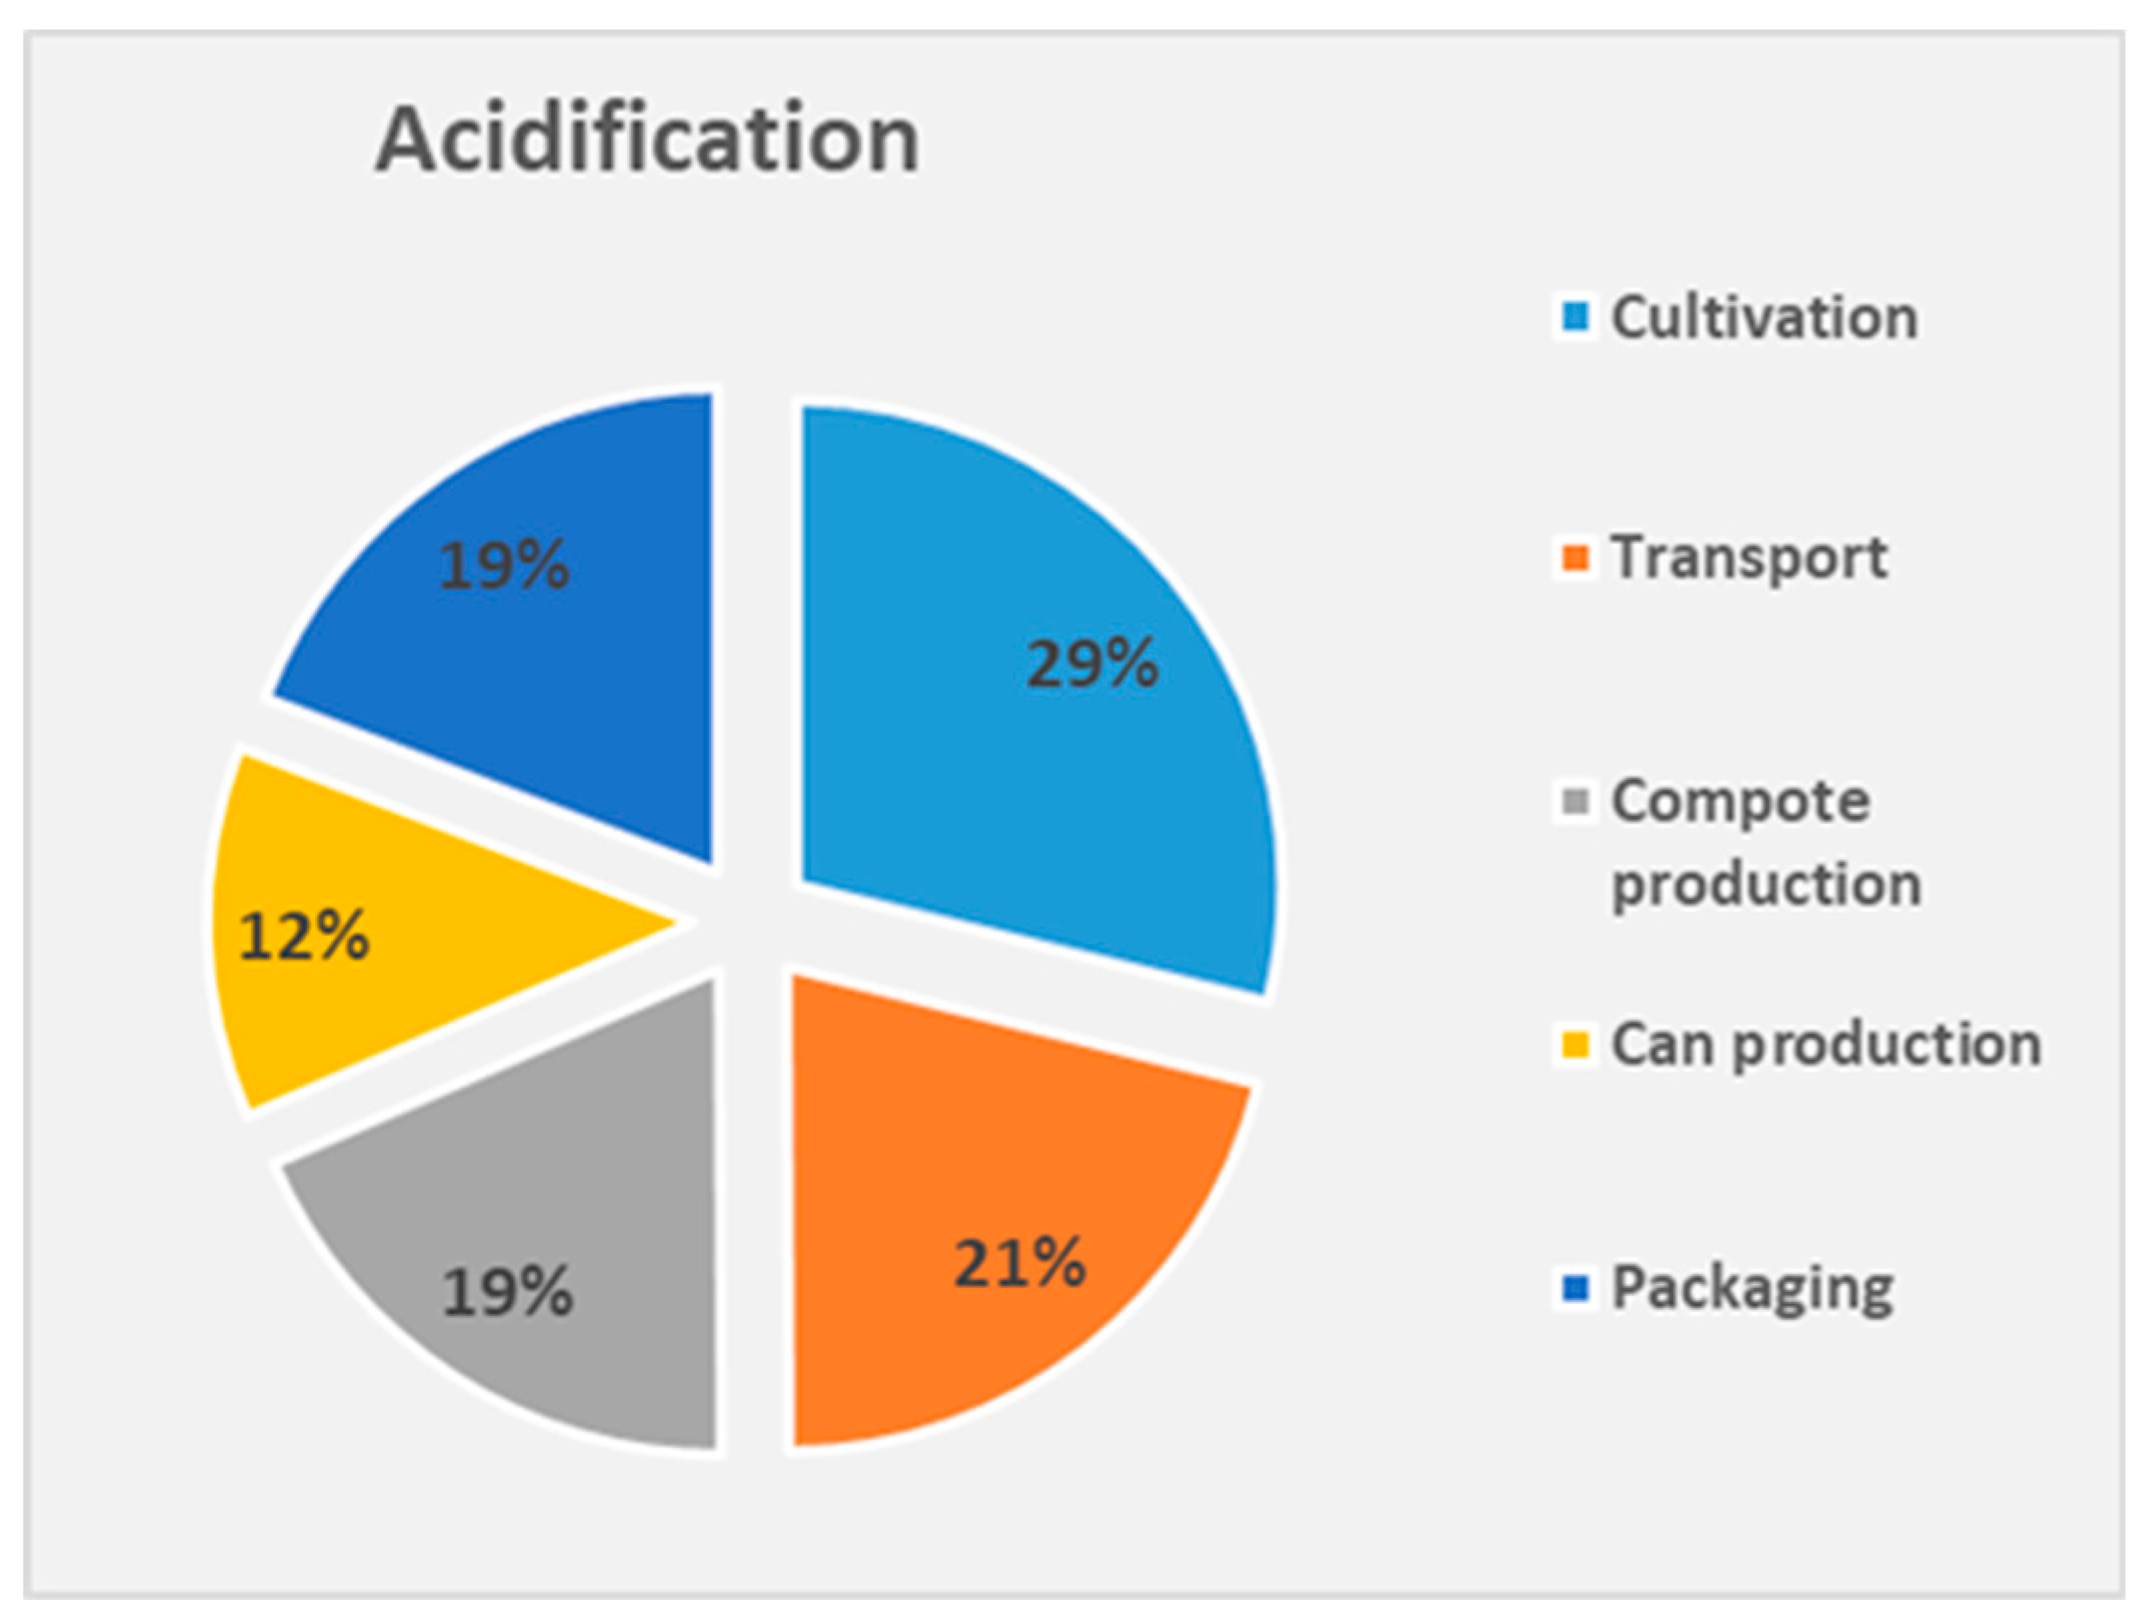
The use of fertilizers as well as the use of agricultural machines is responsible for approximately 33% of the estimated impacts for AP (Figure 6). This is attributed primarily to NH3 and NOx emissions caused during production of mineral fertilizers, as well as to SO2 emissions derived from fossil fuel combustion during transportation of raw materials to tree orchards. The second highest contributor to AP is the transportation of peaches to the plant, which accounted for 21%. Production of peach compotes as well as production of packaging paper represent significant burdens for the AP impact category, contributing 19% and 19% respectively. The reason lies both on the crude oil combustion to produce steam and on electricity consumption for operation of machinery in the production line. In both cases NOx and SOx emissions observed are clearly contributing to acidification. Emissions from the manufacturing process of paper packaging are significant, mainly due to the emissions of NOx, and also to some extent due to SO2 released to air contributing by this way to AP at a percentage of 19%.
Peach transfer to factory contributes to EP at a rate of 33% (Figure 7). This is attributed to the fact that the diesel trucks emit significant amounts of NOx (NO and NO2). A further noteworthy stage is this of cultivation, representing significant burdens for the EP impact category, which contributes with a percentage of 35%. In addition, NOx emissions from fuel oil combustion in the plant—for the production of packaging paper—are responsible for 20% of the eutrophication potential.
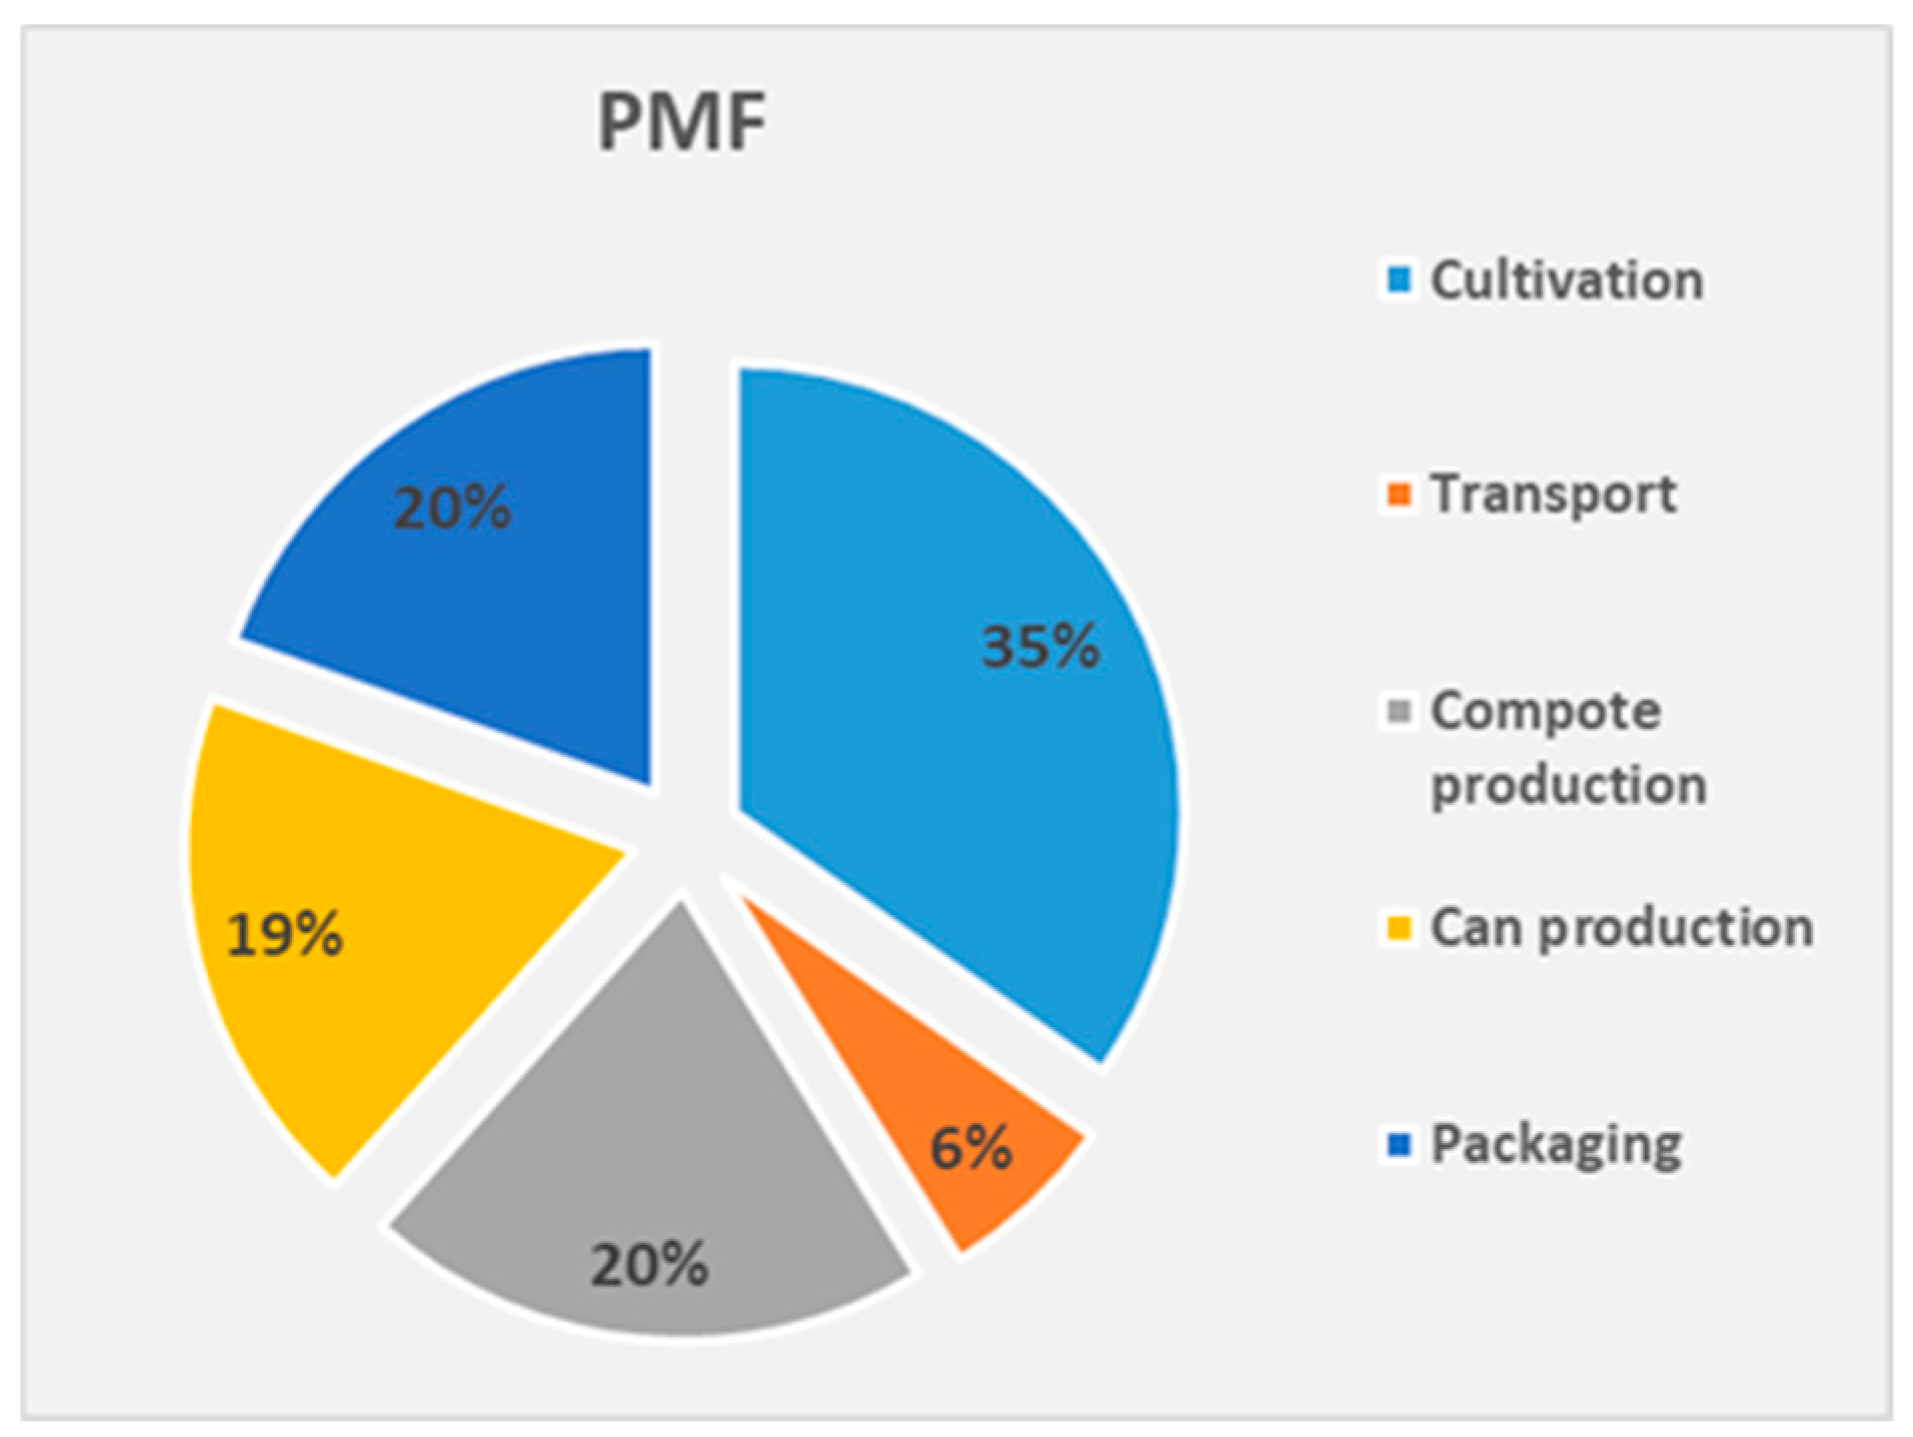
Figure 8 illustrates that the stage of cultivation represents a significant burden to PMF impact category, contributing 33%. Emissions of SPM and SOx coming from fuel combustion in plant for the production of peach compotes, tinplate cans and paper packaging represent significant burdens to PMF impact category, contributing 20%, 19% and 20% respectively. The remaining contribution of transportation of peaches to the mill is of lower extent (approximately 6%).
The stage of cultivation (Figure 9), as described in previous sections, represents a significant burden for the POF impact category, contributing 56%, followed by the peach transfer to the mill (31%). Production of paper packaging contributes to the POF impact category by 12%. This is attributed to NOx and NMVOC (Non-Methane Volatile Organic Compounds, VOCs other than methane). Finally, the contribution of tinplate can production as well as of peach compote production are of a lower extent (1%).
4. Conclusions
In this study, the environmental impact categories of peach compote production in Greece was assessed in order to identify the most significant impacts and to suggest the ways to reduce the environmental impacts related to the production system. The application of the LCA methodology in the Greek peach compote industry presented in the present study has resulted in useful conclusions:
- The impact category with the higher environmental impact (48.41%) is the Acidification Potential (AP). In this category, the main contributors are the SO2 and NOx emissions resulting from the cultivation of peaches. The use of fertilizers and agricultural machines are crucial impact elements to this impact category.
- The impact category with the second highest environmental impact (25%) is this of Global Warming (GW). In this category, the main contributors are the CO2 emissions. This is attributed mainly to the use of fossil energy sources during the tinplate can production.
- The impact category that follows with a percentage of 20.98% is of Photochemical Oxidant Formation (POF). This category is associated with NOx and NMVOC emissions during the stage of paper packaging at the plant.
The results of this study can be used to guide the selection of agricultural as well as energy inputs with regard to identifying options for mitigating environmental impacts in the industry of peach canning. In addition, the results may be useful to identify the stages in the process of peach production—compote production—canning—packaging with higher impact and obtaining more environmentally friendly practices. Based on the abovementioned, it can be deduced that it is essential to encourage farmers to choose fertilizers of low environmental impact and use more sustainable agriculture techniques. As per Michos et al. [39], organic farming can significantly reduce the greenhouse emissions. In order to reduce the environmental burdens caused by the emissions from the peach compote plant, the insulation of piping, where heating or cooling is involved could reduce steam consumption and therefore energy usage. Improving heating systems and utilization of renewable energy such as solar energy should be considered to reduce required crude oil usage at the plant. It is noted that currently canned peach production is achieved by peeling with sodium hydroxide solution at 95 °C. However, peeling by steam, which is an alternative peeling process, may have great benefits regarding water consumption and energy usage. Peeling by steaming instead of chemical peeling automatically minimizes the amount of water during the second washing for removing any residual chemicals, having great benefits regarding water consumption. Moreover, the condensed steam after peeling may be used for preheating the syrup, prior to filling the cans, making the whole process energy efficient.
In addition, the kernels formed during the cutting in halves process can also be used for the production of energy, thus covering the energy requirements of other products that are produced on a small scale (e.g., peach puree and peach juice). To be more specific, peach kernels may be exploited by the industries for energy production (biomass boilers) to cover the energy requirements of other small production lines, for products such as peach puree. Finally, the wastes (peels) that derive after peeling can be used for animal feed.
Taken into consideration the fact that the priority of EU policies is the production of agricultural products that are characterized by quality and reduced environmental damage in conjunction with the creation of high competition in international markets, it is deduced that the use of the LCA technique in the European agriculture and food processing sectors is of great significance. In this context, effective dissemination of the LCA results of this study is paramount, producing and communicating improvement possibilities in ways that are relevant to producers, industries, and governments they affect.
Author Contributions
Conceptualization, C.K.; software, C.K.; formal analysis, E.N.; investigation, E.N.; resources, C.K.; writing—original draft preparation, E.N.
Funding
This research received no external funding.
Conflicts of Interest
The authors declare no conflict of interest.
Abbreviations
| SPM | Suspended Particulate Matter |
| VOC | Volatile Organic Compound |
| NOx | Nitrogen Oxides |
| N2O | Nitrous Oxide |
| CO2 | Carbon Dioxide |
| CO | Carbon Monoxide |
| SO2 | Sulfur Dioxide |
| SOx | Sulfur Oxides |
| CH4 | Methane |
| NH3 | Ammonia |
| CH4 | Methane |
| PM | Particulate Matter |
| NMVOC | Non Methane Volatile Organic Compounds |
References
- Sanye-Mengual, E.; Ceron-Palma, I.; Oliver-Sola, J.; Montero, J.; Rieradevall, J. Integrating horticulture into cities: A guide for assessing the implementation potential of Rooftop Greenhouses (RTGs) in industrial and logistics parks. J. Urban Technol. 2015, 22, 87–111. [Google Scholar] [CrossRef]
- Smith, P.D.; Martino, Z.; Cai, D.; Gwary, H.; Janzen, P.; Kumar, B.; McCarl, S.; Ogle, F.; O’Mara, C.; Rice, B.; et al. Agriculture. In Climate Change 2007: Mitigation. Contribution of Working Group III to the Fourth Assessment Report of the Intergovernmental Panel on Climate Change; Metz, B., Davidson, O.R., Bosch, P.R., Dave, R., Meyer, L.A., Eds.; Cambridge University Press: Cambridge, UK; New York, NY, USA, 2007. [Google Scholar]
- 2012. Available online: https://ec.europa.eu/agriculture/statistics/rural-development_en (accessed on 25 October 2018).
- Food and Agricultural Organisation of the United Nations e Statistics Division (FAOSTAT). Available online: http://faostat3.fao.org/faostat-gateway/go/to/home/E (accessed on 20 August 2018).
- USDA Foreign Agricultural Service, EU-28 Stone Fruit—Annual 2017, Report Number: SP 1727. Available online: https://www.fas.usda.gov/ (accessed on 20 August 2018).
- Global Trade Atlas. Available online: https://www.gtis.com/gta/ (accessed on 1 November 2018).
- Finnveden, G.; Moberg, Å. Environmental systems analysis tools—An overview. J. Clean. Prod. 2005, 13, 1165–1173. [Google Scholar] [CrossRef]
- Milà i Canals, L. Contributions to LCA Methodology for Agricultural Systems 2; Universitat Autònoma de Barcelona: Barcelona, Spain, 2003. [Google Scholar]
- Meier, M.S.; Stoessel, F.; Jungbluth, N.; Juraske, R.; Schader, C.; Stolze, M. Environmental impacts of organic and conventional agricultural products—Are the differences captured by life cycle assessment? J. Environ. Manag. 2015, 149, 193–208. [Google Scholar] [CrossRef] [PubMed]
- Vazquez-Rowe, I.; Villanueva-Rey, P.; Moreira, M.T.; Feijoo, G. Environmental analysis of Ribeiro wine from a timeline perspective: Harvest year matters when reporting environmental impacts. J. Environ. Manag. 2012, 98, 73–83. [Google Scholar] [CrossRef] [PubMed]
- Pieragostini, C.; Aguirre, P.; Mussati, M. Life cycle assessment of corn-based ethanol production in Argentina. Sci. Total Environ. 2014, 472, 212–225. [Google Scholar] [CrossRef] [PubMed]
- Boustead, I. The Milk Bottle; Open University Press: Milton Keynes, UK, 1972. [Google Scholar]
- Hannon, B. A Study of the Beverage Industry; System Energy and Recycling, Center for Advanced Computation, University of Illinois: Urbana, IL, USA, 1972. [Google Scholar]
- Sundstrom, G. Investigation of the Energy Requirements from Raw Materials to Garbage Treatment for 4 Swedish Beer Packaging Alternatives; Rigello Park AB: Sweden, 1973. [Google Scholar]
- Brentrup, F.; Küsters, J.; Kuhlmann, H.; Lammel, J. Environmental impact assessment of agricultural production systems using the life cycle assessment methodology: I. Theoretical concept of a LCA method tailored to crop production. Eur. J. Agron. 2004, 20, 247–264. [Google Scholar] [CrossRef]
- Fallahpour, F.; Aminghafouri, A.; Ghalegolab-Behbahani, A.; Bannayan, M. The environmental impact assessment of wheat and barley production by using life cycle assessment (LCA) methodology. Environ. Dev. Sustain. 2012, 14, 979–992. [Google Scholar] [CrossRef]
- Vinyes, E.; Gasol, C.; Asin, L.; Alegre, S.; Muñoz, P. Life cycle assessment of multiyear peach production. J. Clean. Prod. 2015, 104, 68–79. [Google Scholar] [CrossRef]
- Ingrao, C.; Matarazzo, A.; Tricase, C.; Clasadonte, M.T.; Huisingh, D. Life cycle assessment for highlighting environmental hotspots in Sicilian peach production systems. J. Clean. Prod. 2015, 92, 109–120. [Google Scholar] [CrossRef]
- De Menna, F.; Vittuari, M.; Molari, G. Impact evaluation of integrated food-bioenergy systems: A comparative LCA of peach nectar. Biomass Bioenergy 2015, 73, 48–61. [Google Scholar] [CrossRef]
- Jeswani, H.K.; Azapagic, A.; Schepelmann, P.; Ritthoff, M. Options for broadening and deepening the LCA approaches. J. Clean. Prod. 2010, 12, 120–127. [Google Scholar] [CrossRef]
- ISO 14040. Environmental Management—Life Cycle Assessment—Principles and Framework; International Organization for Standardization: Geneva, Switzerland, 1997. [Google Scholar]
- ISO 14041. Environmental Management—Life Cycle Assessment—Goal and Scope Definition and Inventory Analysis; International Organization for Standardization: Geneva, Switzerland, 1998. [Google Scholar]
- ISO 14042. Environmental Management—Life Cycle Assessment—Life Cycle Impact Assessment; International Organization for Standardization: Geneva, Switzerland, 2000. [Google Scholar]
- ISO 14043. Environmental Management—Life Cycle Assessment—Life Cycle Interpretation; International Organization for Standardization: Geneva, Switzerland, 2000. [Google Scholar]
- ISO 14044. Environmental Management Life Cycle Assessment Requirement and Guidelinesl; International Organization for Standardization: Geneva, Switzerland, 2006. [Google Scholar]
- Hellenic National Meteorological Service. Available online: http://www.emy.gr/emy/en/ (accessed on 31 October 2018).
- Hellenic Statistical Authority. Aπογραφή Πληθυσμού—Kατοικιών 2011. ΜΟΝΙΜΟΣ Πληθυσμός. 2011. Available online: http://www.statistics.gr/en/home/ (accessed on 2 November 2018).
- Hauschild, M.Z. Estimating Pesticide Emissions for LCA of Agricultural Products. In Agricultural Data for Life Cycle Assessments; Weidema, B.P., Meeusen, M.J.G., Eds.; LCANet Food: The Hague, The Netherlands, 2000; Volume 2, pp. 64–79. [Google Scholar]
- SETAC Foundation. A Technical Framework for Life Cycle Assessment; Society of Environmental Toxicology and Chemistry and SETAC Foundation for Environmental Education, Inc.: Washington, DC, USA, 1991. [Google Scholar]
- Goedkoop, M.J. The Eco-Indicator 95; Final Report; NOH Report 9523; PRe Consultants: Amersfoort, NL, USA, 1995. (In English) [Google Scholar]
- Ecoivent Database. Available online: http://www.ecoinvent.org/database/database.html (accessed on 2 October 2017).
- Goebes, M.D.; Strader, R.; Davidson, C. An ammonia emission inventory for fertilizer application in the United States. Atmos. Environ. 2003, 37, 2539–2550. [Google Scholar] [CrossRef]
- Snyder, C.S.; Bruulsema, T.W.; Jensen, T.L.; Fixen, P.E. Review of greenhouse gas emissions from crop production systems and fertilizer management effects. Agric. Environ. 2009, 133, 247–266. [Google Scholar] [CrossRef]
- Sistrunk, W.A. Peach quality. In Evaluation of Quality of Fruits and Vegetables; Pattee, H.E., Ed.; AVI Publishing Company: Westport, CT, USA, 1985; pp. 1–46. [Google Scholar]
- Joshi, V.K.; Bhutani, V.P. Peach and nectarine. In Handbook of Fruit Science and Technology; Salunkhe, D.K., Kadam, S.S., Eds.; Marcel Dekker, Inc.: New York, NY, USA, 1995; pp. 243–296. [Google Scholar]
- COPERT Database. Available online: http://emisia.com/products/copert-data (accessed on 2 October 2017).
- Karakasidis, N.G. Packaging and Environment; ION: Athens, Greece, 1999. (In Greek) [Google Scholar]
- Environmental Series No. 250/II Waste, Life Cycle Inventories for Packaging; Swiss Agency for the Environment, Forests and Landscape (SAEFL): Berne, Switzerland, 1998; Volume II.
- Michos, M.C.; Mamolos, A.P.; Menexes, G.C.; Tsatsarelis, C.A.; Tsirakoglou, V.M.; Kalburtji, K.L. Energy inputs, outputs and greenhouse gas emissions in organic, integrated and conventional peach orchards. Ecol. Indic. 2012, 13, 22–28. [Google Scholar] [CrossRef]
Figure 1.
System boundaries for the production of one paper box containing 24 cans of peach compotes.
Figure 1.
System boundaries for the production of one paper box containing 24 cans of peach compotes.

Figure 2.
Flowchart of inputs and outputs of materials and energy required for the production of one paper box containing 24 cans of peach compotes (Oil refers to Diesel Oil).
Figure 2.
Flowchart of inputs and outputs of materials and energy required for the production of one paper box containing 24 cans of peach compotes (Oil refers to Diesel Oil).

Figure 3.
Environmental Impact Assessment (EIA) of the system under study.

Figure 4.
Overall Life Cycle Assessment (LCA) results of the system under study.

Figure 5.
Impact contribution of system under study to Global Warming (GW).

Figure 6.
Impact contribution of system under study to Acidification Potential (AP).

Figure 7.
Impact contribution of system under study to Eutrophication Potential (EP).

Figure 8.
Impact contribution of system under study to Particulate Matter Formation (PMF).

Figure 9.
Impact contribution of system under study to Photochemical Oxidant Formation (POF).


Table 1.
Plant operation data for the production of 1 carton box.
| Consumption | Production | |
|---|---|---|
| Peaches | 11.5 kg | 1 carton box containing 24 cans of peaches (of 1 kg—each one) |
| Sugar | 847 gr | |
| Glucose | 2.294 kg | |
| Citric acid | Negligible quantity/selective use | |
| Caustic soda | 0.082 kg | |
| Water | 0.3984 m3 | |
| Fuel oil | 0.850 kg | |
| Electrical energy | 0.95016 kWh | |
Table 2.
Air emissions from the combustion process in the plant.
| Metric Unit | CO | NOx | PM | CO2 | SOx | NMVOC | N2O | |
|---|---|---|---|---|---|---|---|---|
| Fuel oil | kg | 2.1 × 10⁻⁴ | 6.1 × 10⁻³ | 7.5 × 10⁻⁴ | 2.7 | 8.5 × 10⁻³ | 2.8 × 10⁻⁴ | 5.2 × 10⁻⁴ |
| Electricity | kg | - | 9.9 × 10⁻⁴ | 8.9 × 10⁻⁴ | 1.3 | 1.1 × 10⁻³ | - | - |
| Total | kg | 2.1 × 10⁻⁴ | 7.0 × 10⁻³ | 1.6 × 10⁻³ | 4.0 | 9.6 × 10⁻³ | 2.8 × 10⁻⁴ | 5.2 × 10⁻⁴ |
Table 3.
Energy requirements for the production of one can in Greece [37].
Table 3.
Energy requirements for the production of one can in Greece [37].
| Process | Energy Consumption (MJ/100 L) | Energy Consumption (%) |
|---|---|---|
| 1 Production of raw materials | 1135 | 63.9 |
| 2 Transportation of raw materials | 35 | 2 |
| 3 Production of metal box | 545 | 30.7 |
| 4 Transportation to cannery | 60 | 3.4 |
| Total | 1775 | 100 |
© 2018 by the authors. Licensee MDPI, Basel, Switzerland. This article is an open access article distributed under the terms and conditions of the Creative Commons Attribution (CC BY) license (http://creativecommons.org/licenses/by/4.0/).
Share and Cite
MDPI and ACS Style
Nanaki, E.A.; Koroneos, C.J. Sustainable Peach Compote Production: A Life Cycle Thinking Approach. Sustainability 2018, 10, 4229. https://doi.org/10.3390/su10114229
AMA Style
Nanaki EA, Koroneos CJ. Sustainable Peach Compote Production: A Life Cycle Thinking Approach. Sustainability. 2018; 10(11):4229. https://doi.org/10.3390/su10114229
Chicago/Turabian StyleNanaki, Evanthia A., and Christopher J. Koroneos. 2018. "Sustainable Peach Compote Production: A Life Cycle Thinking Approach" Sustainability 10, no. 11: 4229. https://doi.org/10.3390/su10114229
Note that from the first issue of 2016, this journal uses article numbers instead of page numbers. See further details here.