Abstract
The livestock sector can be a major contributor to the mitigation of greenhouse gas (GHG) emissions. Within the sector, beef production produces the largest proportion of the livestock sector’s direct emissions. The objective of this study was to assess the on-farm GHG emissions in semi-arid rangelands in Argentina and to identify the relationship between emissions and current farm management practices. A survey recorded detailed information on farm management and characteristics. Assessments of GHG emissions were based on the Intergovernmental Panel on Climate Change (IPCC) Tier 2 protocols. The relationship between farm management and GHG emissions were identified using general linear models. Cluster analysis was used to identify groups of farms that differed from others in emissions and farm characteristics. Emissions per product sold were low on farms that had improved livestock care management, rotational grazing, received technical advice, and had high animal and land productivities. Emissions per hectare of farmland were low on farms that had low stocking rates, a low number of grazing paddocks, little or no land dedicated to improved pastures and forage crops, and low land productivity. Our results suggest that the implementation of realistic, relatively easy-to-adopt farming management practices has considerable potential for mitigating the GHG emissions in the semi-arid rangelands of central Argentina.
1. Introduction
Livestock production is an important source of greenhouse gas (GHG) emissions worldwide. The livestock sector contributes 14.5% of global GHG emissions [1]. Since the human population is expected to increase from 7.2 to 9.6 billion by 2050 [2], together with the improvement of standard of living, there is an increasing demand for livestock products [3], which are expected to double by the mid-21st century [4]. The livestock sector will have to be a major contributor in the mitigation of GHG emissions and in the improvement of global food security [5]. Within the sector, beef production contributes the majority of emissions, producing 41% of the livestock sector’s direct emissions [6]. Methane (CH4) and nitrous oxide (N2O) are the largest contributors to global livestock emissions in CO2 equivalent (CO2e) per year [1]. In countries where pastoral agriculture is the dominant sector, CH4 and N2O emissions contribute up to 50% of the total GHG emissions [7]. Due to the negative relation between the efficiency of production and GHG emissions per output produced, the greatest mitigation potential lies in ruminant systems that operate with a low productivity (e.g., in South Asia, Latin America, the Caribbean, and Africa) [1].
Argentina is a major world beef producer. It is the sixth largest beef producer in the world [8] and the ninth largest beef exporter [9]. The meat chain generates around 4% of the total jobs in the country [9]. Argentina and four other Latin American main beef exporters plan to increase meat production in response to the forecasted growth in international markets [10]. Of the 156.94 Mt CO2e emitted by the Argentinean sector relating to ‘Agriculture, Forestry and other land uses’, livestock directly accounts for 54 Mt CO2e, produced by enteric fermentation (of which beef accounts for 83%); 20.26 MtCO2e are produced by manure deposition on pastures (76% from beef); and 2.14 MtCO2e are produced by manure management (83% from beef) [11]. Thus, methane emitted by enteric fermentation is especially important. In 2008, methane emissions from domestic ruminants in Argentina was the sixth highest in the world, and the per capita rate was one of the highest [12]. Rearte and Pordomingo [10] indicated there are ample opportunities to reduce methane emissions per unit of product in Argentina and other temperate regions of Latin America, such as Uruguay.
The GHG emissions of a product can be expressed as kg of CO2e per kg of product, or it can be expressed as kg of CO2e per unit of area (ha) of the production system, depending on the perspective (that of the consumer vs. that of the producer) [13,14,15] and product perspective vs. an IPCC inventory perspective [16,17]. From a ‘product perspective’, Casey and Holden [16] suggested that it is necessary to choose a functional unit (FU, kg of product vs. land area) of the function that the system delivers. However, for studies that intend to inform national GHG inventory reports, an FU coupled with land area is necessary [16,17]. Finally, environmental impacts per unit of product are more closely linked with the assessment of global issues, such as climate change [15,18], while assessing an environmental impact per hectare of land is considered a more local or regional issue, such as soil erosion, water eutrophication, or acidification [18]. Some studies have shown that the use of different FUs can produce contradictory results in assessing GHG emissions [13,14,16], illustrating the potential trade-off between carbon efficiencies per unit of product and per unit of land. Nevertheless, several studies suggest that the mitigation of emissions per unit of product and per unit of land area can be reconciled [14,16]. Casey and Holden [16], Halberg et al. [18] and Veysset et al. [19] suggested that product-based and land area-based indicators should be used to characterize the environmental impacts caused by food production.
Many studies have assessed mitigation strategies for reducing GHG emission intensity in terms of emissions per unit of animal product in several ruminant livestock farming systems worldwide, which have been reviewed extensively [1,5,20,21,22,23,24,25,26,27]. The mitigation strategies that reduce emission intensity by increasing herd productivity through improved animal husbandry practices (e.g., animal feeding, genetics, health, fertility, and the overall management of the animal operations) can be important in low–input ruminant systems [12,22] and have a greater mitigation potential in development than they do in developed economies [22].
In Argentina, >70% of the beef is produced in pasture-based grazing systems [10], mostly in extensive conditions [12]. As the opportunity for soybeans and cereal grains became structural to Argentinean agriculture, livestock businesses were displaced towards less productive, marginal lands [10,28]. Eight percent of beef production is in the semi-arid Central Region (18% of the country) [29]. Rangeland native grasslands are the main source of feed for cow-calf livestock systems, which constitute an important economic sector in the region [30]. Rangelands are the world’s most common land type [31], and they provide the livelihoods for many vulnerable communities throughout the world [32]. Their relevance is linked to their multifunctional nature and provision of ecosystem services [33]. Extensively managed livestock production is the most sustainable and common form of agriculture on rangelands [33]. Global demand for livestock products will increase the pressure on rangelands, which are experiencing high degradation and losses in biodiversity worldwide [34], especially in arid and semi-arid grasslands in developing countries [33].
Identifying the relationship between GHG emissions, farm management and system productivity can help livestock producers improve operations, where productivity can be improved considerably by implementing simple management practices [35]. Furthermore, in the transition to sustainable livestock production, assessments of mitigation measures that have been tailored to the location and livestock production system in use are needed [5,14]. Our study assessed commercial farms that were representative of the extensive beef systems, based on natural rangelands in the San Luis Province, which is typical of the semi-arid Central Region of Argentina [28]. Beef cattle stocks have increased in San Luis because of the displacement of livestock into semi-arid marginal areas [36] and incipient intensification has been reported [28]. The main objective was to assess GHG emissions from representative farms in order to identify realistic farming practices that will favor low GHG emissions. Specifically, we (i) estimated the CH4 and N2O on-farm livestock emission intensity based on two functional units: product-based (kg CO2e per total live weight sold) and area-based (kg CO2e per land area used); (ii) identified farm attributes and management practices that were associated with low emission intensities; and (iii) assessed the implications of using each of the two functional units in identifying the farming practices that minimize GHG emissions.
2. Materials and Methods
The study was conducted in a 4160-km2 area in the San Luis province, Central Region, Argentina (center of the study area: 34°17′22.46″ S; 66°25′40.89″ W), where an extensive cow-calf system, based on year-round, open-air grazing, is the main land use. The climate is semi-arid, and the annual precipitation ranges from 350 to 500 mm. The average daily temperature ranges from 8.5 °C (coldest month) to 23 °C (warmest month) [37]. The soils are shallow, poor in organic matter, have low water retention capacity, and low-medium productivity [38]. The climate and soil conditions are unsuited to croplands, and rangeland native grasslands are the main source of feed for livestock [30]. Natural vegetation consists of two main types [39]: (i) a woodland-shrubland mixture dominated by legume trees (Prosopis flexuosa and Geoffroea decorticans) and shrubs (Larrea divaricata); and (ii) grass-dominated steppes of Nassella tenuis, Piptochaetium napostaense, Poa ligularis and Poa lanuginose, and small scattered woodlands of legume trees (mainly G. decorticans). Most of the cattle are Hereford, Aberdeen Angus, or crossbreeds of the two, although some farms also have Creole [40]. A low productivity and potential improvement of the farm system have previously been reported in the region [10].
In 2014, 30 of the 67 beef cattle farms in the study area were surveyed. The farms were representative of the region based on earlier studies [30]. The survey, recorded in a structured questionnaire, collected detailed information about the size and structure of the farm, livestock management, infrastructures, productivity, as well as the ages and levels of education of the producer and the labor, referred to a one-year production cycle. With that information, a characterization of the farms was obtained, and variables were calculated, which were used in the analysis.
The general characteristics of the farms are detailed in Table 1. Seven percent of the farmers did not have any type of education, 61% had a primary or secondary education, and 32% had higher education. Half of the farms surveyed had salaried employees. In addition to natural grassland areas, 23% of the farms improved grasslands by introducing grasses, such as Eragrostis curvula, Digitaria eriantha, and Panicum coloratm cv. verde, and 17% had annual forage crops, such as maize (Zea mays), sorghum (Sorghum vulgare), rye (Secale cereale) with melilotus (Melilotus albus), and oats (Avena sativa), although in both cases, the areas were much smaller than the natural pastures (4% and 2% of the total land on average, respectively, Table 1). The annual forage crops are seeded if there have been enough rains; they are ‘low-input’ crops, which are not mowed but only grazed, and farmers generally do not use pesticides or chemical fertilizers. Half of the farmers purchased small amounts of maize, alfalfa or mineral complements, only in winter in critical years and not always for feeding all animal categories. Three types of production systems were observed: (i) cow-calf (CC) systems (60% of the farms), where calves are sold at weaning; (ii) backgrounding (BG) systems (10%) (i.e., farmers purchase weaned calves that are sold once they are fattened); and (iii) cow-calf + backgrounding (CCBG) systems (30%). The calves are weaned at 6 months at 130–150 kg of live weight (LW) and sold fattened at 15 months (280–300 kg LW). On the CC and CCBG farms, the reproductive system was either (i) year-round mating (44% of the farms), or (ii) seasonal. Only 7% of farms employed artificial insemination. On the farms, water was collected in artificial dams by drilling, extraction from wells and, to a lesser extent, using natural streams.

Table 1.
General characteristics of the beef cattle farms in San Luis province, central Argentina.
GHG emissions were estimated on-farm, based on the CH4 emissions from cattle enteric fermentation and N2O emissions from the managed soils used by grazing animals. Animals graze year-round, and manure is not managed, which is consistent with the Intergovernmental Panel on Climate Change (IPCC) [42]. No animal housing was involved, and crops and imported feeds were not relevant in the study area. CO2 emissions from infrastructure, energy used for crops, and off-farm GHG emissions were not included in this study. Therefore, we focused on the relevant on-farm GHG emissions, as affected by the farm management practices. GHG emissions were expressed as CO2 equivalents (CO2e) for a time horizon of 100 years: CH4 kg × 25 and N2O kg × 298 [43]. Emissions were expressed as kgCO2e per kg LW sold (sum of weaned calves and culled cows), and per hectare (ha) of farmland.
Assessments of GHG emissions were based on the IPCC Tier 2 protocols [42]. Appendix A shows the IPCC (2006) equations used in the calculations. Further updates of IPCC (2006) protocols did not affect those equations. Enteric CH4 was estimated for each category of cattle on the farm: cow, weaned calf, replacement heifer, bull and steer.
Estimates of the gross energy (GE) intake of the animals were calculated based on the net energy (NE) requirements for maintenance, activity, growth, pregnancy and lactation. Enteric emissions were estimated based on GE intake and using methane conversion factors (Ym). We refined Ym calculations using the Cambra-López et al. (2008) [44] equation: Ym = −0.0038*DE2 + 0.351*DE-0.8111, where DE is feed digestibility, expressed as a percentage of the GE of the feed. DE was estimated based on earlier studies on the quality of the pastures in the study area [45], percentage of land with annual forage crops, and the opinions of local experts of the ‘Estación Experimental Agropecuaria San Luis’ del ‘Instituto Nacional de Tecnología Agropecuaria’ (INTA). The average DE was 58% (range = 52–60; SD = 1.3), and the average Ym was 6.7% (range = 6.5–7.1; SD = 0.12).
N2O emissions from managed soils were calculated based on the N deposited on pastures by grazing animals (urine and dung). The amount of N deposited on the pasture by each cattle type while grazing was estimated based on the number of animals, feed intake, pasture N content, and N retention of the animals, following IPCC [42] and the National Research Council [46].
Two analyses were conducted: statistical models that described GHG emissions and cluster analysis, identifying homogeneous groups of farms that differed in emissions and management practices.
The relationship between farm management practices and GHG emission was investigated using generalized linear models (GLM) [47], with the assumption that the data followed a Tweedie distribution, and a logarithmic link function. The dependent variable was CO2e emissions, which was expressed as either (a) per kg of LW sold or (b) per hectare of land.
A set of explanatory variables was used for the models of each of the two dependent variables. The values of all explanatory variables (nominal, ordinal, or continuous) were transformed to 0–1 values and included as ‘factors’ (categorical predictors with values 0–1) in the models. Nominal variables included feed purchase (0, no; 1, yes); the reproductive management of the livestock (0, year-round mating; 1, seasonal mating); technical advice (0, no; 1, yes); type of production system [0, cow-calf (CC); 1, cow-calf + backgrounding (CCBG)]; and grazing system (0, continuous; 1, rotational). For the ordinal and continuous variables, the scoring criteria were based on the median (values ≤ median = 0; values > median = 1), except for the land area used for introduced pastures or annual forage crops. Ordinal variables included water reservoirs per total land (0, low; 1, moderate; median = 16.7 × 10⁻⁴ water reservoirs/ha); grazing paddocks per total land (0, low; 1, moderate; median = 16 × 10−4 grazing paddocks/ha); and livestock care controls (0, poor = three or fewer types of controls; 1, good = four to six types of controls; median = 3 controls). The types of livestock care controls were body condition, teeth examination, rectal palpation/ecography, parasite control, reproductive vaccine, and bull review control. Continuous variables included land area used for introduced pastures or annual forage crops (0, null/very low if area ≤ 4%; 1, low/moderate if area > 4%), average live weight of livestock (0, low; 1, moderate; median = 292 kg), cows-to-total animals rate (0, low; 1, moderate; median = 55%), average weight of sold calf (0, low; 1, moderate; median = 204 kg), mortality rate (0, low; 1, moderate; median = 2.6%), stocking rate (0, low; 1, moderate; median = 0.10 LU/ha), weaning rate (0, low; 1, moderate; median = 66.5%), land productivity (0, low; 1, moderate; median = 9.2 kg LW sold/ha), and animal productivity (0, low; 1, moderate; median = 100 kg LW sold/LU).
Prior to the GLM analysis, an exploratory analysis was conducted, based on the Mann–Whitney test, to identify the independent effects of variables on GHG emissions, and a Spearman’s non-parametric test was used to identify co-linearity among variables. Only non-correlated variables (rs < 0.38, p > 0.05) were included in a given GLM. Backgrounding farms were excluded from the analysis because they do not have a breeding herd.
Several analyses were performed based on all possible combinations of non-correlated variables and removing the non-significant explanatory variables one at a time (variables that did not reach p < 0.05 in a Wald’s Chi-square test) until the final models only contained significant explanatory variables.
Only models that were significant (p < 0.05) based on an omnibus test were included in the analyses. The resultant models were defined as:
where E = CO2e emission, the first term ‘α’ contains the regression intercept, and the remaining terms include the variables used in the model. The model indicates the partial regression β coefficients, which indicate the weights of the variables 1, 2, …, i in the model when the variable is ‘0’. Thus, if β is > 0, E and the variable (level ‘0’) are positively correlated, and if β is < 0, E and the variable (level ‘0’) are negatively correlated. If the variable is ‘1’, the model takes the reference value (β = 0 and, hence, LnE = α). Emissions are calculated as:
The statistical significance of the coefficients of individual variables in the models was tested using Wald’s Chi-square test. Significant interaction effects were not detected. To express the main effects in each model, the estimated marginal means were calculated. For all possible combinations of non-correlated variables in the models, a model fit was evaluated based on Akaike’s information criterion for finite samples (AICc) [48]. ΔAICc was calculated as: ΔAICc = AICci − AICcmin, for i = 1, 2, …, R, where AICcmin denotes the minimum of the AICc values for the R models [49]. Models that had the lowest AICc were selected as the best models within a set of models that included the same set of variables [48]. Models with ΔAICc < 7 were considered plausible, and models with ΔAICc > 11 were discarded [49]. The explained deviance reflected the contributions of significant individual explanatory variables to the model as follows: D2 = (D0 − Dmodel)/D0, where D0 is the deviance of the null model (intercept only), and Dmodel is the deviance of the analyzed model [50]. The contribution of each explanatory variable was estimated based on the change in D2 after the variable was deleted from the model divided by the total explained deviance [51], which is expressed here as ‘D2 change on deletion’ (%DCD). As the values of the variables were 0 or 1, standardization of the explanatory variables was not conducted. The statistical significance of the independent effects of each management variable on GHG emissions was assessed based on Spearman’s correlation non-parametric tests.
For the typification of the farms, 7 continuous and 4 discrete variables were selected. To identify the main factors (eigenvalues > 1) that characterized the changes observed, 11 variables were subjected to principal component analysis (PCA), with varimax rotation. The Bartlett sphericity test and a Kaiser–Meyer–Olkin (KMO) test for sampling adequacy were used to validate the sampling. To identify a typology of the farms, we subjected the main factors of the PCA to a hierarchical cluster analysis (CA), with a squared Euclidean distance and Ward’s aggregation method. In that way, five groups of farms were identified. To validate the results, we used a non-parametric Kruskal–Wallis test, known as ‘analysis of variance by ranges’ [52], which verifies which continuous variables, either those used in the PCA-CA (7 variables) or not (10 variables), are significant in explaining the differences between the groups. To identify which groups differ according to each continuous variable, we used the non-parametric Dunn–Bonferroni post-hoc test. To identify differences between groups for the discrete variables, we used the Pearson’s chi-square test. The testing of variables not included in the CA is known as ‘criterion validity’ [53] and has been used to characterize livestock farms [54].
The statistical analyses were performed using IBM SPSS Advanced Statistics software ver. 22 [55].
3. Results
3.1. Farm Greenhouse Gas (GHG) Emissions
Among the beef farms in the San Luis province, central Argentina, the mean GHG emission intensity was 19.6 kg CO2e/kg LW sold, but varied widely (range = 6.2–39.7). Backgrounding (BG) farms produced fewer emissions than did cow-calf (CC) farms, and mixed CCBG farms produced average emissions. On a farm-area basis, the average emission rate was 261 kg CO2e/ha (range = 26 to 1042), which did not differ significantly among types of production systems (Table 2).
Table 2.
Farm greenhouse gas emissions of the beef cattle farms in San Luis province, central Argentina.
3.2. Effects of Farm System and Management on GHG Emissions
Considered independently, six variables had a significant effect on emission intensity per kg of LW sold (Table 3). Emissions were significantly lower under good than under poor livestock care management controls, if technical advice was sought, if rotational grazing was used, and in CCBG rather than in CC systems. Land and animal productivity affected the emissions, with lower emission intensities under higher land and animal productivity. Furthermore, emission intensity was negatively correlated with land and animal productivities (r = −0.46, p < 0.05; r = −0.87, p < 0.001, respectively). Weaning rate and emission intensity were negatively correlated (r = −0.39, p < 0.05); however, a Mann-Whitney test did not indicate a significant effect of weaning rate on emission intensity (p < 0.10, Table 3).
Table 3.
Individual effects of farm characteristics and management on greenhouse gas emission intensity.
The set of variables that, considered independently, had a significant effect on emissions per hectare of farmland differed from those that affected emission intensity per kg of LW sold, with the exception of land productivity, which significantly affected both types of emissions, but in opposite directions (Table 3). Emissions per hectare were significantly lower if little or no land had been dedicated to improved pastures or annual forage crops, if mortality rate was low, if stocking rate was low, and if the number of grazing paddocks per total land was low. Emissions were higher under moderate than under low land productivity. Furthermore, land productivity and emissions per hectare were positively correlated (r = 0.66, p < 0.001).
Eleven models for emissions per kg of LW sold and eight models for emissions per hectare of farmland had significant (p < 0.05) values for the intercept and explanatory variables (Table 4). All of the variables that individually had a significant effect on emission intensity (Table 3) yielded significant models.
Table 4.
Generalized linear models (GLM) for the response in emission intensity (kg CO2e/kg LW sold, and as kg CO2e/ha) of beef cattle farms to farm management and characteristics.
In the best model for explaining emissions per kg LW sold (Model 1, lowest AICc and highest D2), animal and land productivities were significant explanatory variables (Table 4 and Figure 1). Systems that had higher animal and higher land productivity emitted less than those systems with a lower productivity. The calculated square deviance (D2) indicated that the model explained 51.2% of the variation in the response variable. Models 2–3 performed worse in terms of AICc and D2 but were plausible in terms of ΔAICc (ΔAICc < 7) and should rarely be dismissed [49]. Models 2–3 included management care controls of livestock as an explanatory variable: systems that had good management controls emitted less than those that did not. Models 4–9 performed worse than 1–3 but were not necessarily dismissed (ΔAICc < 11) [49], and they included the type of production system, grazing system and technical advice as significant explanatory variables: CCBG systems emitted less than CC systems, rotational emitted less than did continuous grazing, and systems that received technical advice emitted less than did those that did not. Models 10–11 had relatively little empirical support (ΔAICc > 11) [49] and were dismissed. Within each model, the partial regression coefficients and the ‘D2 change on deletion’ (%DCD, results not shown) indicated that animal productivity (Model 1), livestock care management (Model 3), type of production system (Model 4), and grazing system (Model 5) had more weight in influencing emission intensity than land productivity.
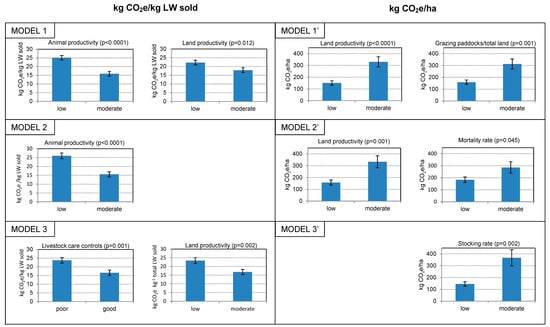
Figure 1.
Marginal means and standard error of the most significant GLM models for the response in emission intensity (kg CO2e/kg LW sold, and kg CO2e/ha) of beef cattle farms in San Luis province, central Argentina. Differences were tested using Wald’s chi-square test.
In the best model for explaining emissions per hectare of farmland (Model 1’, lowest AICc and highest D2), land productivity and the number of grazing paddocks per total land were significant explanatory variables (Table 4 and Figure 1). Systems that had lower land productivity emitted less than did those systems with a higher land productivity. In addition, systems that had less grazing paddocks emitted less. In this model, the partial regression coefficients indicated that land productivity had more weight than the number of grazing paddocks. Calculated square deviance (D2) indicated that the model explained 57.4% of the variation in the response variable. Models 2’-4’ performed worse than model 1’ in terms of AICc and D2 but were not necessarily dismissed (ΔAICc < 11) [49], and they included the mortality rate and stocking rate as significant explanatory variables: systems that had a lower mortality rate emitted less than did those that had a higher mortality rate, and systems that had a lower stocking rate emitted less than did those that had a higher stocking rate. Models 5’–8’ had relatively little empirical support (ΔAICc > 11) [49] and were dismissed. Within each model, the partial regression coefficients and the ‘D2 change on deletion’ (%DCD, results not shown) indicated that the number of grazing paddocks (Model 1’) and mortality rate (Model 2’) had less weight in influencing emissions than land productivity.
3.3. Farm Typification
Table 5.
Mean values for continuous variables by cluster group.
Table 6.
Frequency (% of farms) of discrete variables by cluster group.
- Group I (23% of farms): ‘High emitters per LW sold’ (higher emitters than group V) and ‘low emitters per hectare’ (lower emitters than group II). ‘Worse management’ and ‘low stocking rates’ (lower stocking rates than group II). Only cow-calf systems. Highest proportion of farms with continuous grazing. On those farms, all of the land area consists of natural grasslands, and off-farm feeds are not used. Lowest percentage of farms that have three or more types of livestock care management controls. Highest percentage of farms with year-round mating. Highest proportion of farms without any technical advice. Low weaning rates (lower weaning rates than group IV). ‘Low land and animal productivities’ (lower land productivity than groups II and V, and lower animal productivity than group V).
- Group II (30% of farms): ‘Intermediate emitters per LW sold’ and ‘high emitters per hectare’ (higher emitters per hectare than group I). ‘Medium level of management’ and ‘high stocking rates’ (higher stocking rates than group I). Cow-calf systems and rotational grazing predominate. Almost all of the land area consists of natural grasslands, and most of the farms use off-farm feeds (higher percentage than group I and III). Most of the farms have three or more livestock management controls, 50% of farms have year-round mating, and 78% of farms receive no technical advice (less technical advice than groups III and IV). Intermediate weaning rates. ‘High land productivity’ (higher than group I) and ‘intermediate animal productivity’.
- Group III (17% of farms): ‘Intermediate emitters per LW sold and per hectare’. ‘Suitable farm management’ and ‘intermediate stocking rates’. Cow-calf or mixed CCBG systems, and all the farms use rotational grazing. The entire land area consists of natural grasslands, and off-farm feeds are not used. All of the farms implemented at least 3 types of livestock management controls, 80% of the farms had seasonal mating of the herd, and all farms have technical advice. Intermediate weaning rates. ‘Intermediate land and animal productivity’.
- Group IV (20% of farms): ‘Intermediate emitters per LW sold and per hectare’. ‘Suitable farm management’, and ‘intermediate stocking rates’. Cow-calf, BG or mixed CCBG systems, and all the farms have rotational grazing. Almost all of the land area consists of natural grasslands, and most farms use off-farm feeds. All of the farms implement at least 3 types of livestock management controls and have seasonal mating of the herd, and 83% of farms have technical advice. High weaning rates (higher weaning rates than group I). ‘Intermediate land and animal productivities’.
- Group V (10% of the farms): ‘Low emitters per LW sold’ (lower emitters than group I), and ‘intermediate emitters per hectare’. ‘Good farm management’ and ‘intermediate stocking rates’. None of the farms were exclusively cow-calf systems. All of the farms had rotational grazing. Relatively high proportion of land used for introduced pastures and annual forage crops, and 67% of farms used off-farm feeds (higher percentage of farms than in groups I and III). All of the farms implemented at least 3 types of livestock management controls, had seasonal mating of the herd, and 67% of farms had technical advice. Intermediate weaning rates. ‘High land and animal productivities’ (higher than group I).
4. Discussion
GHG farm emissions varied widely among the 30 farms surveyed in the semiarid rangelands of central Argentina, which reflected the high diversity in the types of production systems [26,56]. Variability is especially high in studies that have been based on actual farm survey data [14,26].
In our study, on a product sold basis, cow-calf systems emitted more GHG than backgrounding systems. Similar results have been reported in grassland-based beef systems in Uruguay [14,15,57] and Argentina [58]. In our study, the GHG emissions of cow-calf systems were similar to those of 295 cow-calf farms in Canada [26] and the cow-calf systems based on native and improved grasslands in Uruguay [14]. Emissions from backgrounding systems were similar to those from background-finishing systems that had seeded pastures and feedlots in Uruguay [57].
On a farm-area basis, in our study, GHG emissions did not differ significantly among types of systems. The average was much lower than previously reported values, which ranged between 265 and 9782 [26], and between 2334 and 3037 [59] in Canadian beef cattle production systems, between 1490 and 2827 in Uruguayan beef systems [14], and between 7902 and 10,913 in New Zealand pasture-based dairy systems [60]. The higher stocking rates in those studies (0.31, 0.77 and 2.3–3.0 LU/ha in Canadian, Uruguayan and New Zealand systems, respectively, versus 0.13 LU/ha in our study) were mainly responsible for the differences in emissions between those studies and ours. In our study, the emissions per hectare and stocking rate were positively correlated (r = 0.900, p < 0.001). In beef systems in the Brazilian Amazon [61] and in dairy systems in Ireland [62], emissions per hectare and stocking rates were positively correlated. Livestock density on extensively managed grazing lands are relatively low; therefore, CH4 emissions per unit area from these grazing lands is much lower than those from intensively managed grazing lands [33,63]. The contribution of extensively managed grasslands to GHG emissions is expected to be low per unit area because of low livestock densities and agronomic inputs, although the absolute global contribution might be high because of their large land area [63].
In our study, on a product sold basis, animal productivity was the variable that best explained the largest amount of variance in emission intensity, which was negatively correlated with productivity. To a lesser degree, land productivity and emission intensity were negatively correlated. Improving production efficiency has been recommended as a strategy to mitigate GHG emissions in beef systems [14,15,26,57,64,65,66]. For instance, Alemu et al. [26] found that low-emitting farms had higher animal and land productivities than high-emitting farms in Canadian cow-calf systems. In French suckler-beef production farms, animal productivity was the main factor influencing GHG emissions [64], which suggested that technical efficiency was a factor. Becoña et al. [14] found that beef farm productivity was one of the main determinants of GHG emissions in Uruguayan cow-calf systems. The same negative correlation was found in dairy systems [67,68], mainly because emissions are spread over more units of output per cow, which dilutes emission intensity. Productivity gains are generally achieved through improved husbandry practices and technologies that increase the proportion of resources used for production purposes rather than for the maintenance of the animals, which contribute to emission reductions [1]. Improved farm productivity can result from a combination of several types of strategies.
On the beef farms in our study, continuous stocking practices emitted significantly more GHG per product sold than rotational stocking. Beef cattle in rotational stocking systems emitted less methane than cattle in continuous grazing [35]. Furthermore, good grazing management can have a positive impact on soil carbon sequestration [1].
Improved livestock care management was associated with reduced GHG emission intensity per kg LW sold in our study. Improved animal health can increase herd productivity and reduce GHG emission intensity [24]. Along with improved reproduction management, improved animal health helps to reduce the unproductive portion of the herd and associated emissions, and concomitantly, these measures increase productivity [1]. Preventive health measures can play a role in increasing growth and fertility rates, which improve animal and herd performance [1]. Llonch et al. [27] reported a reduction in rumen methanogenesis in response to an increase in production efficiency caused by improvements in the health status of the herd, which is a win-win strategy, because it increases environmental sustainability and animal welfare.
In our study, farms that had received technical advice had lower emissions per unit of product sold, which reflected the importance of technical advice in grazing management planning, feeding, health care, the reproductive management of the herd, and overall farm system management [69,70].
Land-related variables can affect GHG emissions from animals through diet quality [26]. Diet digestibility directly reduces CH4 emission intensity [64,71], which was apparent on farms that had an increased area of improved pastures, including seeded pastures, oversowing with legumes, and annual winter crops for grazing [14]. In our study, such an effect was not apparent, probably because of the small proportion of the farmland that had been used for improved pastures or annual forage crops (mean = 6%, vs. 20.5% in the study by Becoña et al. [14]).
Many of those husbandry practices are associated with increases in productivity, which suggests that an economic benefit can be realized with a concurrent reduction in GHG emissions [27]. Strategies that both improve production efficiency and reduce GHG emissions are those most attractive to and most likely to be adopted by farmers [26]. Further studies should compare the economic impact of several measures to mitigate GHG emissions and willingness to adopt them in our study area.
In our study, emission intensity per hectare of farmland was positively correlated with stocking rate and land productivity. Similar results were reported by Becoña et al. [14] in beef cow-calf systems. In Irish dairy farms, Casey and Holden [16] found a significant positive correlation between stocking rate and the amount of GHG emissions per hectare. Bava et al. [68] found a strong positive correlation between emissions per land area and stocking rate in dairy systems. Stocking rate and total dry matter intake are the main factors driving production per hectare and GHG emissions from grazed pastoral systems [7]. The number of grazing paddocks per hectare and the proportion of land used for improved pastures and annual forage crops were positively correlated with GHG emissions per hectare of land area in our study. Higher stocking rates and land productivity, coupled with higher density of grazing paddocks and land use for improved pastures and forage crops, reflect a certain degree of intensification of the farming system, i.e., intensification implied higher emissions per hectare. Bava et al. [68] concluded that intensification, defined as the increase in output per hectare, invariably led to higher emissions on a per-area basis. Nevertheless, the emissions per unit of product and land productivity were negatively correlated, which illustrates the potential trade-off between carbon efficiencies per unit of product and per unit of land, i.e., is it possible to reduce emissions per unit of land and per unit of product at the same time?
The CA indicated that, if GHG emissions are evaluated on a land-unit basis, farms of group 1 had low emissions and were very extensive in terms of land use. They had low stocking rates, a low dependence on off-farm feeds, land productivity, and low proportion of land used for improved pastures or annual crops. Farms in that group, however, had the lowest level of husbandry practices in terms of livestock care controls and reproductive management, technical advice, and grazing system, low weaning rate and animal productivity, and concomitantly, they had high emissions per product sold. From that ‘base-line’ traditional farming system, strategies can differ considerably in practice and results, in terms of farm productivity and emissions. Farms in group II intensified the system by increasing the stocking rates and dependence on off-farm feeds, and they improved some husbandry practices, maintained emissions per product sold, but increased emissions per hectare. Farms in group V had a higher proportion of land as improved pastures and annual forage crops, medium stocking rates, improved livestock husbandry practices, and had intermediate levels of emissions per hectare. This group had lower emissions per product sold than group I because of those improvements, but also because of the high proportion of backgrounding on the farms in this group. Nevertheless, it has to be taken into account that only three farms belonged to group V. Groups III and IV had higher levels of husbandry practices than groups I and II, but they did not have stocking rates that were as high as those in group II. Thus, those groups (III and IV) had intermediate levels of farm productivity and emissions per product sold and per hectare.
The CA suggested that farms that had a high level of husbandry ‘intensification’ through livestock care and reproductive management achieved high animal productivity and, therefore, low GHG emissions per product sold compared to ‘base-line farms’ (group I). Thus, if land productivity is increased by using that high-output animal strategy, emissions per hectare can be limited to intermediate levels. However, if land productivity is maximized through high stocking rates, emissions per hectare is the highest, as in the case of group II. Becoña et al. [14] stated that both emissions per unit of land and per unit of product can be reduced concurrently and suggested that the key factor is reducing stocking rate (or increasing forage allowance) in grazing beef cow-calf systems. GHG emission intensity can be reduced through changes in animal husbandry practices that increase animal outputs [14,64]. Casey and Holden [16] suggested that it is physically and biologically possible to achieve low emissions, both per unit of land and per product, by using high-output cows at low stocking rates in dairy systems. A move toward fewer cows producing more milk at lower stocking rates is required, representing an extensification in terms of area, but an intensification in terms of animal husbandry practices. In a simulation experiment on pasture-based dairy farms in New Zealand, Beukes et al. [60] maintained production but reduced GHG emissions per unit of land and per unit of product by increasing efficiency (e.g., reducing the number of non-productive animals in the herd, among other mitigation strategies), which allowed stocking rates to be reduced. The mitigation of GHG emissions per unit of product should be based on the intensification of husbandry systems rather than on land intensification, which might lead to potential losses in ecosystem service provisioning, increases in GHG emissions per unit of area and other environmental impacts, such as eutrophication and acidification [15].
Among the beef cattle farms in our study, those in groups III and IV could further reduce emission intensity by adopting practices, such as improving feed quality [22,26,64], using superior animal genetics [72], or increasing the proportion of backgrounding vs. cow-calf in the farm system. Feed quality can be increased by applying seeding grasses to improve native pastures, annual forage cropping, and by purchasing high-quality off-farm feeds. However, introduced grasses can increase the impact on native grasslands, with potential biodiversity, wildlife habitat and landscape losses [15,57]. The mitigation of climate change should not be associated with directly reducing biodiversity [15]. In several regions of the world, pasture intensification has been used to increase productivity, incomes, and mitigate GHG, but has increased rangeland degradation [32]. Annual cropping systems have relatively high levels of agronomic inputs and nutrient leakage, frequent and significant disturbances of the soil surface, and net losses of soil organic content [33]. In addition, CO2 emissions derived from fertilizers and machinery operations for annual forage crops are high [26]. Feed quality can be improved by purchasing high-quality feeds, but the embedded emissions associated with feed production should not be ignored. Alemu et al. [26] found that minimizing purchased cereal grain and forage per unit cow reduced the emissions associated with the production and transportation of farm inputs. In strategies, such as improving genetic merit, the animals have to be selected not only for their high efficiency in transforming feeds, but also for their ability to adapt to rough environments and low-quality feeds [73], which are characteristic of the semi-arid rangelands of central Argentina. In addition, to reduce emissions per unit of product, farmers can increase the proportion of backgrounding versus cow-calf in their system. However, this strategy can transfer the negative environmental impacts of the cow-calf phase to other areas, i.e., the emissions of the replacement stock, if purchased, have occurred elsewhere on other farms [74].
Our results from actual semi-arid rangeland beef systems in central Argentina suggest that the implementation of relatively easy-to-adopt farming management practices has considerable potential for reducing GHG emissions per unit of product and per unit of land area. At the same time, the preservation of rangeland ecosystem services should be a target.
The expansion of agriculture and an increase in the intensification of livestock systems have challenged the integrity of rangelands in Argentina and worldwide. Future research should assess the ecosystem services provided by the beef production systems in the semi-arid rangelands of Argentina, e.g., wildlife biodiversity and landscape preservation, animal welfare, nutrient cycling, hydrologic conditions, control of invasive plant species, and carbon sequestration. Grazing lands have a high potential for carbon sequestration [23,75,76], which can, at least partially, mitigate the GHG emissions from ruminant production systems [77]. Extensive livestock grazing systems had a lower GHG emission intensity if soil carbon uptake had been included in the emission inventory [15,65,78,79,80,81], particularly for low-input or small-scale grazing systems [20,81]. Therefore, land-use decisions should be informed by all environmental factors, negative impacts—not only GHG emissions—and ecosystem services. In order to increase the sustainability and efficiency of beef livestock systems in the Argentinean semi-arid rangelands, future studies should use an integrated, holistic approach.
5. Conclusions
This study assessed the relationships between GHG emissions and characteristics and the management practices of commercial farms in extensive beef systems that are based on the natural rangelands in the semi-arid Central Region of Argentina. The results suggest that the implementation of realistic, relatively easy-to-adopt farming management practices has a considerable potential to mitigate GHG emissions. Emissions per product sold were low on farms that had improved livestock care management, had rotational grazing, received technical advice, and had high animal and land productivities. The emissions per hectare of farmland were low on farms that had low stocking rates, a low number of grazing paddocks, little or no land dedicated to improved pastures and annual forage crops, and low land productivity.
Therefore, in our study, the set of variables that influenced the emissions per hectare of farmland differed from those that affected the emissions per unit of product, and land productivity affected the two types of emission expressions in opposite directions, which suggests a potential trade-off between the mitigation of GHG emissions per unit of product and per unit of land. Given that GHG emissions per product and per hectare of farmland differ in their implications for the assessment of the environmental impacts of food production (e.g., global vs. local scales, intensification processes), both measures should be taken into account and reconciled as much as possible.
To identify ways to increase the sustainability and efficiency of the management of beef livestock systems in the Argentinean semi-arid rangelands, future studies should use an integrated, holistic approach in which all negative environmental impacts and ecosystem service provisioning, e.g., diversity preservation and carbon sequestration, should be assessed.
Author Contributions
Conceptualization, M.I.N., O.B., L.P. and R.R.; Data curation, M.I.N.; Formal analysis, M.I.N., O.B. and R.R.; Funding acquisition, M.I.N.; Investigation, M.I.N. and L.P.; Methodology, M.I.N., O.B. and R.R.; Resources, M.I.N. and L.P.; Supervision, O.B. and R.R.; Validation, O.B. and R.R.; Writing—original draft, O.B. and M.I.N.; Writing—review and editing, O.B., R.R. and M.I.N.
Funding
This research was funded by the Instituto Nacional de Tecnología Agropecuaria (INTA), Argentina.
Acknowledgments
The authors are grateful to C.A. Frasinelli for his contribution and technical advice, and to the farmers that participated in the study.
Conflicts of Interest
The authors declare no conflict of interest. The funders had no role in the design of the study; in the collection, analyses, or interpretation of data; in the writing of the manuscript; or in the decision to publish the results.
Appendix A
The IPCC (2006) [42] equations used in the calculations of the on-farm CH4 and N2O gases emissions were: 10.3, 10.4, 10.6, 10.8, 10.13, 10.14, 10.15, 10.16, 10.17, 10.18, 10.19, 10.20, 10.21, 10.31, 10.32, 10.33, 11.1, 11.5, and 11.11.
References
- Gerber, P.J.; Steinfeld, H.; Henderson, B.; Mottet, A.; Opio, C.; Dijkman, J.; Falcucci, A.; Tempio, G. Tackling Climate Change through Livestock e a Global Assessment of Emissions and Mitigation Opportunities; Food and Agriculture Organization of the United Nations (FAO): Rome, Italy, 2013; ISBN 978-92-5-107921-8. [Google Scholar]
- United Nations Department of Economic and Social Affairs. Available online: http://www.un.org/en/development/desa/news/population/un-report-world-population-projected-to-reach-9-6-billion-by-2050.html (accessed on 26 September 2018).
- Delgado, C.L. Rising demand for meat and milk in developing countries/implications for grasslands-based livestock production. In Grassland: A Global Resource; McGilloway, D.A., Ed.; Wageningen Academic Publishers: Wageningen, The Netherlands, 2005; pp. 29–40. ISBN 978-90-76998-71-8. [Google Scholar]
- Garnett, T. Livestock-related greenhouse gas emissions: Impacts and options for policy makers. Environ. Sci. Policy 2009, 12, 491–503. [Google Scholar] [CrossRef]
- Rojas-Downing, M.M.; Nejadhashemi, A.P.; Harrigan, T.; Woznicki, S.A. Climate change and livestock: Impacts, adaptation, and mitigation. Clim. Risk Manag. 2017, 16, 145–163. [Google Scholar] [CrossRef]
- Opio, C.; Gerber, P.; Mottet, A.; Falcucci, A.; Tempio, G.; Macleod, M.; Vellinga, T.; Henderson, B.; Steinfeld, H. Greenhouse Gas Emissions from Ruminant Supply Chains—A Global Life Cycle Assessment; Food and Agriculture Organization of the United Nations (FAO): Rome, Italy, 2013; p. 191. ISBN 978-92-5-107945-4. [Google Scholar]
- De Klein, C.A.M.; Pinares-Patiño, C.; Waghorn, G.C. Greenhouse gas emissions. In Environmental Impacts of Pasture-Based Farming; McDowell, R.W., Ed.; CABI: Wallingford, UK, 2008; pp. 1–32. ISBN 978-18-4-593411-8. [Google Scholar]
- Ministerio de Economía y Finanzas Públicas. Complejo Ganadero Vacuno. Serie “Complejos Productivos”. Secretaría de Política Económica y Planificación del Desarrollo. Gobierno Argentino. Available online: https://www.economia.gob.ar/peconomica/docs/Complejo_Ganadero_vacuno.pdf (accessed on 26 September 2018).
- Miazzo, D.; Pisani Claro, N. Carnes Argentinas. Actualidad, Propuestas y Futuro; Fundación Agropecuaria para el desarrollo de Argentina (FADA), Sitio Argentino de Producción Animal: Río Cuarto, Cordoba, Argentina, 2015; pp. 1–37. Available online: http://www.produccion-animal.com.ar/informacion_tecnica/origenes_evolucion_y_estadisticas_de_la_ganaderia/00-origenes_evolucion_y_estadisticas_de_la_ganaderia.htm (accessed on 28 September 2018).
- Rearte, D.H.; Pordomingo, A.J. The relevance of methane emissions from beef production and the challenges of the Argentinean beef production platform. Meat Sci. 2014, 98, 355–360. [Google Scholar] [CrossRef] [PubMed]
- Segundo Informe Bienal de Actualización de la República Argentina a la Convención Marco de las Naciones Unidas sobre el Cambio Climático. Ministerio de Ambiente y Desarrollo Sustentable. República Argentina. 2017, pp. 37–69. Available online: http://euroclimaplus.org/intranet/_documentos/repositorio/02%20Bienal%20Convenci%C3%B3n%20ONU%20cambio%20clim%C3%A1tico_2017.pdf (accessed on 28 September 2018).
- Bárbaro, N.; Gere, J.; Gratton, R.; Rubio, R.; Williams, K. First measurements of methane emitted by grazing cattle of the Argentinean beef system. N. Z. J. Agric. Res. 2008, 51, 209–219. [Google Scholar] [CrossRef]
- Reisinger, A.; Ledgard, S. Impact of greenhouse gas metrics on the quantification of agricultural emissions and farm-scale mitigation strategies: A New Zealand case study. Environ. Res. Lett. 2013, 8, 025019. [Google Scholar] [CrossRef]
- Becoña, G.; Astigarraga, L.; Picasso, V.D. Greenhouse gas emissions of beef cow–calf grazing systems in Uruguay. Sustain. Agric. Res. 2014, 3, 89–105. [Google Scholar] [CrossRef]
- Picasso, V.D.; Modernel, P.D.; Becoña, G.; Salvo, L.; Gutiérrez, L.; Astigarraga, L. Sustainability of meat production beyond carbon footprint: A synthesis of case studies from grazing systems in Uruguay. Meat Sci. 2014, 98, 346–354. [Google Scholar] [CrossRef] [PubMed]
- Casey, J.W.; Holden, N.M. The relationship between greenhouse gas emissions and the intensity of milk production in Ireland. J. Environ. Qual. 2005, 34, 429–436. [Google Scholar] [CrossRef] [PubMed]
- Ross, S.A.; Topp, C.F.E.; Ennos, R.A.; Chagunda, M.G.G. Relative emissions intensity of dairy production systems: Employing different functional units in life-cycle assessment. Animal 2017, 11, 1381–1388. [Google Scholar] [CrossRef] [PubMed]
- Halberg, N.; van der Werf, H.M.G.; Basset-Mens, C.; Dalgaard, R.; de Boer, I.J.M. Environmental assessment tools for the evaluation and improvement of European livestock production systems. Livest. Prod. Sci. 2005, 96, 33–50. [Google Scholar] [CrossRef]
- Veysset, P.; Lherm, M.; Bébin, D. Energy consumption, greenhouse gas emissions and economic performance assessments in French Charolais suckler cattle farms: Model-based analysis and forecasts. Agric. Syst. 2010, 103, 41–50. [Google Scholar] [CrossRef]
- Cottle, D.J.; Nolan, J.V.; Wiedemann, S.G. Ruminant enteric methane mitigation: A review. Anim. Prod. Sci. 2011, 51, 491–514. [Google Scholar] [CrossRef]
- Gerber, P.J.; Hristov, A.N.; Henderson, B.; Makkar, H.; Oh, J.; Lee, C.; Meinen, R.; Montes, F.; Ott, T.; Firkins, J.; et al. Technical options for the mitigation of direct methane and nitrous oxide emissions from livestock: A review. Animal 2013, 7, 220–234. [Google Scholar] [CrossRef] [PubMed]
- Hristov, A.N.; Oh, J.; Lee, C.; Meinen, R.; Montes, F.; Ott, T.; Firkins, J.; Rotz, A.; Dell, C.; Adesogan, C.; Yang, W.; et al. Mitigation of Greenhouse Gas Emissions in Livestock Production—A Review of Technical Options for Non-CO2 Emissions; Food and Agriculture Organization of the United Nations (FAO): Rome, Italy, 2013; pp. 1–206. ISBN 978-92-5-107659-0. [Google Scholar]
- Hristov, A.N.; Oh, J.; Firkins, J.L.; Dijkstra, J.; Kebreab, E.; Waghorn, G.; Makkar, H.P.S.; Adesogan, A.T.; Yang, W.; Lee, C.; et al. Special topics-Mitigation of methane and nitrous oxide emissions from animal operations: I. A review of enteric methane mitigation options. J. Anim. Sci. 2013, 91, 5045–5069. [Google Scholar] [CrossRef] [PubMed]
- Hristov, A.N.; Ott, T.; Tricarico, J.; Rotz, A.; Waghorn, G.; Adesogan, A.; Dijkstra, J.; Montes, F.; Oh, J.; Kebreab, E.; et al. Special topics-Mitigation of methane and nitrous oxide emissions from animal operations: III. A review of animal management mitigation options. J. Anim. Sci. 2013, 91, 5095–5113. [Google Scholar] [CrossRef] [PubMed]
- Gerber, P.J.; Mottet, A.; Opio, C.I.; Falcucci, A.; Teillard, F. Environmental impacts of beef production: Review of challenges and perspectives for durability. Meat Sci. 2015, 109, 2–12. [Google Scholar] [CrossRef] [PubMed]
- Alemu, A.W.; Amiro, B.D.; Bittman, S.; MacDonald, D.; Ominski, K.H. Greenhouse gas emission of Canadian cow-calf operations: A whole-farm assessment of 295 farms. Agric. Syst. 2017, 151, 73–83. [Google Scholar] [CrossRef]
- Llonch, P.; Haskell, M.J.; Dewhurst, R.J.; Turner, S.P. Current available strategies to mitigate greenhouse gas emissions in livestock systems: An animal welfare perspective. Animal 2017, 11, 274–284. [Google Scholar] [CrossRef] [PubMed]
- Gil, S.B.; Herrero, M.A.; Flores, M.C.; Pachoud, M.L.; Hellmers, M.M. Intensificación agropecuaria evaluada por indicadores de sustentabilidad ambiental. Arch. Zootec. 2009, 58, 413–423. [Google Scholar] [CrossRef]
- Rearte, D.H. La Producción de Carne en Argentina; INTA. Sitio Argentino de Producción Animal: Córdoba, Argentina, 2007; pp. 1–25. Available online: http://www.produccion-animal.com.ar/informacion_tecnica/origenes_evolucion_y_estadisticas_de_la_ganaderia/00-origenes_evolucion_y_estadisticas_de_la_ganaderia.htm (accessed on 28 September 2018).
- Frasinelli, C.A.; Veneciano, J.H. Introducción. In Sistemas Bovinos Sobre Gramíneas Megatérmicas Perennes en San Luis; Frasinelli, C.A., Veneciano, J.H., Eds.; Ediciones INTA: Buenos Aires, Argentina, 2014; pp. 13–14. ISBN 978-987-521-472-9. [Google Scholar]
- Morris, C.D. Rangeland management for sustainable conservation of natural resources. In Grassland Productivity and Ecosystem Services; Lemaire, G., Hodgson, J., Chabbi, A., Eds.; CABI: Wallingford, UK; Cambridge, MA, USA, 2011; pp. 198–207. ISBN 978-1-84593-809-3. [Google Scholar]
- Herrero, M.; Havlík, P.; Valin, H.; Notenbaert, A.; Rufino, M.C.; Thornton, P.K.; Blümmel, M.; Weiss, F.; Grace, D.; Obersteiner, M. Biomass use, production, feed efficiencies, and greenhouse gas emissions from global livestock systems. Proc. Natl. Acad. Sci. USA 2013, 110, 20888–20893. [Google Scholar] [CrossRef] [PubMed]
- Schacht, W.H.; Reece, P.E. Impacts of livestock grazing on extensively managed grazing lands. In Environmental Impacts of Pasture-Based Farming; McDowell, R.W., Ed.; CABI: Cambridge, MA, USA, 2008; pp. 122–143. ISBN 978-1845934118. [Google Scholar]
- Pereira, H.M.; Leadley, P.W.; Proença, V.; Alkemade, R. Scharlemann, J.P.W.; Fernandez-Manjarrés, J.F.; Araújo, M.B.; Balvanera, P.; Biggs, R.; Cheung, W.W.L.; et al. Scenarios for Global Biodiversity in the 21st Century. Science 2010, 330, 1496–1501. [Google Scholar] [CrossRef] [PubMed]
- DeRamus, H.A.; Clement, T.C.; Giampola, D.D. Dickison, P.C. Methane missions of beef cattle on forages: Efficiency of grazing management systems. J. Environ Qual. 2003, 32, 269–277. Available online: https://pdfs.semanticscholar.org/1d58/15b6d22d81070c173f6281434dd213a557c7.pdf (accessed on 28 September 2018). [CrossRef] [PubMed]
- Guzmán, M.L.; Sager, R. Inventario de metano entérico de los sistemas de producción de carne para San Luis en el año 2009. Rev. Investig. Agropecu. 2013, 39, 88–94. Available online: http://www.scielo.org.ar/pdf/ria/v39n1/v39n1a13.pdf (accessed on 28 September 2018).
- Echeverría, J.C.; Giulietti, J. Precipitación media anual y temperatura del aire. In Aptitud Forestal de la Provincia de San Luis: II Cartografía de Variables Ambientales; Echeverría, J.C., Jobbagy, E., Collado, A., Eds.; INTA: San Luis, Argentina, 2006; pp. 11–13. [Google Scholar]
- Peña Zubiate, C.; Anderson, D.L.; Demmi, M.A.; Saenz, J.L.; D’Hiriart, A. Carta de Suelos y Vegetación de la Provincia de San Luis; Ediciones INTA: Buenos Aires, Argentina, 1998; pp. 1–116. Available online: https://inta.gob.ar/sites/default/files/script-tmp-carta_de_suelos_hoja_san_luis.pdf (accessed on 28 September 2018).
- Anderson, D.L.; De Aguilera, J.A.; Bernardon, A.E. Las formaciones vegetales de la provincia de San Luis. Rev. Investig. Agropecu. 1970, 7, 153–183. [Google Scholar]
- Riedel, J.L.; Frasinelli, C.A. Los sistemas de producción bovina de la provincia de San Luis, Argentina. Oportunidades y desafíos. In Proceedings of the 3rd Simposio Internacional Sobre Producción Animal. Utilización de forrajes en la Nutrición de Rumiantes, Temascaltepec de Gonzáles, México, 6–8 May 2013. [Google Scholar]
- Cocimano, M.; Lange, A.; Menvielle, E. Equivalencias ganaderas para vacunos de carne y ovinos (escalas simplificadas). In Colección Estudios y Métodos, 4th ed.; AACREA: Buenos Aires, Argentina, 1983; pp. 1–32. [Google Scholar]
- IPCC. IPCC Guidelines for National Greenhouse Gas Inventories. Agriculture, Forestry and other Land Use; Eggleston, H.S., Buendia, L., Miwa, K., Ngara, T., Tanabe, K., Eds.; Prepared by the National Greenhouse Gas Inventories Programme; IGES: Kanagawa, Japan, 2006; Volume 4, Chapter 10; pp. 10.1–10.87. ISBN 4-88788-032-4. [Google Scholar]
- Forster, P.; Ramaswamy, V.; Artaxo, P.; Berntsen, T.; Betts, R.; Fahey, D.W.; Haywood, J.; Lean, J.; Lowe, D.C.; Myhre, G.; et al. Changes in Atmospheric constituents and in radiative forcing. In Climate Change 2007: The Physical Science Basis. Contribution of Working Group I to the Fourth Assessment Report of the IPCC; Solomon, S., Qin, D., Manning, M., Chen, Z., Marquis, M., Averyt, K.B., Tignor, M., Miller, H.L., Eds.; Cambridge University Press: Cambridge, UK, 2008; Chapter 2; p. 234. ISBN 978-0521705967. [Google Scholar]
- Cambra-López, M.; García Rebollar, P.; Estellés, F.; Torres, A. Estimación de las emisiones de los rumiantes en España: El factor de conversión de metano. Arch. Zootec. 2008, 57, 89–101. [Google Scholar]
- Aguilera, M. Uso ganadero de los pastizales naturales de San Luis. In Con las metas claras. La Estación Agropecuaria San Luis. 40 años en favor del Desarrollo Sustentable; Aguilera, M.O., Panigatti, J.L., Eds.; Ediciones INTA: Buenos Aires, Argentina, 2003; pp. 89–124. ISBN 978-9875210745. [Google Scholar]
- National Research Council. Nutrient Requirements of Beef Cattle; Seventh Revised Edition: Update 2000; The National Academies Press: Washington, DC, USA, 1996. [Google Scholar]
- McCullagh, P.Y.; Nelder, J. Generalized Linear Models. Monographs on Statistics and Applied Probability 37, 2nd ed.; Chapman and Hall: London, UK, 1989; pp. 1–512. ISBN 978-0412317606. [Google Scholar]
- Burnham, K.P.; Anderson, D.R. Model Selection and Multimodel Inference: A Practical Information-Theoretic Approach, 2nd ed.; Springer: New York, NY, USA, 2002; pp. 1–488. ISBN 978-0387953649. [Google Scholar]
- Burnham, K.P.; Anderson, D.R.; Huyvaert, K.P. AIC model selection and multimodel inference in behavioral ecology: Some background, observations, and comparisons. Behav. Ecol. Sociobiol. 2011, 65, 23–35. [Google Scholar] [CrossRef]
- Tsegaye, D.; Haile, M.; Moe, S.R. The effect of land use on the recruitment and population structure of the important food and fodder plant, Dobera glabra (Forssk.) Poir., in northern Afar, Ethiopia. J. Arid Environ. 2010, 74, 1074–1082. [Google Scholar] [CrossRef]
- Manning, P.; Putwain, P.D.; Webb, N.R. Identifying and modelling the determinants of woody plant invasion of lowland heath. J. Ecol. 2004, 92, 868–881. [Google Scholar] [CrossRef]
- Zar, J.H. Biostatistical Analysis, 4th ed.; Pearson Prentice Hall: Upper Saddle River, NJ, USA, 1999; ISBN 0130823902. [Google Scholar]
- Hair, J.F., Jr.; Black, W.C.; Babin, B.J.; Anderson, R.E. Multivariate Data Analysis. A Global Perspective, 7th ed.; Pearson: London, UK, 2006; pp. 1–785. ISBN 978-1292021904. [Google Scholar]
- Garcia-Martinez, A.; Olaizola, A.; Bernues, A. Trajectories of evolution and drivers of change in European mountain cattle farming systems. Animal 2009, 3, 152–165. [Google Scholar] [CrossRef] [PubMed]
- IBM. IBM SPSS Advanced Statistics 20; IBM: Armonk, NY, USA, 2011. [Google Scholar]
- Sheppard, S.C.; Bittman, S.; Donohoe, G.; Flaten, D.; Wittenberg, K.M.; Small, J.A.; Berthiaume, R.; McAllister, T.A.; Beauchemin, K.A.; McKinnon, J.; et al. Beef cattle husbandry practices across Ecoregions of Canada in 2011. Can. J. Anim. Sci. 2015, 95, 305–321. [Google Scholar] [CrossRef]
- Modernel, P.; Astigarraga, L.; Picasso, V. Global versus local environmental impacts of grazing and confined beef production systems. Environ. Res. Lett. 2013, 8, 035052. [Google Scholar] [CrossRef]
- Nieto, M.I.; Guzmán, M.L.; Steinaker, D. Emisiones de gases de efecto invernadero: Simulación de un sistema ganadero de carne típico de la región central Argentina. Rev. Investig. Agropecu. 2014, 40, 92–101. [Google Scholar]
- Beauchemin, K.A.; Henry Janzen, H.; Little, S.M.; McAllister, T.A.; McGinn, S.M. Life cycle assessment of greenhouse gas emissions from beef production in western Canada: A case study. Agric. Syst. 2010, 103, 371–379. [Google Scholar] [CrossRef]
- Beukes, P.C.; Gregorini, P.; Romera, A.J.; Levy, G.; Waghorn, G.C. Improving production efficiency as a strategy to mitigate greenhouse gas emissions on pastoral dairy farms in New Zealand. Agric. Ecosyst. Environ. 2010, 136, 358–365. [Google Scholar] [CrossRef]
- Bogaerts, M.; Cirhigiri, L.; Robinson, I.; Rodkin, M.; Hajjar, R.; Costa Junior, C.; Newton, P. Climate change mitigation through intensified pasture management: Estimating greenhouse gas emissions on cattle farms in the Brazilian Amazon. J. Clean. Prod. 2016, 162, 1539–1550. [Google Scholar] [CrossRef]
- Casey, J.W.; Holden, N.M. Quantification of GHG emissions from sucker-beef production in Ireland. Agric. Syst. 2006, 90, 79–98. [Google Scholar] [CrossRef]
- Clark, H.; Pinares-Patiño, C.; De Klein, C. Methane and nitrous oxide emissions from grazed grasslands. In Grassland: A Global Resource; McGilloway, D.A., Ed.; Wageningen Academic Publishers: Wageningen, The Netherlands, 2005; pp. 279–293. ISBN 978-90-76998-71-8. [Google Scholar]
- Beauchemin, K.A.; Janzen, H.H.; Little, S.M.; McAllister, T.A.; McGinn, S.M. Mitigation of greenhouse gas emissions from beef production in western Canada—Evaluation using farm-based life cycle assessment. Anim. Feed Sci. Technol. 2011, 166–167, 663–677. [Google Scholar] [CrossRef]
- Veysset, P.; Lherm, M.; Bébin, D.; Roulenc, M.; Benoit, M. Variability in greenhouse gas emissions, fossil energy consumption and farm economics in suckler beef production in 59 French farms. Agric. Ecosyst. Environ. 2014, 188, 180–191. [Google Scholar] [CrossRef]
- Legesse, G.; Beauchemin, K.A.; Ominski, K.H.; McGeough, E.J.; Kroebel, R.; MacDonald, D.; Little, S.M.; McAllister, T.A. Greenhouse gas emissions of Canadian beef production in 1981 as compared with 2011. Anim. Prod. Sci. 2016, 56, 153–168. [Google Scholar] [CrossRef]
- Gerber, P.; Vellinga, T.; Opio, C.; Steinfeld, H. Productivity gains and greenhouse gas emissions intensity in dairy systems. Livest. Sci. 2011, 139, 100–108. [Google Scholar] [CrossRef]
- Bava, L.; Sandrucci, A.; Zucali, M.; Guerci, M.; Tamburini, A. How can farming intensification affect the environmental impact of milk production? J. Dairy Sci. 2014, 97, 4579–4593. [Google Scholar] [CrossRef] [PubMed]
- Moreau, J.; Delaby, L.; Duru, M.; Guerin, G. Advices given about the forage system: Evolutions and conceptions concerning the steps to be taken and the tools to be used. Fourrages 2009, 200, 565–586. [Google Scholar]
- Mugnier, S.; Magne, M.A.; Pailleux, J.Y.; Poupart, S.; Ingrand, S. Management priorities of livestock farmers: A ranking system to support advice. Livest. Sci. 2012, 144, 181–189. [Google Scholar] [CrossRef]
- Pinares-Patiño, C.S.; Waghorn, G.C.; Hegarty, R.S.; Hoskin, S.O. Effects of intensification of pastoral farming on greenhouse gas emissions in New Zealand. N. Z. Vet. J. 2009, 57, 252–261. [Google Scholar] [CrossRef] [PubMed]
- Pickering, N.K.; Oddy, V.H.; Basarab, J.; Cammack, K.; Hayes, B.; Hegarty, R.S.; Lassen, J.; McEwan, J.C.; Miller, S.; Pinares-Patino, C.S.; et al. Animal board invited review: Genetic possibilities to reduce enteric methane emissions from ruminants. Animal 2015, 9, 1431–1440. [Google Scholar] [CrossRef] [PubMed]
- Berndt, A.; Tomkins, N.W. Measurement and mitigation of methane emissions from beef cattle in tropical grazing systems: A perspective from Australia and Brazil. Animal 2013, 7, 363–372. [Google Scholar] [CrossRef] [PubMed]
- Young, J.; Kingwell, R.; Bathgate, A.; Thomoson, A. Agricultural greenhouse gas emission reporting: The implications for farm management. Agroecol. Sustain. Food Syst. 2016, 40, 261–276. [Google Scholar] [CrossRef]
- Lal, R. Soil carbon sequestration impacts on global climate change and food security. Science 2004, 304, 1623–1627. [Google Scholar] [CrossRef] [PubMed]
- Follet, R.F.; Schuman, G.E. Grazing land contribution to carbon sequestration. In Grassland: A Global Resource; McGilloway, D.A., Ed.; Wageningen Academic Publishers: Wageningen, The Netherlands, 2005; pp. 265–277. ISBN 978-90-76998-71-8. [Google Scholar]
- Soussana, J.F.; Tallec, T.; Blanfort, V. Mitigation the greenhouse gas balance of ruminant production through carbon sequestration in grasslands. Animal 2010, 4, 334–350. [Google Scholar] [CrossRef] [PubMed]
- Schils, R.L.M.; Verhagen, A.; Aarts, H.F.M.; Sebek, L.B.J. A farm level approach to define successful mitigation strategies for GHG emissions from ruminant livestock systems. Nutr. Cycl. Agroecosyst. 2005, 71, 163–175. [Google Scholar] [CrossRef]
- Pelletier, N.; Pirog, R.; Rasmussen, R. Comparative life cycle environmental impacts of three beef production strategies in the upper midwestern United States. Agric. Syst. 2010, 103, 380–389. [Google Scholar] [CrossRef]
- Zhuang, M.H.; Gongbuzeren; Li, W.J. Greenhouse gas emission of pastoralism is lower than combined extensive/intensive livestock husbandry: A case study on the Qinghai-Tibet Plateau of China. J. Clean. Prod. 2017, 147, 514–522. [Google Scholar] [CrossRef]
- Salvador, S.; Corazzin, M.; Romanzin, A.; Bovolenta, S. Greenhouse gas balance of mountain dairy farms as affected by grassland carbon sequestration. J. Environ. Manag. 2017, 196, 644–650. [Google Scholar] [CrossRef] [PubMed]
© 2018 by the authors. Licensee MDPI, Basel, Switzerland. This article is an open access article distributed under the terms and conditions of the Creative Commons Attribution (CC BY) license (http://creativecommons.org/licenses/by/4.0/).