Public Value of Marine Biodiesel Technology Development in South Korea


Department of Energy Policy, Graduate School of Energy & Environment, Seoul National University of Science & Technology, 232 Gongreung-Ro, Nowon-Gu, Seoul 01811, Korea
*
Author to whom correspondence should be addressed.
Sustainability 2018, 10(11), 4252; https://doi.org/10.3390/su10114252
Submission received: 22 September 2018
/
Revised: 5 November 2018
/
Accepted: 6 November 2018
/
Published: 17 November 2018
(This article belongs to the Special Issue Biofuels–Bioenergy Waste to Value Added Feedstock)
Abstract
:Biodiesel (BD) is often regarded as a carbon-neutral fuel. Many countries are investing resources in biodiesel technology development to respond to the need to improve energy sustainability and the threat of climate change. Since 2009, the South Korean Government has invested a considerable amount of money in developing marine BD (MBD) technology that converts carbon dioxide into diesel using marine microalgae cultivated in large quantities with the help of waste heat from nuclear power plants and/or coal-fired power plants. If the development is successful, 4800 tons of MBD a year, approximately 1820 cars fully fueled annually, will be produced from 2019. Furthermore, the South Korean Government is expected to continue to invest in MBD to improve the market share after 2019. Quantitative information about the public value of MBD technology development is widely demanded by the Government. This study aims to investigate the public value of MBD technology, the attributes of which it considers to be the reduction of greenhouse gas emissions, the mitigation of air pollutant emissions, new job creation, and the improvement of energy security. A choice experiment (CE) survey of 600 people was conducted during July 2016. The trade-offs among the attributes and the price were evaluated in the survey. The CE data were examined through a multinomial logit model. The marginal values for a 1%p reduction of greenhouse gas emissions, 1%p mitigation of air pollutant emissions, the creation of 100 new jobs, and an improvement of energy security caused by MBD technology development are computed to be KRW 1082.7 (USD 0.9), 918.1 (0.8), and 258.3 (0.2) per household per month, respectively.
1. Introduction
A number of countries have been working to reduce greenhouse gas (GHG) emissions in response to climate change since they reached an international agreement in Paris in 2016. In particular, power generation and transportation are major sources of GHG emissions. For example, fossil fuel used for power generation and transportation is the largest emitter of GHG in the United States [1]. Therefore, switching fuel to renewable energy, which emits less carbon dioxide than petroleum fuels, is recommended. Biodiesel (BD) is an obvious candidate for renewable energy. Since diesel mixed with BD is supplied in South Korean diesel stations, securing the stability of BD is becoming an important task. South Korea is interested in developing marine BD (MBD) because it is surrounded by the sea on three sides. MBD is made from microalgae that absorb carbon dioxide through photosynthesis and produce biodiesel and oxygen [2]. The government is using waste heat from nuclear power plants and coal-fired power plants to mass-produce the microalgae needed for BD. Although it does not extract BD directly from waste, MBD is considered an environmentally friendly alternative to regular diesel as it uses waste heat to produce BD. It can replace or blend with petroleum diesel with little or no engine modification, and it produces fewer air pollutant emissions than fossil fuel [3,4].
If the mass production of MBD is successful, it is expected that it will be able to secure BD more reliably. Thus, the South Korean Government has invested a considerable amount of money and resources in developing MBD technology since 2009. In particular, KRW 49.0 billion (USD 41.8 million) has been and will be invested from 2009 to 2018. The Government plans to expand the capacity of its marine algae cultivation facility to 200 hectares to increase the MBD production. After the development of this technology, 4800 tons of MBD will be produced annually from 2019 to fuel about 1820 cars a year in full [5]. According to the national long-term plan for Korea’s ocean and fisheries research and development (R&D) launched in 2018 [6], the Government has a roadmap to facilitate the industrialization of MBD technology until 2022.
It is expected that a policy and additional investment for improving the market share of MBD will be executed in South Korea. The South Korean policy of a biodiesel mandate with a minimum rate of 2% biodiesel mixed with petroleum fuel for transportation was introduced in 2012; it was increased to 2.5% in 2015 and is expected to continuously increase further. However, it is possible that difficulties will arise in maintaining the investment of a considerable amount of money and resources in MBD technology development in the long term because of the considerable financial burden. Thus, to continue to expand the supply of MBD, alternative policies should be considered and the public preferences for MBD technology development should be clarified. It is with regard to such situations that this study aims to examine the public preference for the attributes of MBD technology development to provide policy makers and stakeholders with important quantitative information.
Many previous studies have focused on the evaluation of renewable energy sources [7,8,9,10,11,12,13,14,15,16]. However, few studies have examined the public value of MBD technology development. Gracia et al. [17] explored consumers’ willingness to pay (WTP) for biodiesel in Spain using a choice experiment (CE) approach. The study considered four attributes: biodiesel, biodiesel with a sustainable label, availability in petrol stations, and place of production in Europe or elsewhere; the marginal WTP in euros of the four attributes was 0.068, 0.083, 0.115, and 0.011, respectively. In addition, they discovered that consumers’ premium for biodiesel amounted to 6% of the current price for conventional diesel.
The CE approach is widely used to evaluate new products or services with multiple characteristics, like MBD technology, in South Korea. This article employs CE to examine the public value of MBD technology development considering four attributes: the reduction of GHG emissions, the mitigation of air pollutant emissions, job creation, and the improvement of energy security. The rest of this article consists of four sections. The methods employed in the article are described in Section 2. The models applied are explained in Section 3. The penultimate section presents and discusses the results. The conclusions are reported in the final section.
2. Methodology
2.1. Method: CE
Two techniques that have been widely employed for nonmarket good valuation in the literature are the CE method and contingent valuation (CV) [18,19,20,21,22,23]. The CE method asks respondents to evaluate value trade-offs among some attributes and indirectly derives their willingness to pay (WTP). Usually, the CV method is applied to a single-attribute good while the CE method is applied to a multi-attribute good [24,25,26,27,28]. The CE approach is theoretically grounded in the random utility maximization model. The model implies that if an individual chooses one alternative among several, the utility arising from the alternative is always greater than the utility arising from the other alternatives. Therefore, the application of the approach requires a survey of potential consumers. The CE method is useful for estimating the relative values of different attributes of an environmental and nonmarket good or new product [29,30,31].
In general, respondents are required to choose their preferred alternative out of several alternatives, which includes a current status alternative, presented to them in the CE survey. Each alternative comprises several attributes of concern, including the price attribute. CE is a useful method for estimating the relative importance of several attributes of a good or service. The marginal WTP (MWTP) for increasing or decreasing the level of each attribute can be obtained by analyzing the data on respondents’ choices and then interpreting or utilizing the results.
2.2. Attributes
The purpose of investment in BD technology by the South Korean Government can be divided into environmental aspects and social aspects. Regarding the environmental aspect, BD can emit less GHG and particulate matter than conventional diesel [32]. Moreover, social effects are expected from MBD technology. According to the ocean and fisheries research and development (R&D) roadmap to 2020 [33], MBD is selected as a major technology for renewable energy. In addition, it is regarded as an industrialization-focused area, and a major goal of industrialization areas is job creation. It is expected to create 78,000 jobs by 2020, mainly through seven ocean technologies, including MBD technology. Furthermore, energy security is an important issue in South Korea. According to the policy of the biodiesel mandated mixture rate in fuel, the demand for biodiesel is expected to increase continuously. However, almost all biodiesel in South Korea is currently imported. Therefore, MBD technology development is necessary to reduce the portion of imported biodiesel for the energy security aspect.
The first step in applying the CE method is to define some appropriate attributes and determine their levels. They should be easily definable and describable for researchers, meaningful and independent for policy makers, and understandable and persuasive for respondents. As shown in Table 1, the four attributes that were finally derived from these criteria are: reduction of GHG emissions, mitigation of air pollutant emissions, job creation, and improvement of energy security. The descriptions and levels of each, and the increase in the monthly transportation expenditure as a price attribute are also reported in Table 1. The baseline for MBD technology development in this study is the status quo in 2016. Currently, this technology is at the stage of R&D that has not yet contributed to environmental and social aspects. Therefore, the status quo of reduction of GHG emissions, mitigation of air pollutant emissions, and job creation is zero. Energy security shows no improvement. Price means the additional transportation expenditure that households are willing to bear for MBD technology development.
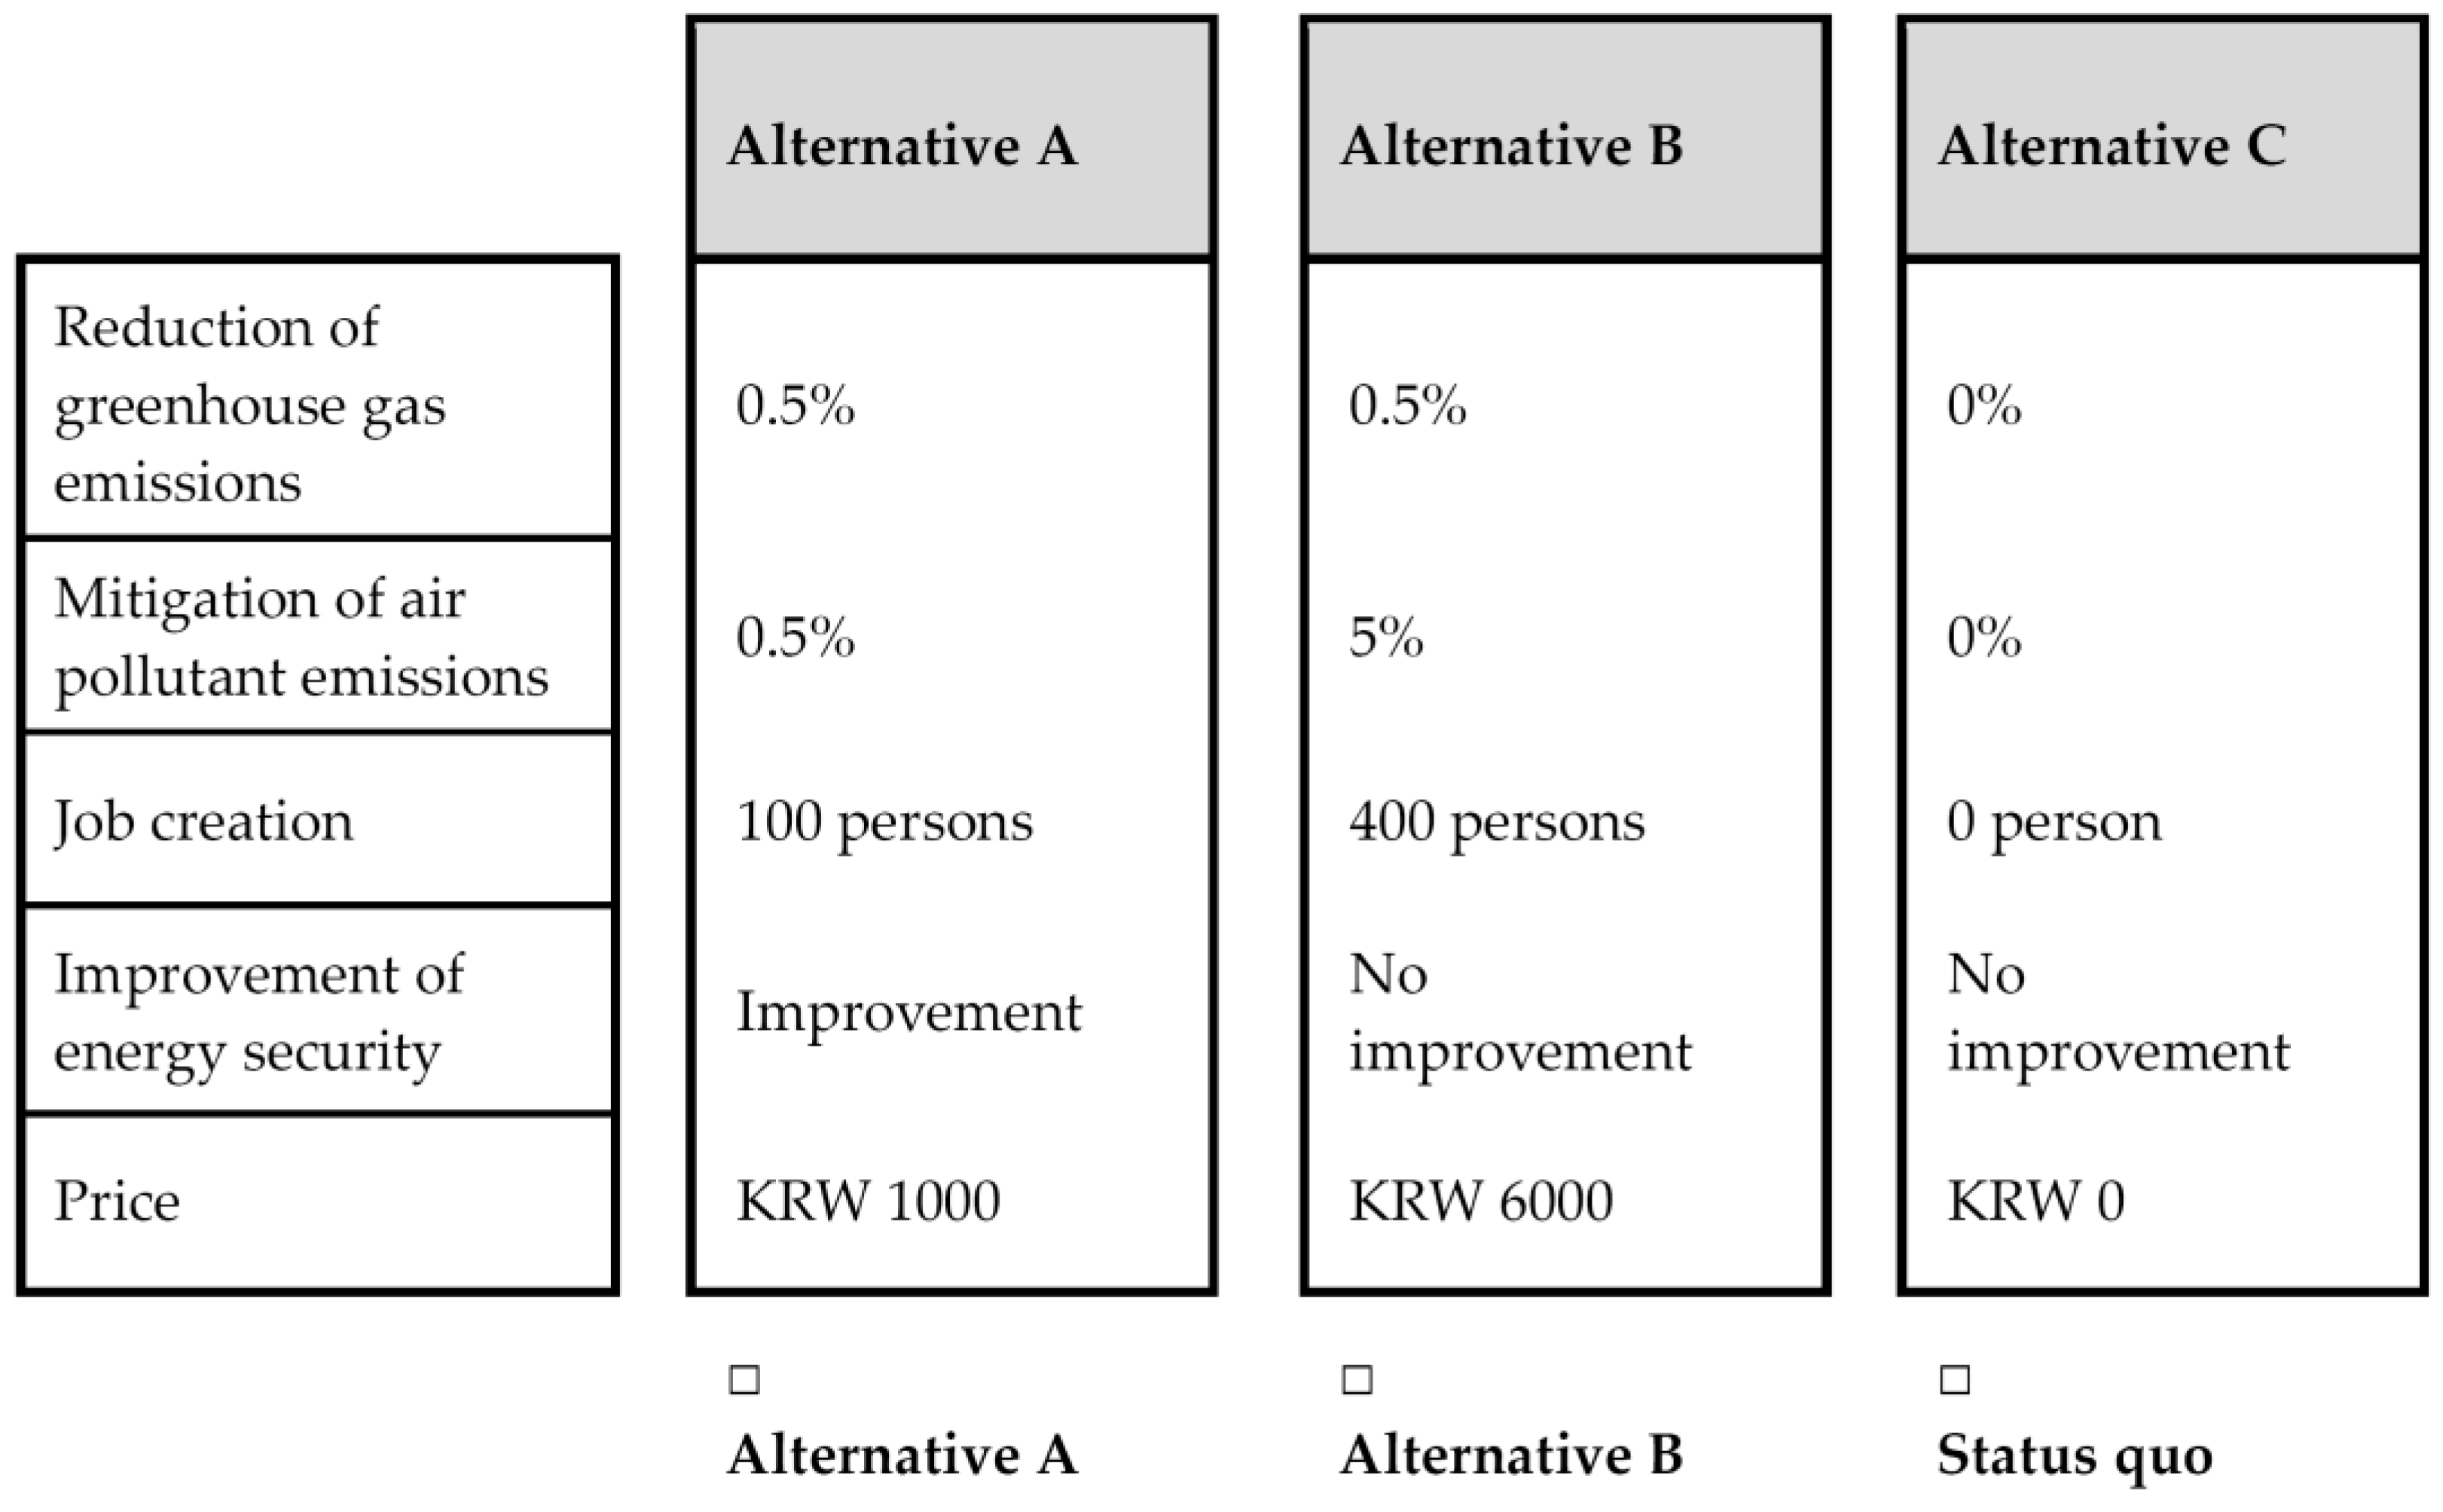
The number of possible alternatives generated from Table 1 amounts to 640. However, it is not necessary or appropriate to present all these alternatives to the respondents because of the respondents’ bounded rationality and time/cost constraints. Therefore, a main effect orthogonal design was applied to choose only 16 alternatives [34]. They were randomly mixed and then divided into eight sets of two options. Each choice set was made up of two alternatives and the current status alternative. Each respondent would randomly belong to one of the two groups. Four choice sets were offered to each interviewee. The interviewers asked the respondents to choose one preferred alternative among the three alternatives within each choice set. The main part of the survey questionnaire in this study is given in Appendix A. Figure A1 is an example of choice card we present to the respondents.
One more point to address here is the difference between this study and the one by Gracia et al. [17]. The message of the first is different from that of the second in two respects. First, this paper deals with the WTP for developing MBD technology, whereas Gracia et al. [17] analyzed the premium, the additional WTP, for biodiesel versus conventional diesel. Second, the properties of the MBD produced in Korea differ from those of biodiesel produced in Europe. Gracia et al. [17] assessed general biodiesel without land or marine distinction. Biodiesel can be divided into land biodiesel and MBD depending on the raw materials. Land-based biodiesel is made using rapeseed plants, such as corn, soybeans, and soybean oil, and MBD is made from microalgae that live in the sea. Land-based biodiesel faces problems such as rising grain prices and natural destruction.
On the other hand, MBD using marine microalgae purifies seawater by ingesting nutrients from the eutrophic sea. Microalgae can produce more than 20 times more biofuel than land plants due to their excellent productivity per unit area. Since marine microalgae grow only with sunlight, water, and carbon dioxide, they are suitable for production in South Korea, where the land is narrow and surrounded by the sea on three sides. Because the content to be derived from the two studies is different, the attributes should also be different.
2.3. Survey Instrument and Method
There are three parts in the survey instrument. Several questions about the MBD make up the first part to check respondents’ perceptions before the CE survey on MBD begins in earnest. To facilitate the respondents’ understanding, a description of the features and effects of MBD is provided, along with color photographs, in this section. Such work not only relieves respondents of the burden of a fully-fledged survey but also provides significant statistical data in itself. Explanations about the attributes and questions concerning the value trade-off work, which are conventionally required in a CE survey, are presented in the second part. The third part contains questions about the respondents’ socio-economic information.
Rather than recklessly increasing the sample size, it is important for researchers to determine an appropriate size of sample in accordance with various research situations such as the number of variables, data collection methods, limited survey period, or budget constraint. For example, this study adopted person-to-person interviewing instead of mail or telephone interviewing because the information presented to the respondents is difficult to convey through mail or telephone, which requires significantly higher costs than mail or telephone surveys. Furthermore, to ensure randomness of the sample, the interviewers visited the respondents’ homes rather than crowded places such as shopping malls, which was more expensive than regular person-to-person interviews. Finally, we decided on the sample size of 600, taking into account such various factors.
A random sampling method was commissioned by an expert who was affiliated with a professional survey firm; the sampling reflected the population characteristics observed from a census by Statistics Korea from the Korean National Statistical Office. More specifically, stratified random sampling was conducted. The survey firm performed a random sampling and field CE survey during July 2016. According to Statistics Korea, there were 19,284,671 households in Korea in 2016. In order to draw a random sample of this population, stratified random sampling was conducted by the polling firm. A random sampling was conducted within fifteen strata: Seoul, Pusan, Daegu, Incheon, Gwangju, Daejeon, Ulsan, Gyunggi, Gangwon, Chungbuk, Chungnam, Jeonbuk, Jeonnam, Gyungbuk, and Gyungnam. The sizes of stratum for Seoul, Pusan, Daegu, Incheon, Gwangju, Daejeon, Ulsan, Gyunggi, Gangwon, Chungbuk, Chungnam, Jeonbuk, Jeonnam, Gyungbuk, and Gyungnam were 137, 47, 32, 35, 20, 20, 11, 146, 16, 14, 19, 20, 14, 31, and 38, respectively. The sampling within each stratum reflected each stratum’s population characteristics such as age, income, and gender.
3. Model
3.1. Utility Function
The levels of the four attributes and price are defined as Xt, where t = 1, 2, 3, 4, p. Furthermore, we consider the alternative-specific constant, ASC, which is defined as 1 if the interviewee chooses the status quo alternative from among the three alternatives and 0 otherwise. Let Vil be the utility for interviewee j who chooses alternative l. The utility function is formulated as:
where Wjl and εjl are the deterministic and stochastic parts of the utility function, respectively; Xjl is a vector containing the levels of the attributes for alternative l given to respondent j; Tj is respondent j’s characteristics, such as ASC; and the β’s are the coefficients that correspond to each attribute.
Omitting jl for simplicity, we can apply Roy’s identity to Equation (1) and derive the MWTP estimate, MWTPXt, as:
3.2. Obtaining the Utility Function
Estimating the utility function implies estimating β’s. The multinomial logit (MNL) model suggested by McFadden [35] has been most widely applied to obtain β in the literature. However, the MNL model inevitably assumes independence from irrelevant alternatives. Although the assumption seems to be somewhat restrictive, it has the advantage of enabling us to specify the log-likelihood function as a closed form. Thus, if the assumption is met, we can easily tackle the CE data. Let J be the number of interviewees and Ijl be a dummy variable that is defined as 1 if interviewee j selects alternative l; otherwise, Ijl is 0. The log-likelihood function for our MNL model is:
4. Results
4.1. Data
Each of 600 interviewees provided four responses to the CE questions. Thus, we would obtain a dataset of 2400 (600 × 4) observations. The respondents were made up of householders or housewives aged over 20 and under 65 years to reflect the characteristics of their household. Prior to conducting the main survey, 30 people were surveyed in advance to help raise respondents’ understanding of the questionnaire. Table 2 summarizes the interviewees’ responses. Of the total 2400 responses, the number of responses for the chosen alternatives A, B, and status quo alternative was 1068, 862, and 470, respectively.
Table 3 reports the definitions and sample statistics for some socio-demographical variables of the respondents. We selected four variables: metro, gender, age, and education. Since about half of South Korea’s population lives in the metropolitan area, a variable, metro, which identifies whether or not to live in the metropolitan area was introduced. Gender, age, and education can also affect the outcomes of the choice experiments. These four variables will be used for estimating the model with covariates.
4.2. Estimation Results of the Model
The results of estimating the MNL model with covariates are shown in Table 4. To understand the average impact of the utility of elements not observed in the model, we introduced the ASC. ASCA and ASCB were alternative-specific constants, which indicated dummy variables for a respondent’s selection of alternatives A and B, respectively. As the marginal level of each attribute from the baseline state rose, the utility for the South Korean public increased. Interestingly, the coefficient estimates for reduction of GHG emissions, mitigation of air pollutant emissions, job creation, and improvement of energy security had positive signs. The estimated coefficient for the price was negative. This implies that, as the price increases, the utility decreases. This result is quite reasonable, given that the price contributes negatively to the utility.
The list of selected covariates is given in Table 3. Each covariate term is expressed as the product of ASC0 and each covariate. All the estimated coefficients for the covariates except for ASC0×Metro term are not statistical meaningfulness at the 1% level. The coefficient estimate for ASC0×Metro term has a positive sign, which implies that respondent’s utility for the status quo alternative increases with the respondents’ living in the metropolitan area. As a measure of goodness-of-fit for the model, McFadden [35] proposed the pseudo-R2 for the MNL model. It is computed as 1-(lnL1/lnL0) where lnL1 and lnL0 indicate the log-likelihood for the MNL model with all the variables including ASC terms and the log-likelihood for the MNL model with just ASC terms, respectively. The pseudo-R2 for the MNL model was computed to be 0.033. This value is rather low. However, the Wald statistic for the null hypothesis that all the parameters were zero was calculated to be 345.27 and its p-value was 0.000. Consequently, the null hypothesis was rejected at the 1% level and thus the MNL model was statistically meaningful.
4.3. MWTP Estimates for Each Attribute
Finally, the MWTP for a decrease or an increase in the level of each attribute could be estimated by employing Equation (2). In the estimation, the MWTP estimates from the model without covariates were employed because MWTP estimates can vary depending on the choice of a set of covariates. The results of estimating the MNL model without covariates are reported in Table 5. The pseudo-R2 for the MNL model was computed to be 0.021, which was lower than the pseudo-R2 for the MNL model with covariates (0.033). The Wald statistic for the null hypothesis that all the parameters were zero was estimated to be 325.01 and its p-value was 0.000. Consequently, the null hypothesis was rejected at the 1% level and thus the MNL model was also statistically meaningful.
In order to obtain the MWTP estimates, we use the results given in Table 5 instead of those in Table 4. Table 6 provides the results of the MWTP value estimations and their confidence intervals calculated using Krinsky and Robb’s [36] method. The household MWTP estimates for a 1%p reduction of GHG emissions, a 1%p mitigation of air pollutant emissions, and the creation of jobs were reflected as increases of KRW 1082.7 (USD 0.9), KRW 918.1 (USD 0.8), and KRW 258.3 (USD 0.2), respectively, in the monthly transportation expenditure. The MWTP for the reduction of GHG emissions, mitigation of air pollutant emissions, and job creation were statistically meaningful at the 1% level. These values were interpreted as the public value of MBD technology development in South Korea.
4.4. Scenarios of MBD Technology Development
Using the results presented in Table 6, we can estimate the value that the public places on MBD technology development. In other words, multiplying the figures reported in Table 6 by the levels of attributes gives us the value of a scenario for MBD technology development. The next step is to expand this value on a national scale. When the survey was conducted, South Korea had 19,284,671 households [37]. However, the number of observations used here was just 600. Therefore, the representativeness of our sample should be examined. That is, whether our sample represents the population well or not is the key to obtaining information for the population. This study tried to look into the issue in two aspects before the expansion is performed. First, random and scientific sampling in gathering the data is quite important to the expansion. As explained above, a professional survey company that has rich experience of field CE surveys commissioned the entire process of the sampling, thereby guaranteeing that the sample maintains the representative nature.
Second, whether some variables for the sample were similar to those for the population or not should be examined. In this regard, the ratio of female respondents, the household’s monthly income, and the size of the household are looked into here. The sample averages for the variables were 50.0%, KRW 4.33 million, and 3.31 persons. The population averages were 49.9%, KRW 4.37 million, 3.17 persons when the survey was conducted [37]. Interestingly, it seems that there were no significant gaps between the two values for each variable. This finding makes the representativeness of our sample even stronger. Thus, the findings from the sample can be expanded to the inference of the population values.
As an illustration, the results of calculating the national value at which the public assess several hypothetical scenarios for MBD technology development are shown in Table 7. For example, the value of the second scenario with a 3%p reduction of GHG emissions, 0.5%p mitigation of air pollutants, the creation of 400 jobs, and no improvement of energy security was computed as KRW 4740 (USD 4.2) per household per month. Table 7 also provides the annual aggregate value for each scenario using the total number of households. We compute the annual aggregate value of the second scenario as KRW 1097 billion (USD 961 million) when we multiply the number of total households in 2016 by the yearly public value estimates obtained from the table.
5. Conclusions
The South Korean Government has invested a considerable amount of money and resources in developing MBD technology that converts carbon dioxide into diesel through marine microalgae since 2009. The marine microalgae will be cultivated in large quantities with the help of waste heat from nuclear power plants and/or coal-fired power plants. If the development is successful, 4800 tons of MBD a year, approximately 1820 cars fully fueled annually, will be produced by 2019. This study investigated the public value for MBD technology development in South Korea and estimated the monetary value of individual attributes of MBD technology development using the data from a nationwide survey of 600 households. For this purpose, four attributes were investigated—reduction of GHG emissions, mitigation of air pollutant emissions, job creation, and improvement of energy security—considering the heterogeneity of respondents’ preferences for individual attributes. The results indicate that the South Korean public expresses a deep interest in MBD technology development and places significant value on the attributes of MBD technology development.
Due to the monopolization of MBD technology development by developed countries and the fierce competition, the actual MBD technology development is difficult in countries other than developed countries. In countries such as South Korea, where microalgae-derived BD production technology is at an early stage, the investment in technical research is insufficient. These countries lack the foundation to invest in large-scale R&D compared with developed countries. We found that the South Korean public revealed significant WTP for MBD technology development. This can be a tool for policy makers to identify opportunities to advance MBD technology development in South Korea. Moreover, we could not find any previous studies that evaluated the public value of MBD technology development in the literature. These are interesting aspects of this study, although it does not provide technically and/or methodologically innovative findings.
The authors think that the framework of the study should be extended in future studies in the following ways. This study is limited to South Korea and the result of this study is expected to be highly state/region dependent. Therefore, investigating how much the value changes across the regions and identifying other geographic factors which affect the value are also a good research topic. Furthermore, it is necessary to examine how the value varies as time passes by conducting the CE survey every year for some years and analyzing the CE data. Comparing the findings from this study with those from other studies for foreign countries and analyzing the gap between the two enable us to obtain a new insight into the WTP estimate. These works can provide us with a new point of view concerning the public value.
Author Contributions
All the authors participated in the writing of this paper. J.K. collected and compiled the necessary background data for the study and prepared the CE questionnaire; H.-J.K. wrote a large part of the paper and educated the interviewers; and S.-H.Y. performed statistical analysis and supervised the entire process of writing the paper.
Acknowledgments
This research was part of the project titled “Marine ecosystem-based analysis and decision-making support system development for marine spatial planning”, funded by the Korean Ministry of Oceans and Fisheries (grant number 20170325). In addition, this work was supported by the Korea Institute of Energy Technology Evaluation and Planning (KETEP) and the Ministry of Trade, Industry & Energy (MOTIE) of the Republic of Korea (No. 20184030202230).
Conflicts of Interest
The authors declare no conflict of interest.
Appendix A. Main Part of the Survey Questionnaire
Appendix A.1. Questions about Socio-Economic Characteristics
The interviewees were asked to respond to their socio-economic characteristics such as the gender of the individual, the number of family members, the level of education, and the monthly income per household (before tax deduction). Questions about the number of family members and income were open-ended questions, and the question about the level of education was as follows:
Q1. Please check with a √ your education level in years.
| Education Level | Uneducated | Elementary School | Middle School | High School | University | Graduate School |
| Education level in years | 0 | 1 2 3 4 5 6 | 7 8 9 | 10 11 12 | 13 14 15 16 | 17 18 19 20 |
Appendix A.2. Questions about Marginal Willingness to Pay
Type A. Q1. Check with the only available alternative that you prefer among Alternative A, B or the status quo.
Figure A1.
A sample choice set used in this study.

References
- United States Environmental Protection Agency. Sources of Greenhouse Gas Emissions. Available online: https://www.epa.gov/ghgemissions/sources-greenhouse-gas-emissions (accessed on 15 March 2018).
- Korea Ministry of Oceans and Fisheries. Annual Report of Development of Bio-Diesel Production Technology Using Marine Microalgae Project: Sejong-si, Korea 2015. Available online: http://www.mof.go.kr (accessed on 20 February 2018). (In Korean)
- Korea Development Institute. National eEconomy: Commercialization of Bio-Diesel Using Marine Microalgae in 2019. Available online: https://eiec.kdi.re.kr/publish/nara/commentary/view.jsp?idx=10076 (accessed on 2 February 2018).
- EU Marine Biotechnology ERA-NET. Marine Biotechnology Securing Alternative Sources of Renewable Energy. Available online: http://www.marinebiotech.eu/wiki/Marine_Biotechnology_securing_alternative_sources_of_renewable_Energy (accessed on 18 August 2017).
- Korea Ministry of Oceans and Fisheries. Success of Driving Test with Marine Bio-Diesel Fuel from Seoul to Busan: Sejong-si, Korea 2015. Available online: http://www.mof.go.kr (accessed on 8 February 2018). (In Korean)
- Korea Ministry of Oceans and Fisheries. Final Report of National Long Term Plan for Ocean and Fisheries R&D: Sejong, Korea 2018. Available online: http://www.mof.go.kr (accessed on 10 August 2018). (In Korean)
- Farhar, B.C. Willingness to Pay for Electricity from Renewable Resources: A Review of Utility Market Research; U.S. Department of Energy; National Renewable Energy Laboratory: Washington, DC, USA, 1999.
- Scarpa, R.; Willis, W. Willingness-to-pay for renewable energy: Primary and discretionary choice of British households’ for micro-generation technologies. Energy Econ. 2009, 32, 129–136. [Google Scholar] [CrossRef]
- Ku, S.J.; Yoo, S.H. Willingness to pay for renewable energy investment in Korea: A choice experiment study. Renew. Sustain. Energy Rev. 2010, 14, 2196–2201. [Google Scholar] [CrossRef]
- Sabah, A.; Wilner, J. Willingness to pay for renewable energy: Evidence from a contingent valuation survey in Kenya. Renew. Sustain. Energy Rev. 2011, 15, 2974–2983. [Google Scholar]
- Lim, S.Y.; Lim, K.M.; Yoo, S.H. External benefits of waste-to-energy in Korea: A choice experiment study. Renew. Sustain. Energy Rev. 2014, 34, 588–595. [Google Scholar] [CrossRef]
- Kwak, S.Y.; Yoo, S.H. The public’s value for developing ocean energy technology in the Republic of Korea: A contingent valuation study. Renew. Sustain. Energy Rev. 2015, 43, 432–439. [Google Scholar] [CrossRef]
- Kim, H.Y.; Park, S.Y.; Yoo, S.H. Public acceptability of introducing a biogas mandate in Korea: A contingent valuation study. Sustainability 2016, 8, 1087. [Google Scholar] [CrossRef]
- Kim, H.J.; Lim, S.Y.; Yoo, S.H. The Korean public’s willingness to pay for expanding the use of solid refuse fuel. Renew. Sustain. Energy Rev. 2017, 72, 821–827. [Google Scholar] [CrossRef]
- Lee, M.K.; Lee, C.Y.; Yoo, S.H. Willingness to pay for replacing traditional energies with renewable energy in South Korea. Energy 2017, 128, 284–290. [Google Scholar] [CrossRef]
- Lim, S.Y.; Kim, H.J.; Yoo, S.H. Public’s willingness to pay a premium for bioethanol in Korea: A contingent valuation study. Energy Policy 2017, 101, 20–27. [Google Scholar] [CrossRef]
- Gracia, A.; Barreiro-Hurlé, J.; Pérez, Y. Consumers’ willingness to pay for biodiesel in Spain. In Proceedings of the Presentation at the EAAE 2011 Congress Change and Uncertainty Challenges for Agriculture, Food and Natural Resources, Zurich, Switzerland, 30 August–2 September 2011; Volume 30, pp. 1–13. [Google Scholar]
- Min, S.H.; Lim, S.Y.; Yoo, S.H. Consumer’s willingness to pay a premium for eco-labeled LED TVs in Korea: A contingent valuation study. Sustainability 2017, 9, 814. [Google Scholar]
- Park, S.Y.; Lim, S.Y.; Yoo, S.H. The economic value of the national meteorological service in the Korean household sector: A contingent valuation study. Sustainability 2016, 8, 834. [Google Scholar] [CrossRef]
- Lim, S.Y.; Kim, H.Y.; Yoo, S.H. Public willingness to pay for transforming Jogyesa Buddhist temple in Seoul, Korea into a cultural tourism resource. Sustainability 2016, 8, 900. [Google Scholar] [CrossRef]
- Wang, J.; Ge, J.; Ma, Y. Urban Chinese consumers’ willingness to pay for pork with certified labels: A discrete choice experiment. Sustainability 2018, 10, 603. [Google Scholar] [CrossRef]
- Yang, H.J.; Lim, S.Y.; Yoo, S.H. The environmental costs of photovoltaic power plants in South Korea: A choice experiment study. Sustainability 2017, 9, 1773. [Google Scholar] [CrossRef]
- Vanstockem, J.; Vranken, L.; Bleys, B.; Somers, B.; Hermy, M. Do looks matter? A case study on extensive green roofs using discrete choice experiments. Sustainability 2018, 10, 309. [Google Scholar] [CrossRef]
- Madden, G.; Simpson, M. Residential broadband subscription demand: An econometric analysis of Australian choice experiment data. Appl. Econ. 1997, 29, 1073–1078. [Google Scholar] [CrossRef] [Green Version]
- Baarsma, B.E. The valuation of the Ijmeer nature reserve using conjoint analysis. Environ. Resour. Econ. 2003, 25, 343–356. [Google Scholar] [CrossRef]
- Yoo, S.H.; Kwak, S.J.; Lee, J.S. Using a choice experiment to measure the environmental costs of air pollution impacts in Seoul. J. Environ. Manag. 2008, 86, 308–318. [Google Scholar] [CrossRef] [PubMed]
- Banfi, S.; Filippini, M.; Horehájová, A. Using a choice experiment to estimate the benefits of a reduction of externalities in urban areas with special focus on electrosmog. Appl. Econ. 2012, 44, 387–397. [Google Scholar] [CrossRef] [Green Version]
- Tarfasa, S.; Brouwer, R. Estimation of the public benefits of urban water supply improvements in Ethiopia: A choice experiment. Appl. Econ. 2013, 45, 1099–1108. [Google Scholar] [CrossRef]
- Garrod, G.D.; Willis, K.G. The non-use benefits of enhancing forest biodiversity: A contingent ranking study. Ecol. Econ. 1997, 21, 45–61. [Google Scholar] [CrossRef]
- Ida, T.; Kinoshita, S.; Sato, M. Conjoint analysis of demand for IP telephony: The case of Japan. Appl. Econ. 2008, 40, 1279–1287. [Google Scholar] [CrossRef]
- Ida, T. Beyond mobile number portability: Measuring consumer preferences for service portability in Japan’s mobile phone market. Appl. Econ. 2012, 44, 3357–3369. [Google Scholar] [CrossRef]
- Pacific Biodiesel. A Clean Burning Alternative Fuel from Renewable Resources. 2017. Available online: http://www.biodiesel.com/biodiesel/faq/ (accessed on 8 February 2017).
- Korea Ministry of Oceans and Fisheries. Ocean and Fisheries R&D Roadmap for 2020. Available online: http://www.mof.go.kr (accessed on 8 February 2017). (In Korean)
- SPSS. SPSS Conjoint 14.0; SPSS Inc.: Chicago, IL, USA, 2005. [Google Scholar]
- McFadden, D. Conditional logit analysis of qualitative choice behaviour in frontiers in econometrics. In Frontiers in Econometrics; Zarembka, P., Ed.; Academic Press: New York, NY, USA, 1973; pp. 105–142. [Google Scholar]
- Krinsky, I.; Robb, A.L. On approximating the statistical properties of elasticities. Rev. Econ. Stat. 1986, 68, 715–719. [Google Scholar] [CrossRef]
- Statistics Korea. Available online: http://kosis.kr (accessed on 20 October 2017).

Table 1.
Attributes adopted in this study.
| Attributes | Descriptions | Levels |
|---|---|---|
| Reduction of greenhouse gas emissions | Percentage of decrease in the amount of greenhouse gas emissions | Level 1: 0% # |
| Level 2: 0.5% | ||
| Level 3: 1.5% | ||
| Level 4: 3.0% | ||
| Mitigation of air pollutant emissions | Percentage of mitigation of the amount of air pollutants | Level 1: 0% # |
| Level 2: 0.5% | ||
| Level 3: 2.0% | ||
| Level 4: 5.0% | ||
| Job creation | New creation of employment | Level 1: 0 person # |
| Level 2: 100 persons | ||
| Level 3: 400 persons | ||
| Level 4: 1000 persons | ||
| Improvement of energy security | Improvement of energy security | Level 1: No improvement # |
| Level 2: Improvement | ||
| Price | Willingness to pay for blending marine biodiesel with diesel with the monthly additional transportation expenditure per person (unit: Korean won) | Level 1: 0 # |
| Level 2: 1000 | ||
| Level 3: 3000 | ||
| Level 4: 6000 | ||
| Level 5: 10,000 |
Notes: # indicates the current level of each attribute. USD 1.0 was approximately equal to KRW 1142 at the time of the survey.
Table 2.
Summary of the interviewees’ responses.
| First Group (%) a | Second Group (%) a | ||||||
|---|---|---|---|---|---|---|---|
| Choice Set | Alternative A | Alternative B | Status Quo Alternative | Alternative A | Alternative B | Status Quo Alternative | Sample Size |
| First | 170 | 87 | 43 | 191 | 57 | 52 | 600 (100.0) |
| Second | 78 | 183 | 39 | 136 | 117 | 47 | 600 (100.0) |
| Third | 146 | 88 | 66 | 122 | 92 | 86 | 600 (100.0) |
| Fourth | 97 | 120 | 83 | 128 | 118 | 54 | 600 (100.0) |
| Totals | 491 (20.5) | 478 (19.9) | 231 (9.6) | 577 (24.0) | 384 (16.0) | 239 (10.0) | 2400 (100.0) |
Note: a A percentage of sample size is given in parentheses beside the number of responses.
Table 3.
Definitions and sample statistics for some socio-demographical variables.
| Variables | Definitions | Mean | Standard Deviation |
|---|---|---|---|
| Metro | Dummy for the interviewee’s living in the metropolitan area (0 = no; 1 = yes) | 0.47 | 0.50 |
| Gender | The interviewee’s gender (0 = male; 1 = female) | 0.50 | 0.50 |
| Age | The interviewee’s age | 45.46 | 9.59 |
| Education | The interviewee’s educational level in years | 14.13 | 2.33 |
Table 4.
Estimation results of the model with covariates.
| Variables a | Coefficient Estimates c | |
|---|---|---|
| ASCA b | 1.5361 # | (2.90) |
| ASCB b | 1.4783 # | (2.82) |
| Reduction of greenhouse gas emissions | 0.1158 # | (2.61) |
| Mitigation of air pollutant emissions | 0.1000 # | (5.49) |
| Job creation | 0.0278 # | (3.25) |
| Improvement of energy security | 0.0848 | (0.93) |
| Price | −0.1087 # | (−7.87) |
| ASC0×Metro b | 0.7702 # | (7.17) |
| ASC0×Gender b | 0.1616 | (1.49) |
| ASC0×Age b | −0.0066 | (−1.07) |
| ASC0×Education b | 0.0271 | (1.14) |
| Number of observations | 2400 | |
| Wald statistic (p-value) | 325.01 (0.000) | |
| Pseudo-R2 | 0.033 | |
| Log-likelihood | −2430.86 | |
Notes: a The variables are defined in Table 1 and Table 3. b ASCA, ASCB, and ASC0 mean alternative-specific constants, which indicate dummy variables for a respondent’s selection of alternatives A and B, and status quo alternative, respectively. c t-values are presented in parentheses beside the estimates. # denotes statistical significance at the 1% level.
Table 5.
Estimation results of the model without covariates.
| Variables a | Coefficient Estimates c | |
|---|---|---|
| ASCA b | 0.9567 # | (6.88) |
| ASCB b | 0.8975 # | (7.97) |
| Reduction of greenhouse gas emissions | 0.1165 # | (2.64) |
| Mitigation of air pollutant emissions | 0.0988 # | (5.50) |
| Job creation | 0.0278 # | (3.27) |
| Improvement of energy security | 0.0876 | (0.98) |
| Price | −0.1076 # | (−7.91) |
| Number of observations | 2400 | |
| Wald statistic (p-value) | 313.17 (0.000) | |
| Pseudo-R2 | 0.021 | |
| Log-likelihood | −2462.01 | |
Notes: a The variables are defined in Table 1. b ASCA and ASCB mean alternative-specific constants, which indicate dummy variables for a respondent’s selection of alternatives A and B, respectively. c t-values are presented in parentheses beside the estimates. # denotes statistical significance at the 1% level.
Table 6.
Estimates of the marginal willingness to pay (MWTP).
| MWTP Per Month Per Household | ||||
|---|---|---|---|---|
| Estimates | t-Values | Wald Statistic (p-Value) | 95% Confidence Intervals | |
| Reduction of greenhouse gas emissions (unit: 1%p) | KRW 1082.7 # | 2.81 | 7.88 (0.005) | KRW 306.9 to 1875.9 |
| (USD 0.9) | (USD 0.3 to 1.6) | |||
| Mitigation of air pollutant emissions (unit: 1%p) | KRW 918. 1 # | 7.61 | 57.86 (0.000) | KRW 676.2 to 1161.0 |
| (USD 0.8) | (USD 0.6 to 1.0) | |||
| Job creation (unit: 100) | KRW 258.3 # | 3.66 | 13.40 (0.000) | KRW 113.7 to 397.4 |
| (USD 0.2) | (USD 0.1 to 0.3) | |||
| Improvement of energy security | KRW 814.3 | 0.92 | 0.85 (0.357) | KRW 708.6 to 2933.1 |
| (USD 0.7) | (USD 0.6 to 2.6) | |||
Notes: # implies statistical meaningfulness at the 1% level. USD 1.0 was approximately equal to KRW 1142 at the time of the survey.
Table 7.
Scenarios for marine biodiesel technology development.
| Scenario A | Scenario B | Scenario C | |
|---|---|---|---|
| Reduction of greenhouse gas emissions (unit: 1%p) | 1.5%p | 3.0%p | 3.0%p |
| Mitigation of air pollutant emissions (unit: 1%p) | 5.0%p | 0.5%p | 2.0%p |
| Job creation (unit: 100) | 1000 | 400 | 100 |
| Improvement of energy security | No improvement | No improvement | No improvement |
| Public value per household per month | KRW 8798 | KRW 4740 | KRW 5343 |
| (USD 7.7) | (USD 4.2) | (USD 4.7) | |
| Public value per household per year | KRW 105,571 | KRW 560,884 | KRW 64,111 |
| (USD 92.4) | (USD 49.88) | (USD 56.1) | |
| Aggregate value per year | KRW 2036 billion | KRW 1097 billion | KRW 1236 billion |
| (USD 1783 million) | (USD 961 million) | (USD 1083 million) |
Note: USD 1.0 was approximately equal to KRW 1142 at the time of the survey.
© 2018 by the authors. Licensee MDPI, Basel, Switzerland. This article is an open access article distributed under the terms and conditions of the Creative Commons Attribution (CC BY) license (http://creativecommons.org/licenses/by/4.0/).
Share and Cite
MDPI and ACS Style
Kim, J.; Kim, H.-J.; Yoo, S.-H. Public Value of Marine Biodiesel Technology Development in South Korea. Sustainability 2018, 10, 4252. https://doi.org/10.3390/su10114252
AMA Style
Kim J, Kim H-J, Yoo S-H. Public Value of Marine Biodiesel Technology Development in South Korea. Sustainability. 2018; 10(11):4252. https://doi.org/10.3390/su10114252
Chicago/Turabian StyleKim, Joseph, Hyo-Jin Kim, and Seung-Hoon Yoo. 2018. "Public Value of Marine Biodiesel Technology Development in South Korea" Sustainability 10, no. 11: 4252. https://doi.org/10.3390/su10114252
Note that from the first issue of 2016, this journal uses article numbers instead of page numbers. See further details here.