Valorization of Biomass Hydrolysis Waste: Activated Carbon from Humins as Exceptional Sorbent for Wastewater Treatment

 ,
,
Abstract
:
1. Introduction
2. Materials and Methods
2.1. Materials
2.2. Activation Processes
2.3. Sample Characteristics
2.4. Batch Equilibrium Processes
3. Results and Discussion
3.1. Characteristics of Activated Carbon
3.1.1. Surface Area and Pore Distribution
3.1.2. Impacts of Activation Temperature
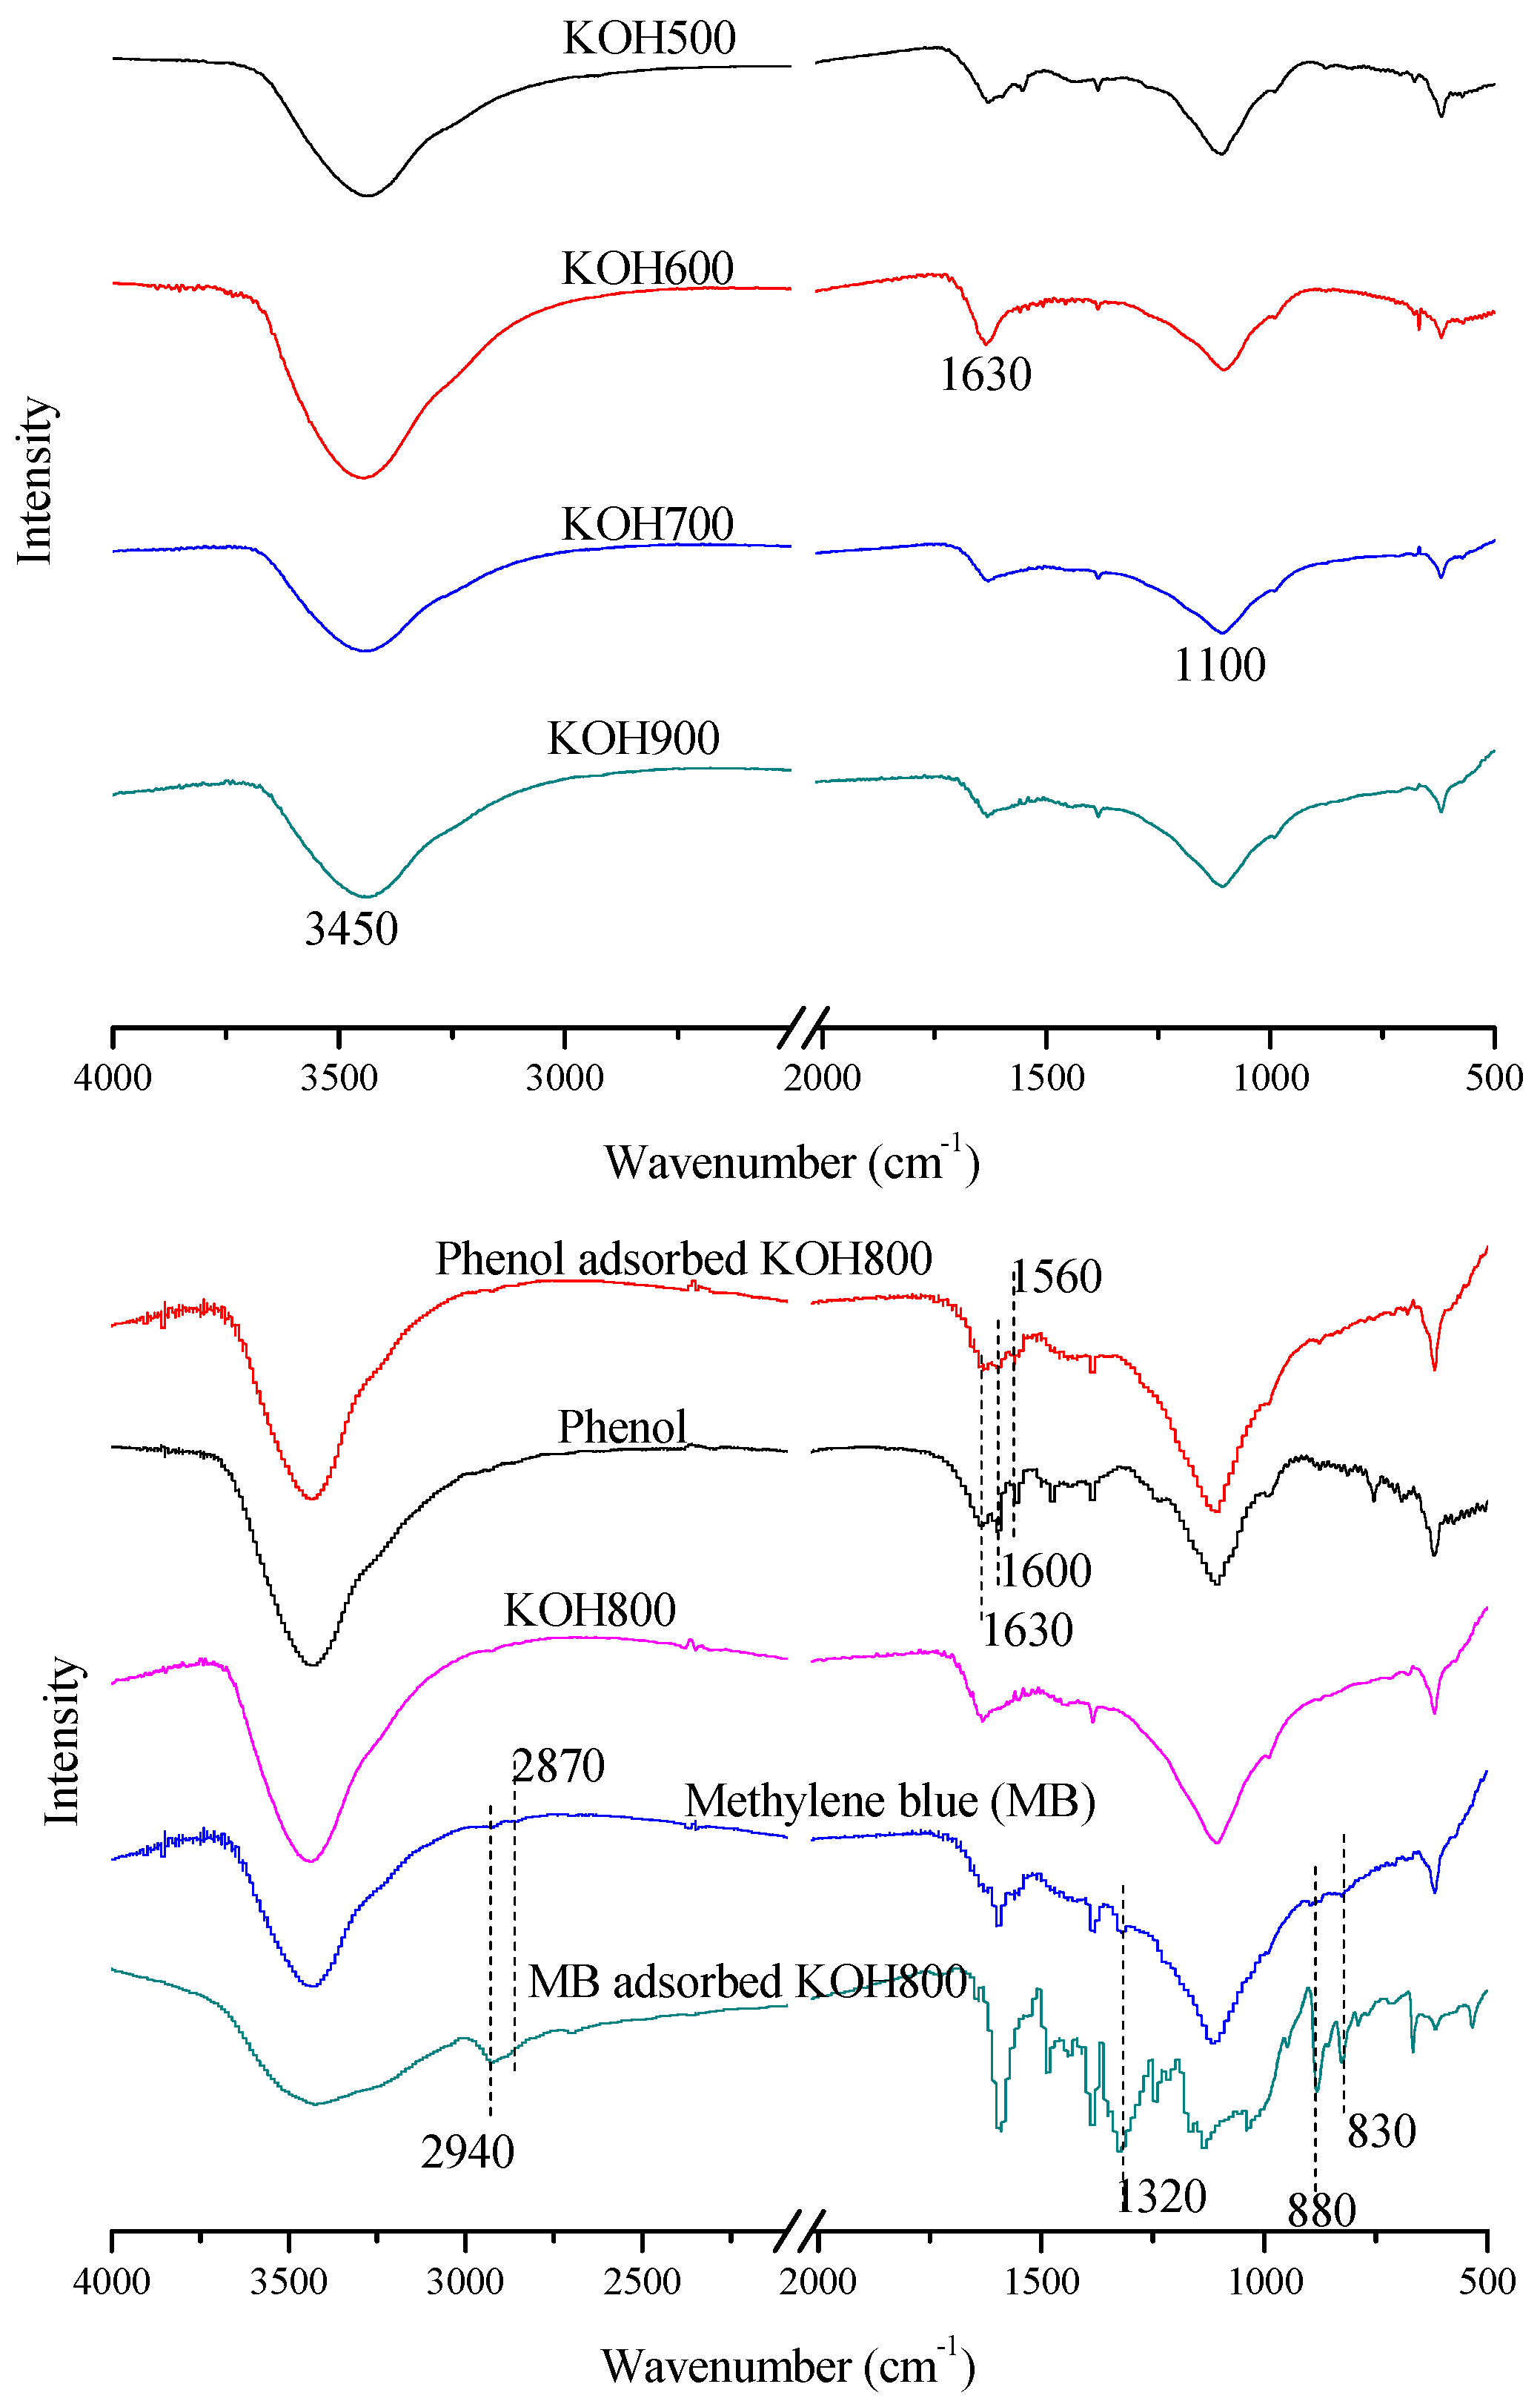
3.1.3. Carbon Framework
3.1.4. Thermal Stability
3.2. Application of Activated Carbons in Adsorption
3.2.1. Adsorption Capability
3.2.2. Adsorption Kinetics
3.2.3. Adsorption Isotherm
3.3. Desorption
3.4. Adsorption Mechanism
4. Conclusions
Author Contributions
Funding
Conflicts of Interest
References
- Ragauskas, A.J.; Williams, C.K.; Davison, B.H.; Britovsek, G.; Cairney, J.; Eckert, C.A.; Frederick, W.J.; Hallett, J.P.; Leak, D.J.; Liotta, C.L. The path forward for biofuels and biomaterials. Science 2006, 311, 484–489. [Google Scholar] [CrossRef] [PubMed]
- Román-Leshkov, Y.; Chheda, J.N.; Dumesic, J.A. Phase modifiers promote efficient production of hydroxymethylfurfural from fructose. Science 2006, 312, 1933–1937. [Google Scholar] [CrossRef] [PubMed]
- Bozell, J.J. Connecting biomass and petroleum processing with a chemical bridge. Science 2010, 329, 522–523. [Google Scholar] [CrossRef] [PubMed]
- Corma, A.; Iborra, S.; Velty, A. Chemical routes for the transformation of biomass into chemicals. Chem. Rev. 2007, 107, 2411–2502. [Google Scholar] [CrossRef] [PubMed]
- Hayes, D.J.; Fitzpatrick, S.; Hayes, M.H.; Ross, J.R. The biofine process–production of levulinic acid, furfural, and formic acid from lignocellulosic feedstocks. Biorefin.-Ind. Process. Prod. 2006, 1, 139–164. [Google Scholar]
- Galletti, A.M.R.; Antonetti, C.; De Luise, V.; Licursi, D.; Nassi, N. Levulinic acid production from waste biomass. BioResources 2012, 7, 1824–1835. [Google Scholar]
- Van Zandvoort, I. Towards the Valorization of Humin By-Products: Characterization, Solubilization and Catalysis. Ph.D. Thesis, Utrecht University, Utrecht, The Netherlands, 2015. [Google Scholar]
- Kang, S.; Yu, J. An intensified reaction technology for high levulinic acid concentration from lignocellulosic biomass. Biomass Bioenergy 2016, 95, 214–220. [Google Scholar] [CrossRef]
- Patil, S.K.; Heltzel, J.; Lund, C.R. Comparison of structural features of humins formed catalytically from glucose, fructose, and 5-hydroxymethylfurfuraldehyde. Energy Fuels 2012, 26, 5281–5293. [Google Scholar] [CrossRef]
- Van Zandvoort, I.; Wang, Y.; Rasrendra, C.B.; van Eck, E.R.; Bruijnincx, P.C.; Heeres, H.J.; Weckhuysen, B.M. Formation, molecular structure, and morphology of humins in biomass conversion: Influence of feedstock and processing conditions. ChemSusChem 2013, 6, 1745–1758. [Google Scholar] [CrossRef] [PubMed]
- Ordomsky, V.; Sushkevich, V.; Schouten, J.; Van Der Schaaf, J.; Nijhuis, T. Glucose dehydration to 5-hydroxymethylfurfural over phosphate catalysts. J. Catal. 2013, 300, 37–46. [Google Scholar] [CrossRef]
- Sumerskii, I.; Krutov, S.; Zarubin, M.Y. Humin-like substances formed under the conditions of industrial hydrolysis of wood. Russ. J. Appl. Chem. 2010, 83, 320–327. [Google Scholar] [CrossRef]
- Weingarten, R.; Conner, W.C.; Huber, G.W. Production of levulinic acid from cellulose by hydrothermal decomposition combined with aqueous phase dehydration with a solid acid catalyst. Energy Environ. Sci. 2012, 5, 7559–7574. [Google Scholar] [CrossRef]
- Van Zandvoort, I.; van Eck, E.R.; de Peinder, P.; Heeres, H.J.; Bruijnincx, P.C.; Weckhuysen, B.M. Full, reactive solubilization of humin byproducts by alkaline treatment and characterization of the alkali-treated humins formed. ACS Sustain. Chem. Eng. 2015, 3, 533–543. [Google Scholar] [CrossRef]
- Van Zandvoort, I.; Koers, E.J.; Weingarth, M.; Bruijnincx, P.C.; Baldus, M.; Weckhuysen, B.M. Structural characterization of 13 C-enriched humins and alkali-treated 13C humins by 2D solid-state NMR. Green Chem. 2015, 17, 4383–4392. [Google Scholar] [CrossRef]
- Girisuta, B.; Janssen, L.; Heeres, H. A kinetic study on the decomposition of 5-hydroxymethylfurfural into levulinic acid. Green Chem. 2006, 8, 701–709. [Google Scholar] [CrossRef]
- Lin, H.; Sun, W.; Ru, B.; Chen, J.; Wang, S. Kinetic study on conversion of glucose to 5-hydroxymethylfurfural in different solvents. Trans. Chin. Soc. Agric. Mach. 2015, 46, 201–207. [Google Scholar]
- Kang, S.; Zhang, G.; Yang, Q.; Tu, J.; Guo, X.; Qin, F.G.; Xu, Y. A new technology for utilization of biomass hydrolysis residual humins for acetic acid production. BioResources 2016, 11, 9496–9505. [Google Scholar] [CrossRef]
- Girisuta, B.; Janssen, L.; Heeres, H. Kinetic study on the acid-catalyzed hydrolysis of cellulose to levulinic acid. Ind. Eng. Chem. Res. 2007, 46, 1696–1708. [Google Scholar] [CrossRef]
- Lorenc-Grabowska, E.; Diez, M.A.; Gryglewicz, G. Influence of pore size distribution on the adsorption of phenol on PET-based activated carbons. J. Colloid Interface Sci. 2016, 469, 205–212. [Google Scholar] [CrossRef] [PubMed]
- Wu, Y.; Jin, X.J.; Zhang, M.Y.; Xu, D. Phenol adsorption on nitrogen-enriched activated carbon from wood fiberboard waste. Wood Fiber Sci. 2012, 44, 220–226. [Google Scholar]
- Jin, X.J.; Zhu, Y.M. Absorption of phenol on nitrogen-enriched activated carbon from wood fiberboard waste with chemical activation by potassium carbonate. J. Chem. Eng. Process Technol. 2014, 5, 4. [Google Scholar]
- Rincón-Silva, N.G.; Moreno-Piraján, J.C.; Giraldo, L.G. Thermodynamic study of adsorption of phenol, 4-chlorophenol, and 4-nitrophenol on activated carbon obtained from eucalyptus seed. J. Chem. 2015, 2015, 1–12. [Google Scholar] [CrossRef]
- Zhang, J.; Jin, X.J.; Gao, J.M.; Zhang, X.D. Phenol adsorption on nitrogen-enriched activated carbon prepared from bamboo residues. BioResources 2013, 9, 969–983. [Google Scholar] [CrossRef]
- Sáenz-Alanís, C.A.; García-Reyes, R.B.; Soto-Regalado, E.; García-González, A. Phenol and methylene blue adsorption on heat-treated activated carbon: Characterization, kinetics, and equilibrium studies. Adsorpt. Sci. Technol. 2017. [Google Scholar] [CrossRef]
- Amri, N.; Zakaria, R.; Bakar, M. Adsorption of phenol using activated carbon adsorbent from waste tyres. Pertan. J. Sci. Technol. 2009, 17, 371–380. [Google Scholar]
- Hameed, B.; Rahman, A. Removal of phenol from aqueous solutions by adsorption onto activated carbon prepared from biomass material. J. Hazard. Mater. 2008, 160, 576–581. [Google Scholar] [CrossRef] [PubMed]
- Altenor, S.; Carene, B.; Emmanuel, E.; Lambert, J.; Ehrhardt, J.J.; Gaspard, S. Adsorption studies of methylene blue and phenol onto vetiver roots activated carbon prepared by chemical activation. J. Hazard. Mater. 2009, 165, 1029–1039. [Google Scholar] [CrossRef] [PubMed]
- Varghese, S.; Vinod, V.; Anirudhan, T. Kinetic and equilibrium characterization of phenols adsorption onto a novel activated carbon in water treatment. Indian J. Chem. Technol. 2004, 11, 825–833. [Google Scholar]
- Leili, M.; Faradmal, J.; Kosravian, F.; Heydari, M. A comparison study on the removal of phenol from aqueous solution using organomodified bentonite and commercial activated carbon. Avicenna J. Environ. Health Eng. 2015, 2, e2698. [Google Scholar] [CrossRef]
- Karabacakoğlu, B.; Tümsek, F.; Demiral, H.; Demiral, İ. Liquid phase adsorption of phenol by activated carbon derived from hazelnut bagasse. J. Int. Environ. Appl. Sci. 2008, 3, 373–380. [Google Scholar]
- Kuśmierek, K.; Świątkowski, A.; Skrzypczyńska, K.; Błażewicz, S.; Hryniewicz, J. The effects of the thermal treatment of activated carbon on the phenols adsorption. Korean J. Chem. Eng. 2017, 34, 1081–1090. [Google Scholar] [CrossRef]
- Kilic, M.; Apaydin-Varol, E.; Pütün, A.E. Adsorptive removal of phenol from aqueous solutions on activated carbon prepared from tobacco residues: Equilibrium, kinetics and thermodynamics. J. Hazard. Mater. 2011, 189, 397–403. [Google Scholar] [CrossRef] [PubMed]
- Giraldo, L.; Moreno-Piraján, J.C. Relation between immersion enthalpies of activated carbons in different liquids, textural properties, and phenol adsorption. J. Therm. Ana. Calorim. 2014, 117, 1517–1523. [Google Scholar] [CrossRef]
- Ma, Y.; Gao, N.; Chu, W.; Li, C. Removal of phenol by powdered activated carbon adsorption. Front. Environ. Sci. Eng. 2013, 7, 158–165. [Google Scholar] [CrossRef]
- Vargas, A.M.; Cazetta, A.L.; Kunita, M.H.; Silva, T.L.; Almeida, V.C. Adsorption of methylene blue on activated carbon produced from flamboyant pods (Delonix regia): Study of adsorption isotherms and kinetic models. Chem. Eng. J. 2011, 168, 722–730. [Google Scholar] [CrossRef]
- El Qada, E.N.; Allen, S.J.; Walker, G.M. Adsorption of methylene blue onto activated carbon produced from steam activated bituminous coal: A study of equilibrium adsorption isotherm. Chem. Eng. J. 2006, 124, 103–110. [Google Scholar] [CrossRef]
- Arivoli, S.; Hema, M.; Parthasarathy, S.; Manju, N. Adsorption dynamics of methylene blue by acid activated carbon. J. Chem. Pharm. Res. 2010, 2, 626–641. [Google Scholar]
- Li, L.; Liu, X.L.; Gao, M.; Hong, W.; Liu, G.Z.; Fan, L.; Hu, B.; Xia, Q.H.; Liu, L.; Song, G.W. The adsorption on magnetic hybrid Fe3O4/HKUST-1/GO of methylene blue from water solution. J. Mater. Chem. A 2014, 2, 1795–1801. [Google Scholar] [CrossRef]
- Sayğılı, H.; Güzel, F. High surface area mesoporous activated carbon from tomato processing solid waste by zinc chloride activation: Process optimization, characterization and dyes adsorption. J. Clean. Prod. 2016, 113, 995–1004. [Google Scholar] [CrossRef]
- Mahmoudi, K.; Hamdi, N.; Srasra, E. Study of adsorption of methylene blue onto activated carbon from lignite. Surf. Eng. Appl. Electrochem. 2015, 51, 427–433. [Google Scholar] [CrossRef]
- Ramesh, K.; Rajappa, A.; Nandhakumar, V. Adsorption of methylene blue onto microwave assisted zinc chloride activated carbon prepared from Delonix regia pods-isotherm and thermodynamic studies. Res. J. Chem. Sci. 2014, 4, 36–42. [Google Scholar]
- Li, D.; Li, J.; Gu, Q.; Song, S.; Peng, C. Co-influence of the pore size of adsorbents and the structure of adsorbates on adsorption of dyes. Desalin. Water Treat. 2016, 57, 14686–14695. [Google Scholar] [CrossRef]
- Zhang, G.; Pao, Y.; Miao, Y. Adsorption kinetics and isotherm of methylene blue on activated carbon from sandlive willow. Chem. Ind. For. Prod. 2014, 34, 129–134. [Google Scholar]
- Gao, J.J.; Qin, Y.B.; Zhou, T.; Cao, D.D.; Xu, P.; Hochstetter, D.; Wang, Y.F. Adsorption of methylene blue onto activated carbon produced from tea (Camellia sinensis L.) seed shells: Kinetics, equilibrium, and thermodynamics studies. J. Zhejiang Univ. Sci. B 2013, 14, 650–658. [Google Scholar] [CrossRef] [PubMed]
- Dural, M.U.; Cavas, L.; Papageorgiou, S.K.; Katsaros, F.K. Methylene blue adsorption on activated carbon prepared from Posidonia oceanica (L.) dead leaves: Kinetics and equilibrium studies. Chem. Eng. J. 2011, 168, 77–85. [Google Scholar] [CrossRef]
- Omidi, Y.; Basiri, H.; Jafari, A.; Saeedi, S.; Goudarzi, G.; Taheri, F.; Murkani, M.S. Removal of textile dye methylene blue from liquid-phase by activated carbon from aloe vera wastes. Jundishap. J. Health Sci. 2016. [Google Scholar] [CrossRef]
- Jamion, N.; Hashim, I. Preparation of acticated carbon from tamarind seeds and methylene blue (MB) removal. J. Fundam. Appl. Sci. 2017, 9, 102–114. [Google Scholar] [CrossRef]
- Baghapour, M.A.; Djahed, B.; Ranjbar, M. Removal of methylene blue from aqueous solutions by waste paper derived activated carbon. J. Health Sci. Surveill. Syst. 2013, 1, 48–56. [Google Scholar]
- Santhi, T.; Manonmani, S. Removal of methylene blue from aqueous solution by bioadsorption onto ricinus communis epicarp activated carbon. Chem. Eng. Res. Bull. 2009, 13, 1–5. [Google Scholar] [CrossRef]
- Sogbochi, E.; Balogoun, C.K.; Dossa, C.P.A.; Sohounhloue, D.C.K. Evaluation of adsorption capacity of methylene blue in aqueous medium by two adsorbents: The raw hull of lophira lanceolata and its activated carbon. Am. J. Phys. Chem. 2017, 6, 76–87. [Google Scholar] [CrossRef]
- Pathania, D.; Sharma, S.; Singh, P. Removal of methylene blue by adsorption onto activated carbon developed from Ficus carica bast. Arab. J. Chem. 2013, 10, S1445–S1451. [Google Scholar] [CrossRef]
- Saheed, I.O.; Adekola, F.A.; Olatunji, G.A. Sorption study of methylene blue on activated carbon prepared from Jatropha curcas and Terminalia catappa seed coats. J. Turk. Chem. Soc. Sect. A Chem. 2017, 4, 375–394. [Google Scholar] [CrossRef]
- Karagöz, S.; Tay, T.; Ucar, S.; Erdem, M. Activated carbons from waste biomass by sulfuric acid activation and their use on methylene blue adsorption. Bioresour. Technol. 2008, 99, 6214–6222. [Google Scholar] [CrossRef] [PubMed]
- Dehghani, M.H.; Mostofi, M.; Alimohammadi, M.; McKay, G.; Yetilmezsoy, K.; Albadarin, A.B.; Heibati, B.; AlGhouti, M.; Mubarak, N.; Sahu, J. High-performance removal of toxic phenol by single-walled and multi-walled carbon nanotubes: Kinetics, adsorption, mechanism and optimization studies. J. Ind. Eng. Chem. 2016, 35, 63–74. [Google Scholar] [CrossRef]
- Wang, X.; Huang, A.; Zhong, S.; Pan, Y.; Tian, Y. Facile Preparation of Mesoporous Carbon Microspheres Containing Nickel Nanoparticle and Dye Adsorption Behavior. Sci. Adv. Mater. 2015, 7, 43–49. [Google Scholar] [CrossRef]
- Hui, T.S.; Zaini, M.A.A. Potassium hydroxide activation of activated carbon: A commentary. Carbon Lett. 2015, 16, 275–280. [Google Scholar] [CrossRef]
- Kang, S.; Li, X.; Fan, J.; Chang, J. Characterization of hydrochars produced by hydrothermal carbonization of lignin, cellulose, D-xylose, and wood meal. Ind. Eng. Chem. Res. 2012, 51, 9023–9031. [Google Scholar] [CrossRef]
- Kang, S.; Zhang, G.; Yang, X.; Yin, H.; Fu, X.; Liao, J.; Tu, J.; Huang, X.; Qin, F.G.; Xu, Y. Effects of p-toluenesulfonic acid in the conversion of glucose for levulinic acid and sulfonated carbon production. Energy Fuels 2017, 31, 2847–2854. [Google Scholar] [CrossRef]
- Fu, X.; Chen, J.; Song, X.; Zhang, Y.; Zhu, Y.; Yang, J.; Zhang, C. Biodiesel production using a carbon solid acid catalyst derived from β-cyclodextrin. J. Am. Oil Chem. Soc. 2015, 92, 495–502. [Google Scholar] [CrossRef]
- Maneechakr, P.; Samerjit, J.; Uppakarnrod, S.; Karnjanakom, S. Experimental design and kinetic study of ultrasonic assisted transesterification of waste cooking oil over sulfonated carbon catalyst derived from cyclodextrin. J. Ind. Eng. Chem. 2015, 32, 128–136. [Google Scholar] [CrossRef]
- Geng, L.; Yu, G.; Wang, Y.; Zhu, Y. Ph-SO3 H-modified mesoporous carbon as an efficient catalyst for the esterification of oleic acid. Appl. Catal. A 2012, 427, 137–144. [Google Scholar] [CrossRef]
- Zhao, J.; Yang, L.; Li, F.; Yu, R.; Jin, C. Structural evolution in the graphitization process of activated carbon by high-pressure sintering. Carbon 2009, 47, 744–751. [Google Scholar] [CrossRef]
- Siesler, H.W.; Ozaki, Y.; Kawata, S.; Heise, H.M. Near-Infrared Spectroscopy: Principles, Instruments, Applications; John Wiley & Sons: Hoboken, NJ, USA, 2008. [Google Scholar]
- Fried, A.; Richter, D. Infrared Absorption Spectroscopy; Blackwell Publishing: Oxford, UK, 2006. [Google Scholar]
- Yang, G.; Chen, H.; Qin, H.; Feng, Y. Amination of activated carbon for enhancing phenol adsorption: Effect of nitrogen-containing functional groups. Appl. Surf. Sci. 2014, 293, 299–305. [Google Scholar] [CrossRef]
- Al-Ghouti, M.A.; Khraisheh, M.A.; Ahmad, M.N.; Allen, S. Adsorption behaviour of methylene blue onto Jordanian diatomite: A kinetic study. J. Hazard. Mater. 2009, 165, 589–598. [Google Scholar] [CrossRef] [PubMed]
- Gürses, A.; Doğar, Ç.; Yalçın, M.; Açıkyıldız, M.; Bayrak, R.; Karaca, S. The adsorption kinetics of the cationic dye, methylene blue, onto clay. J. Hazard. Mater. 2006, 131, 217–228. [Google Scholar] [CrossRef] [PubMed]
- Tan, I.; Hameed, B.; Ahmad, A. Equilibrium and kinetic studies on basic dye adsorption by oil palm fibre activated carbon. Chem. Eng. J. 2007, 127, 111–119. [Google Scholar] [CrossRef]
- Kavitha, D.; Namasivayam, C. Experimental and kinetic studies on methylene blue adsorption by coir pith carbon. Bioresour. Technol. 2007, 98, 14–21. [Google Scholar] [CrossRef] [PubMed]
- Yuan, X.; Zhuo, S.P.; Xing, W.; Cui, H.Y.; Dai, X.D.; Liu, X.M.; Yan, Z.F. Aqueous dye adsorption on ordered mesoporous carbons. J. Colloid Interface Sci. 2007, 310, 83–89. [Google Scholar] [CrossRef] [PubMed]
- Tessmer, C.H.; Vidic, R.D.; Uranowski, L.J. Impact of oxygen-containing surface functional groups on activated carbon adsorption of phenols. Environ. Sci. Technol. 1997, 31, 1872–1878. [Google Scholar] [CrossRef]


| Glucose Concentration | Catalyst | Temperature | Humins Yields | Ref. |
|---|---|---|---|---|
| 200 g/L | 0.2 M H2SO4 | 170 °C | 21.0 wt. % | [8] |
| 18 g/L | 0.1 M H2SO4 | 125 °C | 29 wt. % | [9] |
| 270 g/L | 0.055 M H2SO4 | 180 °C | 36 wt. % | [10] |
| 360 g/L | 0.01 M H2SO4 | 220 °C | 35 wt. % | |
| 50 g/L | 0.05 g/L ZrPO4 | 135 °C | 29 wt. % | [11] |
| ~50 g/L | 0.5% H2SO4 | 175–180 °C | 21 wt. % | [12] |
| Raw Material | Activation Methods | Adsorption Temp. (°C) | Surface Area (m2/g) | Adsorption Capacity (mg/g) | Ref. |
|---|---|---|---|---|---|
| Humins | KOH impregnation activation at 800 °C | 30 | 1765 | 218 | This work |
| Polyethylene terephthalate | Carbonization at 800 °C, followed by steam activation at 850 °C or at 900 °C with CO2 | 24 | 1850 | 278 | [20] |
| Waste fiberboard | Carbonization at 500 °C, followed by KOH impregnation activation at 850 °C | 30 | 1876 | 217.39 | [21] |
| Waste fiberboard | Carbonization at 500 °C, followed by K2CO3 impregnation activation at 800 °C | 40 | 208 | [22] | |
| eucalyptus seed husk | NaOH/H2SO4 impregnation activation at 550 or 750 °C | 20 | 670–780 | 199 | [23] |
| Bamboo residues | Carbonization at 500 °C, followed by K2CO3 impregnation at 850 °C | 35 | 1120 | 163.82 | [24] |
| Bituminous activated carbon | - | 25 | 676.7 | 157.91 | [25] |
| Waste tires | KOH impregnation activation at 800 °C | 30 | 273.26 | 156.25 | [26] |
| Rattan sawdust | Carbonized at 700 °C, followed by KOH impregnation activation at 850 °C | 30 | 149.25 | [27] | |
| Vetiver roots | Carbonization at 800 °C, followed by steam activation at 800 °C | 25 | 1185 | 145 | [28] |
| Water hyacinth | H2SO4 carbonization at 150 °C, followed by CO2 stream activation at 700 °C | 30 | 632.7 | 112.8 | [29] |
| Commercial activated carbon | - | R.T. | 112.36 | [30] | |
| Hazelnut bagasse | ZnCl2 impregnation activation method | 45 | 1489 | 99.27 | [31] |
| Activated carbon R3-ex | Carbonization at 1500 and 1800 °C | 25 | 530–1390 | 62.9–226.6 | [32] |
| Tobacco residue | KOH impregnation activation at 700 °C | 20–50 | 998–1474 | 45.49 | [33] |
| Peach seeds | Carbonization (450 °C) followed by CO2 gasification at 600 to 900 °C | 25 | 159–793 | 11.1–45.8 | [34] |
| Activated carbons from coal, coconut shell, charcoal | - | 25 | >900 | 10.29–24.96 | [35] |
| Raw Material | Activation Methods | Adsorption Temp. | Surface Area (m2/g) | Adsorption Capacity (mg/g) | Ref. |
|---|---|---|---|---|---|
| Humins | KOH impregnation activation at 800 °C | 30 | 1765 | 1195 | This work |
| Flamboyant pods | NaOH activation | 25 | 2854 | 890 | [36] |
| Coal powder | KOH activation at 1000 °C | 25 | 2075 | 871 | [35] |
| Bituminous coal | Steam activation at 1000 °C | 20 | 857.1 | 580 | [37] |
| Salix psammophila | KOH impregnation activation at 850 °C | 30 | 519.63 | [38] | |
| Bamboo chips | ZnCl2 impregnation activation at 500 °C | 25 | 2050 | 435 | [39] |
| Vetiver roots | H3PO4 impregnation activation at 600 °C | 25 | 1004–1272 | 423 | [28] |
| Tomato waste | ZnCl2 impregnation activation at 600 °C | 30 | 1093 | 400 | [40] |
| Lignite | ZnCl2 impregnation activation at 450 °C. | 30 | 600 | 370.37 | [41] |
| Delonix Regia pods | Microwave assisted ZnCl2 impregnation activation | 62 | 370 | [42] | |
| Granular activated carbon | - | 50 | 1306 | 357.14 | [43] |
| Salix psammophila | H3PO4 impregnation activation at 550 °C | 30 | 347.13 | [44] | |
| Tea seed shells | ZnCl2 impregnation activation at 500 °C | 20 | 1530.67 | 324.7 | [45] |
| Dead leaves | ZnCl2 impregnation activation at 600 °C | 45 | 1483 | 285.7 | [46] |
| Bituminous activated carbon | - | 25 | 676.7 | 130.88 | [25] |
| Activated carbons from coal, coconut shell, charcoal | - | 25 | >900 | 130–135 | [35] |
| Aloe vera wastes | Carbonization at 550 °C | 25 | 129.87 | [47] | |
| Tamarind seed | H3PO4 impregnation activation at 500 °C | 50 | 594.04 | 102.77 | [48] |
| Waste paper | KOH impregnation activation at 500 °C | 66 | 68 | [49] | |
| Epicarp of Ricinus communis | Concentrated H2SO4 carbonization | 32 | - | 62.5 | [50] |
| Buch-ham bark | Concentrated H2SO4 at 400 °C | 30–60 | - | 60.61–62.50 | [38] |
| Hull of Lophira Lanceolat | Orthophosphoric acid impregnation activation at 400 °C | RT | - | 55 | [51] |
| Ficus carica bast | Concentrated H2SO4 carbonization | 25–50 | - | 40–50 | [52] |
| Jatropha curcas, seed coats | Carbonization at 500 °C | 28 | 50.29/75.70 | 37.84/17.44 | [53] |
| Sunflower oil cake | H2SO4 impregnation carbonization at 600 °C | 25 | 240.02 | 16.43 | [54] |
| Properties | Phenol | MB |
|---|---|---|
| Chemical formula | C6H5OH | C16H18ClN3S |
| Molecular weight | 94.11 (g/mol) | 319.85 (g/mol) |
| Acid-base properties | Acidic | Basic |
| Molecular structure | 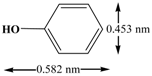 |  |
| Three dimensions | 0.582 nm × 0.453 nm × 0.152 nm | 1.41 nm × 0.55 nm × 0.16 nm |
| Sample | Yields (wt. %) | BET Surface Area (m2/g) | BJH Pore Volume 1 (cm3/g) | Total Acidity (meq g−1) | Total Basicity (meq g−1) |
|---|---|---|---|---|---|
| Humins | - | 5.7 | 0.0045 | - | - |
| Humins500 2 | 55.8 | 73.8 | 0.014 | - | - |
| KOH500 | 39.2 | 428 | 0.025 | 3.0 | 0.17 |
| KOH600 | 30.8 | 665 | 0.068 | 3.3 | 0.28 |
| KOH700 | 26.2 | 1041 | 0.10 | 3.2 | 0.48 |
| KOH800 | 23.1 | 1650 | 0.32 | 3.3 | 0.51 |
| KOH900 | 15.0 | 1975 | 0.66 | 3.1 | 0.56 |
| Phenol adsorbed KOH800 3 | - | 927 | 0.22 | - | - |
| MB adsorbed KOH800 4 | - | 67.2 | 0.013 | - | - |
| Solute | C0 (mg/L) | qe,exp (mg/g) | Pseudo-First-Order Kinetic Model | Pseudo-Second-Order Kinetic Model | ||||||
|---|---|---|---|---|---|---|---|---|---|---|
| k1 (h−1) | qe,cal (mg/g) | ∆q (%) | R2 | k2 (g/mg h) | qe,cal (mg/g) | ∆q (%) | R2 | |||
| Phenol | 100 | 59.7 | 1.74 | 1.4 | 103 | 0.7769 | 5.61 | 59.5 | 1.1 | 1.000 |
| 204 | 117.6 | 0.73 | 2.0 | 104 | 0.9572 | 1.81 | 117.6 | 1.2 | 1.000 | |
| 301 | 165.5 | 0.57 | 2.9 | 104 | 0.7776 | 0.91 | 166.7 | 1.6 | 1.000 | |
| 401 | 204.6 | 0.37 | 7.96 | 103 | 0.8741 | 0.24 | 204.1 | 6.4 | 1.000 | |
| MB | 801 | 481.3 | 3.88 | 10.8 | 102 | 0.8083 | 1.44 | 476.2 | 1.1 | 1.000 |
| 1002 | 604.3 | 1.61 | 24.5 | 101 | 0.7107 | 0.27 | 588.2 | 3.3 | 1.000 | |
| 1501 | 907.4 | 0.91 | 107.2 | 96.7 | 0.8384 | 0.04 | 909.1 | 1.5 | 1.000 | |
| 2000 | 1184.0 | 0.29 | 222.9 | 95.6 | 0.886 | 0.007 | 1250 | 6.3 | 1.000 | |
| Solute | Langmuir Isotherm | Freundlich Isotherm | |||||
|---|---|---|---|---|---|---|---|
| qm (mg/g) | KL (L/mg) | R2 | RL1 | KF | nF | qm | |
| MB | 1195 | 6.787 | 1.000 | 7.4 × 10⁻⁵ (1.8 × 10⁻⁴) | 8.4 × 10⁻¹⁵ | 4.81 | 0.738 |
| Phenol | 217.9 | 0.21 | 0.9952 | 0.012 (0.045) | 62.9 | 3.3 | 0.9885 |
| Solute | Adsorbed Content mg/g | Carbon Concentration (mg/L) | Desorption Solvent | Desorption Efficiency (%) | Irreversible Adsorption (%) |
|---|---|---|---|---|---|
| MB | 1184 | 1667 | DI water | 1.7 | 98.3% |
| MB | 1184 | 1667 | 0.1 mol/L HNO3 | 2.1 | 97.9% |
| MB | 1184 | 1667 | 0.1 mol/L HCl | 2.6 | 97.4% |
| MB | 1184 | 1667 | 0.1 mol/L NaOH | <1 | >99% |
| MB | 1184 | 1667 | Methanol | 28 | 72 |
| MB | 1184 | 1667 | Acetone | 25 | 75 |
| Phenol | 205 | 1667 | DI water | 15.6 | 84.4 |
| Phenol | 205 | 1667 | 0.1 mol/L HNO3 | 21.5 | 78.5 |
| Phenol | 205 | 1667 | 0.1 mol/L HCl | 31.2 | 68.8 |
| Phenol | 205 | 1667 | 0.1 mol/L NaOH | 74.6 | 25.4 |
| Phenol | 205 | 1667 | Methanol | 98 | 2 |
| Phenol | 205 | 1667 | Acetone | 95 | 5 |
© 2018 by the authors. Licensee MDPI, Basel, Switzerland. This article is an open access article distributed under the terms and conditions of the Creative Commons Attribution (CC BY) license (http://creativecommons.org/licenses/by/4.0/).
Share and Cite
Kang, S.; Fu, J.; Deng, Z.; Jiang, S.; Zhong, G.; Xu, Y.; Guo, J.; Zhou, J. Valorization of Biomass Hydrolysis Waste: Activated Carbon from Humins as Exceptional Sorbent for Wastewater Treatment. Sustainability 2018, 10, 1795. https://doi.org/10.3390/su10061795
Kang S, Fu J, Deng Z, Jiang S, Zhong G, Xu Y, Guo J, Zhou J. Valorization of Biomass Hydrolysis Waste: Activated Carbon from Humins as Exceptional Sorbent for Wastewater Treatment. Sustainability. 2018; 10(6):1795. https://doi.org/10.3390/su10061795
Chicago/Turabian StyleKang, Shimin, Jinxia Fu, Zhituan Deng, Shaohui Jiang, Guoyu Zhong, Yongjun Xu, Jianfeng Guo, and Jingwen Zhou. 2018. "Valorization of Biomass Hydrolysis Waste: Activated Carbon from Humins as Exceptional Sorbent for Wastewater Treatment" Sustainability 10, no. 6: 1795. https://doi.org/10.3390/su10061795