Article

Reduced Carbon Dioxide Sink and Methane Source under Extreme Drought Condition in an Alpine Peatland

1
Institute of Wetland Research, Chinese Academy of Forestry, Beijing 100091, China
2
Beijing Key Laboratory of Wetland Services and Restoration, Beijing 100091, China
3
Sichuan Zoige Wetland Ecosystem Research Station, Tibetan Autonomous Prefecture of Aba 624500, China
4
University of Chinese Academy of Sciences, Beijing 100049, China
*
Authors to whom correspondence should be addressed.
Sustainability 2018, 10(11), 4285; https://doi.org/10.3390/su10114285
Submission received: 16 October 2018 / Revised: 29 October 2018 / Accepted: 14 November 2018 / Published: 19 November 2018
(This article belongs to the Special Issue High Impact Events and Climate Change)

Abstract

:
Potential changes in both the intensity and frequency of extreme drought events are vital aspects of regional climate change that can alter the distribution and dynamics of water availability and subsequently affect carbon cycles at the ecosystem level. The effects of extreme drought events on the carbon budget of peatland in the Zoige plateau and its response mechanisms were studied using an in-field controlled experimental method. The results indicated that the peatland ecosystem of the Zoige plateau functioned as a carbon sink while under the control (CK) or extreme drought (D) treatment throughout the entire growing season. Maximum fluxes of methane (CH4) emissions and the weakest carbon sink activity from this ecosystem were in the early growth stage, the most powerful carbon sink activity was during the peak growth stage, while the absorption sink activity of carbon dioxide (CO2) and CH4 was present during the senescence stage. Extreme drought reduced the gross primary productivity (GPP) and ecosystem respiration (Re) of the peatland ecosystem by 14.5% and 12.6%, respectively (p < 0.05) and the net ability to store carbon was reduced by 11.3%. Overall, the GPP was highly sensitive to extreme drought. Moreover, extreme drought significantly reduced the CH4 fluxes of the ecosystem and even changed the peatland from a CH4 emission source to a CH4 sink. Subsequent to drought treatment, extreme drought was also shown to have a carry-over effect on the carbon budget of this ecosystem. Soil water content and soil temperature were the main driving factors of carbon budget change in the peatland of the Zoige plateau, but with the increase in soil depth, these driving forces were decreased. The findings indicated that frequent extreme drought events in the future might reduce the net carbon sink function of peatland areas, with an especially strong influence on CO2.

1. Introduction

The latest assessment report released by the United Nations Intergovernmental Panel on Climate Change (IPCC) shows that the intensification of human activity has dramatically changed the global pattern of the atmospheric cycle. Extreme weather events, especially extreme drought events, have shown an increasing trend over the past 50 years and will likely become more frequent in the future [1,2,3,4,5]. Extreme drought events change key processes in the water cycle, and subsequently affect the carbon and nitrogen cycling processes of an ecosystem, thus breaking the original carbon sink pattern and causing changes in the structure and function of terrestrial ecosystems [6,7,8]. In turn, this significantly affects the trends and intensity of global climate change [9]. Extreme drought events have become the main ecological factors affecting the security of global ecosystems due to their high intensity, wide range, and low predictability [10,11,12]. Therefore, it is critical to quantitatively study and predict the impact of extreme drought events on the carbon budget of an ecosystem. However, previous studies have mostly focused on the response of carbon source/sink functions in ecosystems relative to long-term trends in climate change and have neglected the impact of short-term extreme drought events and their mechanisms [2,13], restricting the ability to understand and predict the ecological consequences of climate change and to adopt adaptive countermeasures.
The peatland ecosystem is an essential component of the global terrestrial carbon pool. This ecosystem stores 15–30% of the global soil carbon pool at a proportion of only 3% of the total land area, which plays a vital role in regulating global climate change [14,15,16,17]. The carbon budget in the peatland ecosystem is greatly affected by meteorological factors (temperature, precipitation, light, etc.), plant physiological changes, and soil microbial changes [18,19,20]. Moreover, extreme drought events can significantly affect the temperature and hydrological conditions of a given ecosystem [21], and can change the water balance, aggravate the degree of water stress, significantly affect plant growth [22,23,24] and respiration [25], and alter decomposition of organic matter [26] as well as change carbon, water, and energy fluxes between the land surface and the atmosphere [27]. Additionally, extreme drought events can reduce the availability of substrates for microbial respiration [28], have effects on plant physiological states and soil microbial activity, and have an impact on the carbon budget dynamics in peatland ecosystems, which makes the conversion of carbon source/sink function very uncertain [29,30]. As such, exploring the impacts of extreme drought on carbon budgets of the peatland ecosystem is of great practical significance. Such studies will further the understanding of fluctuating carbon budgets on both the regional and global scale, help protect wetland ecological resources, and provide data to support measures that slow down greenhouse effects [10].
Located in the northeast corner of the Qinghai-Tibet Plateau, the peatland of the Zoige plateau is the highest and largest peat swamp area in the world. The thickness of the peat is 0.3–3.8 m, with a dry weight of 2.9 Pg [31]. As such, it is typical and representative in the study of the global carbon cycle as it relates to the peatland ecosystem. Additionally, the peatland of the Zoige plateau is also one of the most sensitive areas in regard to global climate change, and is extremely vulnerable to the effects of long-term climate changes [32,33,34,35]. Long-term climate change is characterized at this site by a warming and drying trend and an increasing frequency of extreme drought events [16,19]. At present, many scientific insights in the study of the carbon cycle have been made in the Zoige peatland [16,19,31,34], but there are few reports detailing the carbon exchange characteristics and the mechanisms affecting the carbon budget under extreme drought conditions when simulated via in-field controlled experiments. Therefore, the sensitivity of the carbon budget of the peatland ecosystem in the Zoige plateau was studied in response to extreme drought events via control experiments in this study. This study explores the effects on peatland carbon fluxes and their response mechanisms using control experiments and serves to enhance the understanding of the response and adaptive mechanisms of wetland ecosystems to extreme climate change, further highlighting the role of the plateau wetland ecosystem in regional and global carbon cycling. This study will also provide a reference for the conservation and management of peat swamps located in the plateau based on carbon conservation in relation to climate change and, as such, has broad application possibilities.

2. Materials and Methods

2.1. Overview of the Study Area

The study sample (33.79906° N, 102.95790° E) at 3430 m above sea level is located in the Zoige plateau on the northeast edge of the Qinghai-Tibet Plateau (Figure 1). It is one of the regions most sensitive to global climate change. The peat wetland of the Zoige plateau is the largest plateau wetland in China, and is also the largest and best-preserved plateau peatland swamp in the world [36,37,38]. The study area is cold and humid and belongs to the monsoon climate of the alpine, frigid temperate zone. According to the local climate data (China Meteorological Data Network), the annual mean temperature is −1.7–3.3 °C, and the mean temperature of the hottest month (July) is 8.5–12.6 °C, which is equivalent to the heat condition of the junction zone of the sub-polar continental and tundra climates. The average annual precipitation of 650–750 mm mainly occurs April through September and accounts for about 90% of the annual precipitation. The vegetation type is lowstand herbaceous swamp, and the dominant species are Carex meyeriana, Koeleria tibetica, Carex muliensis, Eriophorum gracile, Blysmus sinocompressus, Carex secbrirostris, etc. The soil at the experimental site is characterized by peat soil. The depth of peat in the vertical profile of this site is in general 1.2 m. The soil organic carbon content is between 179.36–276.41 g/kg. The bulk density of this site is 0.78. The soil pH is between 6.8–7.2. A litter layer is over the soil surface due to the residue after plant death.

2.2. Experimental Observation

2.2.1. Sampling Land Design

According to the local statistics regarding rainfall over the past 50 years (China Meteorological Data Network) [39], extreme drought events are manipulated in early summer and the peak stage of plant growth. Daily rainfall of ≤3 mm is defined as a non-effective rainfall, and the duration of a non-effective rainfall is designated as 32 days (where the days without an effective rainfall is the duration of the drought) [22]. The experiment was designed to include a control treatment (CK) and extreme drought treatment (D). A Mg-Al alloy rain shelter (length × width × height: 2.5 × 2.5 × 1.8 m) was used to simulate extreme drought. The transmittance of the shelter material was more than 90%. A stainless-steel base (50 × 50 × 20 cm) was installed in the center of each experimental district, and the base was inserted into the ground at a 10 cm depth. There were grooves on the base, and the grooves could be filled with water before each gas measurement to ensure the sealing of the measurement. The control plot did not have a rain shelter, and the natural conditions in the field were used for gas observation. The control experiment occurred from 16 July 2016, to 26 August 2016, and the observation data were measured from 9:00 a.m. to 15:00 p.m. on sunny days.

2.2.2. Greenhouse Gas Fluxes and Environmental Factors

This study utilized a closed chamber and laser-based fast greenhouse gas analyzer to monitor CO2 and CH4 fluxes utilizing a data acquisition frequency of 1 Hz. The in-house closed chamber (50 cm × 50 cm × 50 cm) was connected to the laser-based fast greenhouse gas analyzer. There were two 2-cm diameter holes on top of the chamber linking to a 20-m rubber internal pipe, which was connected to the greenhouse gas analyzer. The gas was returned to the chamber from the analyzer through another 20-m exit pipe. There were two 10-cm diameter fans in the center of the chamber ceiling to ensure a homogeneous gas concentration inside the chamber. In each sampling area, the measurement was implemented inside the chamber for 10 min, followed by another measurement after opening the chamber for 2 min. Instruments and fans were powered by a 12 V battery, and the gas flux was calculated using the slope showing the change of gas concentration as a function of time; if the slope in the chamber for the first 10 min was not linear, the gas flux was calculated from the linear part of the curve only. Additionally, the temperature changes of the air and soil were measured using a TZS-5X detector, and the soil moisture content was determined using a TDR300 moisture meter.

2.2.3. Data Processing and Analysis

The carbon flux was calculated from the linear slope indicating the changes in gas concentration with time, as shown below [40]:
F c = d c d t × M V 0 × P P 0 × T 0 T × H
where Fc is the CO2/CH4 flux (mg/(m2·h)); dc/dt is the slope indicating changes in gas concentration as a function of time (ppm/h); M is the molar mass of the measured gas (g/mol); P is the atmospheric pressure at the sampling site (Pa); V0, P0, and T0 represent the standard molar volume (22.41 m3/mol), standard atmospheric pressure (101,325 Pa), and absolute temperature (oK) under the standard atmospheric pressure, respectively; T is the absolute temperature inside the chamber (oK); and H is the effective height of the chamber (m).
The CO2 flux observed directly from the transparent static box represents the net ecosystem CO2 exchange (NEE), light shading static-chamber observed CO2 flux represents the ecosystem respiration (Re), and the total primary productivity (GPP) is the difference between Re and NEE [41]. Defining the NEE positive as net CO2 release and negative as net absorption, the GPP can be defined as:
GPP = R e NEE

2.2.4. Statistical Analysis

In order to use soil temperature and soil water content to explain the variance in the carbon fluxes (NEE, GPP, Re, CH4), the generalized additive mixed-effects models (GAMMs) were performed to test their interactive effects on the carbon fluxes. GAMMs enable capturing non-linear asymmetric or bimodal biological responses and the mixed models allow treatment of autocorrelation and repeated measure situations [42]. The model allowed for flexible specification of the dependence of the response on the covariates by defining regression splines (smoothing functions) and estimating their optimal degree of smoothness, rather than calculating parametric relationships [43]. The choice to include a mixed (random) effect in the models was a way to avoid the potential influence of block that could induce spatial bias in this study. Because both soil temperature and soil water content fluctuate nonlinearly, GAMMs was run with soil temperature and soil water content as smooth terms, allowing flexible specifications of relationships without restricting relationships to be linear, quadratic or cubic. The model structure of the GAMM in the analysis was: carbon fluxes (soil temperature) × s (soil water content) + (1|Block), where ‘s’ indicates smooth function and ‘(1|Block)’ indicates random effect because of the completed randomized block experimental design. GAMMs were conducted using gamm4 package and the contour plot that visualizes the partial interaction of soil temperature and soil water content was performed using pvisgam function in itsadug package in R version 3.5.0.

3. Results

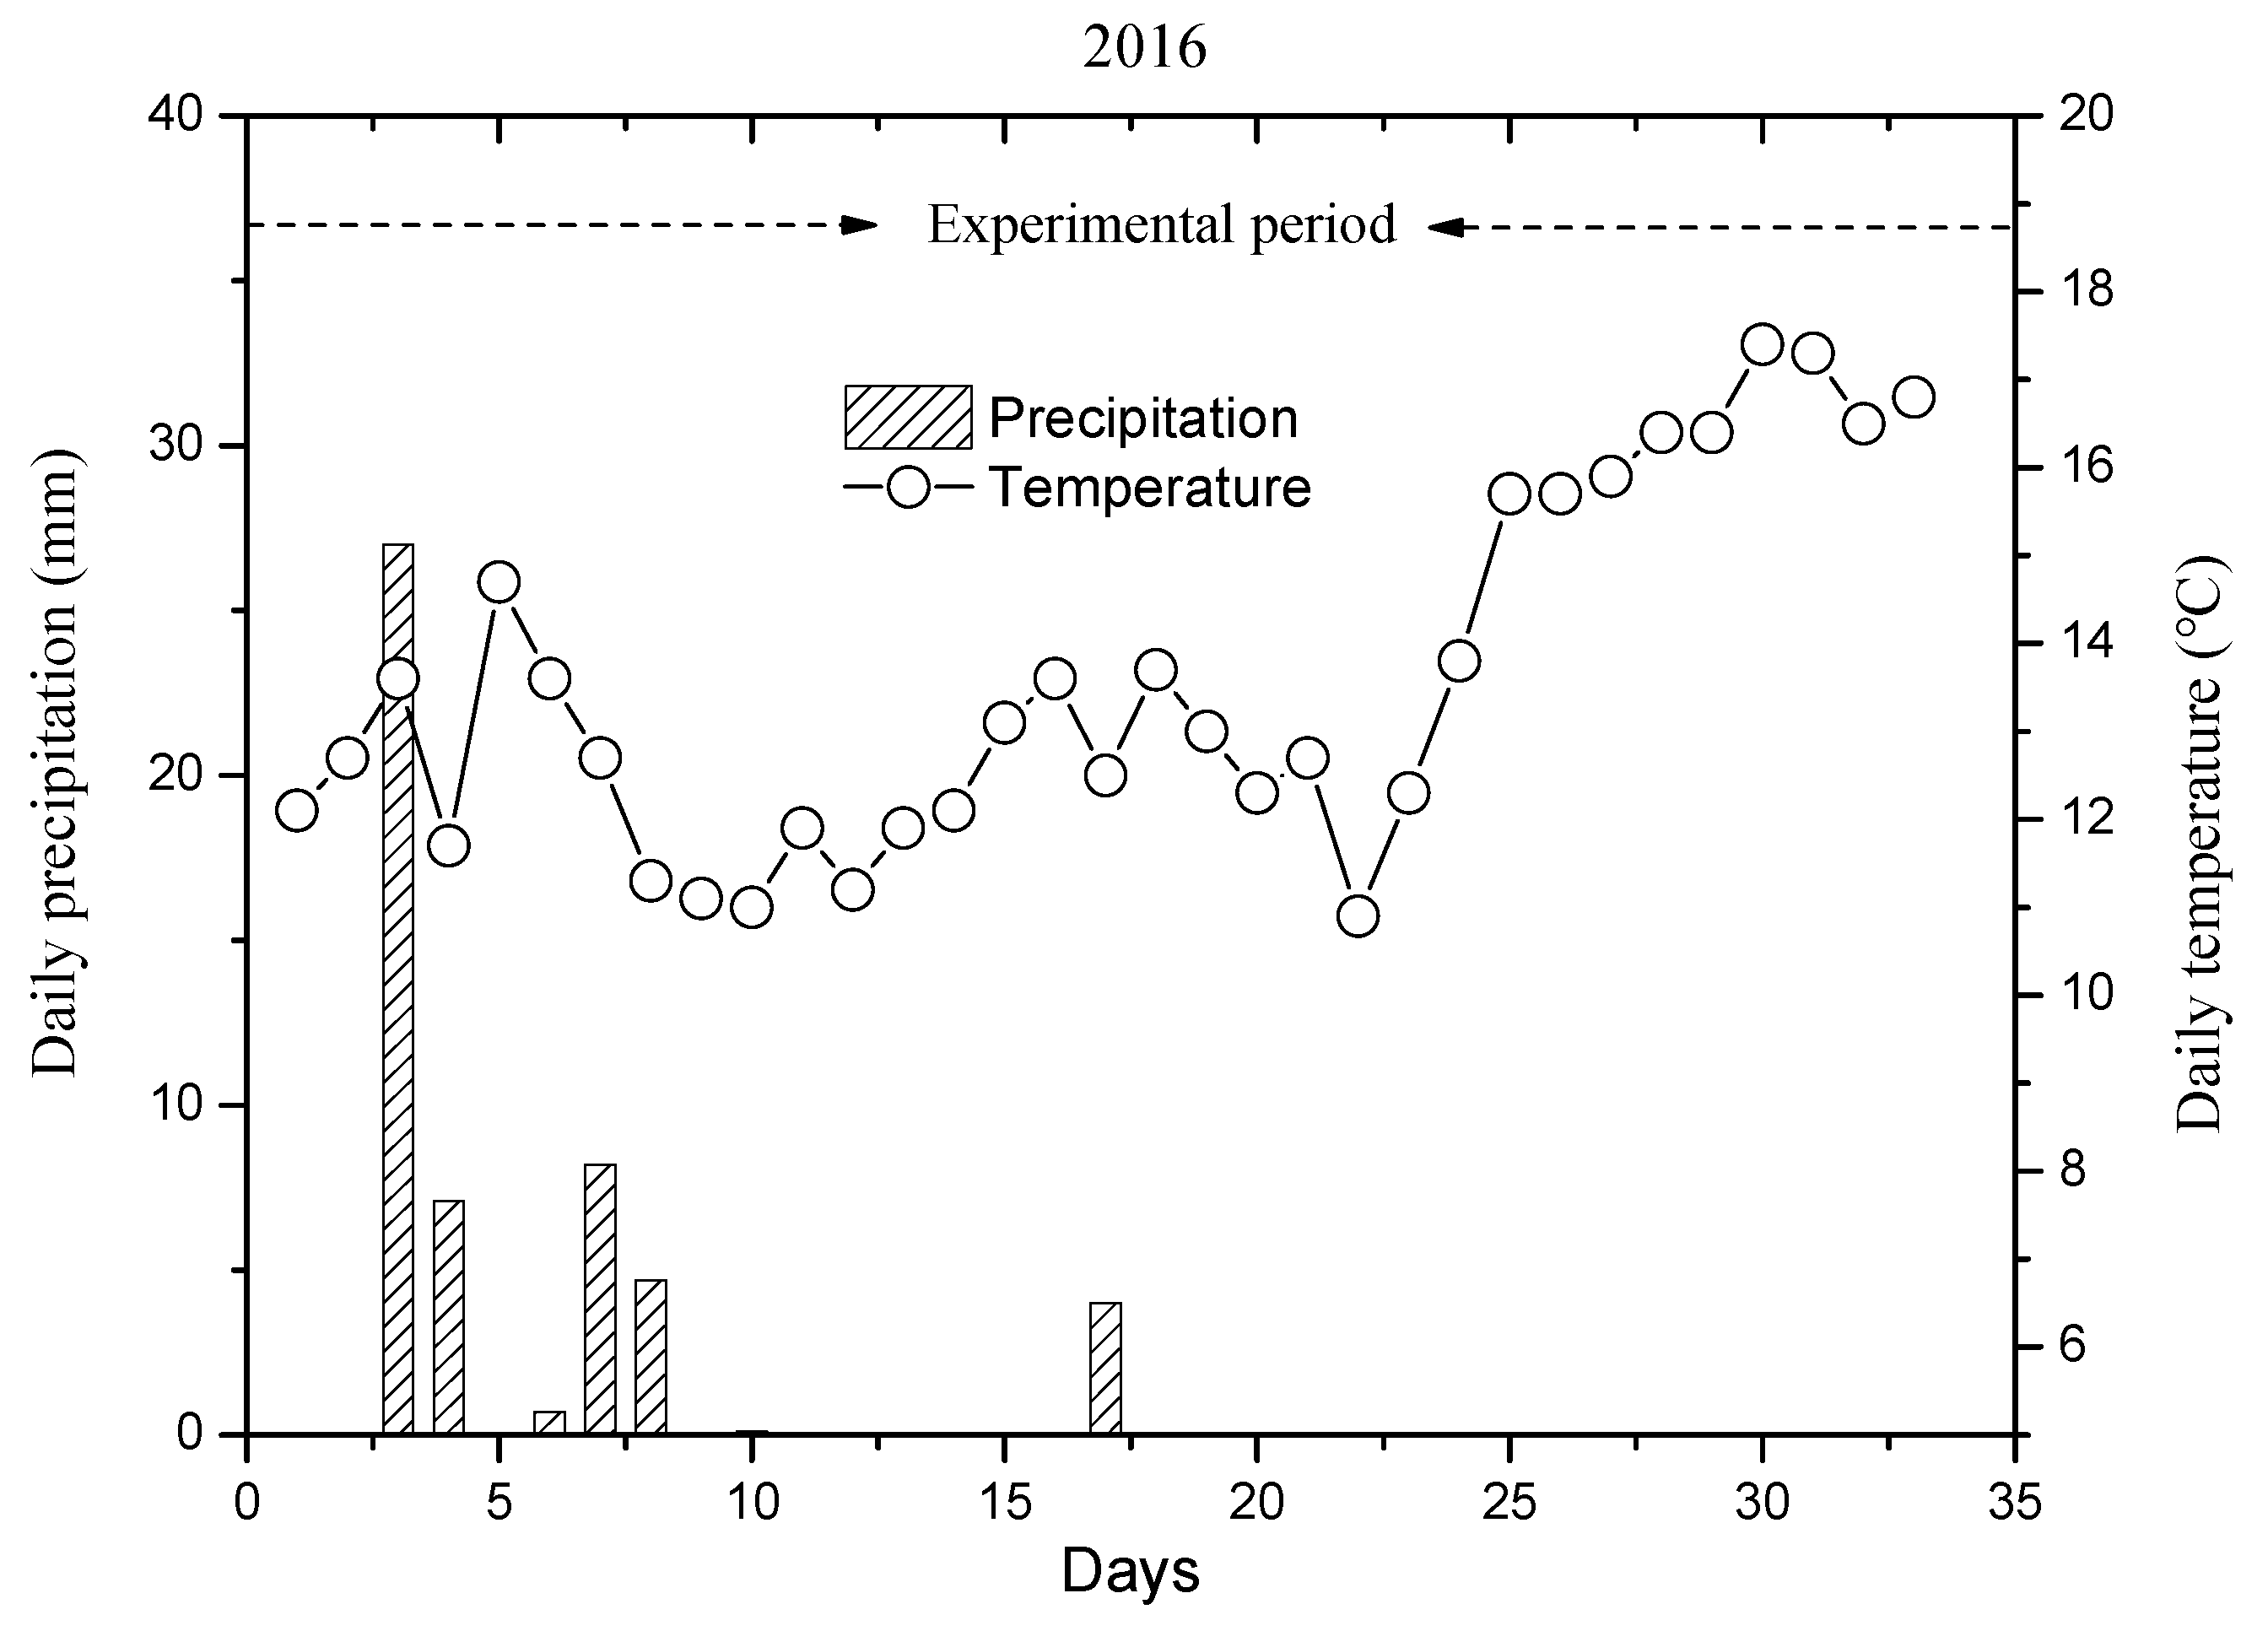
3.1. Hydrothermal Conditions

During the controlled experimental drought period (from 16 July 2016 to 26 August 2016), there were six natural precipitation events (Figure 2). The daily precipitation during this period was in the range of 0.1–27 mm, and the total precipitation was 67.9 mm, which was much lower than that of the average precipitation over the assessed 30-year time period (116.1 mm). The maximum and minimum daily temperatures during the experiment were 16.8 °C and 10.9 °C, respectively. The average temperature was 13.8 °C, which was higher than that during the same period the assessed 30-year time period (11.4 °C). In general, the climate was warm and dry during the controlled experimental period in 2016.

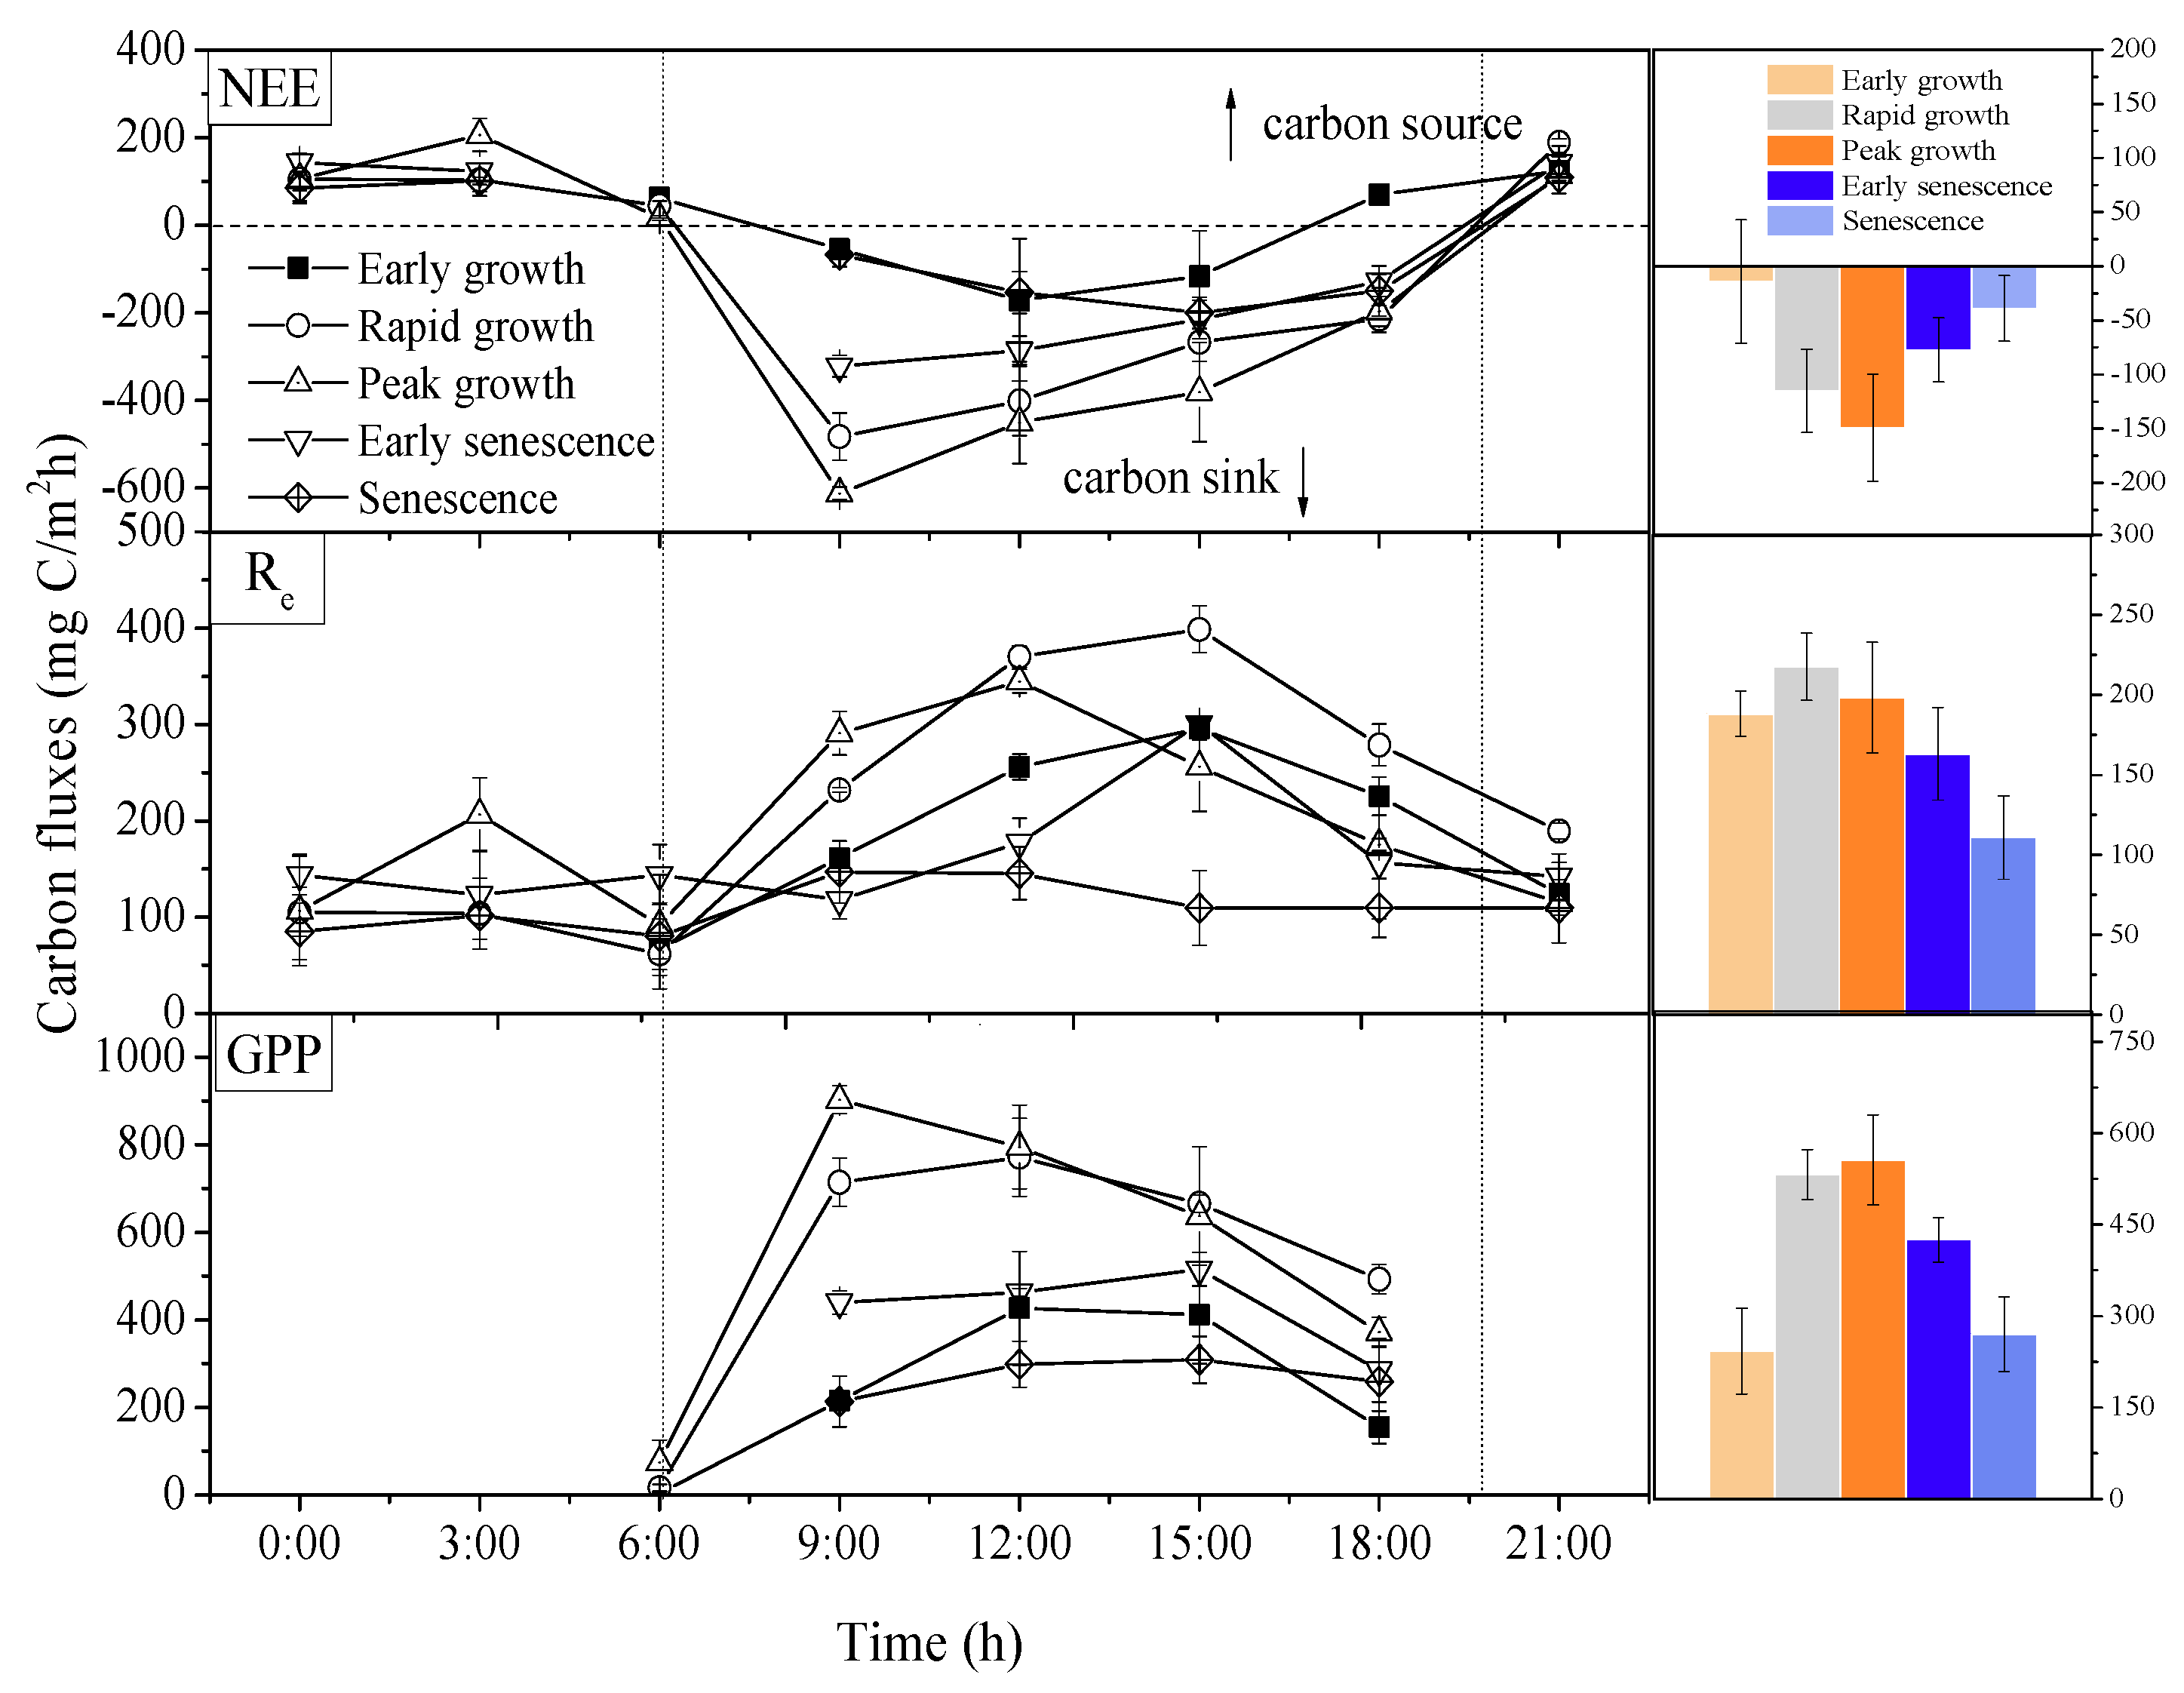
3.2. The Diurnal Patterns of Carbon Fluxes

The diurnal patterns of CO2 fluxes across different growth stages were very similar in shape but varied substantially in amplitude (Figure 3). The dynamic diurnal changes of NEE, Re, and GPP showed an asymmetric and single-peak curve form in the Zoige peatland, and the dynamic diurnal peaks of NEE, GPP, and Re were differently timed. Peak values of NEE and GPP occurred between 9:00–12:00 h for all five growth stages, as the carbon sequestration capacity of the ecosystem is the strongest at this time. The peak values of Re occurred between 12:00–15:00 h for all five growth stages, with the dynamic diurnal minimum of Re and GPP appearing around 6:00 a.m. in the morning. This ecosystem usually absorbed CO2 from the atmosphere (i.e., negative NEE value) between 6:00 and 19:00 h. The carbon sink ability of an ecosystem is the most powerful during the peak growth stage, followed by the rapid growth and early senescence stages, with the carbon sink function of an ecosystem at its weakest during the early growth stage (Figure 3).
The dynamic diurnal characteristics of CH4 flux were not apparent (Figure 4), as it transformed between a weak CH4 emission source and a CH4 sink in the degraded peatland ecosystem. The CH4 flux varied greatly between 0:00 and 6:00 h, with the highest and lowest values appearing during this period. In terms of daily average values, the CH4 emission flux of the ecosystem was the largest in early senescence stage, followed by the early growth stage, while the CH4 uptake sink of the ecosystem was present during the senescence stage (Figure 4).

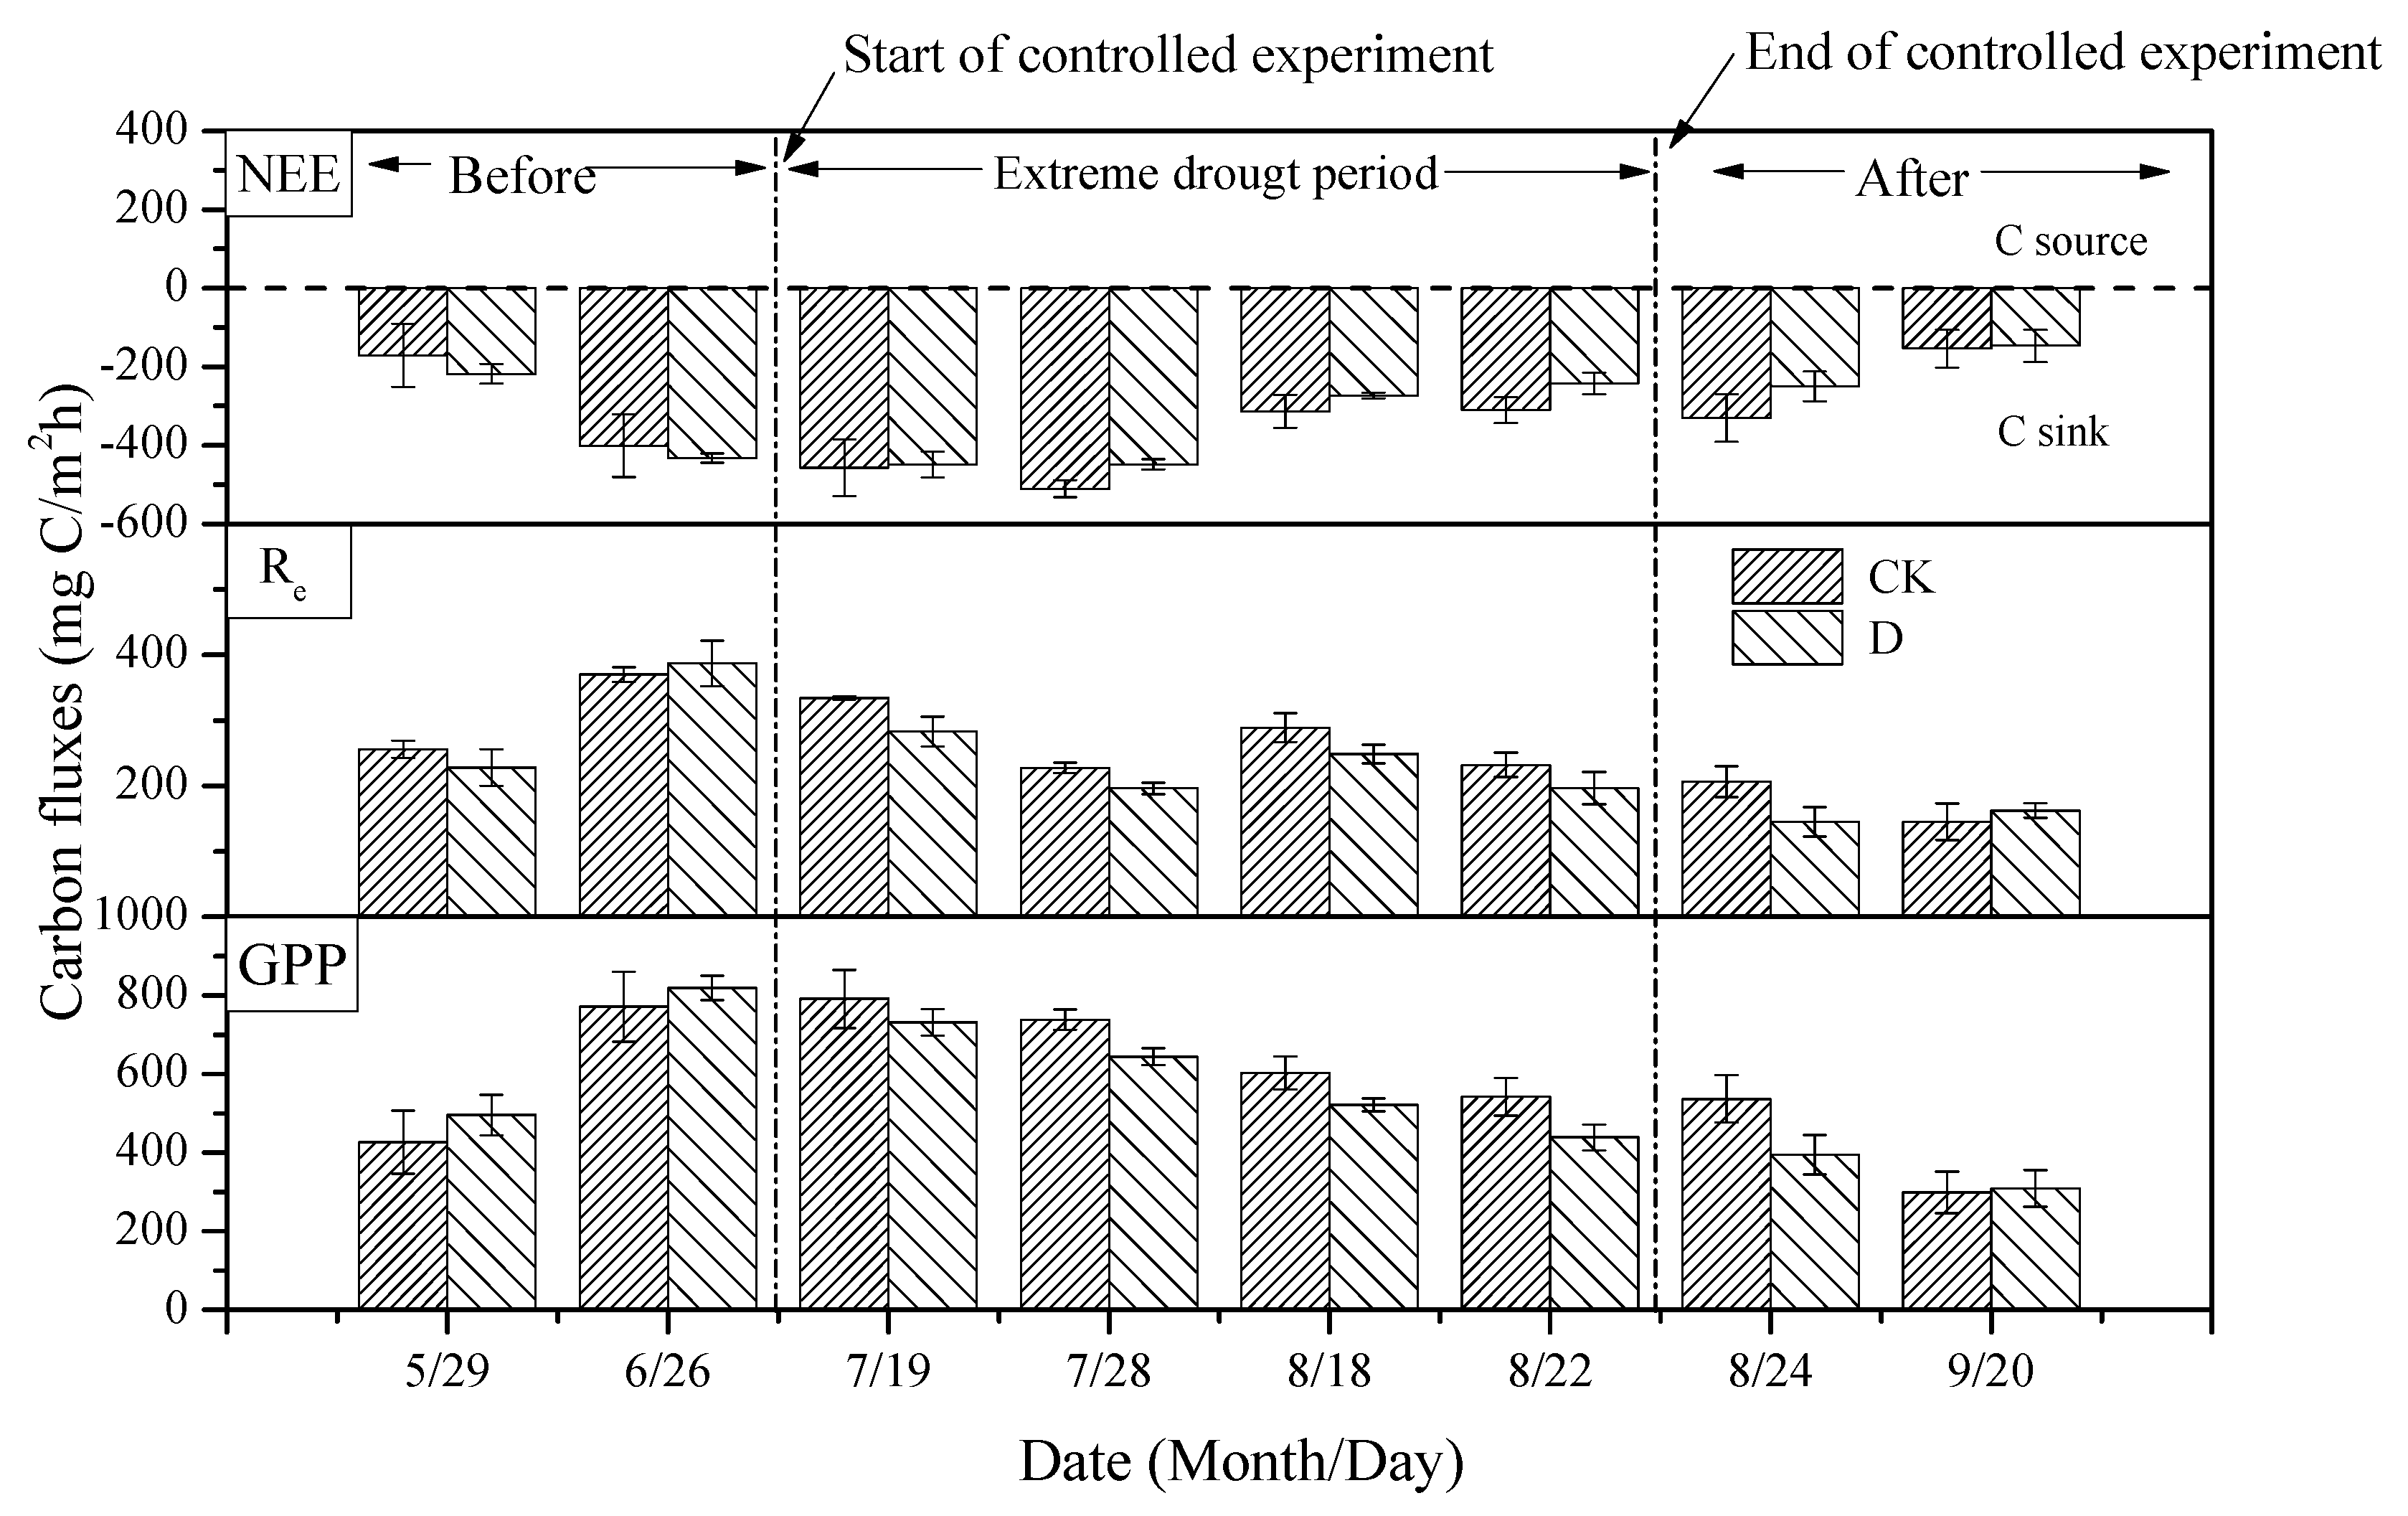
3.3. The Effects of Extreme Drought on CO2 Fluxes

In 2016, the seasonal dynamic change of the net ecosystem CO2 exchange (NEE), ecosystem respiration (Re), and gross primary productivity (GPP) showed an asymmetric single-peak curve in the ecosystem of the Zoige peatland (Figure 5). NEE and GPP reached their maximum values in July, which were 510.4 mg C/m2h and 791.2 mg C/m2h, respectively, while the total primary productivity was the highest and the dynamic trend of GPP was consistent with that of NEE during the growing season. The peak of Re was different from those of NEE and GPP, as it appeared in June at a value of 370.3 mg C/m2h. The carbon exchange was the strongest in the Zoige peatland ecosystem from June to August, the lowest values of NEE, Re, and GPP were −153.4 mg C/m2h, 145.3 mg C/m2h, and 298.7 mg C/m2h, respectively, occurred in September at the end of the growing season. Throughout the whole growing season, the peatland ecosystem of the Zoige plateau performed the function of a carbon sink under the conditions of the control treatment (CK) and extreme drought (D) treatment.
The whole growing season was divided into three stages in this study: before the control experiment (May to mid-July), the control experiment stage (mid-July to late August), and after the control experiment (late August to September) (Figure 5). Before the control experiment, there was no significant difference in NEE, Re, or GPP between CK and D (p > 0.05), and the carbon flux of the ecosystem was basically the same. During the control experiment, extreme drought significantly reduced Re and GPP (p < 0.05), with GPP and Re decreasing 14.5% and 12.6%, respectively, which resulted in a 11.3% decrease in carbon storage capacity of the ecosystem. GPP was first affected by the extreme drought and secondly by Re and NEE. After the control experiment, the enduring effects of extreme drought were still apparent, as the NEE, Re, and GPP still showed significant decreases. NEE, Re, and GPP were significantly different between the CK and D treatments on 24 August (p < 0.05), but there was no significant difference between NEE, Re, and GPP under the CK and D treatments on 20 September (p > 0.05). According to local meteorological data, there were 11 ecologically effective precipitation events from 22 August to 20 September, adding up to 134.3 mm. As a result, the extreme drought treatment gradually diminished, which alleviated the drought stress in the extreme drought treatment area to a certain extent.

3.4. The Effects of Extreme Drought on CH4 Fluxes

There was a statistically significant difference between the control and extreme drought treatment in regard to CH4 flux (p = 0.03), and the interaction between the treatment and time was also statistically significant (F = 3.05, p = 0.02), as shown in Figure 6. In May and June, the peatland was a weak CH4 source, and in July, August, and September there was a transition between a weak CH4 source and a weak CH4 sink in the Zoige plateau, which ranged from 0.043 mg·m−2h−1 to −0.133 mg·m−2h−1. The extreme drought treatment significantly reduced the CH4 fluxes of the ecosystem, and even degraded peatlands were transformed from a CH4 emission source into a CH4 sink. After the end of drought treatment, extreme drought also demonstrated a carry-over effect on the ecosystem, with the CH4 sink function of the ecosystem increasing gradually during this period.

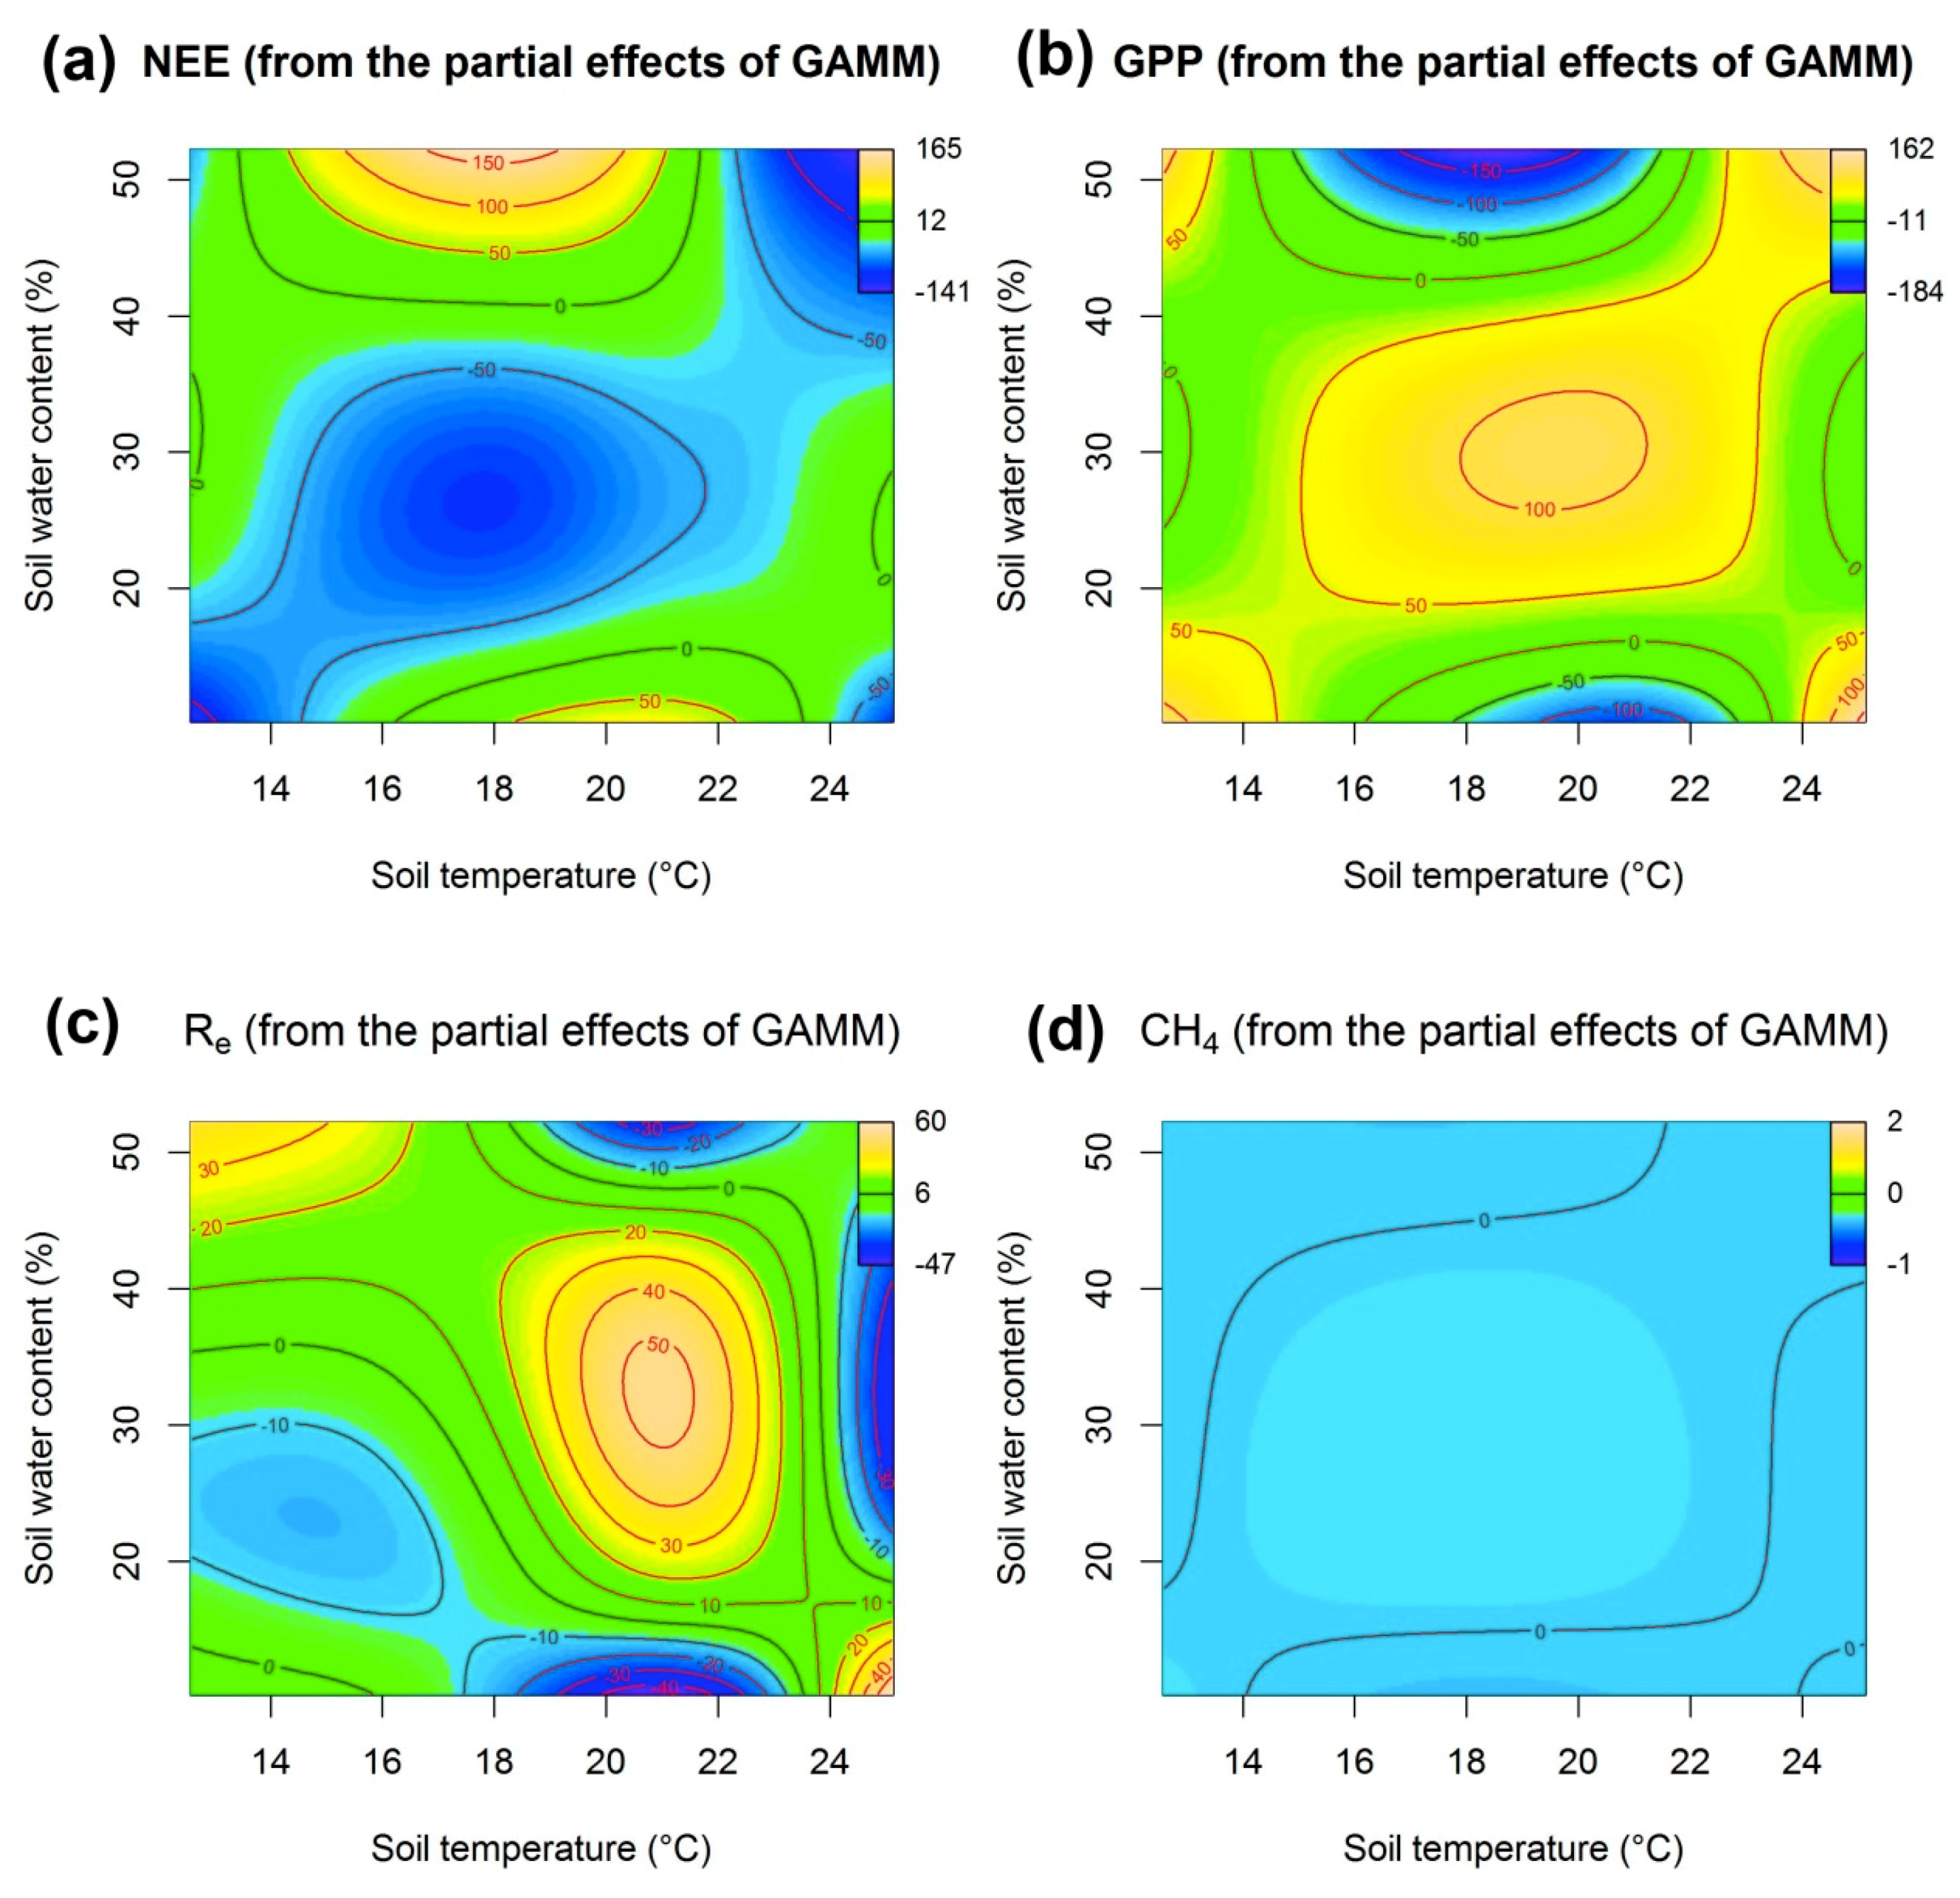
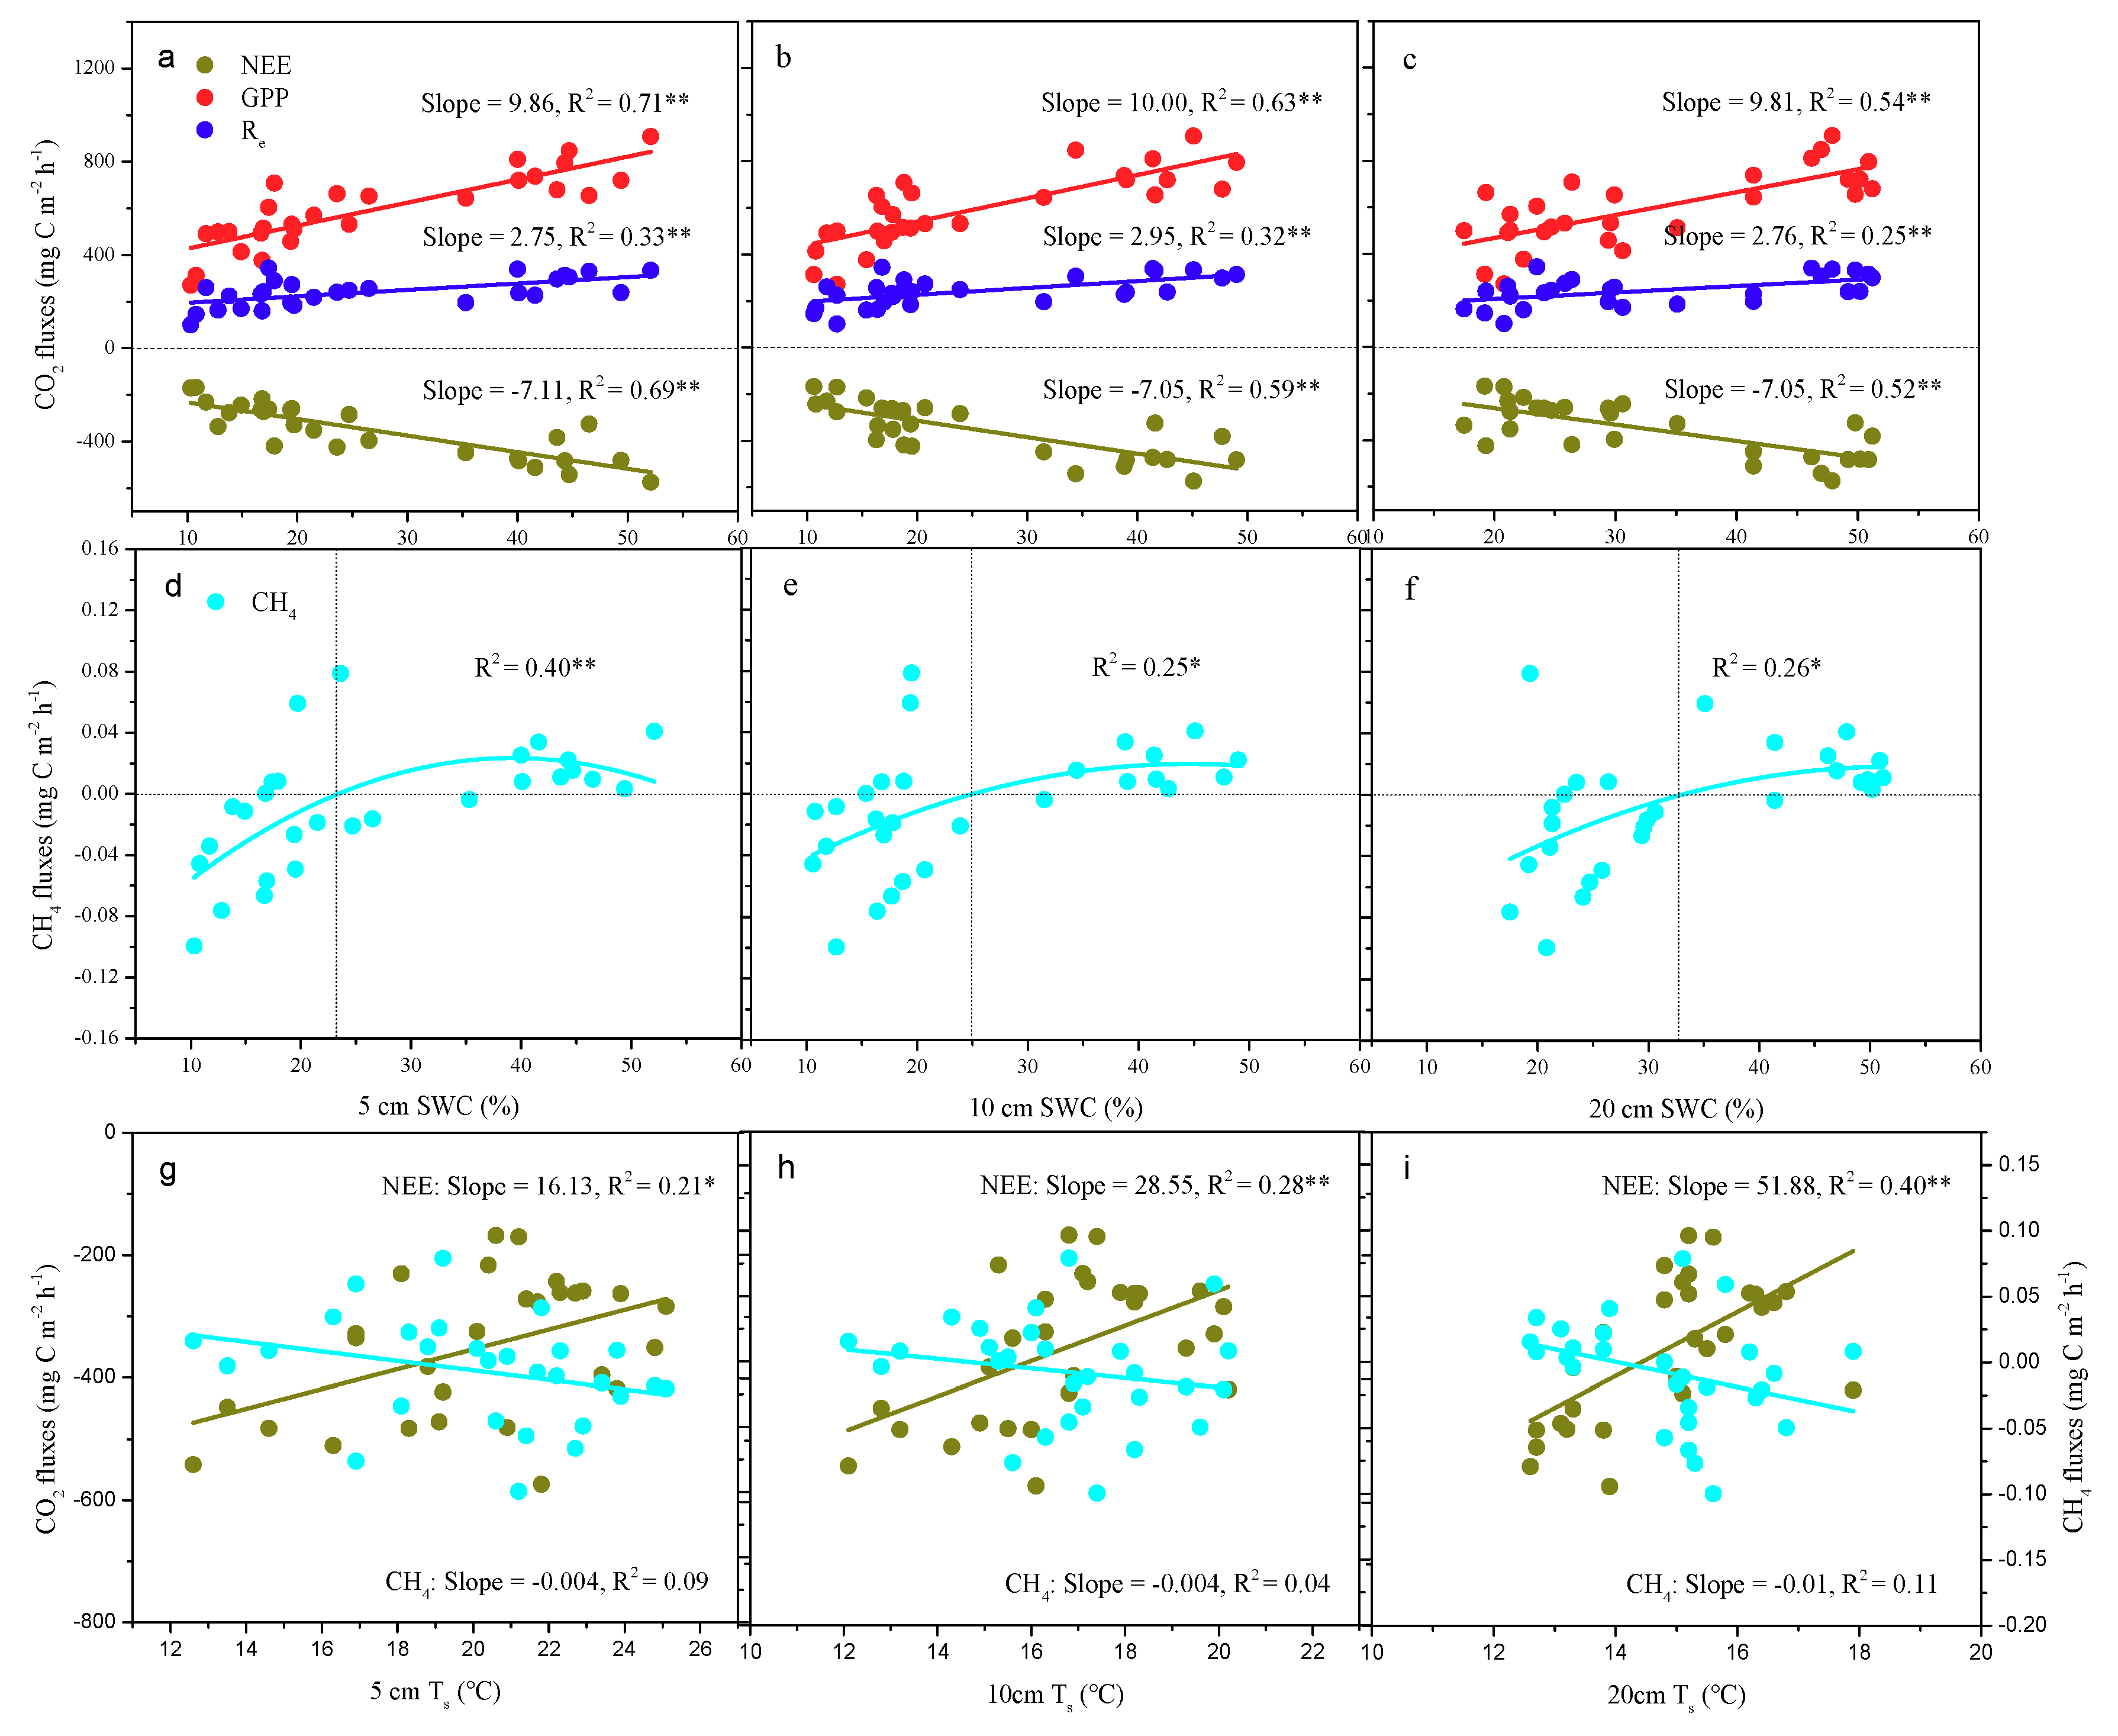
3.5. The Relationship between Carbon Fluxes and the Soil Microenvironment

Irrespective of the experimental treatment, the temporal variation in CO2 fluxes and CH4 flux could be primarily explained by the soil water and temperature (Figure 7). GPP (R2 ≥ 0.54, p < 0.01) and Re (R2 ≥ 0.25, p < 0.01) were both positively correlated with the soil water content at 5 cm, 10 cm, and 20 cm soil depths, and NEE was negatively correlated with the soil moisture content (R2 ≥ 0.52, p < 0.01; Figure 6a–c). There was a significant quadratic relationship between CH4 flux and soil water content (R2 ≥ 0.25, p < 0.05), with CH4 flux reaching a maximum value when the soil water content was more than 40% (Figure 7d–f). With the decrease in soil water content, the flux of GPP, Re, and CH4 were continuously decreased, and the decrease in GPP was more sensitive than that of Re, which resulted in an increase of the NEE in the ecosystem and a significant decrease in the CO2 fixing ability of the ecosystem (p < 0.01); however, the ability to absorb CH4 increased significantly (p < 0.05). In addition, the best correlation between CO2 fluxes, CH4 fluxes, and soil water content occurred at a depth of 5 cm, and this correlation decreased with the increase in soil depth. Moreover, there were several thresholds for the CH4 source/sink transition, which were an SWC5cm equal to 23%, an SWC10cm equal to 25%, and an SWC20cm equal to 32%. NEE was also positively correlated with soil temperature at 5 cm, 10 cm, and 20 cm depths (R2 ≥ 0.21, p < 0.05; Figure 7g–i). With the increase of soil depth, the correlation between soil temperature and NEE was gradually increased. However, there was no relationship between CH4 and soil temperature.
To test whether the drought effects on carbon budgets can be explained by changes in the microenvironment, the interaction between soil temperature and soil water content on NEE, GPP, Re and CH4 fluxes was also analyzed using generalized additive regression models with soil temperature and soil water content as smooth terms. In general, the strength of CO2 sink was low when soils were dry (soil water content below 15%) and wet (soil water content above 40%), and high when soil temperature and soil water content ranged from 14–22 °C and 20–40%, respectively (Figure 8a,b). Drought-induced soil water stress weakened the carbon sink capacity of the ecosystem, but within a certain range of soil temperature. Furthermore, the emission of CO2 was highest when soil temperature and soil water content ranged from 18–22 °C and 20–40%, respectively (Figure 8c). Additionally, when extreme drought led to soil water stress, the source and sink functions of CH4 for the ecosystem will change with the fluctuation of soil temperature. The function of CH4 source in ecosystem was stronger when the soil water content ranged from 20% to 40% and the soil temperature ranged from 15–21 °C (Figure 8d). These results also revealed an interactive effect of soil temperature and soil water content on the carbon dynamics to some extent, especially under drought stress.

4. Discussion

Extreme drought events can affect the structure and function of an ecosystem and result in a longer restoration process for the ecosystem or in a continuous change of the system state [8,11,33]. The carbon cycle is an important ecological process occurring within each ecosystem. Carbon sequestration and carbon emission are two essential parts of the carbon cycle and are closely related to water availability [44]. By controlling precipitation to simulate extreme drought, it was found that extreme drought events significantly reduced the GPP, Re, and CH4 fluxes of the peatland ecosystem in the Zoige plateau, and the effect of extreme drought on GPP was clearly greater than the effect on Re. Thus, the carbon sink function of this ecosystem was significantly reduced, which was the same conclusion as that previously reported by Li et al., and the GPP was more sensitive to extreme drought events than Re [45]. According to the prior study by Li et al., extreme drought was defined as 30 days’ rain-free period based on the local weather data for the most recent 58 years, and they found that extreme drought decreased GPP and to a lesser extent Re, leading to reduced net ecosystem CO2 uptake [45], which were consistent with our results. Precipitation is the critical factor affecting the sensitivity of GPP to extreme drought and the degree to which photosynthesis decreases during a drought depends on the physiological response of the plants to the available water and the changes occurring in the vegetation structure [46]. The physiological response of vegetation to drought includes a decrease in enzyme activity and the closing of stomata to prevent water loss [47]. Under extreme drought conditions, water stress can reduce the stomatal conductance of plant leaves, which leads to decreased photosynthetic and transpiration rates [48]. Additionally, the number and activity of microbes decrease sharply under extreme drought conditions [22], and this is likely the main reason for the decrease in NEE, Re, and GPP within an ecosystem. Additionally, extreme drought can create a carry-over effect on the carbon flux of an ecosystem in the later stages. Short-term drought effects can potentially alter plant growth dynamics and ecosystem physiology, and the impact on ecosystems may not be immediately apparent; however, a “memory” function in relation to drought by an ecosystem can promote a “carry-over-effect” from one growing season to the next [49,50].
Soil water content is an indicator of soil’s ability to supply water to plant root systems and soil microorganisms. When the soil water content is too low, plant physiological activity is blocked, which results in the decrease of the plant photosynthetic capacity and respiratory intensity [47]. This study showed that there was a significant correlation between soil water content and the ecosystem NEE, Re, and GPP at 5 cm, 10 cm, and 20 cm of soil depth. Recent studies have also shown that increasing precipitation increases carbon storage in peatlands, while the decrease in soil moisture will reduce carbon storage [51]. Extreme drought can significantly change the soil moisture state of an ecosystem, causing a significant decrease in soil water content, photosynthesis of aboveground plants, and enzyme activity during respiration as well as inhibit enzyme reactions performed by underground microorganisms [48]. The activities of microorganisms are closely related to the availability of soil carbon and nitrogen and are very sensitive to changes in soil moisture. Under extreme drought conditions, the number and activity of microorganisms decrease, and the mineralization rate and flux of soil carbon and nitrogen are clearly decreased [52,53]. Therefore, the soil water content during drought is the main driving factor controlling carbon exchange in an ecosystem, and the degree of reduction in the plant photosynthetic efficiency depends on the available water content of plants in the soil as well as the related physiological responses and structural changes of the vegetation [47].
The peatland ecosystem, in its natural condition, experiences extended periods of flooding. Additionally, a lot of litter in the soil cannot be decomposed due to the inhibition provided by low temperatures and an anaerobic environment. As such, soil organic matter is continuously accumulated, forming a partially degraded peat layer, which serves as a carbon sink to curb the rise in greenhouse gas concentrations [19,54]. However, a deficit in soil moisture caused by drought stress accelerates soil drying in peatland, which has a significant effect on greenhouse gas flux in this ecosystem [55,56]. In this study, it was found that the soil water content at different depths was positively correlated with CH4 flux, and the maximum emission was reached when the soil water content was greater than 40%, which is consistent with the results of Dijkstra et al. [57]. Dijkstra et al. demonstrated that the absorption of methane is highest at the middle water level, and the relationship between methane flux and soil moisture is a bell-shaped curve. In general, there is a positive correlation between methane flux and soil water content at a depth of 15–45 cm [58]. Tiemeyer et al. thought that the decrease of soil water content caused by drainage would reduce CH4 emission from natural peatland and even transform it into a small sink for CH4 [59]. With the decrease in soil moisture and the decrease in the degree of anaerobic, the peatland changed from an anaerobic to an aerobic environment, which reduced soil methane production and increased the thickness of the oxidation layer. The methane produced by anaerobic decomposition was oxidized by more methanogens, which reduced the emission flux of CH4 and even caused a change in the CH4 source/sink state [55]. It has also been suggested that drought can reduce the supply of microbial respiration [28], decrease the activity of methanogenic bacteria, and thus reduce the production and release of CH4 [6].

5. Conclusions

In conclusion, the goal of this study was to investigate how carbon budgets were affected by extreme drought events in the Zoige alpine peatland. The results showed that extreme drought changed the greenhouse gas exchange, significantly reduced CO2 absorption and emission, and reduced the CH4 emission flux of the peatland ecosystem. Under these conditions, even degraded peatland was transformed from a CH4 emission source into a CH4 sink, and the drought conditions also had carry-over effects on the carbon budget in the later stages of drought. Soil water content and soil temperature mainly mediate the response of CO2 and CH4 fluxes to the extreme events in this alpine peatland. However, the mechanisms by which extreme drought effects the capacity to sequester carbon remain unclear. Hence, long-term experiments are still needed to verify the impact mechanism of extreme drought events on carbon budgets in alpine peatland ecosystems.

Author Contributions

X.K. and L.Y. contributed equally to this work. conceptualization, X.K. and Y.L.; methodology, X.K. and Y.Z.; software, L.Y.; validation, X.K., H.W. and L.C.; formal analysis, K.Z., Z.Y. and J.W.; investigation, X.K. and X.Z.; resources, W.L.; data curation, Y.H.; writing—original draft preparation, X.K. and L.Y.; writing—review and editing, X.K., Y.L. and J.W.; visualization, X.K.; supervision, Y.L., J.W.; project administration, X.K.; funding acquisition, X.K.

Funding

This research was funded by [the National Key Research and Development Program of China] grant number [2016YFC0501804], by [the National Nonprofit Institute Research Grant], grant number [CAFYBB2017QB009], and by [the National Natural Science Foundation of China], grant number [41701113], [41877421] and [31770511].

Acknowledgments

This work was supported by the National Key Research and Development Program of China (Grant No. 2016YFC0501804), the National Nonprofit Institute Research Grant (CAFYBB2017QB009), and the National Natural Science Foundation of China (Grant No. 41701113, 41877421, 31770511). We thank the anonymous reviewers and editors for their valuable comments and suggestions on the manuscript.

Conflicts of Interest

The authors declare no conflict of interest.

References

  1. IPCC. Climate Change 2013: The Physical Science Basis. Contribution of Working Group I to the Fifth Assessment Report of the Intergovernmental Panel on Climate Change; Cambridge University Press: Cambridge, UK; New York, NY, USA, 2013. [Google Scholar]
  2. Kreyling, J.; Wenigmann, M.; Beierkuhnlein, C.; Jentsch, A. Effects of extreme weather events on plant productivity and tissue die-back are modified by community composition. Ecosystems 2008, 11, 752–763. [Google Scholar] [CrossRef]
  3. Glaser, B.; Jentsch, A.; Kreyling, J.; Beierkuhnlein, C. Soil-moisture change caused by experimental extreme summer drought is similar to natural inter-annual variation in a loamy sand in Central Europe. J. Plant. Nutr. Soil Sci. 2013, 176, 27–34. [Google Scholar] [CrossRef]
  4. Graw, V.; Ghazaryan, G.; Dall, K.; Delgado Gómez, A.; Abdel-Hamid, A.; Jordaan, A.; Piroska, R.; Post, J.; Szarzynski, J.; Walz, Y.; et al. Drought Dynamics and Vegetation Productivity in Different Land Management Systems of Eastern Cape; South Africa—A Remote Sensing Perspective. Sustainability 2017, 9, 1728. [Google Scholar] [CrossRef]
  5. Thakur, M.P.; Reich, P.B.; Hobbie, S.E. Reduced feeding activity of soil detritivores under warmer and drier conditions. Nat. Clim. Chang. 2018, 8, 75. [Google Scholar] [CrossRef] [PubMed]
  6. Longo, M.; Knox, R.G.; Levine, N.M.; Alves, L.F.; Bonal, D.; Camargo, P.B.; Fitzjarrald, D.R.; Hayek, M.N.; Restrepo-Coupe, N.; Saleska, S.R.; et al. Ecosystem heterogeneity and diversity mitigate Amazon forest resilience to frequent extreme droughts. New Phytol. 2018, 219, 914–931. [Google Scholar] [CrossRef] [PubMed]
  7. Melinda, D.; Smith, A.K.K.; Scott, L.; Collins, A. Framework for assessing ecosystem dynamics in response to chronic resource alterations induced by global change. Ecology 2009, 90, 3279–3289. [Google Scholar]
  8. Um, M.J.; Kim, M.M.; Kim, Y.; Park, D. Drought Assessment with the Community Land Model for 1951–2010 in East Asia. Sustainability 2018, 10, 2100. [Google Scholar] [CrossRef]
  9. Reichstein, M. Climate extremes and the carbon cycle. Nature 2013, 500, 287–295. [Google Scholar] [CrossRef] [PubMed]
  10. Smith, M.D. The ecological role of climate extremes: Current understanding and future prospects. J. Ecol. 2011, 99, 651–655. [Google Scholar] [CrossRef]
  11. Jiang, Z. Extreme climate events in China: IPCC-AR4 model evaluation and projection. Clim. Chang. 2012, 110, 385–401. [Google Scholar] [CrossRef]
  12. Du, L.; Mikle, N.; Zou, Z. Global patterns of extreme drought-induced loss in land primary production: Identifying ecological extremes from rain-use efficiency. Sci. Total Environ. 2018, 628–629, 611–620. [Google Scholar] [CrossRef] [PubMed]
  13. Jentsch, A.; Kreyling, J.; Beierkuhnlein, C. A new generation of climate-change experiments: Events, not trends. Front. Ecol. Environ. 2007, 5, 365–374. [Google Scholar] [CrossRef]
  14. Turunen, J.; Tomppo, E.; Tolonen, K.; Reinikainen, A. Estimating carbon accumulation rates of undrained mires in Finland–application to boreal and subarctic regions. Holocene 2002, 12, 69–80. [Google Scholar] [CrossRef]
  15. Fleischer, E.; Khashimov, I.; Hölzel, N.; Klemm, O. Carbon exchange fluxes over peatlands in Western Siberia: Possible feedback between land-use change and climate change. Sci. Total Environ. 2016, 545, 424–433. [Google Scholar] [CrossRef] [PubMed]
  16. Kang, X.M.; Hao, Y.B.; Cui, X.Y.; Chen, H.; Huang, S.X.; Du, Y.G.; Li, W.; Kardol, P.; Xiao, X.M.; Cui, L.J. Variability and changes in climate, phenology, and gross primary production of an Alpine wetland ecosystem. Remote Sens. 2016, 8, 391. [Google Scholar] [CrossRef]
  17. Cui, L.J.; Kang, X.M.; Li, W.; Hao, Y.B.; Zhang, Y.; Wang, J.Z.; Yan, L.; Zhang, X.D.; Zhang, M.Y.; Zhou, J.P.; et al. Rewetting decreases carbon emissions from the Zoige alpine peatland on the Tibetan Plateau. Sustainability 2017, 9, 948. [Google Scholar] [CrossRef]
  18. Zhou, L.; Zhou, G.; Jia, Q.Y. Annual cycle of CO2 exchange over a reed (Phragmites australis) wetland in Northeast China. Aquat. Bot. 2009, 91, 91–98. [Google Scholar] [CrossRef]
  19. Hao, Y.B.; Cui, X.Y.; Wang, Y.F.; Mei, X.R.; Kang, X.M.; Wu, N.; Luo, P.; Zhu, D. Predominance of precipitation and temperature controls on ecosystem CO2 exchange in Zoige alpine wetlands of Southwest China. Wetlands 2011, 31, 413–422. [Google Scholar] [CrossRef]
  20. Polsenaere, P.; Lamaud, E.; Lafon, V. Spatial and temporal CO2 exchanges measured by eddy covariance over a temperate intertidal flat and their relationships to net ecosystem production. Biogeosciences 2012, 9, 249–268. [Google Scholar] [CrossRef]
  21. Sanaullah, M.; Chabbi, A.; Rumpel, C.; Kuzyakov, Y. Carbon allocation in grassland communities under drought stress followed by 14C pulse labeling. Soil Boil. Biochem. 2012, 55, 132–139. [Google Scholar] [CrossRef]
  22. Jentsch, A. Climate extremes initiate ecosystem-regulating functions while maintaining productivity. J. Ecol. 2011, 99, 689–702. [Google Scholar] [CrossRef] [Green Version]
  23. Royer, P.D.; Cobb, N.S.; Clifford, M.J.; Huang, C.Y.; Breshears, D.D.; Adams, H.D.; Villegas, J.C. Extreme climatic event-triggered overstorey vegetation loss increases understorey solar input regionally: Primary and secondary ecological implications. J. Ecol. 2011, 99, 714–723. [Google Scholar] [CrossRef]
  24. Kolb, T.; Dore, S.; Montes-Helu, M. Extreme late-summer drought causes neutral annual carbon balance in southwestern ponderosa pine forests and grasslands. Environ. Res. Lett. 2013, 8, 015015. [Google Scholar] [CrossRef] [Green Version]
  25. Sotta, E.D.; Veldkamp, E.; Schwendenmann, L.; Guimarães, B.R.; Paixão, R.K.; Ruivo, M.D.L.P.; Lola Da Costa, A.C.; Meir, P. Effects of an induced drought on soil carbon dioxide (CO2) efflux and soil CO2 production in an Eastern Amazonian rainforest, Brazil. Glob. Chang. Biol. 2007, 13, 2218–2229. [Google Scholar] [CrossRef]
  26. Cox, P.M.; Betts, R.A.; Jones, C.D.; Spall, S.A.; Totterdell, I.J. Acceleration of global warming due to carbon-cycle feedbacks in a coupled climate model. Nature 2000, 408, 184–187. [Google Scholar] [CrossRef] [PubMed]
  27. Adams, H.D.; Macalady, A.K.; Breshears, D.D.; Allen, C.D.; Stephenson, N.L.; Saleska, S.R.; Huxman, T.E. Climate-induced tree mortality: Earth system consequences. Eos Trans. Am. Geophys. Union 2010, 91, 153. [Google Scholar] [CrossRef]
  28. Hartley, I.P.; Armstrong, A.F.; Murthy, R. The dependence of respiration on photosynthetic substrate supply and temperature: Integrating leaf, soil and ecosystem measurements. Glob. Chang. Biol. 2006, 12, 1954–1968. [Google Scholar] [CrossRef]
  29. Mueller, R.C. Differential tree mortality in response to severe drought: Evidence for long-term vegetation shifts. J. Ecol. 2005, 93, 1085–1093. [Google Scholar] [CrossRef]
  30. Olefeldt, D.; Euskirchen, E.S.; Harden, J. A decade of boreal rich fen greenhouse gas fluxes in response to natural and experimental water table variability. Glob. Chang. Biol. 2017, 23, 6. [Google Scholar] [CrossRef] [PubMed]
  31. Chen, H.; Yang, G.; Peng, C.H.; Zhang, Y.; Zhu, D.; Zhu, Q.A.; Hu, J.; Wang, M.; Zhan, W.; Zhu, E.X.; et al. The carbon stock of alpine peatlands on the QinghaieTibetan Plateau during the Holocene and their future fate. Quat. Sci. Rev. 2014, 95, 151–158. [Google Scholar] [CrossRef]
  32. Zheng, D.; Li, B.Y. Progress in studies on geographical environments of the Qinghai-Xizang plateau. Sci. Geo Sin. 1999, 19, 295–302. [Google Scholar]
  33. Kang, X.M.; Wang, Y.F.; Chen, H.; Tian, J.Q.; Cui, X.Y.; Rui, Y.C.; Zhong, L.; Kardol, P.; Hao, Y.B.; Xiao, X.M. Modeling carbon fluxes using multi-temporal MODIS imagery and CO2 eddy flux tower data in Zoige Alpine Wetland. Wetlands 2014, 34, 603–618. [Google Scholar] [CrossRef]
  34. Wang, M.; Yang, G.; Gao, Y.H.; Chen, H.; Wu, N.; Peng, C.H.; Zhu, Q.A.; Zhu, D.; Wu, J.H.; He, Y.X.; et al. Higher recent peat C accumulation than that during the Holocene on the Zoige Plateau. Quat. Sci. Rev. 2015, 114, 116–125. [Google Scholar] [CrossRef] [Green Version]
  35. Corrigan, E.; Nieuwenhuis, M. Using Goal-Programming to Model the Effect of Stakeholder Determined Policy and Industry Changes on the Future Management of and Ecosystem Services Provision by Ireland’s Western Peatland Forests. Sustainability 2017, 9, 11. [Google Scholar] [CrossRef]
  36. Tian, Y.B.; Xiong, M.B.; Xiong, X.S.; Song, G.Y. The organic carbon distribution and flow in wetland soil-plant system in ruoergai plateau. Acta Phytoecol. Sin. 2003, 27, 490–495. [Google Scholar]
  37. Chen, H.; Wu, N.; Gao, Y.H.; Wang, Y.F.; Luo, P.; Tian, J.Q. Spatial variations on methane emissions from Zoige alpine wetlands of Southwest China. Sci. Total Environ. 2009, 407, 1097–1104. [Google Scholar] [CrossRef] [PubMed] [Green Version]
  38. Zeng, M.; Zhu, C.; Song, Y.; Ma, C.; Yang, Z. Paleoenvironment change and its impact on carbon and nitrogen accumulation in the Zoige wetland, northeastern Qinghai-Tibetan Plateau over the past 14,000 years. Geochem. Geophys. Geosyst. 2017, 18, 1775–1792. [Google Scholar] [CrossRef]
  39. China Meteorological Data Network. Available online: http://data.cma.cn/site/index.html (accessed on 10 November 2018).
  40. Mastepanov, M.; Sigsgaard, C.; Dlugokencky, E.J.; Houweling, S.; Ström, L.; Tamstorf, M.P.; Christensen, T.R. Large tundra methane burst during onset of freezing. Nature 2008, 456, 628–630. [Google Scholar] [CrossRef] [PubMed] [Green Version]
  41. Law, B.E.; Falge, E.; Gu, L.; Baldocchi, D.D.; Bakwin, P.; Berbigier, P.; Davis, K. Environmental controls over carbon dioxide and water vapor exchange of terrestrial vegetation. Agr. For. Meteorol. 2002, 113, 97–120. [Google Scholar] [CrossRef] [Green Version]
  42. Wood, S.N. Low-Rank Scale-Invariant Tensor Product Smooths for Generalized Additive Mixed Models. Biometrics 2006, 62, 1025–1036. [Google Scholar] [CrossRef] [PubMed] [Green Version]
  43. Wood, S.N. Generalized Additive Models: An Introduction with R; Chapman and Hall/CRC: Boca Raton, FL, USA, 2006. [Google Scholar]
  44. van Straaten, O. Spatial and temporal effects of drought on soil CO2 efflux in a cacao agroforestry system in Sulawesi. Biogeosciences 2010, 7, 1223–1235. [Google Scholar] [CrossRef]
  45. Li, L.F.; Fan, W.Y.; Kang, X.M.; Wang, Y.F.; Cui, X.Y.; Xu, C.Y.; Griffin, K.L.; Hao, Y.B. Responses of greenhouse gas fluxes to climate extremes in a semiarid grassland. Atmos. Environ. 2016, 142, 32–42. [Google Scholar] [CrossRef]
  46. Shi, Z.; Thomey, M.L.; Mowll, W. Differential effects of extreme drought on production and respiration: Synthesis and modeling analysis. Biogeosciences 2014, 11, 621–633. [Google Scholar] [CrossRef] [Green Version]
  47. Van der Molen, M.K. Drought and ecosystem carbon cycling. Agric. For. Meteorol. 2011, 151, 765–773. [Google Scholar] [CrossRef]
  48. Lefi, E.; Medrano, H.; Cifre, J. Water uptake dynamics, photosynthesis and water use efficiency in field-grown Medicago arborea and Medicago citrina under prolonged Mediterranean drought conditions. Ann. Appl. Biol. 2004, 144, 299–307. [Google Scholar] [CrossRef]
  49. Flanagan, L.B. Phenology of plant production in the Northwestern Great Plains: Relationships with carbon isotope discrimination, net ecosystem productivity and ecosystem respiration. Phenol. Ecosyst. Processes 2009, 10, 169–185. [Google Scholar]
  50. Jia, X.; Zha, T.; Gong, J. Carbon and water exchange over a temperate semi-arid shrubland during three years of contrasting precipitation and soil moisture patterns. Agric. For. Meteorol. 2016, 228–229, 120–129. [Google Scholar] [CrossRef]
  51. Pitchford, J.L.; Wu, C.; Lin, L.S. Climate Change Effects on Hydrology and Ecology of Wetlands in the Mid-Atlantic Highlands. Wetlands 2011, 32, 21–33. [Google Scholar] [CrossRef]
  52. Austin, A.T.; Yahdjian, L.; Stark, J.M.; Belnap, J.; Porporato, A.; Norton, U.; Ravetta, D.A.; Schaeffer, S.M. Water pulses and biogeochemical cycles in arid and semiarid ecosystems. Oecologia 2004, 141, 221–235. [Google Scholar] [CrossRef] [PubMed]
  53. Zhang, B.; Zhu, J.J.; Liu, H.M.; Pan, Q.M. Effects of extreme rainfall and drought events on grassland ecosystems. Acta Phytoecol. Sin. 2014, 38, 1008–1018. [Google Scholar]
  54. Wieder, R.K.; Vitt, D.H.; Benscoter, B.W. Peatlands and the Boreal Forest. Boreal Peatland Ecosystems. Boreal Peatl. Ecosyst. 2006, 188, 1–8. [Google Scholar]
  55. Tiemeyer, B.; Albiac Borraz, E.; Augustin, J.; Bechtold, M.; Beetz, S.; Beyer, C.; Drösler, M.; Ebli, M.; Eickenscheidt, T.; Fiedler, S. High emissions of greenhouse gases from grasslands on peat and other organic soils. Glob. Chang. Biol. 2016, 22, 4134–4149. [Google Scholar] [CrossRef] [PubMed]
  56. Kuiper, J.J.; Mooij, W.M.; Bragazza, L. Plant functional types define magnitude of drought response in peatland CO2 exchange. Ecology 2014, 95, 123–131. [Google Scholar] [CrossRef] [PubMed]
  57. Dijkstra, F.A.; Morgan, J.A.; Follett, R.F. Climate change reduces the net sink of CH4 and N2O in a semiarid grassland. Glob. Chang. Biol. 2013, 19, 1816–1826. [Google Scholar] [CrossRef] [PubMed]
  58. Blankinship, J.C.; Brown, J.R.; Dijkstra, P. Effects of interactive global changes on methane uptake in an annual grassland. J. Geophy. Res. Biogeosci. 2010, 115, G02008. [Google Scholar] [CrossRef]
  59. Tian, J.Q.; Zhu, Y.B.; Kang, X.M. Effects of drought on the archaeal community in soil of the Zoige wetlands of the Qinghai–Tibetan plateau. Eur. J. Soil Biol. 2012, 52, 84–90. [Google Scholar] [CrossRef]
Figure 1. Location of the study area in the Zoige alpine peatland.
Sustainability 10 04285 g001
Figure 2. The changes of temperature and precipitation over the extreme experimental period in 2016.
Sustainability 10 04285 g002
Figure 3. Diurnal dynamics of CO2 fluxes for different plant growth stages in 2016. Early growth: DOY 121–152; Rapid growth: DOY 153–182; Peak growth: DOY 183–244; Early senescence: DOY 245–274; Senescence: DOY 275–304. Legend: NEE, net ecosystem CO2 exchange; Re, ecosystem respiration; GPP, gross primary productivity. DOY, day of year. There were three replicates, and all the data were represented in mean ± SE.
Sustainability 10 04285 g003
Figure 4. Diurnal dynamics of CH4 fluxes in 2016. Early growth: DOY 121–152; Rapid growth: DOY 153–182; Peak growth: DOY 183–244; Early senescence: DOY 245–274; Senescence: DOY 275–304. DOY, day of year.
Sustainability 10 04285 g004
Figure 5. Effects of extreme drought on CO2 fluxes (NEE, Re and GPP) in 2016.
Sustainability 10 04285 g005
Figure 6. Effects of extreme drought on CH4 fluxes in 2016.
Sustainability 10 04285 g006
Figure 7. Relationships between (ac) NEE, Re, GPP and soil water content; (df) CH4 fluxes and soil water content; (gi) NEE, CH4 fluxes and soil temperature in 2016. Legend: *, significant level at the 0.05 level; **, significant level at the 0.01 level; NEE, net ecosystem CO2 exchange; Re, ecosystem respiration; GPP, gross primary productivity; SWC, soil water content; Ts, soil temperature.
Sustainability 10 04285 g007
Figure 8. Interactive effects of soil temperature and soil water content on NEE, GPP, Re and CH4. The heat map is based on the partial residuals of the smooth terms (soil temperature and soil water content) used in generalized additive models. Because of negative values of NEE, the yellow and blue color represents low and high carbon sink, respectively (a). Light and dark blue represents CH4 uptake and emission, respectively (d).
Sustainability 10 04285 g008

