Article

Characterizing Livestock Production in Portuguese Sown Rainfed Grasslands: Applying the Inverse Approach to a Process-Based Model

by
Tiago G. Morais
1,*,
Ricardo F. M. Teixeira
1,
Nuno R. Rodrigues
2 and
Tiago Domingos
1
1
MARETEC—Marine, Environment and Technology Centre, Instituto Superior Técnico, Universidade de Lisboa, 1049-001 Lisboa, Portugal
2
Terraprima—Serviços Ambientais, Sociedade Unipessoal, Lda, 2135-199 Samora Correia, Portugal
*
Author to whom correspondence should be addressed.
Sustainability 2018, 10(12), 4437; https://doi.org/10.3390/su10124437
Submission received: 25 September 2018 / Revised: 19 November 2018 / Accepted: 23 November 2018 / Published: 27 November 2018
(This article belongs to the Special Issue Livestock Production and Industrial Ecology)

Abstract

:
Grasslands are a crucial resource that supports animal grazing and provides other ecosystem services. We estimated the main properties of Portuguese sown biodiverse permanent pastures rich in legumes (SBP) starting from measured data for soil organic carbon (SOC) and using the Rothamsted Carbon Model. Starting from a dataset of SOC, aboveground production (AGP) and stocking rates (SR) in SBP, we used an inverse approach to estimate root to shoot (RS) ratios, livestock dung (LD), livestock intake (LI) and the ratio between easily decomposable and resistant plant material. Results for the best fit show that AGP and belowground productivity is approximately the same (RS is equal to 0.96). Animals consume 61% of the AGP, which is within the acceptable range of protein and energy intake. Carbon inputs from dung are also within the range found in the literature (1.53 t C/livestock unit). Inputs from litter are equally distributed between decomposable and resistant material. We applied these parameters in RothC for a dataset from different sites that only comprises SOC to calculate AGP and SR. AGP and SR were consistently lower in this case, because these pastures did not receive adequate technical support. These results highlight the mechanisms for carbon sequestration in SBP.

1. Introduction

Livestock provide an important share of human nutrition, contributing to feeding the world population [1]. Grasslands are a critical resource for animal grazing. Grasslands also provide other ecosystem services, such as carbon sequestration (through soil organic carbon—SOC—accumulation), and support for fauna and flora biodiversity [2,3,4]. Carbon sequestration provides climate regulation and mitigation services [5]. These are a particularly relevant contribution for the sustainability of livestock production systems, where they are a countereffect to the large greenhouse gas emissions from enteric fermentation, manure management of production of feeds [6,7]. However, the pace and saturation of carbon storage in soils depends on the floristic composition and soil properties of grasslands, and their quality differs significantly considering grass and grazing management practices, climatic and site conditions, as well as presence or absence of tree cover [8,9].
Knowledge of grassland/pastures properties is fundamental to improving our understanding of this production system and managing these ecosystems towards the provision of multiple ecosystem services. SOC is a useful indicator for assessing the sustainability of livestock production [10]. The dynamics of SOC accumulation or loss are a balance between C input from plants and animals and C loss from soil respiration though the mineralization of organic compounds and release of nutrients and C.
Regarding plant C inputs to soil, aboveground productivity is a source of animal feed, and the remaining part that is not consumed by the animals (e.g., litter, leave senescence) is partially incorporated into soils. Belowground productivity is another SOC input, particularly for grassland plants with an annual life cycle [11,12]. Root growth is connected with aboveground productivity using the root to shoot (RS) ratio, defined as belowground biomass divided by aboveground biomass [13]. Pasture composition affects the RS ratio, which can range from 0.5 to 8 depending on location, landscape, region or biome [13,14]. Composition also influences animal intake and, consequently, aboveground inputs. For example, ruminants, namely bovine and caprine cattle, show a partial preference for clover compared to grass [15,16]. There are also animal C inputs to soil, such as animal excreta (dung and urine), during grazing. Thus, all SOC input parameters, as well as soil respiration, are influenced by pasture composition and site conditions, such as temperature, precipitation and moisture. For example, nitrogen (N) fixation is negatively influenced by moderately low temperatures [17]. SOC inputs also vary for animal types and breeds with different feed requirements and excreta characteristics. Cattle feed intake is higher for cows than for sheep, and their excreta also have a higher N content [16]. The region of settlement and the pasture type are critical determinants of SOC dynamics.
During 1960s in Portugal, sown permanent pastures rich in legumes, and later in the 1980s, sown biodiverse pastures rich in legumes (SBP) were developed with the main goal of increasing grassland productivity (typically low in Mediterranean conditions [18,19,20]), while at the same time increasing sustainable stocking rates. These pastures are a mixture of up to 20 species or variants of legumes and grasses that provide quality animal feed [21,22,23,24]. SOC increase is the main co-effect of increased productivity. Between 2008 and 2014, these pastures were additionally supported by the Portuguese Government through the Portuguese Carbon Fund (PCF), to assist the country in keeping with Portuguese goals for the Kyoto Protocol under the Agriculture, Forestry and Other Land Uses activities of Article 3.4. The PCF supported the installation and maintenance of SBP using a system of service payments for carbon sequestration [25]). As a consequence, 1095 farmers installed SBP in an area of more than 4% of the country’s agricultural land [23]. The majority of the area of SBP (over 90%) was installed in the agricultural region of Alentejo, in areas of high interest for nature conservation [4].
So far, the potential of this system to store SOC has been quantified using a simple statistical model [22] that was calibrated for the specific conditions of the farms where data was collected. The lack of any biogeochemical process base disregards the above-mentioned site conditions (e.g., soil density, temperature, precipitation and management practices).
The first step to improving our understanding of SOC dynamics in this pasture system is to characterize how C flows into and out from the system. The necessary parameters, such as the RS, animal intake, litter fraction and animal excreta, have never been measured systematically or in multiple farms. Models play a relevant role in overcoming the limitations of measured data and estimating these parameters using available related field data (e.g., aboveground productivity and soil organic matter (SOM) content) without forcing a restart of field experiments [8,26] in the case of incomplete surveying of all relevant properties, as is the case here.
Soil process-based models are useful tools for understanding the soil carbon cycle. They translate soil conditions, climatic variations, agricultural management practices which influence biogeochemical processes using mathematical-ecological formulations [27]. SOC process models are capable of simulating SOC turnover, according to specific site conditions and relate it to specific management practices [28]. The Rothamsted Carbon Model (RothC) [29] is one of the most used and validated SOC models, requiring few, easily obtainable, input parameters and having a simpler structure than other models [30]. It has been applied to estimate SOC stocks in many regions of the World and in many different land use systems, including cropland, pasture and forest land (e.g., [31,32,33]). It was applied to estimate litter fraction—i.e., plant soil input—in Japanese forests and grasslands [34] and the RS ratio in multiple grassland systems at thirteen sites in Europe and United States of America [26].
The aims of the present study are: (1) to use available SOM data in order to estimate the main parameters (RS ratio, animal intake and animal dung input) for Portuguese SBP systems, through an optimization approach using the process-based RothC model; and (2) to apply the set of parameters and the calibrated model to a case study in order to validate estimates of aboveground productivity (AGP) and stocking rate (SR) in multiple farms and production years.

2. Materials and Methods

In this work, we used the RothC model to estimate SOC dynamics in Portuguese SBP. RothC was developed to model the carbon turnover in arable soils in the United Kingdom, but it has been expanded and successfully applied to model soil carbon dynamics also in grassland [35]. It takes into account the effects of temperature, moisture content and soil type. The model uses a monthly temporal step and is divided into five compartments: easily decomposable plant material (DPM), resistant plant material (RPM), microbial biomass, humified organic matter and inert organic matter. The inert pool is resistant to decomposition and does not change over time [36]. To initialize the model, the model distributes initial SOC through the five compartments according to Weihermüller et al. [37], which depends on SOC and clay fraction. The full list of parameters required is: initial SOC content (t C/ha) and clay content of the soil (%), soil cover period, monthly input of plant residues (t C/ha), monthly farmyard manure carbon inputs (t C/ha) and monthly irrigation (mm), average monthly mean air temperature (°C), monthly rainfall (mm) and monthly open pan evaporation (mm). RothC uses only one parameter that depends strictly on the land use type, i.e., ratio between DPM and RPM (DPM/RPM ratio). This parameter is key in determining soil respiration, which is calculated differently for each SOC pool. It can vary between 0.25 (to forest land uses) and 1.44 (to annual croplands) [29]. For pastures, there is a wide range of variation depending on vegetation and management. Grassland DPM/RPM ratio can range between 0.67 for unimproved grassland and scrub and 1.44 for improved grassland [29].
We built an optimization problem (Section 2.1) to: (a) obtain the RS ratio, animal dung per livestock unit (LU) and animal intake (LI); and (b) use the parameters obtained previously to estimate AGP and SR in the cases where only SOM data were measured (Section 2.2).

2.1. Estimation of Plant and Livestock Parameters for the Pasture Systems

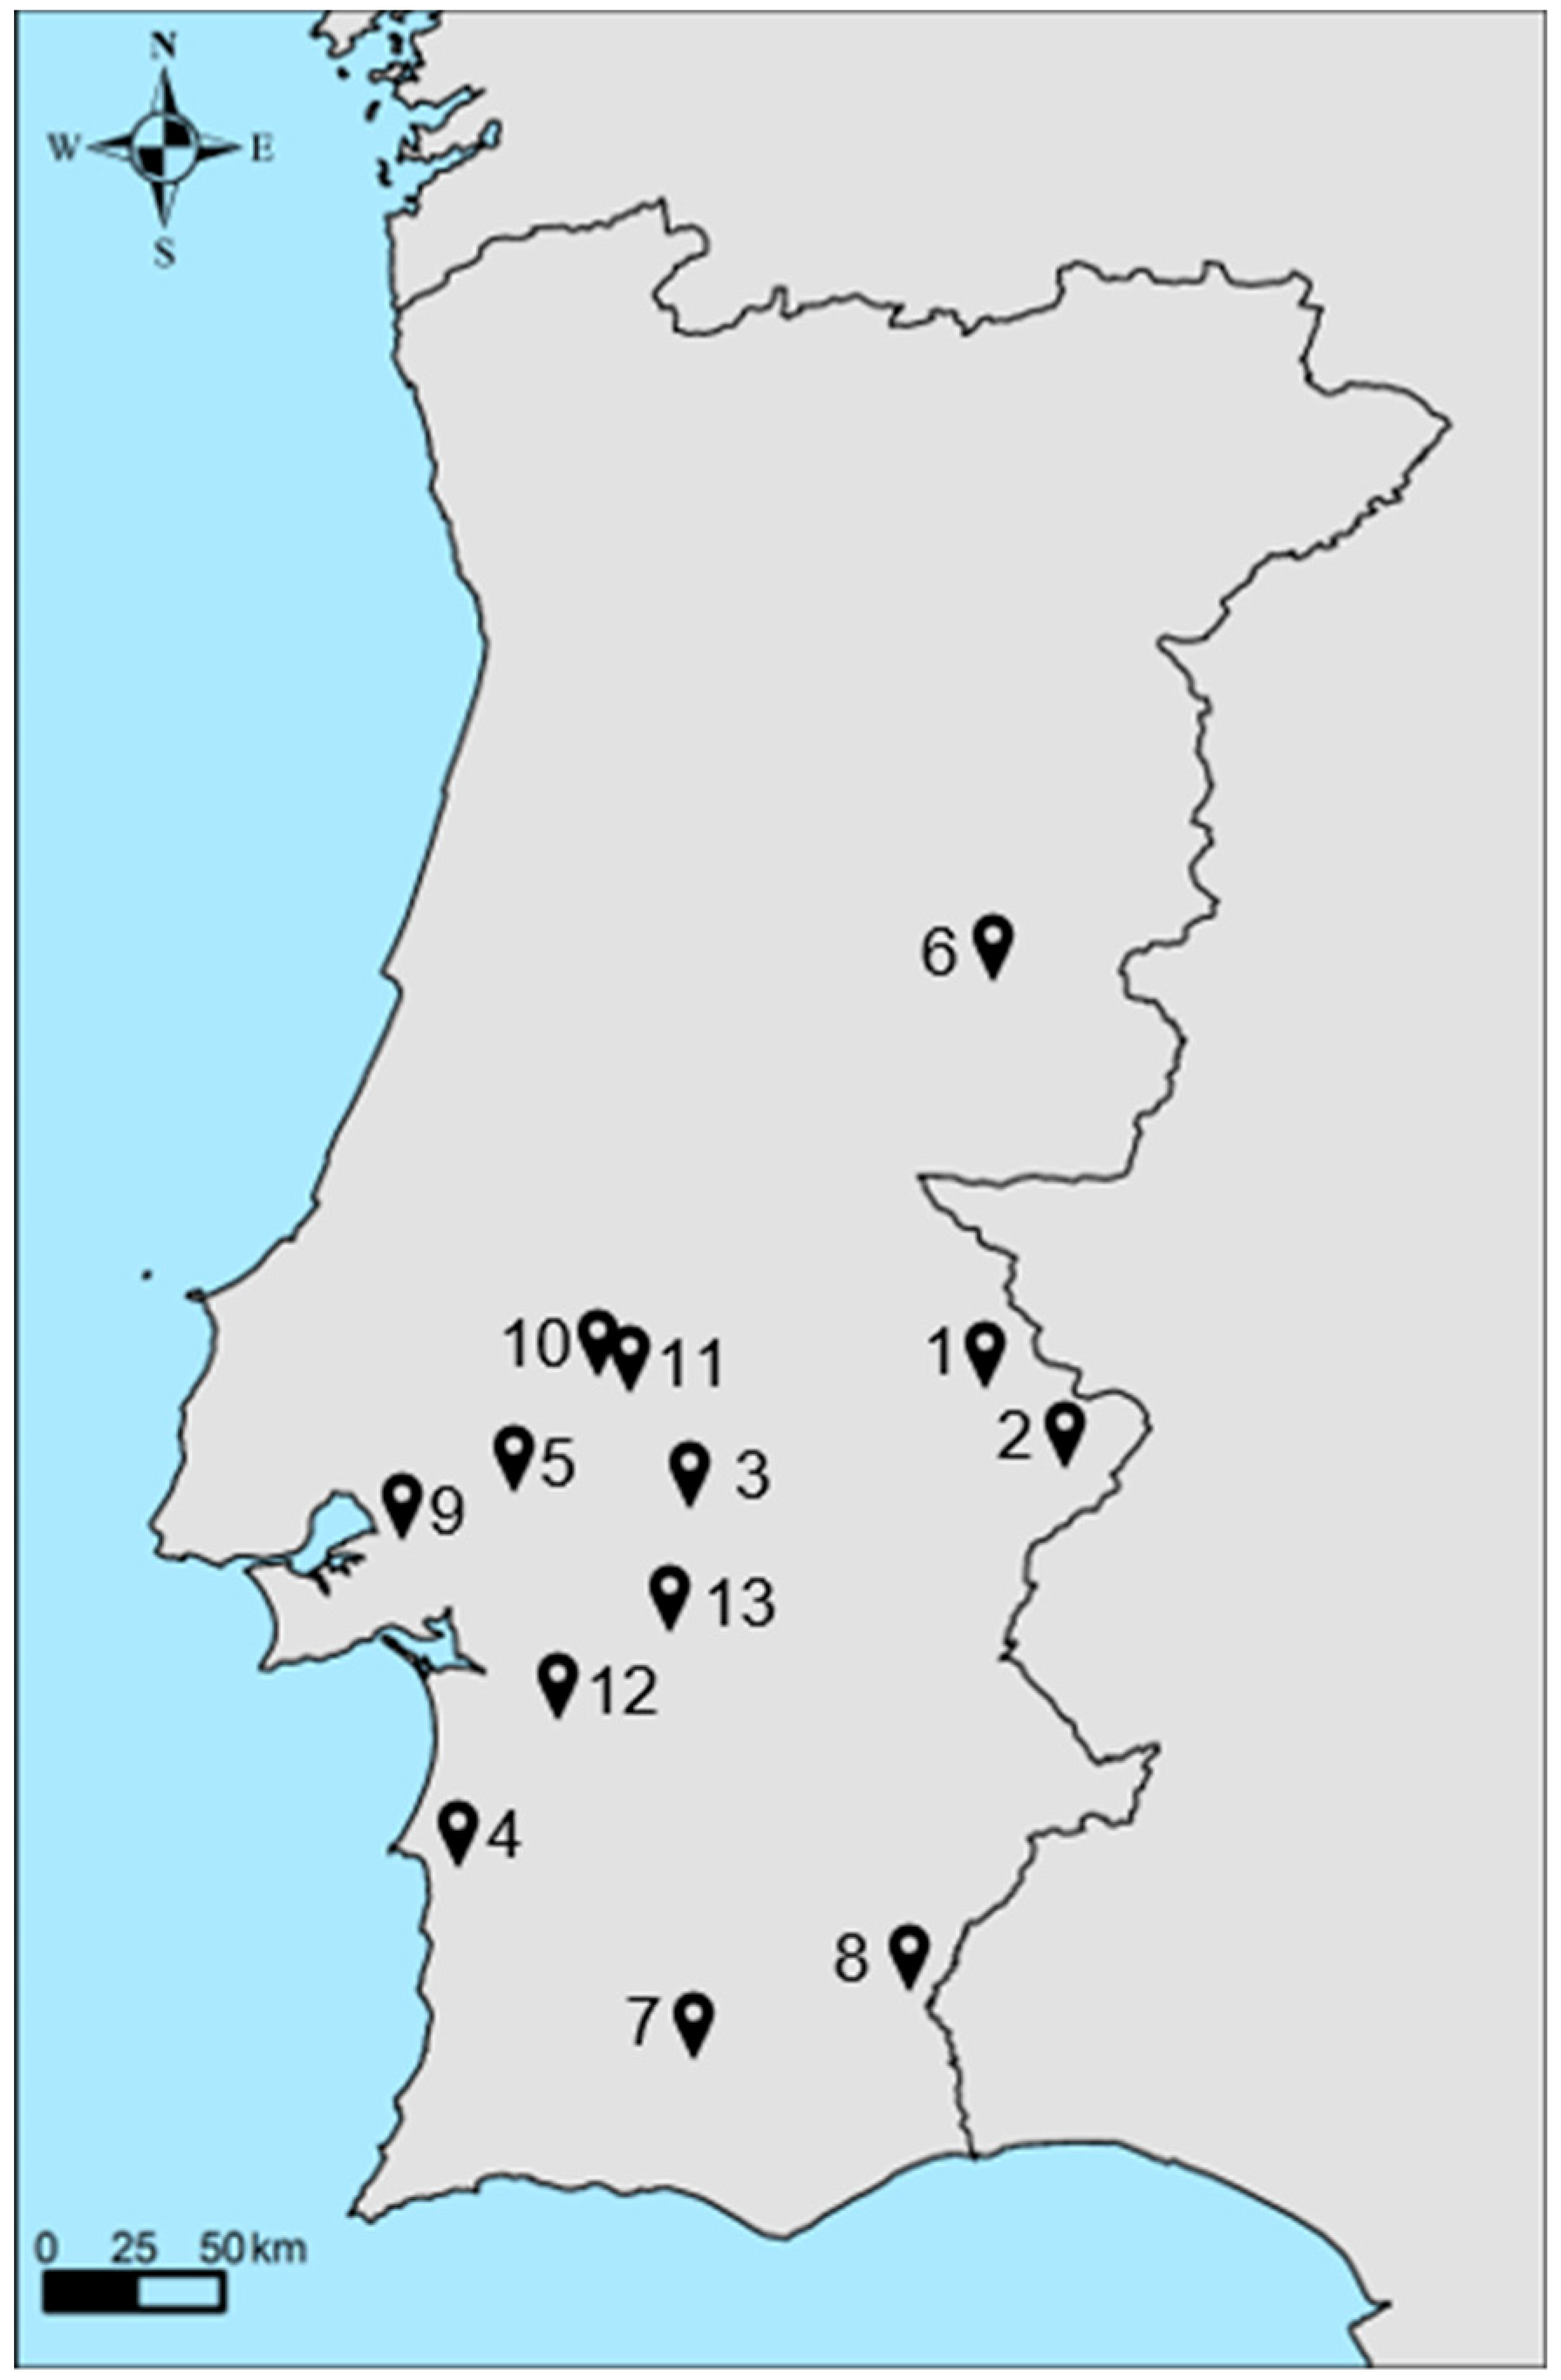
2.1.1. Data Characterization

To calibrate the model, we used data from the AGRO 87 [38] and AGRO 71 [22] projects. All data used in this paper is available in Supporting Information File S1.
The AGRO 87 project was the longest to date dedicated to the SBP production system (4 production years—from autumn 2001 to autumn 2005), covered the most SBP farms (six in total located in two Portuguese NUTS II regions—Alentejo and Beira Interior), and measured the most relevant data. Data collected in this project included SOM content (%), SR (LU/ha) and AGP (t dry matter (DM)/ha), as indicated in Table 1. The six farms surveyed were farm 1 (near Vaiamonte); farm 2 (near Elvas), farm 3 (near Pavia); farm 4 (near Santiago do Cacém), farm 5 (near Coruche) and farm 6 (near Covilhã). AGRO 71 also covered SBP, but only in two farms and three production years (from autumn 2001 to autumn 2004). In this project, only SOM concentration was measured. The two farms are farm 7 (near Castro Verde) and farm 8 (near Mértola). All farms are in central and southern Portugal in the hot-summer Mediterranean climate region, according to the Köppen climate classification system [39,40]. Higher temperature and lower precipitation were found in farm 1 (the southernmost farm), and lower temperature and higher precipitation were observed in farm 4 (the northernmost farm). The location of the farms and the variables measured are presented in Section 2.2.
SOM was determined through soil sampling analysis, at 10 cm depth. For each parcel of the project, one composite sample was obtained (mix of a variable number of sub-samples collected throughout each parcel). Samples were dried overnight at 35–37 °C and crumbled mechanically and passed through a 2 mm stainless steel sieve before being measure the organic matter content [22,38]. AGP was measured three or four times per season. Quadrants of 1m × 1m were used in each parcel. All plants inside were harvested, oven-dried at 65 °C for 48 h, and then weighted [41]. The number of animals (cows and/or sheep) per day in each of the parcels was registered by the farmers, and then averaged in a year (the days without grazing were also registered) [22,38]. AGP and SR on average for all farms and years, are approximately 7 t DM/ha and 1 LU/ha, respectively. Organic matter increments were, in the period between the autumn of 2001 (used as starting point) and the autumn of 2005, approximately 0.2% per year.

2.1.2. Model Inputs Calculation

SOM content was converted to SOC content by multiplying it by the average carbon fraction in organic matter (0.58 [42]), soil density (g/m3) and soil depth (0.1 m). Soil density, as well as clay content (needed for RothC calibration, as described later), were obtained from the LUCAS-topsoil database [43]. LUCAS is a European-wide project where topsoil field measurements were taken from approximately 20,000 sites in European Union countries.
Additional parameters needed for RothC calibration are the soil cover period, monthly input of plant residues (t C/ha), monthly farmyard manure carbon inputs (t C/ha) and monthly irrigation (mm). Farmyard manure was not applied, and all parcels were rainfed pastures. Soil cover period is a binary monthly variable, where 1 means that the soil was covered with vegetation during that month and 0 means that the soil was uncovered. The soil is covered between September and June and it is uncovered in July and August, as it is good agronomic practice to fully graze the pasture before Summer to facilitate sward reestablishment through self-reseeding in the fall. Carbon inputs from plant residue (Iplant) and animal dung (Ianimal) were calculated according to
Iplant (t C/ha) = [(1 − LI) + RS] × AGP × CF and
Ianimal (t C/ha) = LD × SR,
where RS is the root to shoot ratio, LD is the livestock dung excreted (t C/LU), LI is proportional livestock intake (kg DM eaten/kg DM pasture yield), AGP is the aboveground productivity (kg DM/ha), SR is the stocking rate (LU/ha), and CF is the carbon fraction of the legumes and grasses (0.4 t C/t DM) obtained from the Intergovernmental Panel on Climate Change (IPCC) [14].
Monthly air temperature and precipitation were respectively obtained from the “Global Precipitation Climatology Project (GPCP)” [44] and the Land Processes Distributed Active Archive Center (LP DAAC) project [45]. Monthly open pan evaporation was calculated as 75% of the potential evaporation, an assumption used by previous studies using RothC [46,47]. Potential evaporation was calculated using the Thornthwaite equation [48], which is a function of monthly average temperature and annual average temperature, number of days and average day length per month.

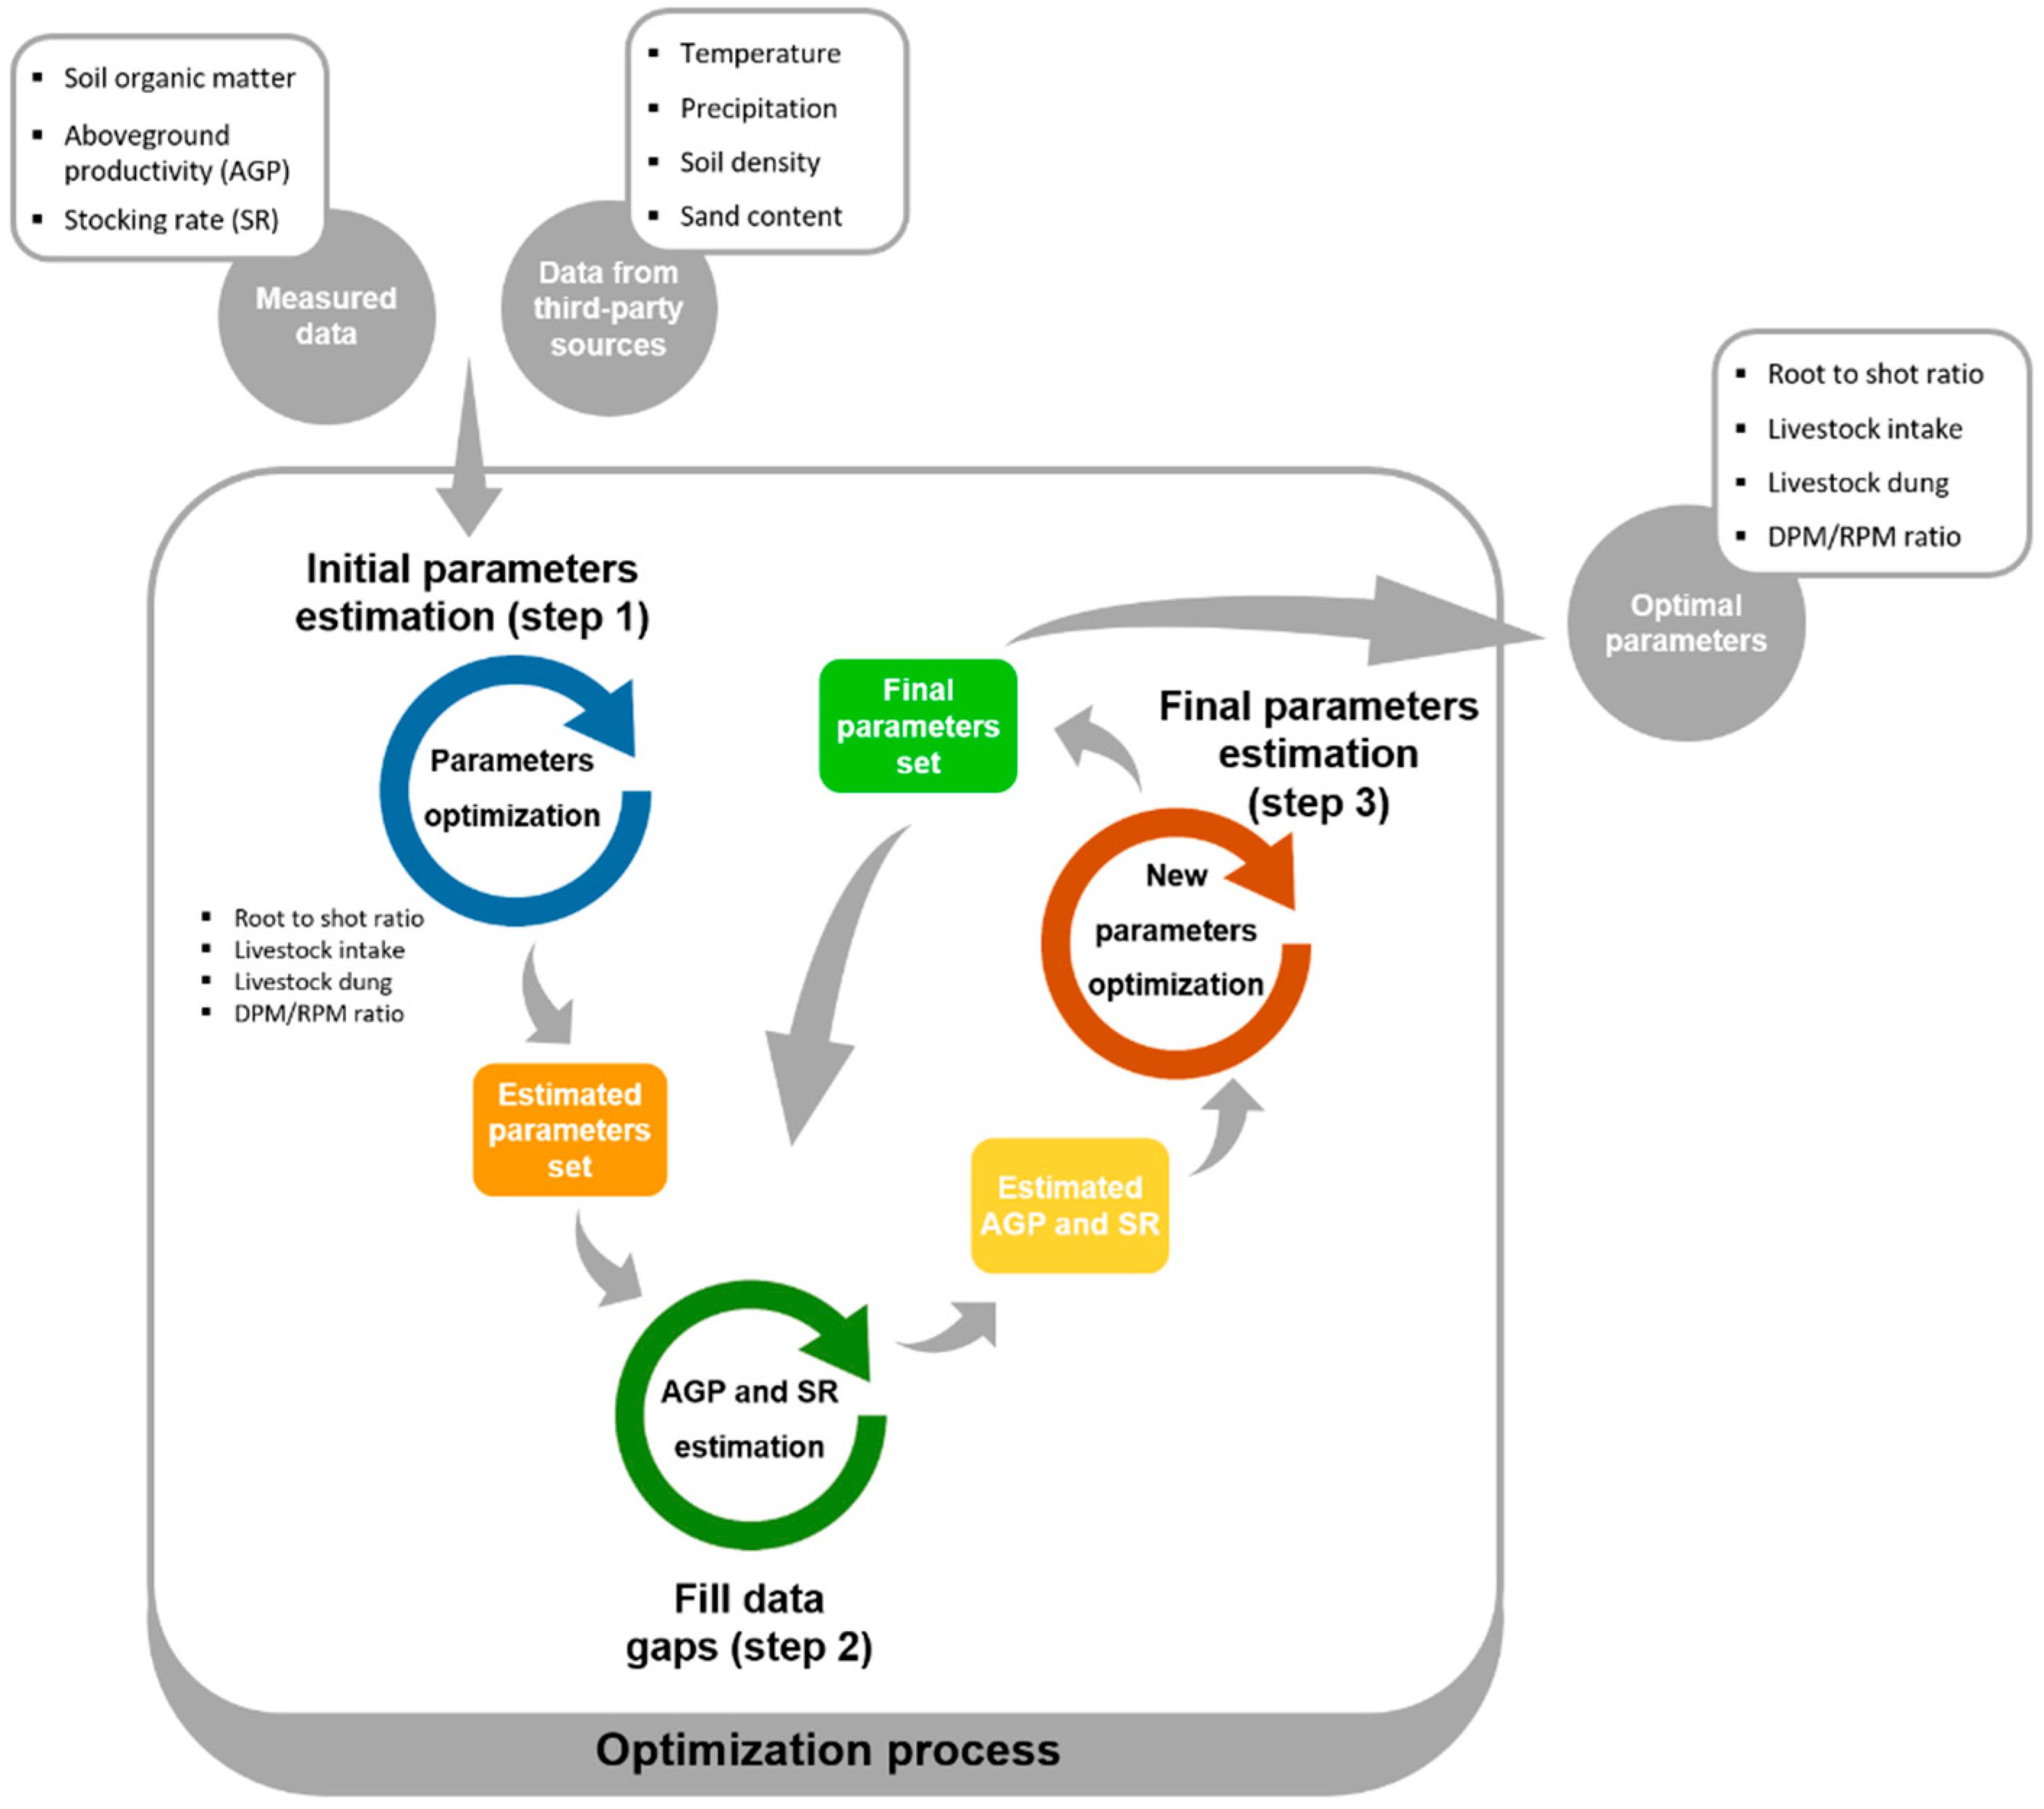
2.1.3. Optimization Procedure

Using the measured and third-party data described thus far, we implemented an optimization procedure to estimate the remaining parameters needed for RothC that were not measured and that cannot be estimated indirectly from any additional data sources. Those parameters are: RS ratio (belowground productivity (BGP)/AGP); LD (t C/LU); LI (livestock intake—kg DM/kg DM); and DPM/RPM. The estimated parameters are the same for all farms and production years. The determination of these parameters was the ultimate goal of the optimization procedure.
Figure 1 depicts the three-step optimization procedure, which includes a data imputation procedure to fill in data gaps:
(1)
Estimate parameters using only data points without missing data, i.e., estimate RS, LI, LD and DPM/RPM for the AGRO 87 and 71 farms and years without data gaps, i.e., where AGP, SR and SOM were all measured.
(2)
Use the SOM data and parameters obtained to estimate the required AGP and SR for the SOM increments in the remaining farms and years where AGP and SR from AGRO 87 and 71 data were missing.
(3)
Estimate RS, LI, LD and DPM/RPM ratio using the complete data set (i.e., using field-measured AGP and SR used in the first step and AGP and SR estimated in the second step). With the new set of parameters, we estimated AGP and SR again.
Steps 2 and 3 are repeated until the values for all the parameters stabilize.
The procedure (steps 1 to 3) was repeated in 100 iterative runs with different random initial conditions. Each run ended when the stop condition of the loss function was achieved. The set of parameters in the last iteration before the end of the run was recorded. The problem was formulated as
minimize i = 1 N ( SOC measured , i SOC estimated , i SOC measured , i ) 2 + i = 1 N | SOC measured , i SOC estimated , i SOC measured , i | , subject   to : 0.5 RS   ( ) 8.0 0 LI ( ) 1 0.5 LD   ( t   C / ha ) 2.5 0.60 DPM / RPM ( ) 1.44 ,
where N is the total number of data points, i.e., the number of production years and farms. The algorithm minimizes the difference between field measured SOC stock (SOCmeasured) and estimated SOC stock (SOCestimated), in relative terms (divided by the field SOC stock), subject to constraints on acceptable values of the parameters gathered through literature revision. In each run, initialization parameters could range freely in the space defined by the problem constraints. RS ranged between 0.5 and 8 [13,14], LI between 0 and 1 kg DM/kg DM, indicating no grazing to total AGP grazing by animals. LD varied between 0.8 t C/ha.LU and 2.5 t C/haLU, depending on the animal size and C/N ratio of the dung [14], and the DPM/RPM ratio for grasslands ranged between 0.6 and 1.44.
Equation (3) is a nonlinear programming (NLP) problem. The objective function is a nonlinear function, and it is subject to linear equality and linear inequality constraints. Thus, the feasible region is a convex polytope. We used Matlab vR2017a to perform the optimization process, using the “fmincon” function. This function searches the feasible space for the minimum function value using an interior-point optimization algorithm (default), which solves NLP problems. It has been used in large, sparse problems, as well as small dense problems. The algorithm satisfies the boundary conditions for all iterations and can recover from non-admissible results or infinite results. We increased by 7 times the maximum function evaluations to 20,000 (default value is 3000), which allowed us to increase the search space. The stop condition was 10−6, which gave a very small search step, since the absolute value of the loss function ranges between 0.5 and 1. For validation of these choices, we ran the optimization procedure five times to ensure that the final optimum parameter set was always the same, i.e., better coverage of the variable space, indicating that the minimum of the loss function is global rather than local.
After arriving at the optimum set of parameters, we analyzed the relationship between the randomly selected initial parameter set and the final set of parameters after optimization. The goal was to ensure that the model was adjusting all parameters rather than fixate one or more parameters around the initial selection. We also performed a correlation analysis between the parameters of both systems, using Spearman’s ρ [49] method. Spearman’s ρ is a nonparametric measure of monotonic statistical dependence between two variables. This method does not make any assumptions about the distribution of the variables. We used IBM SPSS 25 to perform correlation analysis.

2.2. Estimation of Aboveground Productivity and Stocking Rate for an Additional SOM Data Set

After estimating RS, LD, LI and DPM/RPM of SBP, we applied them in the distinct case of the EDP project [25]. This project was sponsored by Energias de Portugal, EDP (the main Portuguese electrical utility) with the aim of demonstrating how land use activities could help Portugal comply with its Kyoto Protocol target. SBP installation and management was included in the land uses covered (alongside afforestation, forest management, and no-tillage in croplands). Soil samples were collected during the project, but only SOM was measured. SBP was the only pasture system covered, in seven production years (autumn 2006 to autumn 2012) for six farms, for a total of 77 parcels. The farms were: farm 6 (also present in AGRO 87 project), farm 9 (near Samora Correia), farm 10 (near Coruche), farm 11 (near Coruche); farm 12 (near Grândola) and farm 13 (near Montemor-o-Novo). Farm 6 covered the period between autumn 2006 and autumn 2011, farm 9 between autumn 2007 and autumn 2012, farms 10 and 11 between autumn 2007 and autumn 2011 and farms 12 and 13 between autumn 2008 and autumn 2011. Soil sampling and SOM analysis were similar to the procedure described in Section 2.1. Average organic matter increments were about one quarter of the AGRO’s increments during the period of analysis, about 0.05% per year. The full data collected is available in Supporting Information File S1. All farm locations from AGRO 87, AGRO 71 and EDP are depicted in Figure 2.
Here, AGP and SR were unknown, only SOM was measured (332 soil samples). We used the same optimization problem in Equation (3) to minimize the difference between estimated and measured SOC stock. In this case, the optimization variables were not the pasture-specific parameters, but rather AGP and SR. Estimated AGP and SR, in each farm and production year (i.e., 48 parameters in total—24 AGP and SRs) were iteratively adjusted to minimize the loss function value, using the parameters previously obtained in Section 2.1. We also initialized the optimization process for 100 iterations to find the parameter set which leads to the lower function loss value in each iteration and to try to avoid local minima. We compared results with the AGRO project. We also performed a correlation analysis using Spearman’s ρ method between AGP and SR.
Table 1 summarizes measured data and main climatic variables, i.e., mean annual temperature and annual precipitation, for all farms covered in this paper.

3. Results and Discussion

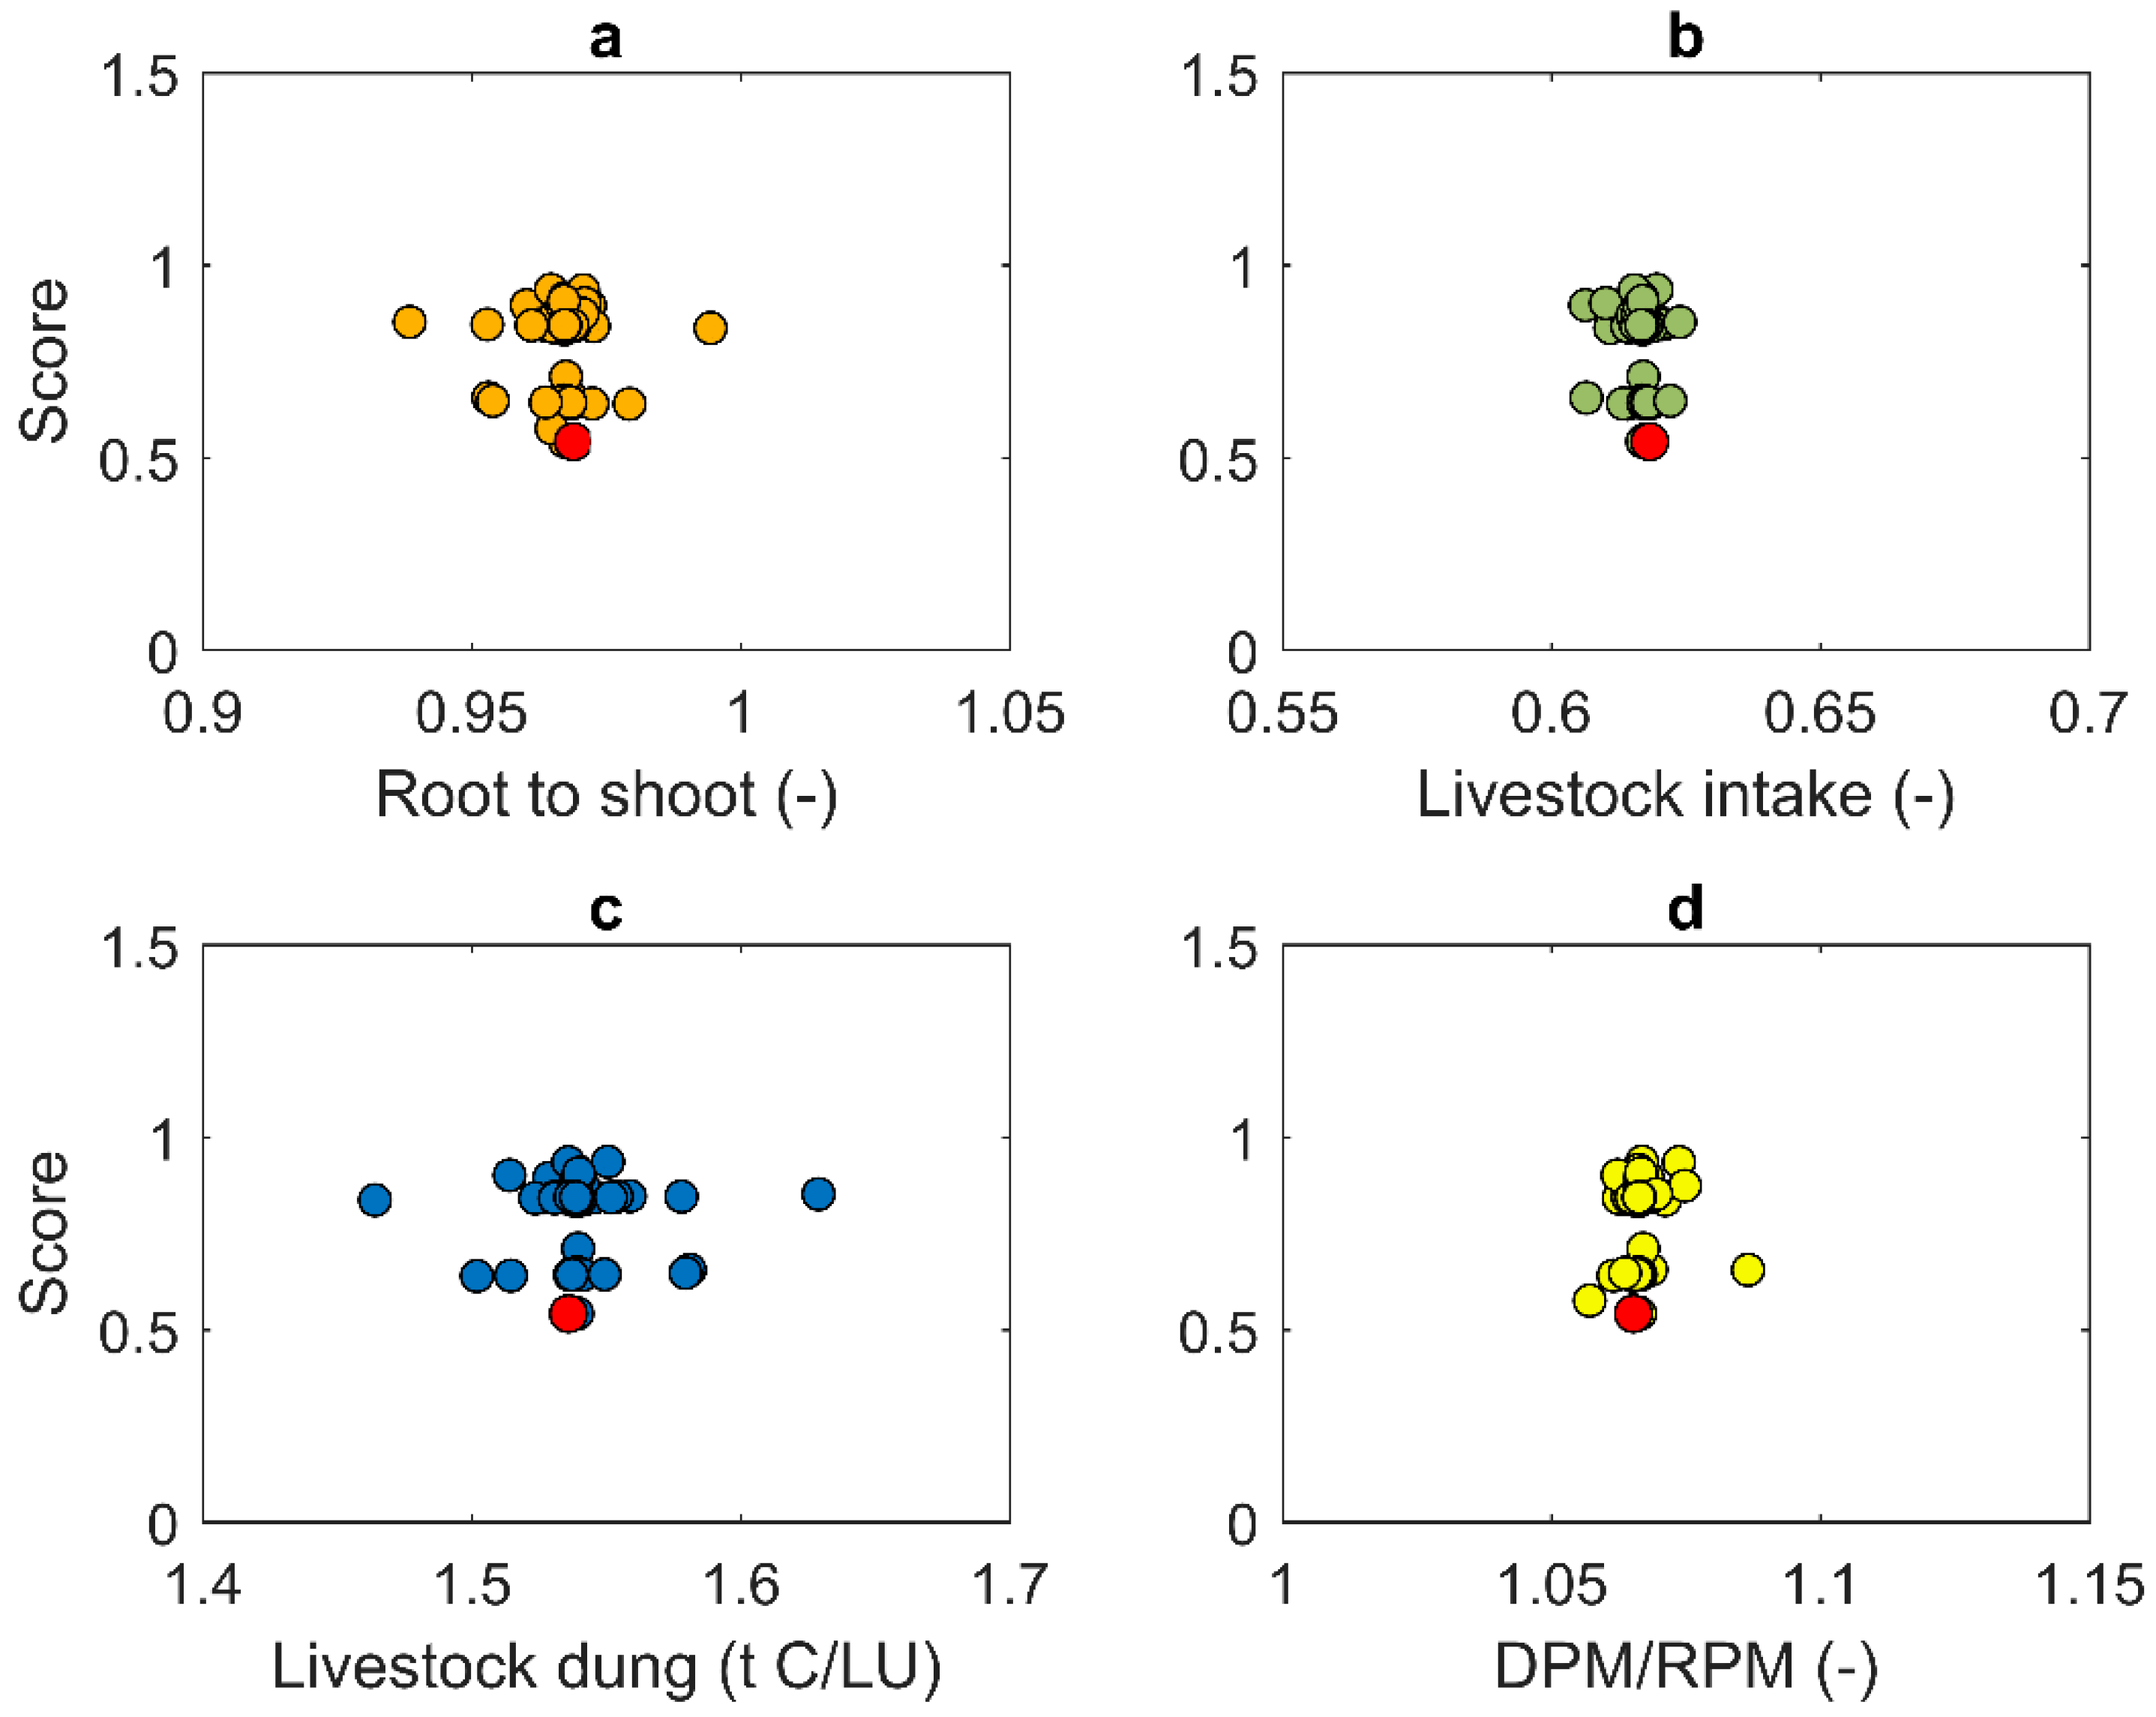
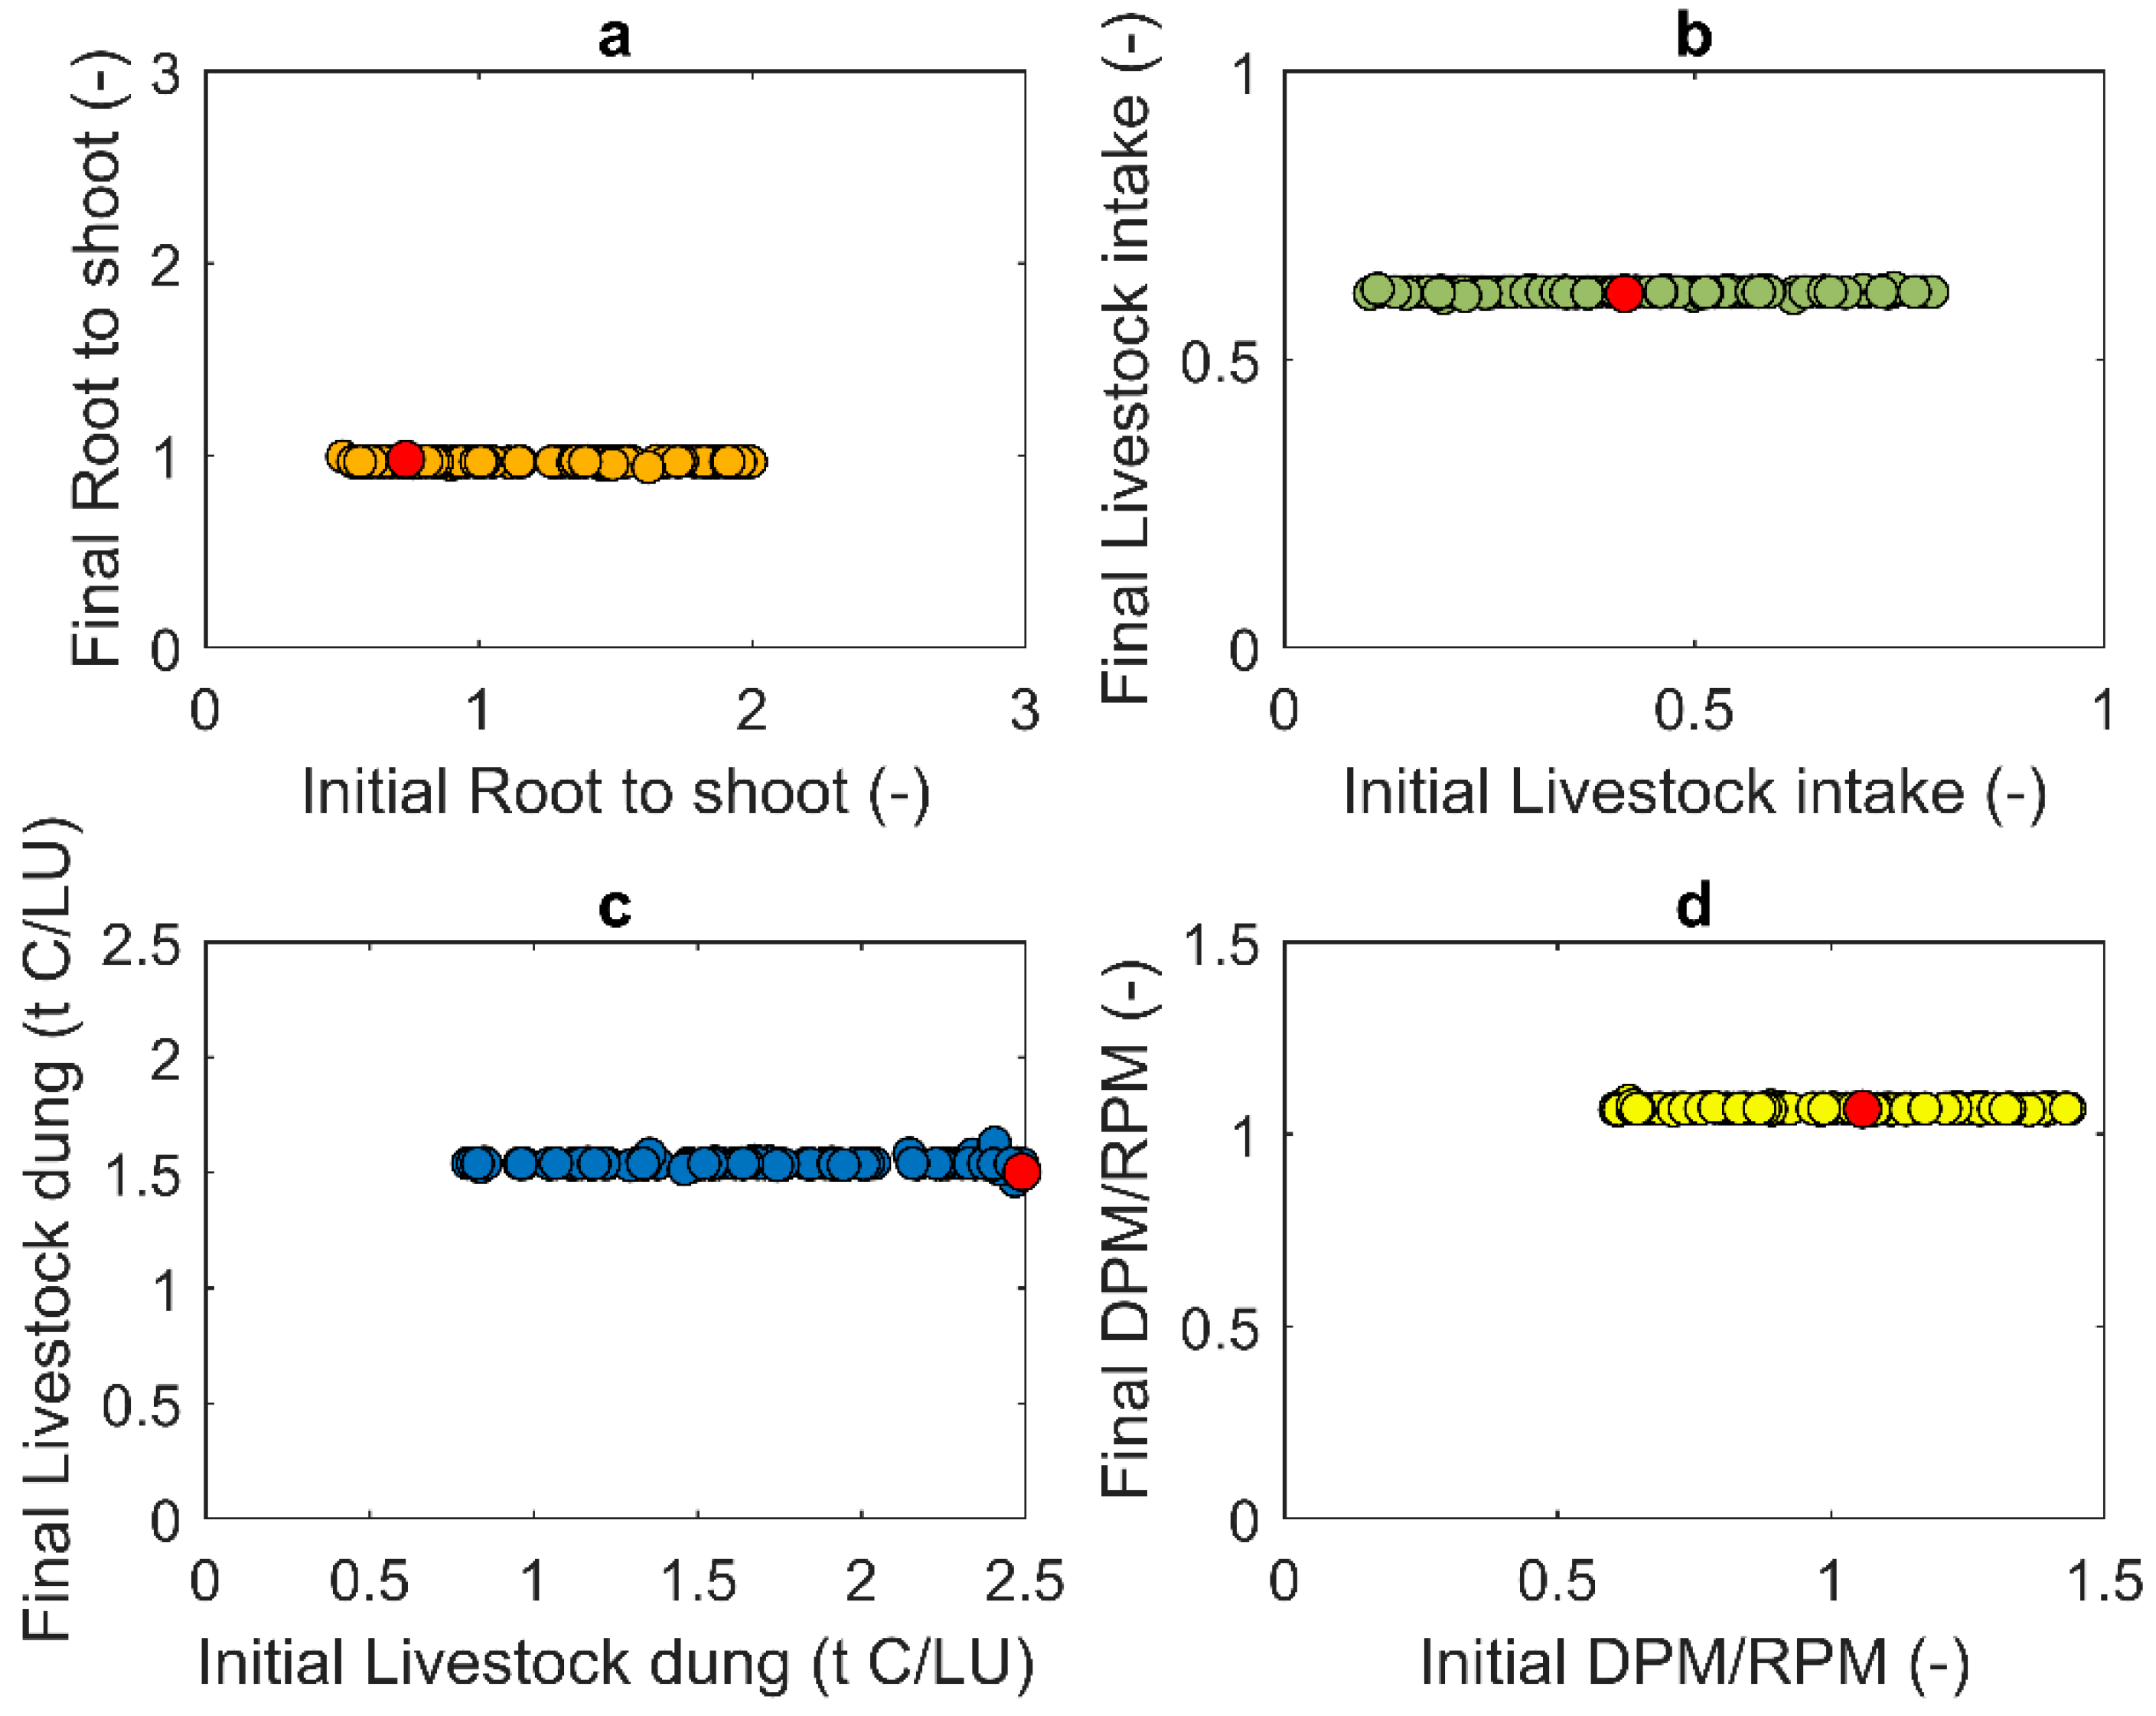
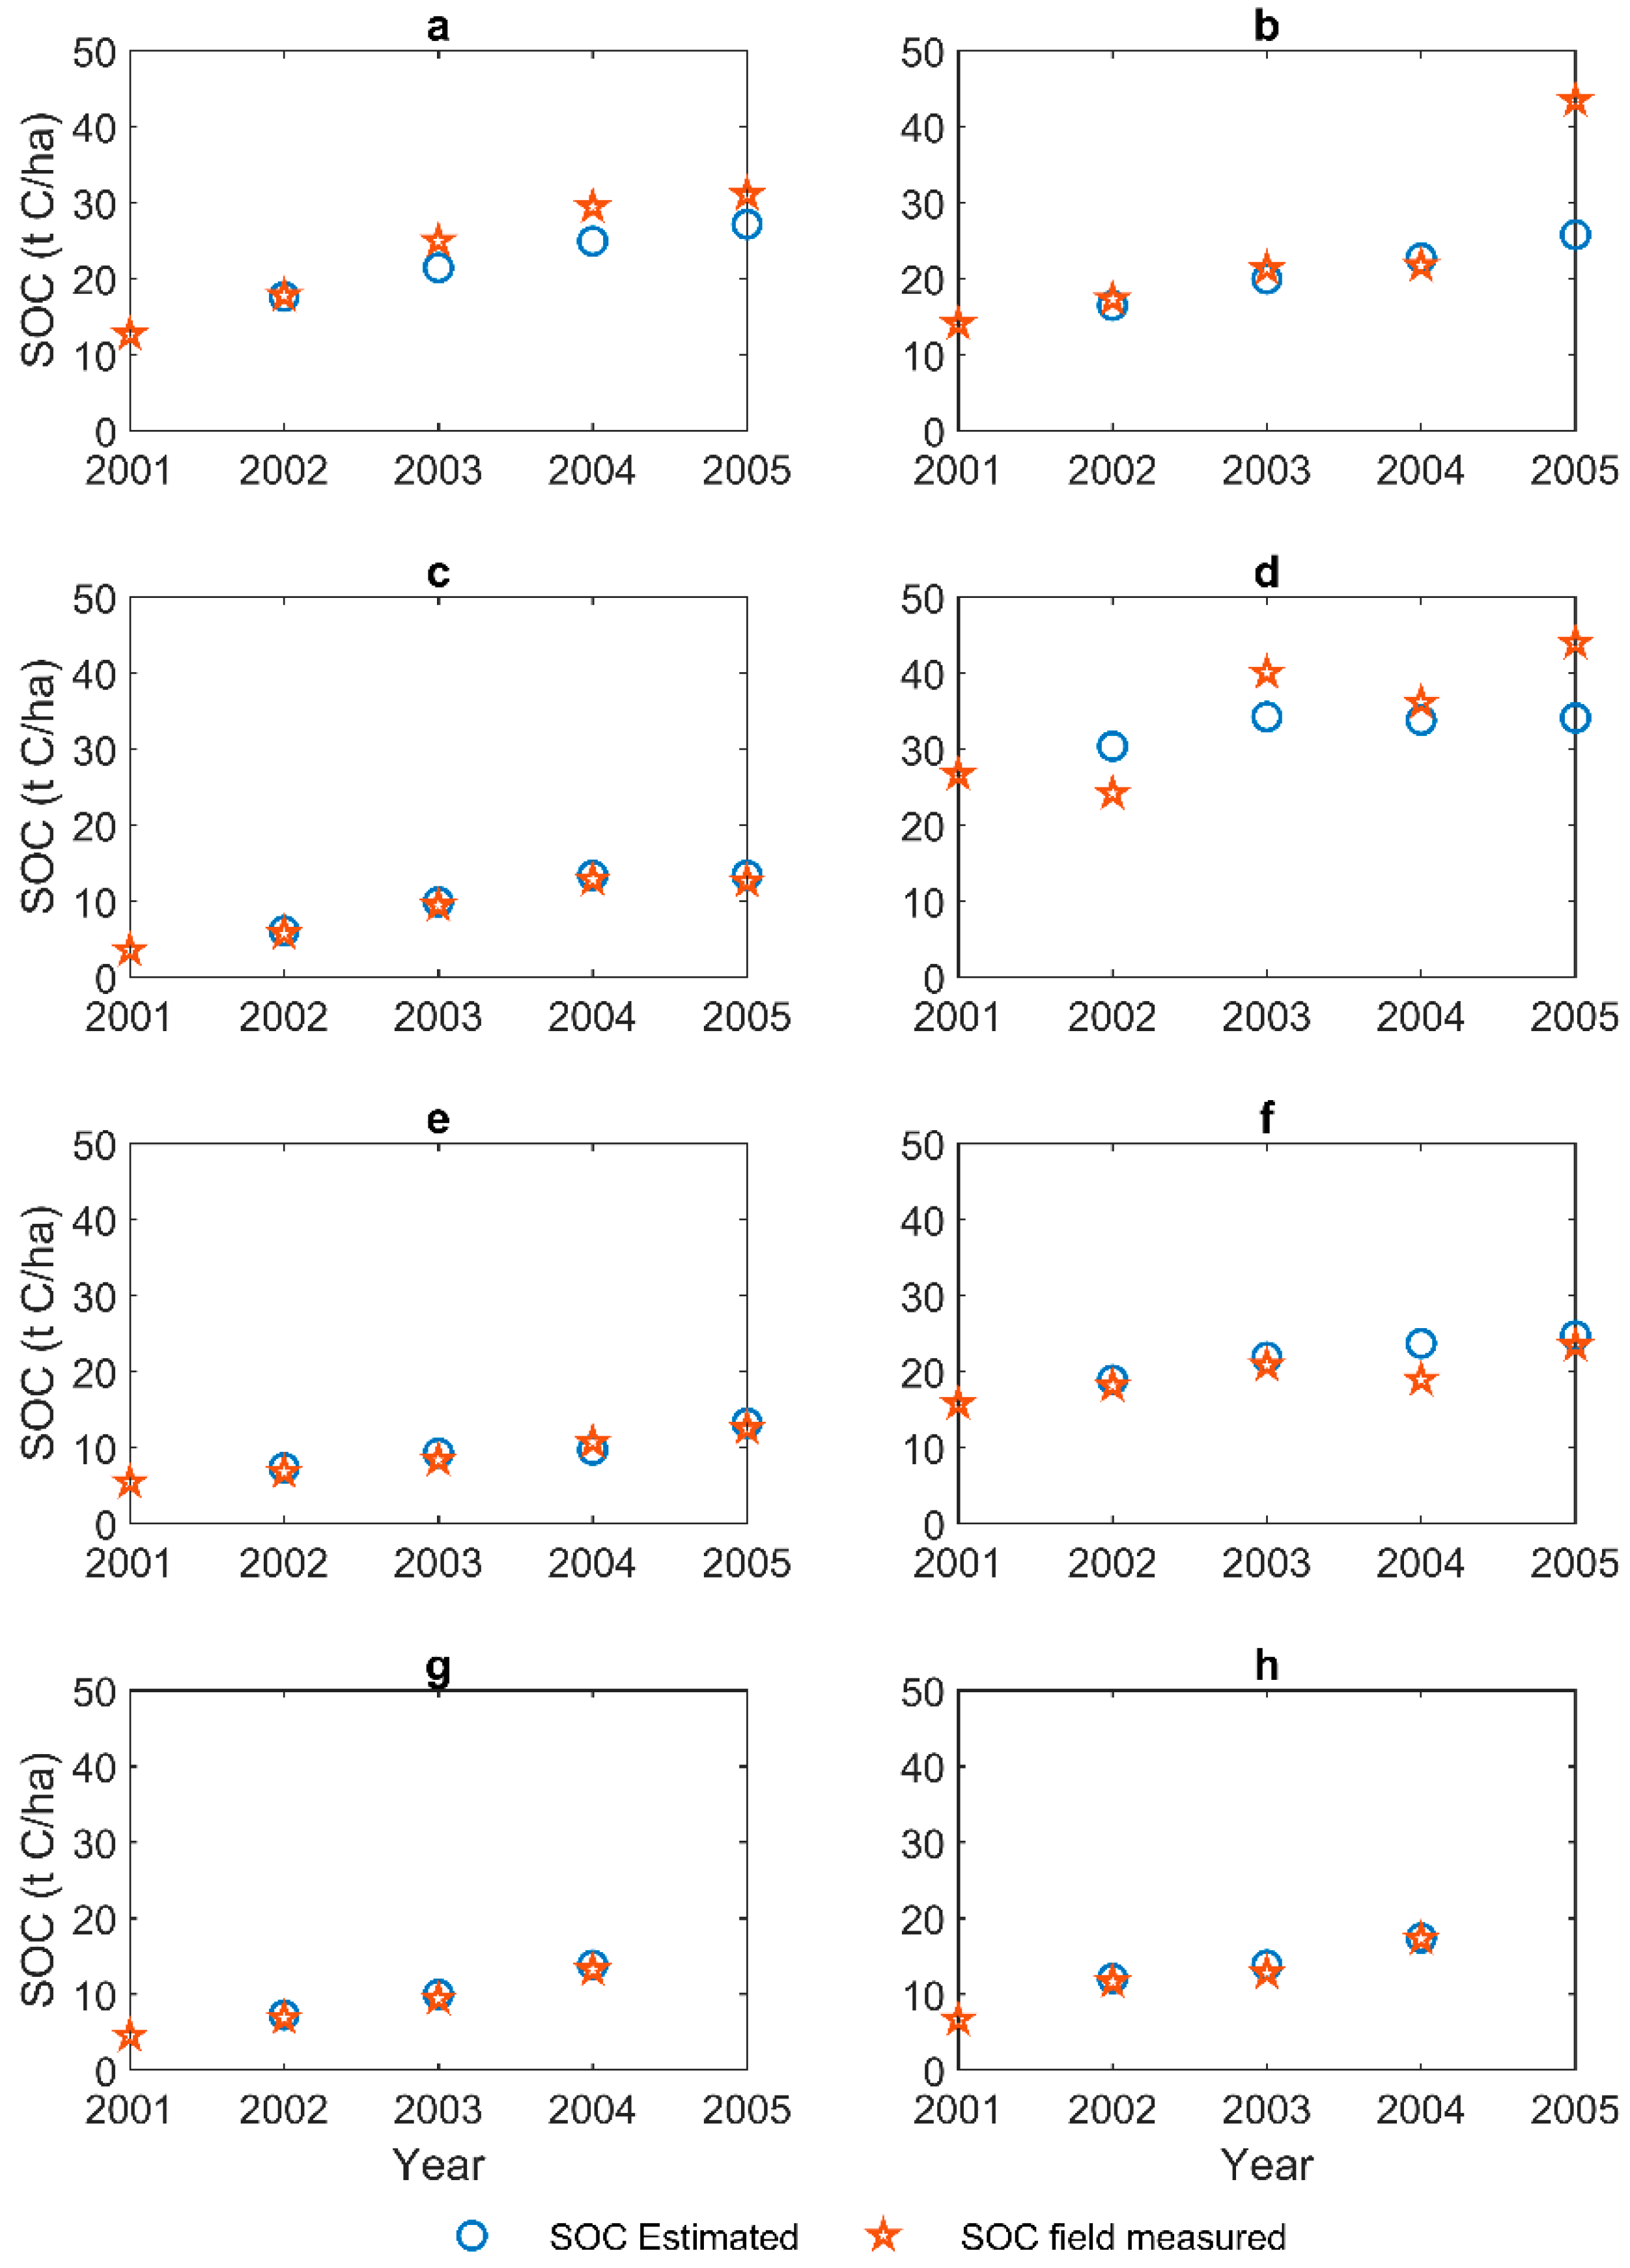
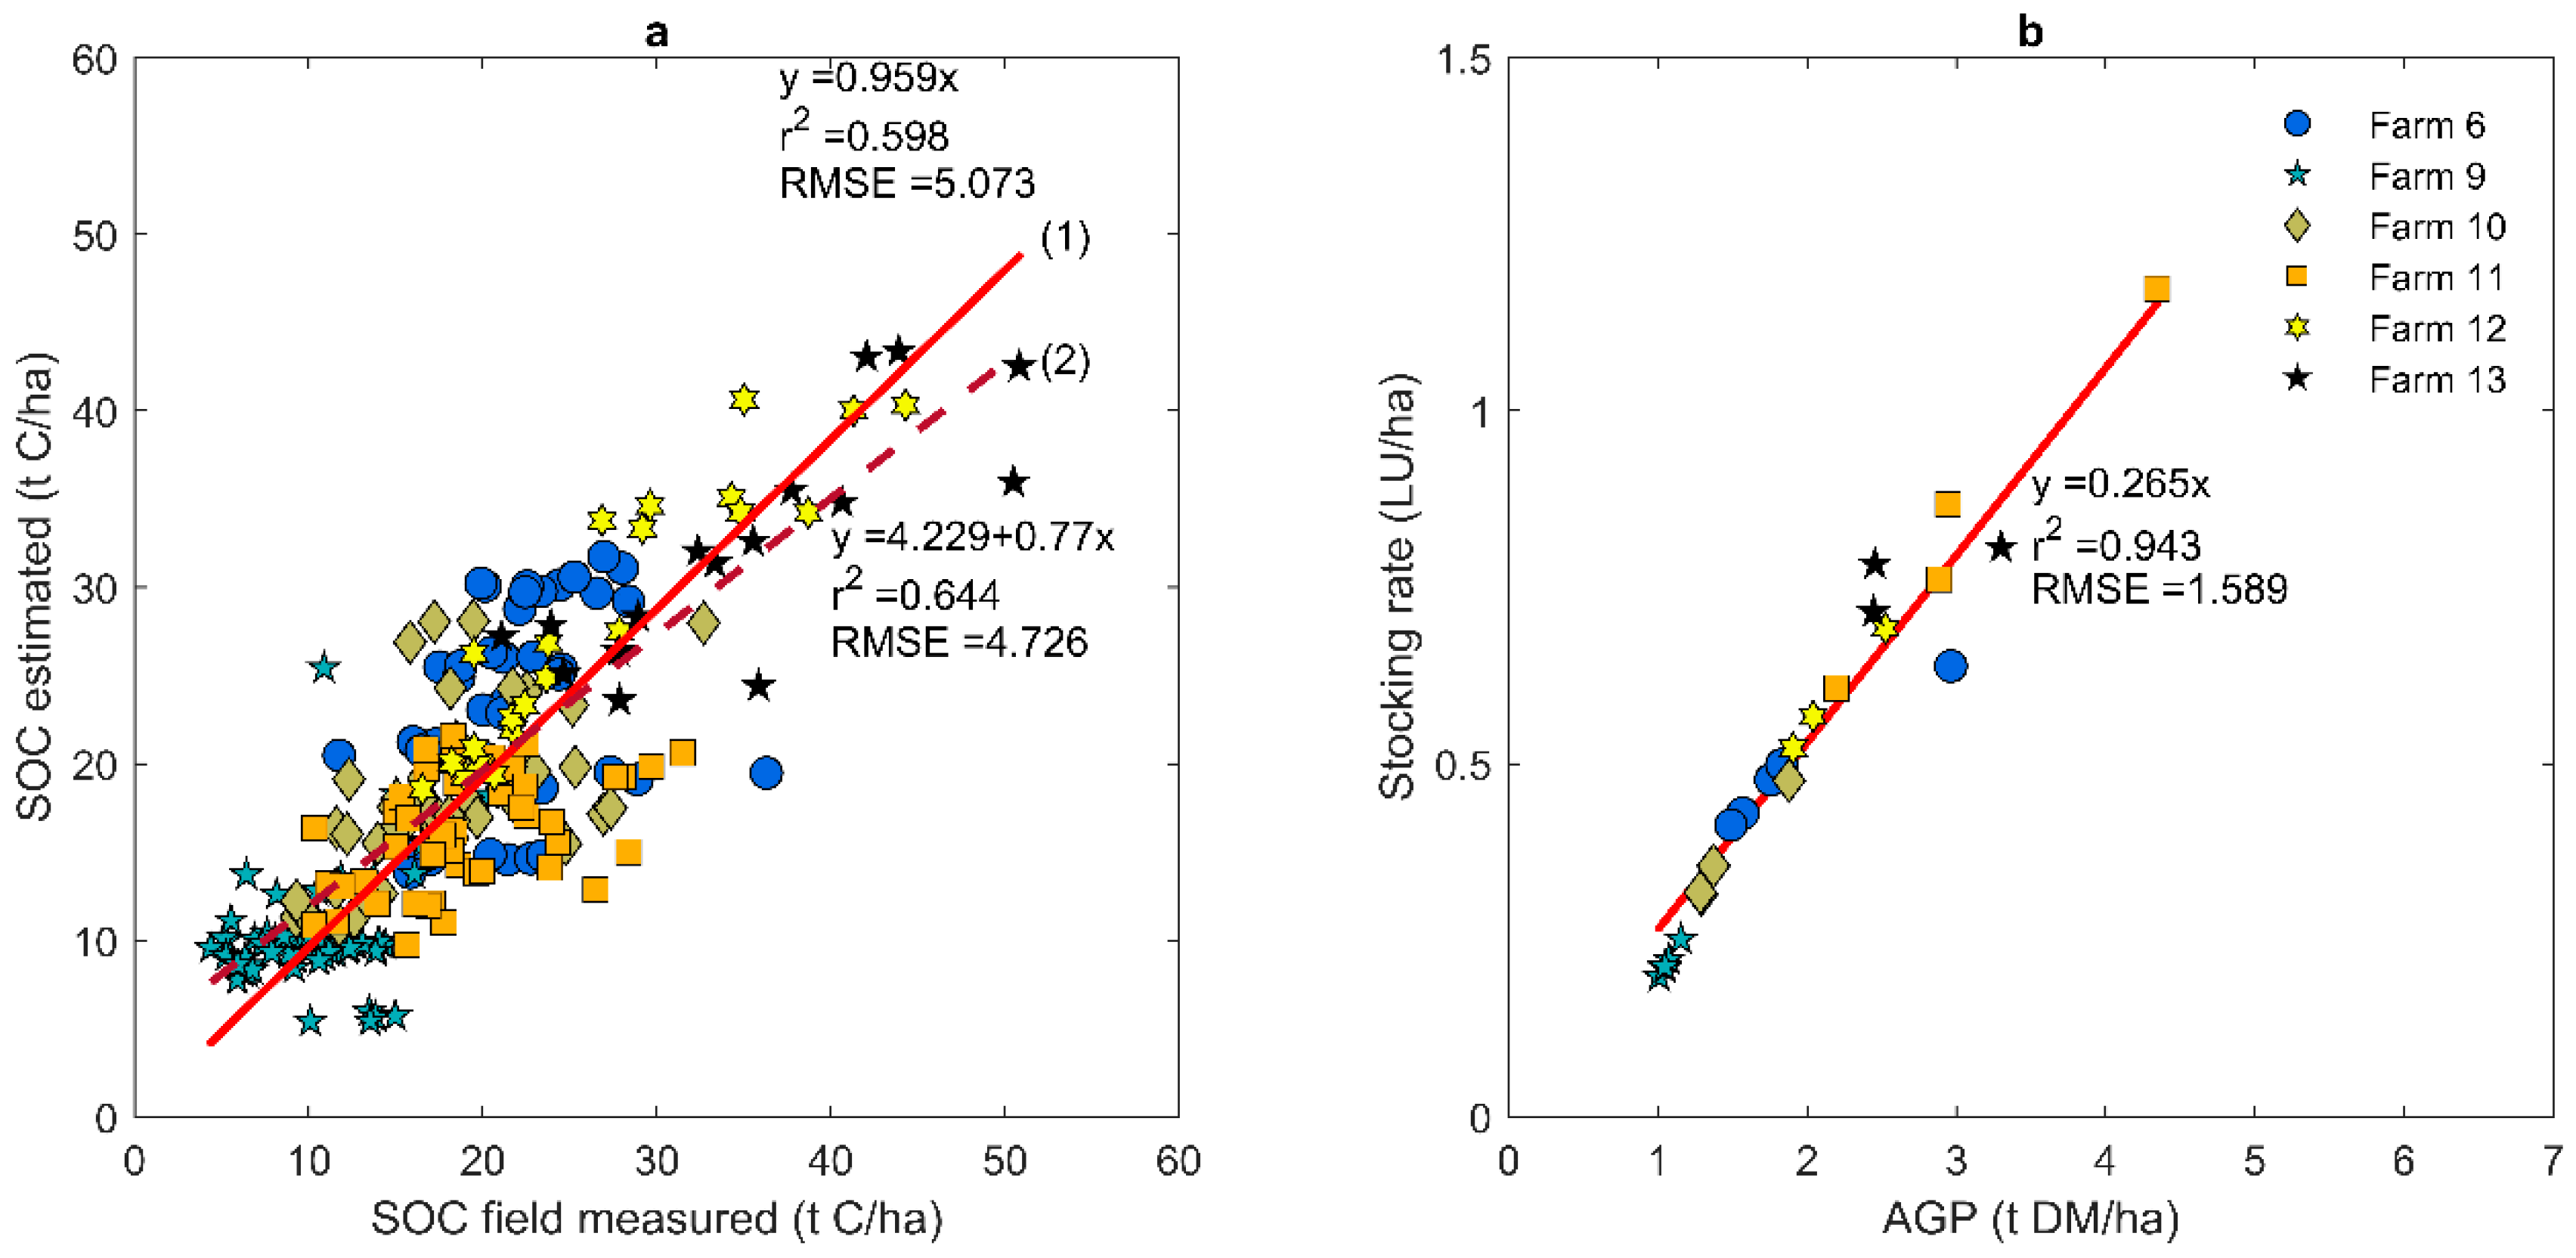
3.1. Estimation of Production Parameters for the Pasture Systems

Figure 3 depicts the score (i.e., loss function value) as a function of the optimum in each iteration RS ratio, LD, LI and DPM/RPM ratio, where each iteration corresponds to a different initial set of parameters given as input for the optimization process to run. Parameters in the “best” iteration, i.e., the iteration with the lowest loss function value, which was equal to 0.61 (represented in red in Figure 3) are: RS equal to 0.96, LD equal to 1.53 t C/LU, LI equal to 0.61 and DPM/RPM equal to 1.06. All optimum parameters display low dispersion. DPM/RPM (Figure 3d) has the lowest absolute variation range, i.e., 0.02 (between 1.06–1.09), followed by LI ratio (Figure 3b) with a variation range of 0.03 (between 0.60 and 0.63). RS ratio (Figure 3a) dispersion is 0.6 (between 0.94 and 1.00) LD (Figure 3c) is the parameter with the highest variation range, 0.16 (between 1.46 and 1.63 t C/LU). The final values of RS, LI and DPM/RPM for all runs are always ±5% with respect to the global optimum. The variation is higher for LD: 11%. The variability of the final set of parameters in each iteration does not influence predicted SOC dynamics significantly. As an example, we ran the model during a ten-year period starting from an arbitrary point with initial SOC equal to 25 t C/ha and considering an AGP of 7 t DM/ha and a SR of 1.0 LU/ha, which were the average of the AGROs project, as well as average climate conditions. The average difference of the estimated average annual C accumulation using any two sets of final parameters is 10−10 t C/ha.yr.
The RS ratio of 0.98 is close to values reported in the literature for “temperate arid shrubland” (value of 1.063). Another trend shown by the results in this work, as well as previous studies [13], is that when AGP is lower, the RS ratio tends to increase. Higher LIs are observed during production years and in farms with the highest AGP, but there are exceptions. For example, AGP in the last production year in farm 2 is lower than AGP in the second production year in farm 5, but the LI is higher (farm 2: 0.63 t DM/ha; farm 5: 0.62 t DM/ha). LI varies between 1.4 t DM/ha in the second year in farm 2 and 6.1 t DM/ha in the first year in farm 1. Farm 1 is where animals were fed the most on pasture (5.87 t DM/ha, on average), whereas farm 5 is the one where animals were fed the least on pasture (2.48 t DM/ha).
For LD, we originally provided the model with rather broad constraints on the parameters based on IPCC data. That resulted in LD ranging between 1.30 and 1.56 t C/LU (Figure 3c). Deposition usually ranges between 80 and 120 kg N/LU in the most common breeds of cattle used in Portugal [50]. Considering that the C/N ratio of cattle dung in Portugal ranges between 15 and 25 [51], and using this C/N ratio to convert from mass of N into mass of C, this leads to LD in the range 1.2 to 3 t C/LU.
The repetition of the optimization procedure produced differences between the best runs that were never higher than 2% in terms of the minimum loss function value. The parameters never deviated more than approximately 4%. Therefore, there is no evidence that increasing the number of iterations would change results, and it can be expected that the minimum reported here is the global minimum of the loss function.
Figure 4 depicts the final parameters after optimization per iteration as a function of the respective randomly selected initial value. Through visual inspection, it is clear that there is no relationship between the two variables, for all parameters (e.g., the initial LI varied between 0 and 1, but the final value only ranged between 0.60 and 0.63—Figure 4b). The outliers mentioned above are also unrelated to the initial parameters Additionally, the best iteration never corresponds to a corner solution within the range of the variable.
Regarding the correlation analysis, all parameters are significantly correlated (at 5% level) except for the DPM/RPM ratio. DPM/RPM is the least correlated parameter (average: 0.120), e.g., the highest DPM/RPM correlation is with LD, 0.306. The highest correlation, in absolute value, is between the RS and LD (−0.814). The negative sign means that there is a tradeoff between LD and RS. SBP have high carbon inputs due to high AGP, and the model only requires BGP or animal inputs to arrive at the measured level of OM. The second highest correlation is between LI and LD (0.343).
When we used the optimum parameters to simulate SOC dynamics in the original farms, we found that the model overestimates measured SOC by 1 ± 1.5 t C/ha (minimum: 0; maximum: 17). Figure 5 shows the fit for each farm. Disregarding the outlier farm (farm 4) and the last production year of farm 2 (SOM increase of 2.7%—average: 0.4%), the simulated SOC underestimates measured SOC, by only 0.1 ± 0.7 t C/ha. The quality of the fit is a function of the farm and of the year. Examples in which the results are a function of the farm are farms 2 and 6 during the second production year. In farm 2, the estimated SOC stock is only 1 t C/ha lower than measured SOC in farm 1 (Figure 5b), but 6 t C/ha higher (Figure 5f) in farm 6. An example of the influence of the characteristics of the year is farm 6 (Figure 5f). In the first year, the difference between the estimated and measured SOC stock is about 2 t C/ha, but in the second year the difference is about 6 t C/ha. The difference is higher in the last year on farm 2 (17 t C/ha). Regarding farm 1 (Figure 5a), SOC stock is always underestimated on average by 4 t C/ha in the second year due to the fact that measured SOC stocks in this farm are above the range of stocks used to calibrate the model, and as such they are outliers. Nevertheless, in the first year the difference between field measured and estimated SOC stock is close to zero. Farm 1 and farm 2 had similar measured SRs, but annual SOM increments were twice as high in farm 1 (0.54% vs. 0.23%).
Pasture productivity in farm 1 was estimated, rather than field-measured as in farm 2, but the estimation provided an AGP close to the maximum observed in the AGRO 87 project (average estimated productivity in farm 1 was 9.5 t DM/ha; the maximum for all years and farms was 10.6 t DM/ha). Regarding farm 6, a reduction of about 2 t C/ha SOC was measured in the third year, but the model estimates an increase by the same amount. This was because, given the AGP and SR measured, an increase in SOC was expected. During the third year, measured AGP and SR in this farm are higher than AGP and SR during the first year on farm 5 (AGP: 5.8 t DM/ha versus 3.9 t DM/ha; SR: 1.29 versus 1.18), but in farm 5 SOC increases and in farm 6 it decreases. Weather data cannot justify this difference, because average monthly temperature is similar in both cases (temperature: 17 °C versus 18 °C) and annual accumulated precipitation is lower in the case of farm 5 (precipitation: 475 mm versus 590 mm). Thus, in the second year of farm 6, climatic conditions were more favorable for SOC accumulation than in the second year of farm 5.
Multiple factors could justify these outliers. First, it could happen due to an experimental error during field measurements or in their laboratorial analysis. Second, SBP in Alentejo region are complex agroforestry systems in “Montado” areas of low-density cork or holm oak forest, where trees can affect SOC changes due to extra deposited litter (from leaves and dead branches) on the field or the influence of root systems [52,53]. Data points were selected as much as possible away from the influence of tree cover, but it cannot be fully guaranteed that trees did not affect measurements of AGP and SOM data. Even if trees did not influence results, animal grazing could have played a role. Only average SR for entire plots were recorded, but grazing and consequent dung accumulation is uneven throughout the plot due to gradients of plant establishment that are selectively grazed. Sample points could have been taken from a non-representative site where grazing was particularly more or less intense. Additionally, the nature of the organic materials in these plots and the dynamics of their assimilation into soils could have made our assumption that C input into soils and their conversion to SOC are simultaneous. We assumed that litter is transformed to SOC in the same month that it is produced. This assumption worked well in general, but in those outlier cases, it is possible that litter took longer to be incorporated in the soil [54]. Factors such as litter composition affect the incorporation rate. Finally, RothC is a relatively light model in terms of the number of parameters and processes depicted. The processes of SOC accumulation in these cases could possibly require more complex and detailed models, such as the Century model [55], which takes into account more variables.

3.2. Estimating AGP and SR for an Unrelated SOC Database

Figure 6a presents the estimated SOC stock as a function of field-measured SOC stock, after application of RothC using the previously estimated parameters estimated to the farms involved in the EDP project. Figure 6a also presents the linear regression fits, where the intercept is significantly different from zero (p-value equal to 2.1 × 10⁻⁶), and the slope is significantly different of 1 (p-value equal to 6.9 × 10⁻¹⁰), which means that our model has a non-negligible bias. In the non-biased regression, the intercept would be zero and the slope would be one. In this case, the intercept is about 4 t C/ha and the slope approximately 0.8, meaning that the model overestimates the lower SOC stocks and underestimates the higher SOC stocks. There is an overestimation of the SOC stock of 1.5 t C/ha in the 0–20 t C/ha range, while for higher stocks, there is an overestimation of 2 t C/ha. This is probably due to the fact that about 85% of the measured SOC stocks used for the optimization procedure were in the 10–30 t C/ha range. This is the region where the two linear fits in Figure 6a are closer and the model overestimates SOC stocks by 0.04 t C/ha only.
Two additional parameters originally not measured, AGP and SR, were co-determined. No constraints were imposed on either. However, if the model is valid, AGP and SR should increase simultaneously. This is due to the empirical observation that, in general, if pastures are more productive, farmers tend to use them for animal feed to a larger extent [56]. There are some cases, namely when the size of herd is small, when SR does not influences the AGP [57,58]. In the case of SBP, however, the SR, farm and herd size are typically high (e.g., in the AGRO87 project, typically 0.5–1 LU/ha in 14 ha plots), and as such we would expect to observe on average a direct relationship between SR and AGP.
Figure 6b presents the SR estimated with the model as a function of the estimated AGP, for the parameter set with lower loss function value. The list of estimated AGP and SR that minimize the loss function for all farms in the EDP project is in Table 2. As expected, farms and years with higher AGP also have higher SR as a general rule, i.e., when there is more feed available there are more grazing animals. The r2 is close to one (approximately 0.943) and the RMSE is 1.589. Additionally, there are also strong and significant (at 1% level) Spearman’s correlations between estimated SOC (average per farm and year) with AGP and SR, at 0.524 and 0.547, respectively.
The inverse of the regression slope can be interpreted as the animal pasture animal intake per LU, 3.77 t DM/LU. This intake can be converted into the crude protein (CP) and gross energy intake (GE) provided to cattle per head, and compared with the necessities of the animals.
We assumed, for comparison purposes, that the animals on the farms can be either cows or calves. We considered one cow to be 1 LU, and one calf to be 0.4 LU, and used the pasture CP and GE content obtained by Morais et al. [24] for SBP. Allocating pasture feed according to the proportions in LUs, for an adult cow, the pasture provides 525 kg CP/cow.yr and 55 × 103 MJ GE/cow.yr, and for the calf 261 kg CP/calf.yr and 27 × 103 MJ GE/calf.yr.
Regarding the necessities of the animals, CP and GE intake are highly dependent on the animal liveweight, breed, type of diet, month since calving, peak milk (for adult cows) and other variables. We therefore compare the CP and GE intakes estimated above with plausible variation ranges in the literature [59,60,61,62]. In these calculations, we considered live weights for adult cows and calves of 677 kg and 320 kg, respectively, for the Alentejana breed [24].
For an adult cow, the need for CP ranges between 215 kg CP/cow.year for a cow with 600 kg and 7 months after calving [60] and 690 kg CP/cow.yr with 720 kg and 2 months after calving [61]. Our results of 525 kg CP/cow.yr are within this range.
For the calf, CP intake required ranges between 213 kg CP/calf.yr for a calf with 300 kg [59] and 530 kg CP/calf.yr for a calf with 350 kg [60]. Our result of 261 kg CP/calf.yr is also within this range. Regarding GE intake for an adult cow, it ranges between 49 × 103 MJ GE/cow.yr for a low energy intake diet [62] and 60 × 103 MJ GE/cow.yr for a high energy intake diet [63], and we obtained a mid-range result of 55 × 103 MJ GE/cow.yr.
The year 2007–2008 showed generalized higher SOC stock increases for all farms. According to data measurements, the average annual increase was 3 t C/ha. The model estimates the increase at 1 t C/ha. Nevertheless, this is not fully reflected in the AGP and SR estimated. The year with highest AGP and SR is 2010–2011, although the AGP difference is only 0.1 t DM/ha between 2007–2008 and 2010–2011, and the difference of SRs is only 0.04 LU/ha.
Table 2 presents the AGP and SR per farm and production year for farms surveyed in the EDP project. Average AGP and SR are each about one third of the AGP and SR measured in the AGRO projects (EDP: 2.1 t DM/ha and 0.53 LU/ha; AGROs: 6.8 t DM/ha and 0.91 LU/ha). This could happen for several reasons. It could be due to the fact that the pasture plots in these farms are older, as hinted by the lower SOC stocks accumulation (only 0.3 t C/ha while in the AGROs farms it is 2 t C/ha) [64]. Thus, the model would use less carbon inputs from plants and animals. However, older SBP also benefit from the positive effects of accumulated higher SOM, which should improve N availability from mineralization. The reason for the lower AGP could also be the fact that the composition of the pastures in both projects was also significantly different. In AGRO farms, legumes were on average about 40% [38], while EDP pastures were dominated by grasses, and legumes were less than 25% [64]. For example, in farm 10, there was a predominance of grasses more commonly found in natural pastures [64]. Nevertheless, there was also considerable variation of species and varieties among SBP sown during the AGRO project alongside stable yields. Climatic data also influence the results obtained. Monthly average temperature is similar for both datasets (EDP: 18 °C; AGRO: 19 °C), but annual precipitation is significantly higher in the period between 2006 and 2012 (EDP: 700 mm; AGRO: 500 mm). Higher precipitation did not produce increased yields in EDP project farms, and consequently carbon inputs into the soil were low. The only effect of precipitation in these farms was the increase of soil respiration by affecting SOM decomposition rates, particularly in the DPM pool, resulting in low measured SOC accumulation. The most likely explanation for the lower AGP, SR and SOC in EDP farms is that pastures during the AGRO project were accompanied by technical services ensuring best management practices but not before or during the EDP project. For this reason, these SBP areas showed more signs of degradation, likely because of inadequate grazing management, lack of fertilization and/or reseeding when necessary. A clear marker of the degradation is the deficient annual re-establishment of the pasture from the seed bank, as highlighted by the decrease in legume species (which are almost all introduced).
As most prior studies on SBP have focused on particular aspects of the system (such as SOM increases), other examples of co-determination of AGP, SR and SOC is difficult to find. As shown before in this paper, these variables are highly related with the farm, due to different climatic conditions, management and other aspects, such as soil characteristics. Due to the difference between SBP and other pasture systems, especially in terms of AGP and SR [38], the results obtained in this paper for SBP are not directly comparable with other pastures systems. Consequently, we found only one study in the literature [64] that (a) focused on SBP, and (b) included one of the same farms, within the period covered in this paper. In 2010–2011 in farm 11, we estimated that the AGP was 2.2 t DM/ha, which is similar to 2.8 t DM/ha obtained by Simionesei et al. [64] for the same year and farm. Their work used a physically based soil-water dynamics model, i.e., the MOHID model [65], which was calibrated with AGP field measurements.

3.3. Main Limitations and Future Perspectives

SBP have been the subject of special attention in the recent past due to their potential for carbon sequestration. For this reason, most monitoring initiatives have focused on SOM only. Measuring SOM helps quantify carbon sequestration potentials, but it is insufficient to explain why or how SOC increases in SBP, and consequently to extrapolate for larger regions or to estimate what would happen in different areas (important for the expansion of this system). Our paper introduces an idea that, to our knowledge, is innovative or at least rarely applied—that we can use computer optimization techniques and process-based modelling to go back to the incomplete datasets and estimate missing information that provides a deeper understanding of what happened during that period. As demonstrated in Section 3.2, the approach presented here is useful to suppress those data gaps. With the model parameterization performed in this work, it is possible to estimate AGP and SR knowing only SOC stock changes. AGP is a crucial variable for livestock production, e.g., if AGP increases, in principle, grazing can be increased and animals can consume less concentrated feeds. AGP is usually measured through destructive methods of biomass estimation and is limited to small area due to the destructive nature, time, expense and labor involved [66,67,68]. Other non-destructive methods have been proposed, e.g., using remote sensing imaging [69,70]. Nevertheless, the influence of tree cover in “Montado” agri-forestry regions is a relevant limitation to the use of remote sensing methods as well as our approach, as high tree cover density also influences AGP [71]. This is a relevant issue in SBP systems, particularly in this sample. For example, in farm 11, the tree density is about 170 trees/ha of Quercus suber [64]. Thus, there is no single indirect estimation method for AGP, and ideally a combination of approaches could be preferable, depending on the specific case.
The presence of legumes in the pastures is particularly relevant for SOC (which is the case of SBP). In nutrient-poor regions, multifunctional pastures tend to produce more in comparison with monoculture pastures, which translates into more available feed [16,72]. This is more relevant because SBP are a mix of grasses and legumes, while other pastures systems usually are mostly composed by grasses. Nevertheless, our work focused only on the pastures systems and not on the species that are in the pasture, i.e., the effect of presence of legumes was not assessed. For example, RS is one parameter highly related with the species, e.g., grasses tend to have higher RS than legumes [73,74]. Thus, the RS of the pasture is highly dependent on the share of grasses/legumes (in AGROs SBP parcels the fraction of legumes varied between 10 and 73%). The fraction of legumes also influences nitrogen intake and consequently nitrogen excretion. Nitrogen content of dung (and therefore the C/N ratio) is one of the most relevant features influencing dung production and decomposition [75,76,77]. Animal excretion usually is addressed in terms of nitrogen content, while our work focuses on carbon, which introduces the issue of the carbon content or C/N ratio of dung. C/N ratios in dung have a considerable large degree of variation (between 15 and 25 [51]) depending on multiple variables, e.g., temperature and moisture [78]. In our work, none of these effects of legumes could be evaluated.
Carbon and nitrogen fluxes in livestock production are one of the major contributors to GHG emissions [79,80,81] and nutrient losses [82,83]. A complete assessment of GHG balance requires a more comprehensive analysis of the production system, including animal dung left on the field and sensitivity of emissions to feed, plant litter formation and also include nitrogen in soil sub-systems [84]. Low nutrient retention in soils due to nutrient leaching is a particular important point in semi-arid regions [85]. Future work should connect nutrient leaching with other aspects of the carbon and nitrogen balance, such as the fraction of legumes or organic matter content [23,72]. Furthermore, so far, mass balances of livestock production analysis have used one hectare as the unit of analysis. A mass unit of product can also be used, as it is the choice of most studies targeting meat production, as in life cycle assessment studies [86,87,88,89], with some exceptions. This mass unit should, however, always be adjusted for nutritional value to encompass the complex nutritional functions provided by food products (such as some units assessed by [90]) and connected them to global impacts of different human diets [91].
As future work, the model should also be calibrated and tested with more recent data and include more sites and longer periods. SOC saturation is believed to be attained after about 10 years [92], but few measurements have been conducted in SBP that were more than 10 years old. Barriers to obtaining longer SOC time series are the difficulty and cost of obtaining data. Merging our work with indirect data collection of these variables—for example, through remote sensing, such as, for example, aerial visible and near-infrared photographs and/or satellite data—can avoid the burden of data collection.
The outcomes of this paper have already been used in the life cycle assessment of the SBP system [24,93]. They were also used to understand C cycling in SBP ecosystems [84]. Another potential application of this work is the calculation of C sequestration factors in SBP. With regionalized AGP and SR, the results of this paper could be used to update the Portuguese C sequestration factor for SBP (6.6 t CO2e/ha.yr), obtained by Teixeira et al. [22] (based on the SOM data from the AGRO 71 and 87 datasets also used here), which was used in the Portuguese National Inventory Report [50]. The Teixeira et al. model [21] is a simple SOC dynamic model, considering a single carbon pool with time-invariant carbon input and mineralization rate. The carbon input is a linear function of SOM0, the initial SOM level, taken as a proxy for local features (mostly edaphoclimatic) that characterize the ecological quality of each site. This proxy was introduced to capture the pattern in the data that locations with higher initial SOM typically had higher increases in SOM. This model [22] avoids overfitting issues that can occur in optimization approaches, but it was obtained for specific conditions of the farms where data was collected without biogeochemical process base. In our case, site-dependency in the model is provided by AGP and SR, which determine C inputs to soil, and by temperature and precipitation, which are important to determine mineralization.
Therefore, C sequestration according to the model by Teixeira et al. [22] is pre-determined by the initial SOM concentration. C sequestration according to the model calibrated in this paper takes into account more site and management-specific parameters. These parameters would enable more accurate regionalized estimations if regionalized AGP and SR were available, but for the moment it is at least possible to compare the results of the present model with the C sequestration factor previously established under the same conditions. For comparison purposes only, we ran the model using the average initial SOM concentration assumed in Teixeira et al. [22] (0.87%), a soil bulk density of 1.48 g/cm3, an AGP of 7 t DM/ha, SR of 1 LU/ha, and the average temperature and precipitation for the region of Alentejo (16 °C and 75 mm). Our model provides a slightly higher estimation of the potential carbon sequestration under these average conditions, 7.2 t CO2e/ha.yr. Note, however, that Teixeira et al. [22] considered an initial SOC stock of 7.4 t C/ha (equivalent to the SOM concentration of 0.87% in 10 cm topsoil), while, according to the LUCAS-topsoil database [43], the average SOM concentration in pastures and agroforestry areas in Alentejo region is about 1.7% (almost double of SOM concentration considered in Teixeira et al. [22], also at 10 cm depth, assuming uniform distribution in the 0–20 cm layer). Furthermore, Teixeira et al. [22] implicitly obtained a mineralization rate of 19%, while using this paper results in a significantly lower mineralization rate (only 7%). In the formulation of Teixeira et al. [22], mineralization rate and annual carbon inputs are arrived at statistically using information on SOM only. This interdependency is the justification for the higher mineralization rate, as the model arrived at an adjustment with faster carbon turnover than estimated here.
The results used in this paper therefore have two main advantages compared to Teixeira et al. [22]: (a) they reflect more accurately the dynamics of C accumulation in SBP; and (b) they enable a regionalized calculation of C sequestration based on more site-specific parameters.

4. Conclusions

This paper is the first application of a process-based soil model to SBP. The procedure established here can successfully reduce the need for data collection. Combining theoretical knowledge (models) with machine learning techniques can successfully help infer additional information from incomplete data sets. The main outcomes of this work are (a) the parameterization of SBP in Portugal, using a soil process-based model (RothC model), and (b) the demonstration of the application potential of the calibration results to estimate AGP and SR in different SOC datasets.
SBP is a unique pasture system that increases SOC accumulation, which is particularly relevant in semi-arid regions strongly depleted of organic soil materials [22,94]. We provide a better characterization of these livestock production systems, looking specifically at the dynamics of SOC as affected by (1) the plant sub-system (RS), which feeds livestock and provides carbon inputs to soils; (2) the soil sub-system (SOC stock changes), which accumulates SOC and emits carbon through mineralization of organic materials; and (3) the animal sub-system (LD and LI), which takes up plant materials and re-deposits them during grazing as animal carbon inputs to soil. The optimization procedure points to a likely RS ratio of 0.98, an input from animal excreta of 1.53 t C/LU, and a proportional animal intake of 0.61. This estimation of animal intake was independently validated for the crude protein and energy content of dry matter. Regarding DPM/RPM, the high value obtained here is characteristic of improved grasslands, where organic matter turnover is quicker. The same model was applied to a different dataset consisting of SOM measurements in older sown pastures, where we estimated AGP (average: 2.0 t DM/ha) and SR (average: 0.52 LU/ha). AGP and SR in this sample are significantly lower than in the dataset used for calibration, likely because these plots were not duly accompanied by technical support systems and therefore had no specific maintenance management operations. In the future, the model and approach established here can be used to improve the carbon sequestration factor of the SBP system in Portugal, as well as to evaluate the likely effects on yield and carbon sequestration of SBP installation in other farms within the Mediterranean region.

Supplementary Materials

The following are available online at https://www.mdpi.com/2071-1050/10/12/4437/s1, S1 File—Data used.

Author Contributions

T.G.M. performed the analysis and was the primary writer of the manuscript. N.R.R. collected data and assisted in the analysis of results. R.F.M.T. and T.D. conceived and supervised the study, and assisted in the writing process.

Funding

This work was supported by projects Animal-Future—Steering Animal Production Systems Towards Sustainable Future, funded by the Horizon 2020 Program of the European Union (SusAn/0001/2016), ModelMeat—Modelo de Optimização de Ambiente e Qualidade do Produto para Serviços de Apoio à Competitividade dos Agentes da Fileira da Produção Animal Extensiva, funded by Portugal 2020 (nr. 017630) and by FCT/MCTES (PIDDAC) through project UID/EEA/50009/2013. T. Morais was supported by grant SFRH/BD/115407/2016 and R. Teixeira by grant SFRH/BPD/111730/2015 from Fundação para a Ciência e Tecnologia.

Conflicts of Interest

The authors declare no conflict of interest.

Abbreviations

The following abbreviations are used in this manuscript, including variable names (with variable units in parentheses):
AGPAboveground productivity
BGPBelowground productivity
CCarbon
CFCarbon fraction of the legumes and grasses
DMDry matter
DPMEasily decomposable plant material
EDPEnergias de Portugal
GPCPGlobal Precipitation Climatology Project
IanimalCarbon inputs from animal dung
IplantCarbon inputs from plant residue
IPCCIntergovernmental Panel on Climate Change
LDLivestock dung
LILivestock intake
LP DAACLand Processes Distributed Active Archive Center
LULivestock unit
NNitrogen
NLPNonlinear programming
PCFPortuguese Carbon Fund
RothCRothamsted Carbon Model
RPMResistant plant material
RSRoot to shoot
SBPSown biodiverse permanent pastures rich in legumes
SOCSoil organic carbon
SOMSoil organic matter
SRStocking rate

References

  1. Sloat, L.L.; Gerber, J.S.; Samberg, L.H.; Smith, W.K.; Herrero, M.; Ferreira, L.G.; Godde, C.M.; West, P.C. Increasing importance of precipitation variability on global livestock grazing lands. Nat. Clim. Chang. 2018, 8, 214–218. [Google Scholar] [CrossRef]
  2. Soliveres, S.; van der Plas, F.; Manning, P.; Prati, D.; Gossner, M.M.; Renner, S.C.; Alt, F.; Arndt, H.; Baumgartner, V.; Binkenstein, J.; et al. Biodiversity at multiple trophic levels is needed for ecosystem multifunctionality. Nature 2016, 536, 456–459. [Google Scholar] [CrossRef] [PubMed]
  3. Hector, A.; Bagchi, R. Biodiversity and ecosystem multifunctionality. Nature 2007, 448, 188–190. [Google Scholar] [CrossRef] [PubMed]
  4. Pereira, H.M.; Domingos, T.; Marta-Pedroso, C.; Proença, V.; Rodrigues, P.; Ferreira, M.; Teixeira, R.; Mota, R.; Nogal, A. Uma avaliação dos serviços dos ecossistemas em Portugal. In Ecossistemas e Bem-Estar Humano Avaliação para Portugal do Millennium Ecosystem Assessment; Escolar Editora: Lisboa, Portugal, 2009; pp. 687–716. [Google Scholar]
  5. Lal, R. Soil carbon sequestration impacts on global climate change and food security. Science 2004, 304. [Google Scholar] [CrossRef] [PubMed]
  6. Soussana, J.F.; Tallec, T.; Blanfort, V. Mitigating the greenhouse gas balance of ruminant production systems through carbon sequestration in grasslands. Animal 2010, 4, 334–350. [Google Scholar] [CrossRef] [PubMed]
  7. Teixeira, R.F.M. The cost-effectiveness of optimizing concentrated feed blends to decrease greenhouse gas emissions. Environ. Eng. Manag. J. 2018, 17, 999–1007. [Google Scholar] [CrossRef]
  8. Van Oijen, M.; Bellocchi, G.; Höglind, M. Effects of Climate Change on Grassland Biodiversity and Productivity: The Need for a Diversity of Models. Agronomy 2018, 8, 14. [Google Scholar] [CrossRef]
  9. Lal, R.; Negassa, W.; Lorenz, K. Carbon sequestration in soil. Curr. Opin. Environ. Sustain. 2015, 15, 79–86. [Google Scholar] [CrossRef]
  10. Peri, P.; Rosas, Y.; Ladd, B.; Toledo, S.; Lasagno, R.; Martínez Pastur, G. Modelling Soil Carbon Content in South Patagonia and Evaluating Changes According to Climate, Vegetation, Desertification and Grazing. Sustainability 2018, 10, 438. [Google Scholar] [CrossRef]
  11. Álvaro-Fuentes, J.; López, M.V.; Arrúe, J.L.; Moret, D.; Paustian, K. Tillage and cropping effects on soil organic carbon in Mediterranean semiarid agroecosystems: Testing the Century model. Agric. Ecosyst. Environ. 2009, 134, 211–217. [Google Scholar] [CrossRef] [Green Version]
  12. Kong, A.Y.Y.; Six, J.; Bryant, D.C.; Denison, R.F.; van Kessel, C. The Relationship between Carbon Input, Aggregation, and Soil Organic Carbon Stabilization in Sustainable Cropping Systems. Soil Sci. Soc. Am. J. 2005, 69, 1078. [Google Scholar] [CrossRef] [Green Version]
  13. Mokany, K.; Raison, R.J.; Prokushkin, A.S. Critical analysis of root: Shoot ratios in terrestrial biomes. Glob. Chang. Biol. 2006, 12, 84–96. [Google Scholar] [CrossRef]
  14. IPCC. 2006 IPCC Guidelines for National Greenhouse Gas Inventories. Institute for Global Environmental Strategies (IGES) for the Intergovernmental Panel on Climate Change; The Intergovernmental Panel on Climate Change (IPCC): Kanagawa, Japan, 2006. [Google Scholar]
  15. Chapman, D.F.; Parsons, A.J.; Cosgrove, G.P.; Barker, D.J.; Marotti, D.M.; Venning, K.J.; Rutter, S.M.; Hill, J.; Thompson, A.N. Impacts of Spatial Patterns in Pasture on Animal Grazing Behavior, Intake, and Performance. Crop Sci. 2007, 47, 399. [Google Scholar] [CrossRef]
  16. Lüscher, A.; Mueller-Harvey, I.; Soussana, J.F.; Rees, R.M.; Peyraud, J.L. Potential of legume-based grassland-livestock systems in Europe: A review. Grass Forage Sci. 2014, 69, 206–228. [Google Scholar] [CrossRef] [PubMed]
  17. Roughley, R.J.; Dart, P.J. Growth of Trifolium subterraneum L. Selected for Sparse and Abundant Nodulation as Affected by Root Temperature and Rhizobium Strain. J. Exp. Bot. 1970, 21, 776–786. [Google Scholar] [CrossRef]
  18. Smit, H.J.; Metzger, M.J.; Ewert, F. Spatial distribution of grassland productivity and land use in Europe. Agric. Syst. 2008, 98, 208–219. [Google Scholar] [CrossRef]
  19. Teixeira, R.F.M.; Domingos, T.; Canaveira, P.; Avelar, T.; Basch, G.; Belo, C.C.; Calouro, F.; Crespo, D.; Ferreira, V.G.; Martins, C. Carbon sequestration in biodiverse sown grasslands. Options Méditerranéennes Sustainable Mediterranean Grasslands and Their Multi-Functions 2008, A, 123–126. [Google Scholar]
  20. Valada, T.; Teixeira, R.; Martins, H.; Ribeiro, M.; Domingos, T. Grassland management options under Kyoto Protocol Article 3.4. Options Méditerranéennes Sustainable Mediterranean Grasslands and Their Multi-Functions 2012, A, 53–56. [Google Scholar]
  21. Teixeira, R.F.M. Sustainable Land Uses and Carbon Sequestration: The Case of Sown Biodiverse Permanent Pastures Rich in Legumes. Ph.D. Thesis, Instituto Superior Técnico, Lisbon, Portugal, 2010. [Google Scholar]
  22. Teixeira, R.F.M.; Domingos, T.; Costa, A.P.S.V.; Oliveira, R.; Farropas, L.; Calouro, F.; Barradas, A.M.; Carneiro, J.P.B.G. Soil organic matter dynamics in Portuguese natural and sown rainfed grasslands. Ecol. Model. 2011, 222, 993–1001. [Google Scholar] [CrossRef]
  23. Teixeira, R.F.M.; Proença, V.; Crespo, D.; Valada, T.; Domingos, T. A conceptual framework for the analysis of engineered biodiverse pastures. Ecol. Eng. 2015, 77, 85–97. [Google Scholar] [CrossRef]
  24. Morais, T.G.; Teixeira, R.F.M.; Domingos, T. The Effects on Greenhouse Gas Emissions of Ecological Intensification of Meat Production with Rainfed Sown Biodiverse Pastures. Sustainability 2018, 10, 4184. [Google Scholar] [CrossRef]
  25. Martins, H.; Canaveira, P.; Valada, T.; Alves, M.; Rodrigues, N.; Domingos, T. Relatório Final de Implementação do Contrato de Sequestro de Carbono Celebrado entre EDP e Terraprima 2015; Terraprima—Serviços Ambientais, Sociedade Unipessoal: Lda, Lisbon, Portugal, 2015. [Google Scholar]
  26. Poeplau, C. Estimating root: Shoot ratio and soil carbon inputs in temperate grasslands with the RothC model. Plant Soil 2016, 407, 293–305. [Google Scholar] [CrossRef]
  27. Cuddington, K.; Fortin, M.-J.; Gerber, L.R.; Hastings, A.; Liebhold, A.; O’Connor, M.; Ray, C. Process-based models are required to manage ecological systems in a changing world. Ecosphere 2013, 4, art20. [Google Scholar] [CrossRef]
  28. Monforti, F.; Lugato, E.; Motola, V.; Bodis, K.; Scarlat, N.; Dallemand, J.-F. Optimal energy use of agricultural crop residues preserving soil organic carbon stocks in Europe. Renew. Sustain. Energy Rev. 2015, 44, 519–529. [Google Scholar] [CrossRef]
  29. Coleman, K.; Jenkinson, D. RothC, A Model for the Turnover of Carbon in Soil—Model Description and Users Guide; Rothamsted Research: Harpenden Herts, UK, 2014. [Google Scholar]
  30. Byrne, K.; Kiely, G. Evaluation of Models (PaSim, RothC, CENTURY and DNDC) for Simulation of Grassland Carbon Cycling at Plot, Field and Regional Scale; 2005-FS-32-M1 STRIVE Report; Environmental Protection Agency: Washington, DC, USA, 2005. [Google Scholar]
  31. Diels, J.; Vanlauwe, B.; Van der Meersch, M.K.; Sanginga, N.; Merckx, R. Long-term soil organic carbon dynamics in a subhumid tropical climate: 13C data in mixed C3/C4 cropping and modeling with ROTHC. Soil Biol. Biochem. 2004, 36, 1739–1750. [Google Scholar] [CrossRef]
  32. Liu, D.L.; Chan, K.Y.; Conyers, M.K.; Li, G.; Poile, G.J. Simulation of soil organic carbon dynamics under different pasture managements using the RothC carbon model. Geoderma 2011, 165, 69–77. [Google Scholar] [CrossRef]
  33. Takahashi, S.; Nakagami, K.; Sakanoue, S.; Itano, S.; Kirita, H. Soil organic carbon storage in grazing pasture converted from forest on Andosol soil. Grassl. Sci. 2007, 53, 210–216. [Google Scholar] [CrossRef]
  34. Hashimoto, S.; Wattenbach, M.; Smith, P. Litter carbon inputs to the mineral soil of Japanese Brown forest soils: Comparing estimates from the RothC model with estimates from MODIS. J. For. Res. 2011, 16, 16–25. [Google Scholar] [CrossRef]
  35. Coleman, K.; Jenkinson, D.S.; Crocker, G.J.; Grace, P.R.; Klír, J.; Körschens, M.; Poulton, P.R.; Richter, D.D. Simulating trends in soil organic carbon in long-term experiments using RothC-26.3. Geoderma 1997, 81, 29–44. [Google Scholar] [CrossRef]
  36. Kutsch, W.L.; Bahn, M.; Heinemeyer, A. Soil Carbon Dynamics: An Integrated Methodology; Cambridge University Press: Cambridge, UK, 2009; ISBN 978-0521865616. [Google Scholar]
  37. Weihermüller, L.; Graf, A.; Herbst, M.; Vereecken, H. Simple pedotransfer functions to initialize reactive carbon pools of the RothC model. Eur. J. Soil Sci. 2013, 64, 567–575. [Google Scholar] [CrossRef]
  38. Carneiro, J.P.; Freixial, R.C.; Pereira, J.S.; Campos, A.C.; Crespo, J.P.; Carneiro, R. Relatório Final do Projecto AGRO 87 (Final Report of the Agro 87 Project, in Portuguese); Lisbon, Portugal, 2005. [Google Scholar]
  39. Rubel, F.; Kottek, M. Observed and projected climate shifts 1901–2100 depicted by world maps of the Köppen-Geiger climate classification. Meteorol. Z. 2010, 19, 135–141. [Google Scholar] [CrossRef]
  40. IPMA Climate Normals. Available online: http://www.ipma.pt/en/index.html (accessed on 18 January 2018).
  41. Barradas, A.M. Efecto de la Mejora de Pastos Naturales en Cuatro Tipos de Suelos Mediterráneos (Spanish); Universidad de Extremadura: Badajoz, Spain, 2009. [Google Scholar]
  42. Pribyl, D.W. A critical review of the conventional SOC to SOM conversion factor. Geoderma 2010, 156, 75–83. [Google Scholar] [CrossRef]
  43. Tóth, G.; Jones, A.; Montanarella, L. The LUCAS topsoil database and derived information on the regional variability of cropland topsoil properties in the European Union. Environ. Monit. Assess. 2013, 185, 7409–7425. [Google Scholar] [CrossRef] [PubMed]
  44. NASA Global Precipitation Analysis. Available online: http://precip.gsfc.nasa.gov/ (accessed on 20 Mar 2018).
  45. LP DAAC. MODIS/Terra Land Surface Temperature and Emissivity Monthly L3 Global 0.05Deg CMG. Available online: https://lpdaac.usgs.gov/dataset_discovery/modis/modis_products_table/mod11c3 (accessed on 20 Mar 2018).
  46. Jebari, A. Estimación de los Cambios en los Stocks de Carbono del Suelo Agrícola a Escala Regional: Impacto de los Usos del Suelo y del Manejo en la Comunidad Autónoma de Aragón. Master Thesis, Bilbao, Spain, 2016. [Google Scholar]
  47. Morais, T.G.; Silva, C.; Jebari, A.; Álvaro-Fuentes, J.; Domingos, T.; Teixeira, R.F.M. A proposal for using process-based soil models for land use Life cycle impact assessment: Application to Alentejo, Portugal. J. Clean. Prod. 2018, 192, 864–876. [Google Scholar] [CrossRef]
  48. Thornthwaite, C.W. An Approach toward a Rational Classification of Climate. Geogr. Rev. 1948, 38, 55. [Google Scholar] [CrossRef]
  49. Spearman, C. The Proof and Measurement of Association between Two Things. Am. J. Psychol. 1904, 72–101. [Google Scholar] [CrossRef]
  50. APA. Portuguese National Inventory Report on Greenhouse Gases, 1990–2018; Portuguese Environmental Agency: Amadora, Portugal, 2018. [Google Scholar]
  51. Román, P.; Martínez, M.M.; Pantoja, A. Farmer’s Compost Handbook—Experiences in Latin America; Food and Agriculture Organization: Rome, Italy, 2015. [Google Scholar]
  52. Gillet, F.; Murisier, B.; Buttler, A.; Gallandat, J.-D.; Gobat, J.-M. Influence of tree cover on the diversity of herbaceous communities in subalpine wooded pastures. Appl. Veg. Sci. 1999, 2, 47–54. [Google Scholar] [CrossRef]
  53. Belsky, A.J. Influences of Trees on Savanna Productivity: Tests of Shade, Nutrients, and Tree-Grass Competition. Ecology 1994, 75, 922–932. [Google Scholar] [CrossRef]
  54. Bell, D.T.; Johnson, F.L.; Gilmore, A.R. Dynamics of Litter Fall, Decomposition, and Incorporation in the Streamside Forest Ecosystem. Oikos 1978, 30, 76. [Google Scholar] [CrossRef]
  55. Parton, W.J.; Schimel, D.S.; Cole, C.V.; Ojima, D.S. Analysis of Factors Controlling Soil Organic Matter Levels in Great Plains Grasslands. Soil Sci. Soc. Am. J. 1987, 51, 1173–1179. [Google Scholar] [CrossRef]
  56. Garay, A.H.; Sollenberger, L.E.; McDonald, D.C.; Ruegsegger, G.J.; Kalmbacher, R.S.; Mislevy, P. Nitrogen Fertilization and Stocking Rate Affect Stargrass Pasture and Cattle Performance. Crop Sci. 2004, 44, 1348. [Google Scholar] [CrossRef]
  57. Derner, J.D.; Hart, R.H. Grazing-Induced Modifications to Peak Standing Crop in Northern Mixed-grass Prairie. Rangel. Ecol. Manag. 2007, 60, 270–276. [Google Scholar] [CrossRef]
  58. Schönbach, P.; Wan, H.; Schiborra, A.; Gierus, M.; Bai, Y.; Müller, K.; Glindemann, T.; Wang, C.; Susenbeth, A.; Taube, F. Short-term management and stocking rate effects of grazing sheep on herbage quality and productivity of Inner Mongolia steppe. Crop Pasture Sci. 2009, 60, 963. [Google Scholar] [CrossRef]
  59. National Research Council (NRC). Nutrient Requirements of Beef Cattle, 7th ed.; Press, N.A., Ed.; National Research Council: Washington, DC, USA, 2000. [Google Scholar]
  60. Gadberry, S. Beef Cattle Nutrition Series Part 3: Nutrient Requirement Tables; University of Arkansas Division of Agriculture: Little Rock, AR, USA, 1996. [Google Scholar]
  61. Matt Hersom Basic Nutrient Requirements of Beef Cows. Available online: http://edis.ifas.ufl.edu/an190 (accessed on 15 November 2018).
  62. Kirkpatrick, D.E.; Steen, R.W.J.; Unsworth, E.F. The effect of differing forage:concentrate ratio and restricting feed intake on the energy and nitrogen utilization by beef cattle. Livest. Prod. Sci. 1997, 51, 151–164. [Google Scholar] [CrossRef]
  63. Yan, T.; Agnew, R.; Gordon, F.; Porter, M. Prediction of methane energy output in dairy and beef cattle offered grass silage-based diets. Livest. Prod. Sci. 2000, 64, 253–263. [Google Scholar] [CrossRef]
  64. Simionesei, L.; Ramos, T.; Oliveira, A.; Jongen, M.; Darouich, H.; Weber, K.; Proença, V.; Domingos, T.; Neves, R. Modeling Soil Water Dynamics and Pasture Growth in the Montado Ecosystem Using MOHID Land. Water 2018, 10, 489. [Google Scholar] [CrossRef]
  65. Trancoso, A.R.; Braunschweig, F.; Chambel Leitão, P.; Obermann, M.; Neves, R. An advanced modelling tool for simulating complex river systems. Sci. Total Environ. 2009, 407, 3004–3016. [Google Scholar] [CrossRef] [PubMed]
  66. Catchpole, W.R.; Wheeler, C.J. Estimating plant biomass: A review of techniques. Aust. J. Ecol. 1992, 17, 121–131. [Google Scholar] [CrossRef]
  67. Sinha, S.; Jeganathan, C.; Sharma, L.K.; Nathawat, M.S. A review of radar remote sensing for biomass estimation. Int. J. Environ. Sci. Technol. 2015, 12, 1779–1792. [Google Scholar] [CrossRef] [Green Version]
  68. UNFCCC. Measurements for Estimation of Carbon Stocks in Afforestation and Reforestation Project Activities under the Clean Development Mechanism: A Field Manual; United Nations Climate Change Secretariat (UNFCCC): Bonn, Germany, 2015. [Google Scholar]
  69. Flombaum, P.; Sala, O.E. A non-destructive and rapid method to estimate biomass and aboveground net primary production in arid environments. J. Arid Environ. 2007, 69, 352–358. [Google Scholar] [CrossRef]
  70. Shoko, C.; Mutanga, O.; Dube, T. Determining Optimal New Generation Satellite Derived Metrics for Accurate C3 and C4 Grass Species Aboveground Biomass Estimation in South Africa. Remote Sens. 2018, 10, 564. [Google Scholar] [CrossRef]
  71. Purevdorj, T.; Tateishi, R.; Ishiyama, T.; Honda, Y. Relationships between percent vegetation cover and vegetation indices. Int. J. Remote Sens. 1998, 19, 3519–3535. [Google Scholar] [CrossRef]
  72. Rochon, J.J.; Doyle, C.J.; Greef, J.M.; Hopkins, A.; Molle, G.; Sitzia, M.; Scholefield, D.; Smith, C.J. Grazing legumes in Europe: A review of their status, management, benefits, research needs and future prospects. Grass Forage Sci. 2004, 59, 197–214. [Google Scholar] [CrossRef]
  73. Davidson, R.L. Effects of Soil Nutrients and Moisture on Root/Shoot Ratios in Lolium perenne L. and Trifolium repens L. Ann. Bot. 1969, 33, 571–577. [Google Scholar] [CrossRef]
  74. Kiaer, L.P.; Weisbach, A.N.; Weiner, J. Root and shoot competition: A meta-analysis. J. Ecol. 2013, 101, 1298–1312. [Google Scholar] [CrossRef]
  75. Ledgard, S.F. Nitrogen cycling in low input legume-based agriculture, with emphasis on legume/grass pastures. Plant Soil 2001, 228, 43–59. [Google Scholar] [CrossRef]
  76. Selbie, D.R.; Buckthought, L.E.; Shepherd, M.A. The Challenge of the Urine Patch for Managing Nitrogen in Grazed Pasture Systems. Adv. Agron. 2015, 129, 229–292. [Google Scholar] [CrossRef]
  77. Cameron, K.C.; Di, H.J.; Moir, J.L. Nitrogen losses from the soil/plant system: A review. Ann. Appl. Biol. 2013, 162, 145–173. [Google Scholar] [CrossRef]
  78. Guo, R.; Li, G.; Jiang, T.; Schuchardt, F.; Chen, T.; Zhao, Y.; Shen, Y. Effect of aeration rate, C/N ratio and moisture content on the stability and maturity of compost. Bioresour. Technol. 2012, 112, 171–178. [Google Scholar] [CrossRef] [PubMed]
  79. Leip, A.; Weiss, F.; Wassenaar, T.; Perez, I.; Fellmann, T.; Loudjani, P.; Tubiello, F.; Grandgirard, D.; Monni, S.; Biala, K. Evaluation of the Livestock Sector’s Contribution to the EU Greenhouse Gas Emissions (GGELS)—Final Report; European Commission, Joint Research Centre: Ispra, Italy, 2010. [Google Scholar]
  80. Garnett, T. Livestock-related greenhouse gas emissions: Impacts and options for policy makers. Environ. Sci. Policy 2009, 12, 491–503. [Google Scholar] [CrossRef]
  81. Steinfeld, H.; Gerber, P.; Wassenaar, T.; Castel, V.; Rosales, M.; de Haan, C. Livestock’s Long Shadow: Environmental Issues and Options; Food and Agriculture Organization of the United Nations (FAO): Rome, Italy, 2006. [Google Scholar]
  82. Shah, G.A.; Groot, J.C.J.; Shah, G.M.; Lantinga, E.A. Simulation of Long-Term Carbon and Nitrogen Dynamics in Grassland-Based Dairy Farming Systems to Evaluate Mitigation Strategies for Nutrient Losses. PLoS ONE 2013, 8, e67279. [Google Scholar] [CrossRef] [PubMed]
  83. Marschner, P.; Rengel, Z. Nutrient Cycling in Terrestrial Ecosystems; Springer: Berlin, Germany, 2007; ISBN 9783540680277. [Google Scholar]
  84. Teixeira, R.F.M.; Barão, L.; Morais, T.G.; Domingos, T. “BalSim”: A carbon, nitrogen and greenhouse gas mass balance model for pastures. Sustainability 2018, in press. [Google Scholar]
  85. Schlapfer, F.; Schmid, B. Ecosystem Effects of Biodiversity: A Classification of Hypotheses and Exploration of Empirical Results. Ecol. Appl. 1999, 9, 1–25. [Google Scholar] [CrossRef]
  86. Cederberg, C.; Stadig, M. System expansion and allocation in life cycle assessment of milk and beef production. Int. J. Life Cycle Assess. 2003, 8, 350–356. [Google Scholar] [CrossRef]
  87. Casey, J.W.W.; Holden, N.M.M. Quantification of GHG emissions from sucker-beef production in Ireland. Agric. Syst. 2006, 90, 79–98. [Google Scholar] [CrossRef]
  88. Ogino, A.; Kaku, K.; Osada, T.; Shimada, K.; Ogino, A.; Kaku, K.; Osada, T.; Shimada, K. Environmental impacts of the Japanese beef-fattening system with different feeding lengths as evaluated by a life-cycle assessment method. J. Anim. Sci. 2004, 82, 2115–2122. [Google Scholar] [CrossRef] [PubMed]
  89. Morais, T.G.; Teixeira, R.F.M.; Rodrigues, N.R.; Domingos, T. Carbon footprint of milk from pasture-based dairy farms in Azores, Portugal. Sustainability 2018, 10, 3658. [Google Scholar] [CrossRef]
  90. Van Kernebeek, H.R.J.; Oosting, S.J.; Feskens, E.J.M.; Gerber, P.J.; De Boer, I.J.M. The effect of nutritional quality on comparing environmental impacts of human diets. J. Clean. Prod. 2014, 73, 88–99. [Google Scholar] [CrossRef]
  91. Tilman, D.; Clark, M. Global diets link environmental sustainability and human health. Nature 2014, 515, 518–522. [Google Scholar] [CrossRef] [PubMed]
  92. Teixeira, R.F.M.; Domingos, T.; Costa, A.P.S.V.; Oliveira, R.; Farropas, L.; Calouro, F.; Barradas, A.M.; Carneiro, J.P.B.G. The dynamics of soil organic matter accumulation in Portuguese grasslands soils. Options Méditerranéennes Sustainable Mediterranean Grasslands and Their Multi-Functions 2008, A, 41–44. [Google Scholar]
  93. Teixeira, R.F.M.; Morais, T.G.; Domingos, T. A Practical Comparison of Regionalized Land Use and Biodiversity Life Cycle Impact Assessment Models Using Livestock Production as a Case Study. Sustainability 2018, 10, 4089. [Google Scholar] [CrossRef]
  94. Witt, G.B.; Noël, M.V.; Bird, M.I.; Beeton, R.J.S.; Menzies, N.W. Carbon sequestration and biodiversity restoration potential of semi-arid mulga lands of Australia interpreted from long-term grazing exclosures. Agric. Ecosyst. Environ. 2011, 141, 108–118. [Google Scholar] [CrossRef]
Figure 1. Graphical representation of the optimization process.
Sustainability 10 04437 g001
Figure 2. Map of Portugal, with the indication of the sampling sites of AGRO 87 (farms 1–6), AGRO 71 (farms 7 and 8), and EDP project (6, 9–13).
Sustainability 10 04437 g002
Figure 3. Estimated parameters for SBP and animal management practices parameters as function of the loss function value per iteration. (a) Root to shoot ratio; (b) Livestock intake per livestock unit; (c) Livestock dung per livestock unit; (d) DPM/RPM ratio. The run with the lowest loss function value is represented in red. DPM—easily decomposable plant material, RPM—resistant plant material.
Sustainability 10 04437 g003
Figure 4. Estimated parameters for sown biodiverse permanent pastures rich in legumes: animal management parameters as a function of the initial parameters per iteration. (a) Root to shoot ratio; (b) Livestock intake per livestock unit; (c) Livestock dung per livestock unit; (d) DPM/RPM ratio. The run with lower loss function value is represented in red. DPM—easily decomposable plant material, RPM—resistant plant material.
Sustainability 10 04437 g004
Figure 5. Soil organic carbon stock field measured and estimated in the run which leads to lower loss function value for AGRO 78 and AGRO 87 farms, using field measured SOC stock in 2001 as initial SOC stock. In 2001 there are no estimated SOC stocks. (a) Farm 1; (b) Farm 2; (c) Farm 3; and (d) Farm 4; (e) Farm 5; (f) Farm 6; (g) Farm 7; (h) Farm 8.
Sustainability 10 04437 g005
Figure 6. Application of the model to the EDP project dataset. (a) Measured soil organic carbon stock versus estimated soil organic carbon stock, for the lowest loss function value and for two linear regression fits: (1) no intercept, and (2) with intercept; (b) stocking rate versus aboveground productivity per farm. AGP—Aboveground productivity; DM—Dry matter; LU—Livestock Unit; SOC—Soil organic carbon.
Sustainability 10 04437 g006
Table 1. Summary information for each farm in Figure 2, including the project, period covered, measured data, temperature and precipitation.
FarmProjectProduction YearsMeasured DataMean Annual Temperature (°C)Mean Annual Precipitation (mm)
Farm 1AGRO 874 years (2001–2005)
  • Soil organic matter 1
  • Aboveground productivity 2
  • Stocking rate 3
18523
Farm 220471
Farm 318538
Farm 418494
Farm 519473
Farm 6AGRO 87 and EDP9 years (2001–2005; 2006–2011)
  • Soil organic matter (both periods) 1
  • Aboveground productivity (only for 2001–2005) 2
  • Stocking rate (only for 2001–2005) 3
17841
Farm 7AGRO 713 years (2001–2004)
  • Soil organic matter
19583
Farm 821495
Farm 9EDP5 years (2007–2012)18899
Farm 104 years (2007–2011)18593
Farm 1119593
Farm 123 years (2008–2011)20602
Farm 133 years (2008–2011)18596
1 Data interpolated in 2002 for farms 1, 2, 5 and 6, and in 2001 for farm 3 in Teixeira et al. [22].; 2 Yield data missing in 2001–2002 in farm 3, in 2004–2005 in farms 5 and 6; and for the entire period in farms 7 and 8.; 3 Stocking rate data missing in 2001–2002 in farms 4 and 5, in 2004–2005 in farms 5 and 6; and for the entire period in farms 1, 7 and 8.
Table 2. Aboveground productivity and stocking rate obtained in the model application for EDP farms. DM—Dry matter, LU—Livestock unit.
FarmYearAboveground Productivity (t DM/ha.yr)Stocking Rate (LU/ha)
Farm 62006–20071.60.43
2007–20081.80.48
2008–20091.50.41
2009–20101.80.50
2010–20113.00.64
Farm 92007–20081.00.20
2008–20091.00.21
2009–20101.10.22
2010–20111.00.21
2011–20121.20.25
Farm 102007–20081.40.36
2008–20091.30.31
2009–20101.30.32
2010–20111.90.48
Farm 112007–20084.31.17
2008–20092.90.87
2009–20102.90.76
2010–20112.20.61
Farm 122008–20091.90.52
2009–20102.00.57
2010–20112.50.69
Farm 132008–20093.30.81
2009–20102.40.71
2010–20112.50.78

