Urban Spatial Interaction Analysis Using Inter-City Transport Big Data: A Case Study of the Yangtze River Delta Urban Agglomeration of China


1
Global Institute for Urban and Regional Sustainability, Shanghai Key Lab for Urban Ecological Processes and Eco-Restoration, School of Ecological and Environmental Sciences, East China Normal University, Dongchuan Road 500, Shanghai 200241, China
2
Institute of Eco-Chongming, 3663 N. Zhongshan Rd., Shanghai 200062, China
3
School of Ecological and Environmental Sciences, East China Normal University, Dongchuan Road 500, Shanghai 200241, China
*
Author to whom correspondence should be addressed.
Sustainability 2018, 10(12), 4459; https://doi.org/10.3390/su10124459
Submission received: 25 October 2018
/
Revised: 22 November 2018
/
Accepted: 26 November 2018
/
Published: 28 November 2018
(This article belongs to the Special Issue Building Regional Sustainability in Urban Agglomeration: Theories, Methodologies, and Applications)
Abstract
:A better understanding of the urban spatial interaction is important for optimizing the spatial structure and layout of urban agglomeration (UA). We develop a crawler program to compile online big data for urban spatial interaction analysis. Differing from the previous studies, vectorial, realistic, and high spatiotemporal resolution inter-city, bus-passenger-flow big data instead of statistical and modeled data are used for urban spatial interaction analysis. The Yangtze River Delta (YRD) is selected as a case study region to test the big data approach and to gain insights into the cities’ interaction in China’s largest UA. The results testified the superiorities of the big-data method over the traditional gravity model, confirmed some phenomena discussed or mentioned in the literature and regional plans regarding the urban interaction in YRD, derived policy implications for enhancing the sustainability of UA, and suggested some potentials for improving the limitations of the big-data method.
1. Introduction
Cities are exchanging various flows such as material, energy, information, transportation, and migration with each [1]. This phenomenon is called urban spatial interaction, through which cities are connected with each other and integrate as a closely related city network system (namely urban agglomeration, UA) [2]. Since UA is recognized as having a stronger ability in aggregating population, capital, and resources compared to a single city [3,4], it is acknowledged as the new power engine in regional development [5,6]. The urban spatial interaction is an important driving force that determines the dynamic growth and the economic performance of UA [7,8]. The understanding of the spatial interaction among cities will help to strengthen the functional linkage within UA, optimize the spatial layout of industries, promote the competitiveness of UA, and provide policy implications for regional sustainable development.
Since the early 20th century, socioeconomic indicators, such as gross domestic product (GDP), population, and the unemployment rate, have been widely used in assessing the city’s performance [9,10]. A great number of studies have been conducted on the theories and modeling of the urban spatial interaction based on the socioeconomic data and indicators. For example, Zipf first introduced Newton’s law of gravity into an urban study and built a theoretical basis for urban spatial interaction research [11]. Converse developed a breaking-point model on the basis of Reilly’s law of retail gravitation to determine the urban attractive range and classify the economic zone [12]. Taylor proposed a concept of “world city network”, which provided a new angle for an urban interaction study and expanded the previous single-city dominated analysis to a city-network investigation [13]. After this, the urban spatial interaction studies attracted much attention from both scholars and policymakers [14,15,16,17,18]. The research focuses also covered a wide range of fields, such as inter-city trade, transportation, information, tourism, and logistics [19,20,21,22,23].
Recently, with the popularization of the smart city initiatives [24], cities intend to expand the overwhelming usage of socioeconomic data and indicators to big data, which is usually the real-time data captured predominately through sensors, cameras, and social and locative media [25]. Due to the features of real-time, detailed information about city performance, relatively closed in nature, etc., a number of cities are tending to open the big data to the public and increasingly inviting citizen’s participation in urban planning and management through the communication and development of city dashboards [26,27,28]. Regarding the assessment of the urban spatial interaction, among the diverse methods and models, social network analytics (SNA) is recognized as an effective and quantitative measurement of the hierarchical structure and the spatial interaction within UA, since it can clearly reflect the correlations between cities [29]. SNA is the process of investigating social structures through the use of networks and graph theory. It characterizes networked structures in terms of nodes and the interactions that connect them. It has emerged as an important analytical tool in modern sociology and has been applied in many other disciplines such as biology, economics, and geography. The data used for SNA also covered a wide range including the traditional socioeconomic indicators (such as GDP and population), internet-based social media (e.g., Facebook), and any data that can reflect the interactions (such as transport and money flows). However, deficiencies still exist in measuring the above-mentioned interactions. Taking one of the widely used social network analytics, the gravity model, as an example, it basically uses the unit sizes (often using GDP or population) and distance to estimate the flows between two units so as to analyze the interactions. Various studies have been conducted to fit gravity model’s distance friction function [30,31], quantify and visualize urban spatial interaction [32,33], and to project the future human or transport mobility trend [34,35]. However, the main deficiencies may include the following three aspects. First, the interaction between two cities is usually defined as a scalar rather than a vector, which means the attraction of one city to another will not change when the roles of these two cities are reversed [36]. The results derived from the gravity model may sometimes be contrary to the reality and it’s also easy to find a counterexample in which the population leaving a small city to go to a core city in UA will be much larger than the backward population. Second, the interactions are analyzed based on the modeled flows between two units rather than the real flows (such as population flow, trade flow, and traffic flow) that occurred, which may deviate from the reality. Third, due to the data availability, the gravity model usually relies heavily on the statistical data that are published by the government. Both the time and space resolutions are low. Taking Chinese cities as an example, all the city-level statistical data (such as GDP, population, and urban population) are published and renewed once a year. And the real terrain and transport conditions between cities are neglected. As an alternative, Euclidean distance is used due to its easy calculation but would also cause errors. Evidently, these deficiencies form an obstacle for our in-depth understanding and investigation of the interaction between cites in UA. New methods and data are increasingly needed to address the challenges.
Fortunately, with the development of big data science and techniques, it offers us a possible solution to the above-mentioned problems. The recent example includes the investigation of inter-urban mobility and interaction strength in China through the social media website check-in data provided by a location-based social network service provider [37]. The spatial network analysis is based on the global flight big data [38], telephone communication big data [39], and taxi track big data [40]. Big data on the inter-city passenger flow including the flow direction, date, and passenger number with a high time resolution (hourly interval) are compiled from a bus ticket booking website to support the urban spatial interaction analysis. Several interaction measurement indices that are commonly adopted in social network analytics are employed in this study to quantitatively explore the intensity, structure, and spatial interaction of UA. The Yangtze River Delta (YRD) urban agglomeration in China is chosen as a case study region to test the spatially explicit approach and big dataset and to gain insights into the urban spatial interaction in China’s UA.
The remainder of this paper is organized as follows. Section 2 introduces the study area. Section 3 describes the materials and methods for collecting the passenger-flow data and the social network analytics. Section 4 interprets the results and discusses the research limitations and potential improvements. The last section summarizes the major findings.
2. Study Area
The Yangtze River Delta (YRD) urban agglomeration, as shown in Figure 1, is located in the eastern region of China, which includes three jurisdiction units, i.e., Shanghai municipality, Jiangsu province, and Zhejiang province. Within the YRD UA, there are 25 cities in total, which are Shanghai, Nanjing (the capital of Jiangsu province), Hangzhou (the capital of Zhejiang province) and 22 prefecture-level cities (Wuxi, Xuzhou, Changzhou, Suzhou, Nantong, Lianyungang, Huaian, Yanchen, Yangzhou, Zhenjiang, Taizhou, Suqian, Ningbo, Wenzhou, Shaoxing, Huzhou, Jiaxing, Jinhua, Quzhou, Taizhou, Jiaxing, and Lishui). YRD UA is the 6th largest UA in the world and the biggest in China, which plays a significant role in the national and regional development of China. In 2016, the urban population and GDP of the YRD UA was 159 million and 15 trillion Chinese Yuan, respectively, accounting for 11.5% and 20.5% of China’s total. However, it only occupies 2.3% (219 thousand km2) of China’s territory. In the future, the YRD UA has an ambitious urbanization plan to raise its urban population share to 72% by 2020, and to build world-class industrial, innovation, and urban clusters with a global impact (NDRC, 2010). It would be even more necessary to have insights into the urban spatial interaction in China’s largest UA in order to generate policy implications for the realization of its ultimate goals, and to provide experiences for other UAs regarding their sustainable development.
3. Materials and Methods
3.1. Materials
In this paper, inter-city passenger flow was adopted to measure the urban spatial interaction in UA. Instead of using the traditional statistical data, we compiled the bus passenger-flow data from an online bus ticket booking website, namely “Bus Steward” [41] using R language programming. As “Bus Steward” is one of the strategic partners of the China Road Transportation Association, which has close co-operation with many city-level transportation companies in YRD UA, it is believed that the passenger-flow data are the most detailed and reliable in YRD. With the help of R studio, especially its package “httr” and “xml2”, a crawler program is developed to obtain the enormous long-term ticket information automatically from the “Bus Steward” website. In this study, over 270,000 pieces of ticket information in an hourly interval covering the whole month of June 2018 were obtained. They include the origin and destination station name, coach type, departure time, and remaining ticket numbers for each seat class. Table 1 shows some examples of the online collected data. Data of Lianyungang and Taizhou were failed to be obtained due to the website database structure problem. The pseudocode of the developed crawler program can be found in Appendix A. The R program code, input data, and readme file have also been uploaded in an online repository, GitHub, so that the crawler program can be accessed freely and implemented by the readers.
3.2. Methods for Urban Spatial Interaction Analysis
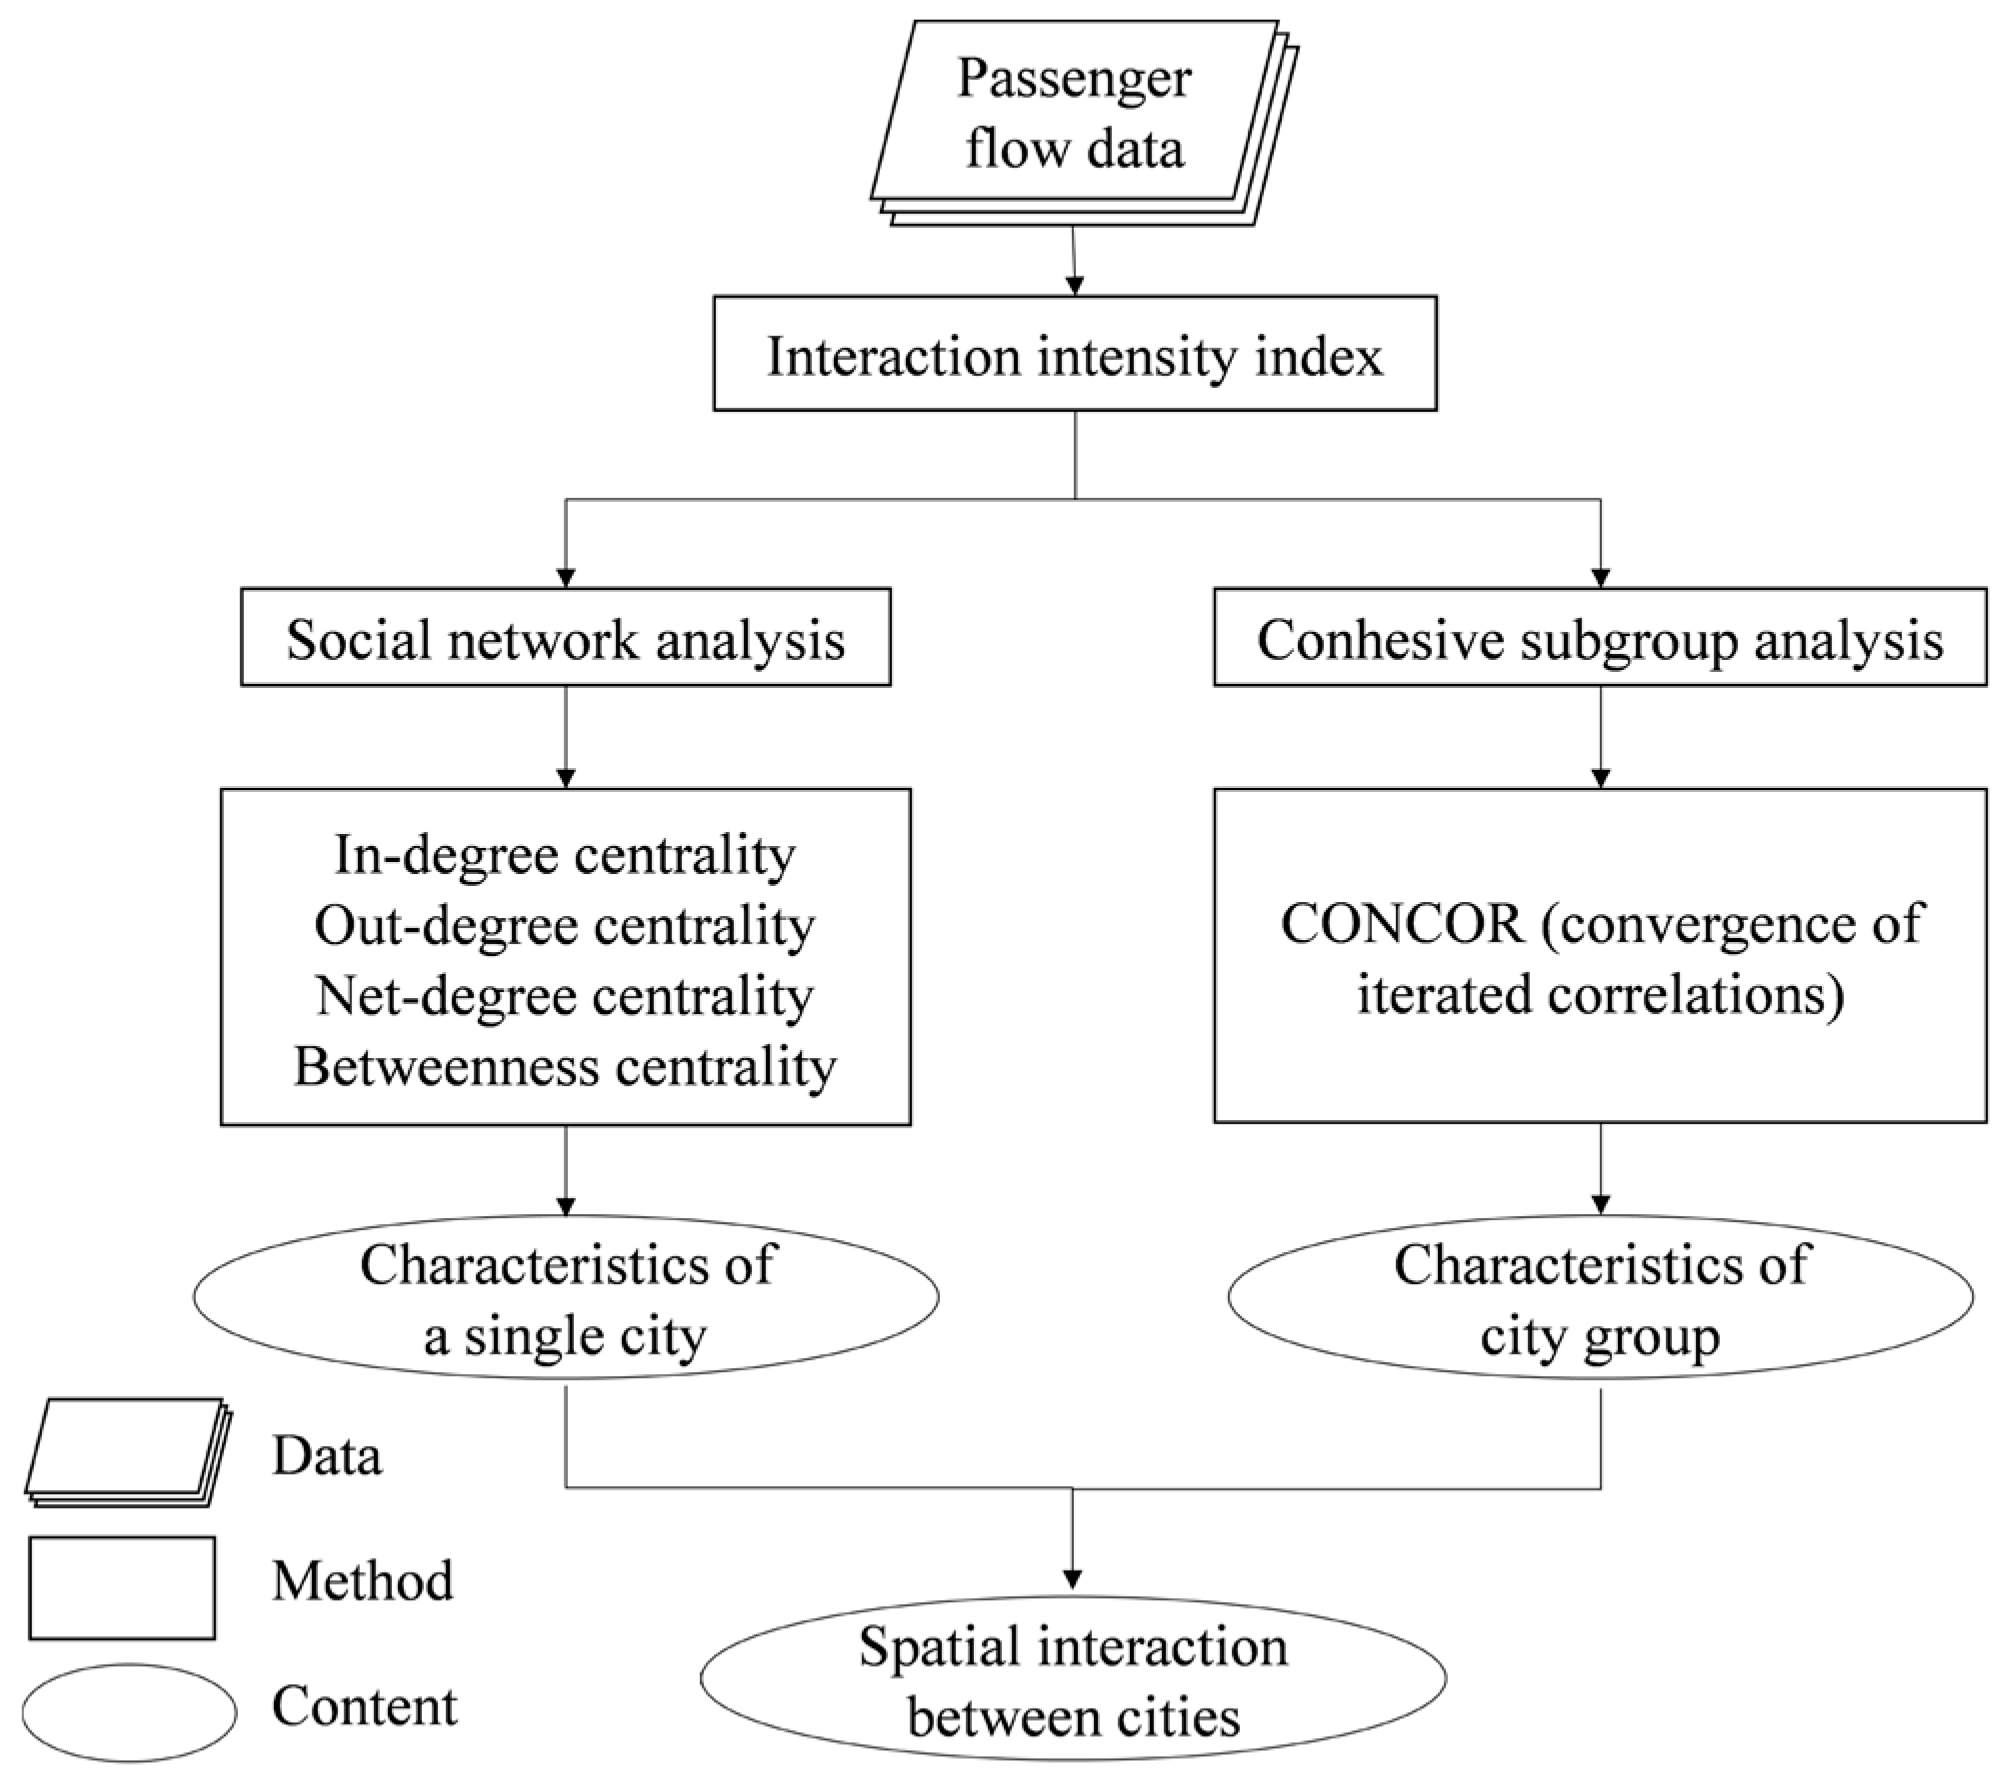
Basically, the urban spatial interaction between cities can be evaluated based on two aspects. One is the characteristics of a single city, the other is the characteristics of the city group. Some widely used indices, such as interaction intensity, degree and betweenness centrality, and convergence of iterated correlations (CONCOR) are adopted in this paper to quantify these characteristics. The flowchart is shown in Figure 2, and the details about each index are described as follows.
3.2.1. Interaction Intensity Index
The interaction intensity index is used to measure how strongly connected two cities are and is defined by Equation (1)
where I(i,j) is the interaction intensity between city i and j, Pij is the number of passengers depart from city i to j, and Pji is the number of passengers depart from city j to i.
3.2.2. Degree Centrality and Betweenness Centrality Index
Degree centrality means the number and intensity of links incident upon a node. To make a better use of the vectorial passenger-flow data, three specific degree centrality indices are defined. They are in-degree centrality, out-degree centrality, and net-degree centrality, which are represented by the number of passengers who move into the city, leave for other cities, and their net changes. It’s easy to understand that cities with a higher in-degree centrality are more attractive than the cities with lower in-degree centrality. Correspondingly, the larger value of out-degree centrality means a city is less attractive.
where CDi(i) is the in-degree centrality of city i, Pji is the number of passengers who depart from city j to city i, n is the total number of cities in YRD UA.
where CDo(i) is the out-degree centrality of city i, Pij is the number of passengers who depart from city i to city j, n is the total number of cities in YRD UA.
Net-degree centrality CDn(i) is defined in Equation (4) to indicate the net change of degree centrality.
In addition to degree centrality, betweenness centrality, as defined in Equation (5), is used to represent the degree of which nodes stand between each other. It highlights the values of a node served as an intermediary. For example, a city with higher betweenness centrality in a UA would have more influence on the whole area because more information, population, and resources will pass through that node.
where σst is the total number of shortest paths from city s to city t and σst(v) is the number of those paths that pass through city v, V is the universal set of all the cities.
All the above centrality indexes are calculated by the software (UCIENT 6) developed by Roberta Chase and Steve Borgatti [42] and are normalized between 0 and 1 to make the value comparable.
3.2.3. CONCOR Index
A cohesive subgroup is described as a subgroup that consists of several members, which have a relatively strong, direct, close, and positive relationship [43]. City network cohesive subgroup analysis can reveal the structure inside a UA in order to measure the number of cohesive subgroups and their group members, which could describe the development state of UA. In this study, we discuss the subgroup aggregation phenomenon in YRD UA according to the interaction intensity between two cities to reflect the relationship between different cities and reveal the spatial structure of UA cities.
CONCOR (the convergence of iterated correlations) index is used to identify the cohesive subgroup in this study. CONCOR starts from a first correlation matrix C1, as shown in Equation (6).
where aij is the normalized number of passengers who depart from city i to city j.
The Pearson correlation coefficient of every row and column is calculated to produce a new correlation matrix, C2. Then, the procedure is repeated until the result ends up with a matrix whose entries take one of two values: 1 or −1. The final matrix can be permuted to produce blocks of 1 s and −1 s, with each block representing a group of structurally equivalent actors. Finally, a tree diagram is used to reveal the structure of each subgroup and shows all the subgroup members. In addition, the progress mentioned above is also performed in UCIENT 6.
3.3. Comparison with Gravity Model
In order to find out the difference between our big-data-based method and the traditional statistical-data-based SNA, we performed the Gravity model for comparison. As shown in Equation (7), the population was used to represent the scale of each city and the interaction of each city is defined as follows.
where Iij is the interaction intensity between city i and city j. Popi is the population of city i, Popj is the population of city j. Dij is the Euclidean distance between city i and city j.
4. Results
4.1. Interaction Intensity between Cities
Figure 3a presents the interaction intensity of cities in YRD UA. Generally, the value of interaction intensity between cities is not even in this region. Higher interaction could be observed mainly in the middle and south of Jiangsu province and the north of Zhejiang province. Cities in South Zhejiang province show a weak interaction with other cities, which may due to the inconvenient transport caused by the vast mountain terrain there.
Shanghai is the core city of YRD UA as it holds the most intensive interaction with other cities and has a larger radiation radius, see Figure 3b. In total, 12 out of 24 cities have a strong interaction with Shanghai with interaction intensity values all above 0.19. The interaction intensity of Shanghai is 5.775. It is much higher than the 2nd (Nanjing, 5.123) and 3rd city (Taizhou, 3.901). As shown in Figure 3c, Nanjing, the capital city of Jiangsu province, has a significant impact on the cities in the Northern Jiangsu province such as Suqian, Huaian, and Yancheng. While cities in the Eastern Jiangsu province have a stronger interaction with Shanghai. It is also observed that cities that are located between Nanjing and Shanghai (such as Changzhou, Zhenjiang, Wuxi, Suzhou, Nantong, and Taizhou) have strong interactions between each other and tend to form an organic whole. In contrast to Jiangsu and Shanghai, the interaction intensity of cities in Zhejiang province is relatively weaker. Hangzhou is still the central city, which serves as the intermediary to connect cities within Zhejiang province (such as Shaoxing, Ningbo, and Quzhou) and cities out of Zhejiang (Shanghai and Nantong).
4.2. Degree and betweeness Centrality Of Cities in YRD UA
Figure 4 shows the results of in-degree, out-degree, net-degree, and betweenness centrality of cities in YRD UA. Each index is classified into four grades according to the natural breaking methods [44]. In general, except for Shaoxin and Lishui, all cities in Zhejiang province show a positive net-degree centrality, which means a net passenger inflow. The situation is just the opposite in Jiangsu province as most cities, except for Nanjing and Yangzhou, show a negative net-degree centrality.
Specifically, Nanjing, Yangzhou, and Ningbo were the top three cities with respect to their net-degree centrality, suggesting these cities attract a net inflow of passengers from other cities in YRD UA. Though both the in-degree and out-degree centrality of the largest city in YRD UA (Shanghai) was large, its net-degree centrality was not as high as that of Nanjing, Yangzhou, and Ningbo, which means Shanghai may have less attraction to bus passengers compared to those cities. According to a survey conducted on the trip purposes of passengers along the Beijing–Shanghai corridor (it covers most cities in our study), work, tourism, and visits to friends and relatives are the top three purposes accounting for 99.3% of the total trips [45]. Taking Nanjing as an example, in recent years, especially after 2010, it has witnessed significant growth in its economy and employment opportunities. The mean growth rate of Nanjing’s GDP has been sustained at 10.7% per annum, and its fixed asset investment also increased by 2% per annum, which was among the fastest-growing cities in YRD UA [46]. In addition, Nanjing has provided over 0.2 million new job opportunities in 2017 and it attracts massive population inflows, with the annual growth of net population immigration reaching 50,300 in 2016 [46]. The outstanding performance in economic development and providing job opportunities make Nanjing’s net-degree centrality high. Similar driving factors could also be confirmed in Yangzhou and Ningbo’s cases. These two cities are expected to be the rising cities in future development according to their planning. The Yangzhou government has paid great attention to the innovative business and outstanding talents attractions with the relevant investment reaching 50 billion RMB (China’s monetary unit) in 2018 [47]. Similarly, the Ningbo government has put great emphasis on the national job fairs, which have provided over 1500 job opportunities in 54 enterprises in 2018 [48]. Meanwhile, Nanjing, Yangzhou, and Ningbo are also the top-ranked tourism cities in China and are full of natural and cultural tourism resources. As a result, as observed in Figure 4, the in-degree and net-degree centralities of Yangzhou and Ningbo were relatively higher than most of the other cities. On the contrary, Changzhou and Taizhou show a high value of out-degree centrality, with values of 0.142 and 0.128, respectively. It suggests that these two cities are losing passengers because the net-degree centrality was −0.056 and −0.021, respectively.
When looking at the betweenness centrality of cities in YRD UA, see Figure 4d, it is found that Hangzhou and Yancheng have higher betweenness centrality than the other cities and they tend to be the intermediary cities within YRD UA. The functional orientation set in the master plan [49,50] could explain this phenomenon. Both cities are planning to strengthen their cooperations with other cities in YRD UA to push forward the process of regional integration, which makes them important nodes in the YRD UA’s network.
4.3. Cohesive Subgroups of YRD UA
As shown in Figure 5, cities in YRD UA are divided into four cohesive subgroups. Generally, most of the subgroups consist of the cities geographically close to each other. Nanjing, Zhenjiang, Yangzhou, Huaian, Suqian, and Xuzhou, which are located in the west part of Jiangsu province, interacted more closely regarding their bus passenger flows. Shanghai, together with the cities in Eastern Jiangsu (Yancheng, Taizhou, Nantong, Changzhou, Wuxi, and Suzhou), were more tightly linked with each other. Similarly, cities in Zhejiang province were also divided into the north group (Hangzhou, Shaoxing, Ningbo, Huzhou Zhoushan, and Jiaxing) and south group (Quzhou, Jinhua, Lishui, and Wenzhou). Though the subgrouping results will be affected by the number of sampling cities, the result is consistent with the long-term layout of YRD UA that Nanjing–Shanghai–Hangzhou are planned to be the important node cities in the whole city network. Due to the increasing need to achieve a sustainable and balanced development between economy and environment, Nanjing and Hangzhou are planned to be important centers in regional development to ensure the shift of manufacturing industries from the super megacity, Shanghai [51]. Our cohesive subgrouping confirmed the targeted trend, which suggests the multi-core spatial layout has formed in YRD UA.
5. Discussions
5.1. Comparison with the Traditional Gravity Model
In general, there are two major merits of the big-data-based method that could be found when comparing to the traditional gravity model analysis.
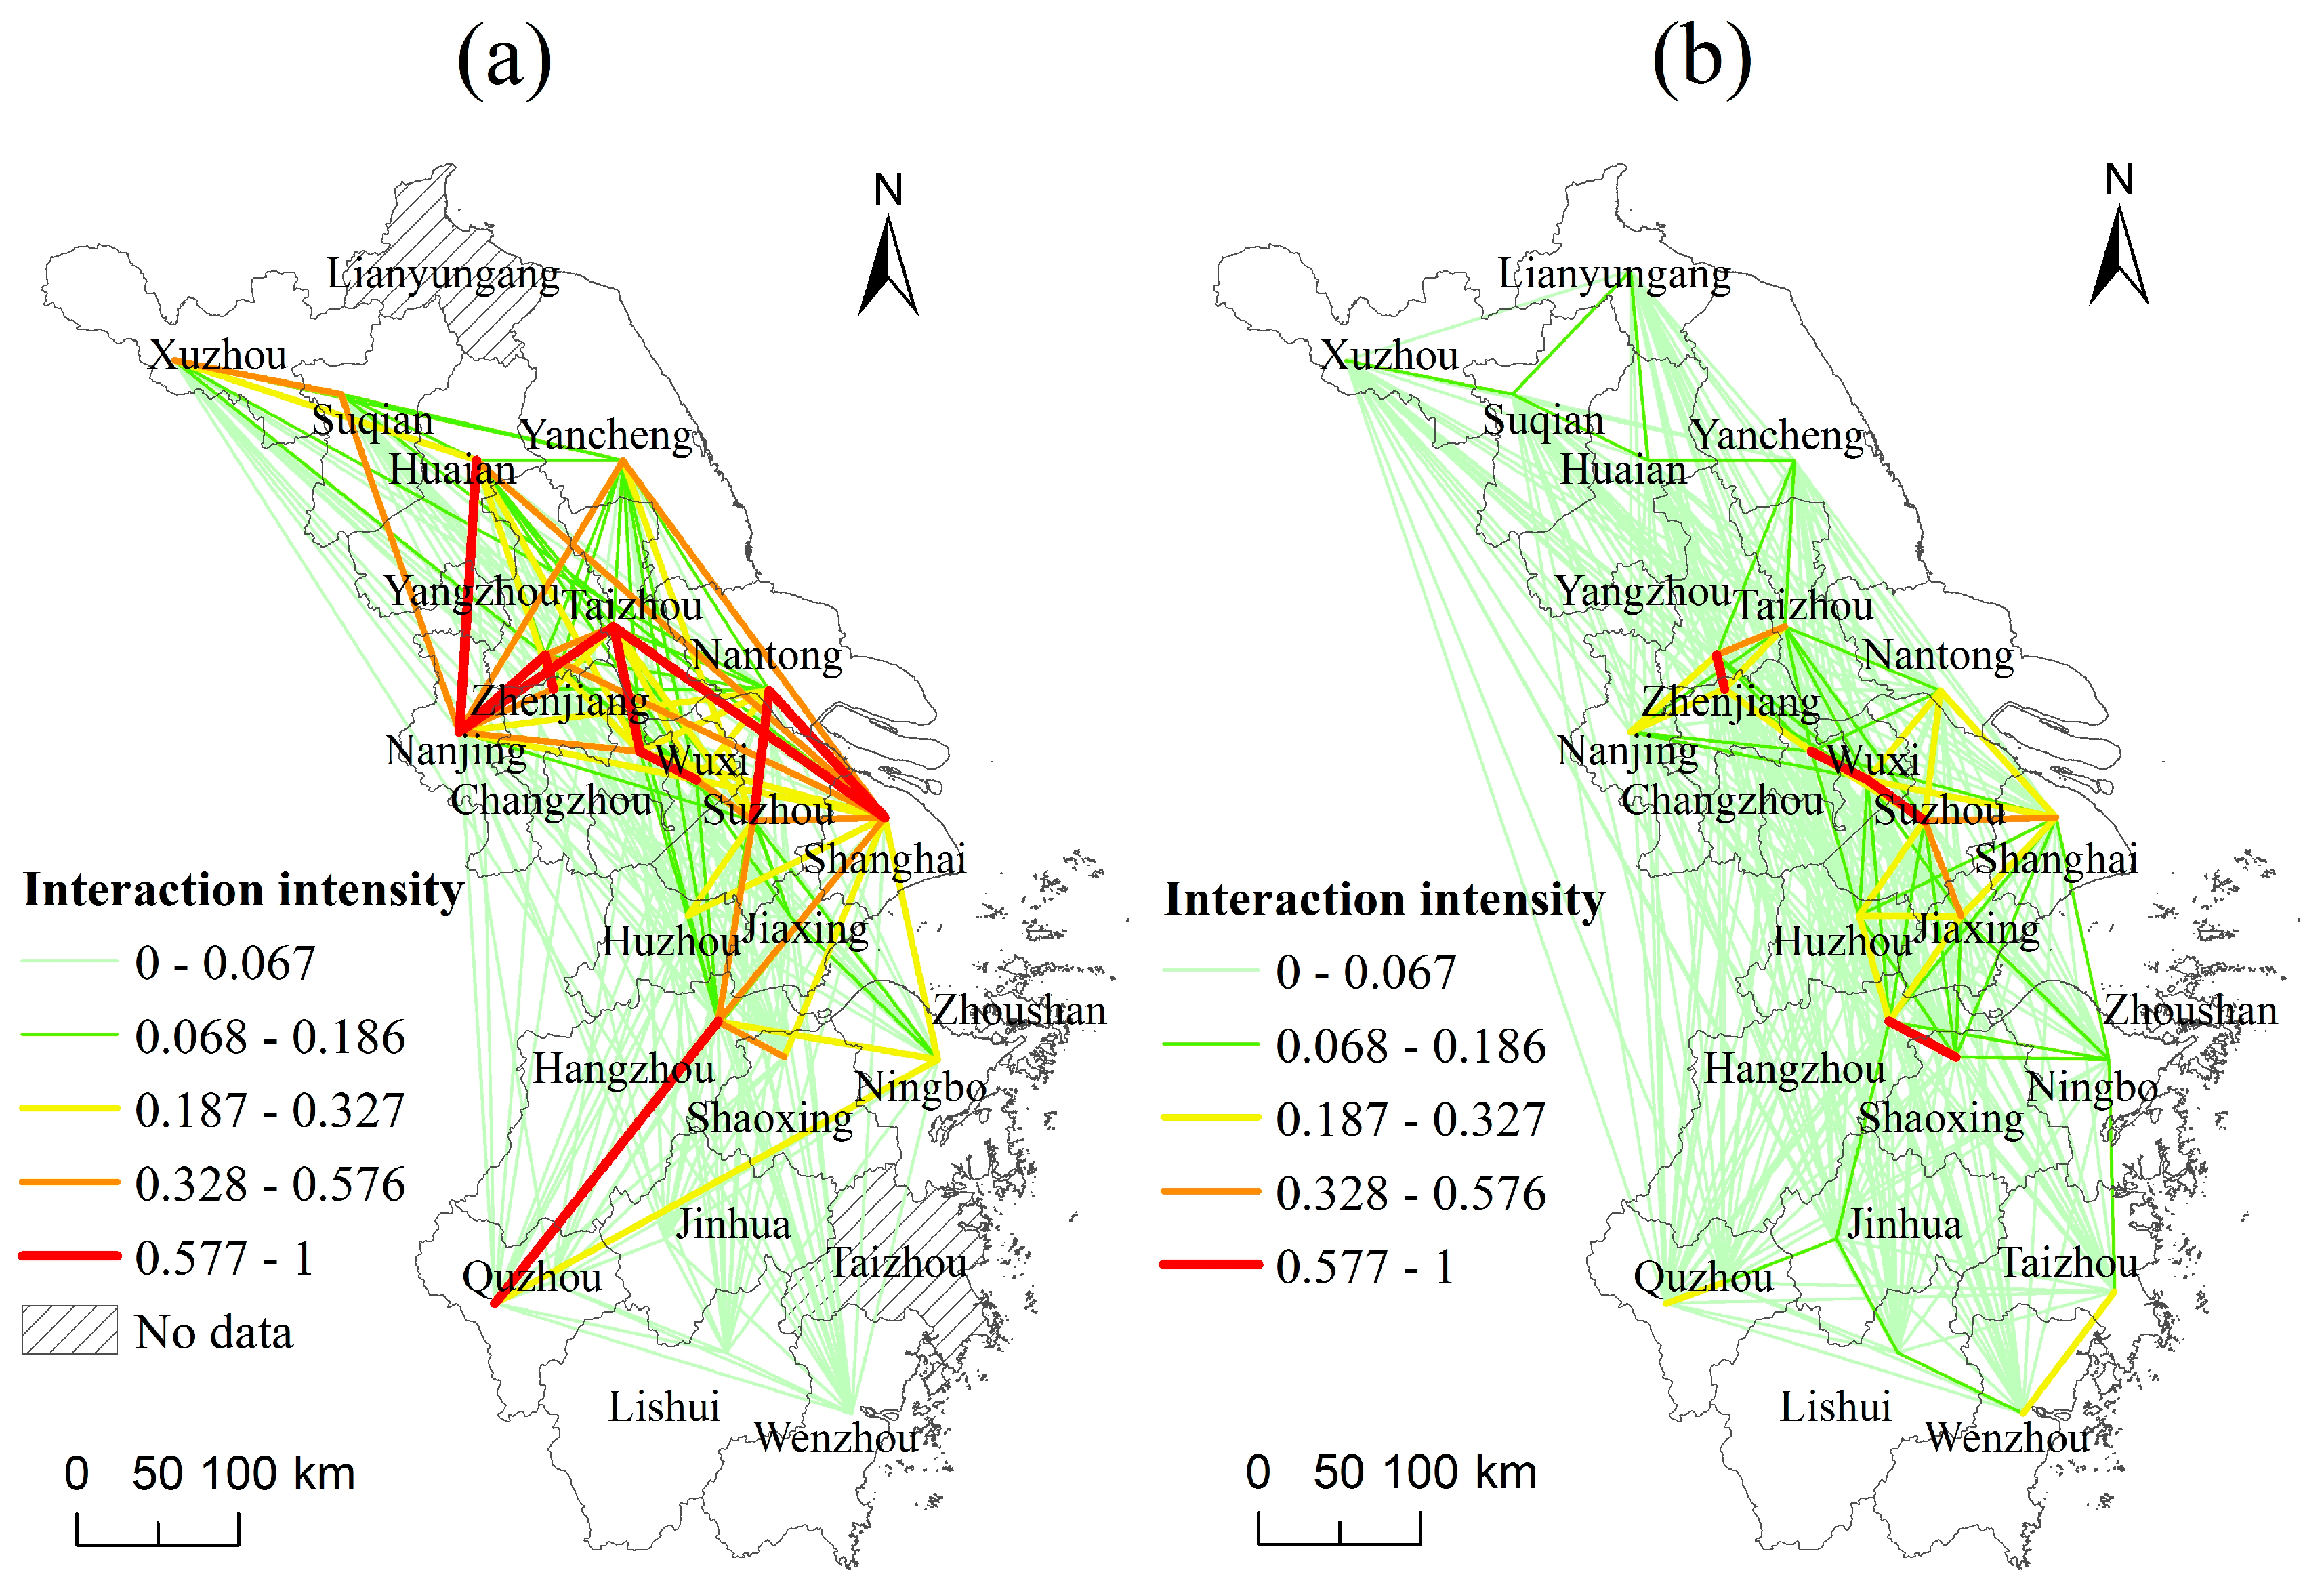
First, the big-data method can describe interactions between cities that are more consistent with the reality. The big data method uses real inter-city transport flow data to measure the interaction intensity. While the gravity model uses city scale and distance as input parameters to model the interaction, thus underestimation and overestimation often occurred. Figure 6 shows the normalized value of the interaction intensity (between 0 and 1) of the big-data-based method, see Figure 6a, and statistical-data-based gravity model, see Figure 6b. The urban spatial interaction intensity between those cities that are far from each other (such as Shanghai–Taizhou, and Nanjing–Huaian) was usually underestimated using the traditional gravity model due to the distance decay effect. It was not consistent with the reality. According to real inter-city passenger-flow data, these cities actually should have significantly high interaction intensities. This could be clearly identified through the big-data-based approach, see Figure 6a, but was underestimated in the traditional gravity model, see Figure 6b. On the contrary, the interaction intensities were usually overestimated in the case that two cities were geographically close. For example, the interaction intensity between Hangzhou and Ningbo was modeled to be higher in Figure 6b than that in the real situation, see Figure 6a.
Second, the big-data method can measure the degree and betweenness centrality of cities in UA, while the traditional gravity model cannot. Due to the directional attribute of inter-city passenger-flow big data, the characteristics of a city as a node in the city network can be measured quantitatively. However, as the traditional gravity model uses scalar data such as GDP and population for analysis, it cannot indicate the direction of flows between cities, thus cannot indicate the centrality of cities. In summation, the big-data method is relatively more reliable and informative due to the advantage of the big data over the statistical data used in the traditional gravity model.
5.2. Policy Implications
Based on YRD UA’s case study, we posit several policy recommendations for improving the single city’s attractiveness and the whole UA’s competitiveness so that the regional sustainability can be enhanced.
First, the development of transport infrastructure should be given continuous attention in the UA’s planning and development. As proven by several pieces of the literature, transportation infrastructure plays an important role in strengthening the connection and integration between cities [52,53]. Though tremendous money has been invested in the past decades in YRD’s transport infrastructure, and the per capita level highway and railway in YRD has been relatively higher than many other regions, the overcapacity due to the dense population and high travel demand still exists, which could hinder YRD UA from becoming a world-class UA [51]. In the future, investment should be given to the construction or expansion of transport infrastructure according to the interaction intensity analysis and transport demand projection between cities.
Second, the major function and industry of each city should be carefully oriented and developed. Regional integration does not mean homogeneity. The optimal situation of a UA should be regarded as a human body, that is, that each city should function well and support each other to ensure the effective operation of the whole UA region. In YRD, though many policies and plans have been developed to address the issue, suitable function orientation of one city should be decided with the cooperation of the other cities rather than independently. The past experiences in YRD have warned us that, due to the ill-planned city functional orientation, many cities tended to compete rather than cooperate with each other. For example, port cities in YRD (such as Taicang, Lianyungang, and Nantong) developed the same marine logistics industry and even provided similar services due to their close natural and geographical endowments, which largely reduced the competitiveness of every single city and the regional sustainability. After realizing the negative impacts of the ill planning, Taicang city and Shanghai made changes to their industrial orientation and cooperated with each other. Currently, Nantong mainly focuses on the near-sea logistics business, while Shanghai is in charge of the outer-sea business. It makes these two cities subsequently achieve a win-win success [54]. As confirmed by our degree centrality analysis, Yangzhou and Ningbo have become the top cities for attracting net passenger flows due to their special attention to their local endowment and advantage. For instance, Ningbo focuses on the development of river–ocean combined transportation by using its geographical superiority and is trying to set up a comprehensive pivot port with the cooperation of Zhoushan and Taizhou. Yangzhou also upgrades its industrial structure from the conventional manufacturing industries to the innovation-driven manufacturing base of new materials and energy [55,56]. In addition, the cities with low degree centrality (such as Yancheng and Lishui in Figure 4c), which are mostly located at the edge of YRD UA, require special attention not only for the development of transport infrastructure but, more importantly, to the industries that fit into the local characteristics in order to attract more people.
Third, administrative barriers with regard to decision making across cities should be broken in order to further improve the competitiveness and sustainability of the UA region. Since YRD UA consists of one municipality and other 24 cities in two provinces with multiple administrative-level governments to conduct the planning and decision making, this situation may make the policy implementation deviate from its original intention due to the competition and buck-passing between the local governments. To address the challenges, a highly effective negotiation mechanism with a strong executive power should be established, covering the processes of overarching plan design and monitoring and evaluating the process of plan implementation. Specifically, using the negotiation mechanism, city government and a higher jurisdiction level government (for example, the central government of China) should work together on the plan to make their decision effective not only for an individual city but also for the UA as a whole. Moreover, the social welfare system should also be reformed under the mechanism to support the free flow of the population. For example, the reform of the household registration system is increasingly necessary to make the population migration freer. The social welfare system (including the provision of equal chances of education, healthcare, elderly care services, and so on) reform is also greatly needed to encourage the free flow of people between cities.
5.3. Limitations and Future Works
Big data provide a supplement to the traditional statistical-data-based urban spatial interaction analysis. However, some limitations still remain and require further research.
First, the data used to measure the spatial interaction between cities in this study only cover bus passenger flows, while the passenger flows by other transport modes such as railway, private car, and ferry are not considered due to data limitation. This could cause the result to be biased. More endeavors should be made to fill the data gap. Data from social media, cellphones, transport cards, and so on could be possible sources to obtain the desired passenger-flow information with high time and space resolutions. In addition, the study period could also be expanded as the current duration only covered one month. Long-term monitoring and evaluation on a yearly basis could yield a more comprehensive understanding of the urban spatial interaction issue and generate more robust implications for policies.
Second, though the comparison between the big-data method with the gravity model has confirmed the advantages of the former, the gravity model still holds superiority over the big-data approach. For example, the gravity model can be used to inform the future change of passenger flow and urban spatial interaction as it is driven by scaler factors (GDP and population) that can be projected in-line with the future socioeconomic plan. However, it is difficult for the big-data method to accomplish the same task due to the intrinsic defect in getting the real-time future passenger data. The combination of these two methods would be expected to overcome the demerits of each. Specifically, the big-data method could be used to calibrate the gravity model by using the real and historical passenger-flow data. Then, the calibrated gravity model could be more accurate and reliable in projecting the future trend.
Third, we only reveal the characteristics of urban spatial interactions among cities in this paper. An in-depth investigation of the mechanism of the urban spatial interactions and its correlation with the industrial location and socio-economic development of UA is needed in future studies so that more practical suggestions for policies can be generated to promote the competitiveness and sustainability of UA.
6. Conclusions
The study of the connection between cities and their spatial interaction will help to strengthen the functional linkage within UA and promote the sustainability of UA. In this study, we developed a crawler program based on R language to collect the hourly big data of inter-city bus passenger flow from a ticket booking website. Then, we analyzed the spatial interaction between cities in YRD UA regarding its interaction intensity, degree and betweenness centrality, and cohesive subgroups. To clarify the advantages of the big-data based method, we compared our result with the traditional statistical-data based gravity model. Finally, based on the analysis of our model result and the related literature, we also proposed some policy implications for improving the single city’s attractiveness and strengthening the whole UA’s competitiveness. The limitations of our method and future improvements are discussed. The major findings are summarized as follows.
First, the big-data based method relies on vectorial, realistic, and high spatiotemporal resolution information of urban interaction and is proven to be more reliable and informative than the traditional statistical-data based gravity. Its description of the interactions between cities is more consistent with the reality and it can measure the characteristics of a city as a node in the city network quantitatively, while the traditional gravity model cannot.
Second, some phenomena regarding the urban spatial interaction in YRD UA that were discussed or mentioned in the literature and regional plans, such as the spatially uneven interaction intensity between cities, the formation of a multi-core spatial layout, and the driving forces of city centrality can be quantitatively measured or confirmed in our study using big data. Specifically, a higher spatial interaction intensity could be observed in the middle region of YRD UA while the other regions showed a lower intensity. It’s also revealed that Shanghai is the core city of YRD UA while Nanjing and Hangzhou have become the regional centers of their own provinces. Nanjing, Yangzhou, and Ningbo were the top three cities that attract the greatest inflow of passengers in YRD UA. However, Hangzhou and Yancheng tend to be the intermediary cities within YRD UA since they have higher betweenness centrality than the other cities. In addition, cities in YRD UA can also be divided into four cohesive subgroups with most of the subgroups consisting of the cities geographically close to each other.
Third, policy implications derived from the YRD UA’s case can also be applicable to other UAs in China. The suggestions for improving the single city’s attractiveness and the whole UA’s sustainability include giving continuous importance to the development of transport infrastructure, orientating suitable and diversified function of each city, and breaking the administrative barriers of decision making across cities.
Fourth, the limitations of this study could be potentially improved through the completion and expansion of big data coverage, the combination of the big-data method with the gravity model, and the further investigation of the mechanism of urban spatial interaction and its correlation with the socio-economic development of UA. Railway, private car, and ferry passenger-flow data should be further covered in future studies in order to avoid bias. Data from social media, cellphones, transport cards, and so on could also be considered as possible sources to obtain the desired passenger-flow information with high time and space resolution. Moreover, a UA dashboard based on the combination of big data with socioeconomic indicators, and a big-data based approach with the traditional gravity model is strongly recommended as a future direction of research. By using the dashboard, various stakeholders such as government, citizens, enterprises, and researchers could be invited to be actively involved in the assessment, planning, and management of a single city or the UA as a whole.
Author Contributions
J.H. designed and improved the research, revised the paper. J.L. collected the data, performed the calculation, analyzed the result, and drafted the paper.
Funding
This research was funded by the National Key R&D Program of China [grant number 2017YFC0505703]; Fundamental Research Funds for the Central Universities [grant number 2018ECNU-HWFW003].
Conflicts of Interest
The authors declare no conflict of interest.
Appendix A
Pseuodocode of the crawler program
load the ‘httr’ and ‘xml2’ packages
Counterfeit a request header
for (j in the set of origin cities) {
for (k in the set of destination cities)) {
if (origin city not equals to destination city) {
establish the request body
post the request header and body to the target website
if (the required data exist) {
for (data in the repository) {
download the data
}
}
}
}
}
Store the data
References
- Angel, S.; Hyman, G.M. Urban spatial interaction. Environ. Plan. 1972, 4, 99–118. [Google Scholar] [CrossRef]
- Castells, M. The Rise of the Network Society; Wiley-Blackwell: Hoboken, NJ, USA, 1996; pp. 1–594. [Google Scholar]
- Wheeler, C.H. Search, sorting, and urban agglomeration. J. Lab. Econ. 2001, 19, 879–899. [Google Scholar] [CrossRef]
- Garcia-López, M.À.; Muñiz, I. Urban spatial structure, agglomeration economies, and economic growth in Barcelona: An intra-metropolitan perspective. Pap. Reg. Sci. 2013, 92, 515–534. [Google Scholar] [CrossRef]
- Tan, R.; Liu, Y.; Liu, Y.; He, Q.; Ming, L.; Tang, S. Urban growth and its determinants across the Wuhan urban agglomeration, central China. Habitat Int. 2014, 44, 268–281. [Google Scholar] [CrossRef]
- Krätke, S. Metropolisation of the European economic territory as a consequence of increasing specialisation of urban agglomerations in the knowledge economy. Eur. Plan. Stud. 2007, 15, 1–27. [Google Scholar] [CrossRef]
- Tan, R.; Zhou, K.; He, Q.; Huang, J. Analyzing the Effects of Spatial Interaction among City Clusters on Urban Growth—Case of Wuhan Urban Agglomeration. Sustainability 2018, 8, 759. [Google Scholar] [CrossRef]
- Liu, H.; Liu, Z. Spatial economic interaction of urban agglomeration: Gravity and intercity flow modeling & empirical study. In Proceedings of the IEEE 2008 International Conference on Management Science & Engineering, Long Beach, USA, 10–12 September 2008; pp. 1811–1816. [Google Scholar]
- Kitchin, R.; Lauriault, T.P.; Mcardle, G. Knowing and governing cities through urban indicators, city benchmarking and real-time dashboards. Reg. Stud. Reg. Sci. 2015, 2, 6–28. [Google Scholar] [CrossRef]
- Godin, B. The emergence of S&T indicators: Why did governments supplement statistics with indicators? Res. Policy 2003, 32, 679–691. [Google Scholar]
- Zipf, G.K. Human Behavior and the Principle of Least Effort: An Introduction to Human Ecology; Addison-Wesley: Boston, MA, USA, 1949. [Google Scholar]
- Converse, P.D. New laws of retail gravitation. J. Mark. 1949, 14, 379–384. [Google Scholar] [CrossRef]
- Taylor, P.J. World City Network: A Global Urban Analysis; Routledge: London, UK, 2004. [Google Scholar]
- Pan, H.; Deal, B.; Chen, Y.; Hewings, G. A Reassessment of urban structure and land-use patterns: Distance to CBD or network-based?—Evidence from Chicago. Reg. Sci. Urban Econ. 2018, 70, 215–228. [Google Scholar] [CrossRef]
- Comunian, R. Rethinking the Creative City: The Role of Complexity, Networks and Interactions in the Urban Creative Economy. Urban Stud. 2010, 48, 1157–1169. [Google Scholar] [CrossRef]
- Pan, H.; Deal, B.; Destouni, G.; Zhang, Y.; Kalantari, Z. Sociohydrology modeling for complex urban environments in support of integrated land and water resource management practices. Land Degrad. Dev. 2018, 29, 3639–3652. [Google Scholar] [CrossRef]
- Gordon, R.; Mccann, P. Industrial Clusters: Complexes, Agglomeration And/Or Social Networks. Urban Stud. 2014, 37, 513–532. [Google Scholar] [CrossRef]
- Asheim, T.; Boschma, R.; Cooke, P. Constructing regional advantage: Platform policies based on related variety and differentiated knowledge bases. Reg. Stud. 2011, 45, 893–904. [Google Scholar] [CrossRef]
- Anas, A.; Xiong, K. Intercity trade and the industrial diversification of cities. J. Urban Econ. 2003, 54, 258–276. [Google Scholar] [CrossRef]
- Martín, J.C.; Reggiani, A. Recent methodological developments to measure spatial interaction: Synthetic accessibility indices applied to high-speed train investments. Transp. Rev. 2007, 27, 551–571. [Google Scholar] [CrossRef]
- Rae, A. From spatial interaction data to spatial interaction information? Geovisualisation and spatial structures of migration from the 2001 UK census. Comput. Environ. Urban Syst. 2009, 33, 161–178. [Google Scholar] [CrossRef]
- Patuelli, R.; Mussoni, M.; Candela, G. The effects of world heritage sites on domestic tourism: A spatial interaction model for Italy. J. Geogr. Syst. 2013, 15, 369–402. [Google Scholar] [CrossRef]
- Gonzalez-Feliu, J.; Semet, F.; Routhier, J.L. Sustainable Urban Logistics: Concepts, Methods and Information Systems; Springer-Verlag: Berlin, Germany, 2014. [Google Scholar]
- Caprotti, F. Spaces of visibility in the smart city: Flagship urban spaces and the smart urban imaginary. Urban Stud. 2018. [Google Scholar] [CrossRef]
- Azzari, M.; Garau, C.; Nesi, P.; Paolucci, M.; Zamperlin, P. Smart City Governance Strategies to Better Move Towards a Smart Urbanism. In Proceedings of the International Conference on Computational Science and Its Applications, Melbourne, Australia, 2–5 July 2018; Springer: Cham, Switzerland, 2018; pp. 639–653. [Google Scholar]
- Garau, C. Citizen participation in public planning: A literature review. Int. J. Sci. 2012, 1, 21–44. [Google Scholar]
- Mannaro, K.; Baralla, G.; Garau, C. A Goal-Oriented Framework for Analyzing and Modeling City Dashboards in Smart Cities. In Proceedings of the International Conference on Smart & Sustainable Planning for Cities & Regions (SSPCR), Bolzano, Italy, 22–24 March 2017; Springer: Cham, Switzerland, 2017; pp. 179–195. [Google Scholar]
- Badii, C.; Bellini, P.; Cenni, D.; Difino, A.; Paolucci, M.; Nesi, P. User Engagement Engine for Smart City Strategies. In Proceedings of the IEEE International Conference on Smart Computing (SMARTCAMP), Hongkong, China, 29–31 May 2017; pp. 1–7. [Google Scholar]
- Beaverstock, J.V.; Taylor, P.J.; Smith, R.G. A roster of world cities. Cities 1999, 16, 445–458. [Google Scholar] [CrossRef]
- O’Kelly, M.E.; Song, W.; Shen, G. New estimates of gravitational attraction by linear programming. Geogr. Anal. 1995, 27, 271–285. [Google Scholar] [CrossRef]
- Shen, G. Reverse-fitting the gravity model to inter-city airline passenger flows by an algebraic simplification. J. Transp. Geogr. 2004, 12, 219–234. [Google Scholar] [CrossRef]
- Guo, D. Flow mapping and multivariate visualization of large spatial interaction data. IEEE Trans. Vis. Comput. Graph. 2009, 15, 1041–1048. [Google Scholar] [PubMed]
- Yan, J.; Thill, J.C. Visual data mining in spatial interaction analysis with self-organizing maps. Environ. Plan. B-Plan. Des. 2009, 36, 466–486. [Google Scholar] [CrossRef]
- Wang, F.; Guldmann, J.M. Simulating urban population density with a gravity-based model. Socio-Econ. Plan. Sci. 2005, 30, 245–256. [Google Scholar] [CrossRef]
- Karemera, D.; Oguledo, V.; Davis, B. A gravity model analysis of international migration to North America. Appl. Econ. 2000, 32, 1745–1755. [Google Scholar] [CrossRef]
- He, J.; Li, C.; Yu, Y.; Liu, Y.; Huang, J. Measuring urban spatial interaction in Wuhan urban agglomeration, central China: A spatially explicit approach. Sustain. Cities Soc. 2017, 32, 569–583. [Google Scholar] [CrossRef]
- Liu, Y.; Sui, Z.; Kang, C.; Gao, Y. Uncovering Patterns of Inter-Urban Trip and Spatial Interaction from Social Media Check-In Data. PLoS ONE 2014, 9, e86026. [Google Scholar] [CrossRef] [PubMed]
- Guimera, R.; Mossa, S.; Turtschi, A.; Amaral, L.A.N. The worldwide air transportation network: Anomalous centrality, community structure, and cities’ global roles. Proc. Natl. Acad. Sci. USA 2005, 102, 7794–7799. [Google Scholar] [CrossRef] [PubMed]
- Gao, S.; Liu, Y.; Wang, Y.; Ma, X. Discovering spatial interaction communities from mobile phone data. Trans. GIS 2013, 17, 463–481. [Google Scholar] [CrossRef]
- Kang, C.; Sobolevsky, S.; Liu, Y.; Ratti, C. Exploring human movements in Singapore: A comparative analysis based on mobile phone and taxicab usages. In Proceedings of the 2nd International Workshop on Urban Computing, Chicago, IL, USA, 11 August 2013. [Google Scholar]
- Bus Steward. Available online: http://www.chebada.com (accessed on 25 October 2018).
- Analytic Technologies. Available online: http://www.analytictech.com (accessed on 25 October 2018).
- Breiger, R.; Boorman, S.; Arabie, P. An algorithm for clustering relational data, with applications to social network analysis and comparison with multi-dimensional scaling. J. Math. Psychol. 1975, 12, 328–383. [Google Scholar] [CrossRef]
- Brewer, C.A.; Pickle, L. Evaluation of methods for classifying epidemiological data on choropleth maps in series. Ann. Assoc. Am. Geogr. 2002, 92, 662–681. [Google Scholar] [CrossRef]
- Chen, H.; Sun, D.; Zhu, Z.; Zeng, J. The impact of high-speed rail on residents’ travel behavior and household mobility: A case study of the Beijing-Shanghai line, China. Sustainability 2016, 8, 1187. [Google Scholar] [CrossRef]
- Nanjing Municipal Bureau Statistics. Nanjing Statistical Yearbook 2017; Nanjing Municipal Bureau Statistics: Nanjing, China, 2017. Available online: http://221.226.86.104/file/nj2004/2017/index.htm (accessed on 16 November 2018).
- Yangzhou Municipal Government. The Detailed Rules for Implementing “lvYangJinFeng” Planning on Talent Support. Available online: http://www.lyjf.gov.cn/kindeditor/attached/file/20180913/20180913174332323232.pdf (accessed on 25 October 2018).
- Ningbo Municipal Human Resources and Social Security Bureau. The National Job Fair in Xian and Nanchang. Available online: http://www.nbhrss.gov.cn/art/2018/9/30/art_7038_2915324.html (accessed on 25 October 2018).
- Hangzhou Municipal Government. The General Plan for Urban Development of Hangzhou (2001–2020). Available online: http://www.hzghy.com.cn/index.php/project/info/45/51 (accessed on 25 October 2018).
- Yancheng Municipal Government. The General Plan for Urban Development of Yancheng (2013–2030). Available online: http://ghj.yancheng.gov.cn/ghcg/ghcg/201708/W020150205577700055262.pdf (accessed on 25 October 2018).
- NDRC (National Development and Reform Commission, PRC). Regional Planning of Yangtze River Delta. Available online: http://www.ndrc.gov.cn/zcfb/zcfbghwb/201606/t20160603_806390.html (accessed on 25 October 2018).
- Xie, F.; Zhang, L.; Min, J. Research on Inter-City Transportation to Promote Changsha-Zhuzhou-Xiangtan Urban Agglomeration Economy Integration. In Informatics and Management Science IV, Lecture Notes in Electrical Engineering; Springer: London, UK, 2013; Volume 207, pp. 595–602. [Google Scholar]
- Chen, Y.; Salike, N.; Luan, F.; He, M. Heterogeneous effects of inter- and intra-city transportation infrastructure on economic growth: Evidence from Chinese cities. Camb. J. Reg. Econ. Soc. 2015, 9, 571–587. [Google Scholar] [CrossRef]
- Xinhua News. Nantong is Writing a Tale of Two Cities by Approaching Shanghai. Available online: http://news.xhby.net/system/2018/03/06/030798360.shtml (accessed on 16 November 2018).
- Daliy Yangzhou. Yangzhou Constructed Two New Provincial High-Tech Zone. Available online: http://www.yznews.com.cn/yzrb/html/2016-05/26/content_785362.htm (accessed on 16 November 2018).
- YDRC 2018 (Yangzhou Development and Reform Commission). Yangzhou’s 13th Five-Year Planning on Wind Power. Available online: http://fgw.yangzhou.gov.cn/yzfgw/fgyw/201807/04eb1269811e4bef832b3085339c154c.shtml (accessed on 16 November 2018).
Figure 1.
Study area.

Figure 2.
Flowchart of the study.

Figure 3.
Interaction intensity of cities within the Yangtze River Delta (YRD) urban agglomeration (UA). (a) Interaction intensity of all cities; (b) interaction intensity of Shanghai; (c) interaction intensity of Nanjing.
Figure 3.
Interaction intensity of cities within the Yangtze River Delta (YRD) urban agglomeration (UA). (a) Interaction intensity of all cities; (b) interaction intensity of Shanghai; (c) interaction intensity of Nanjing.

Figure 4.
Centrality indexes of cities in YRD UA (a) In-degree centrality of cities in YRD UA; (b) Out-degree centrality of cities in YRD UA; (c) Net-degree centrality of cities in YRD UA; (d) Betweenness centrality of cities in YRD UA.
Figure 4.
Centrality indexes of cities in YRD UA (a) In-degree centrality of cities in YRD UA; (b) Out-degree centrality of cities in YRD UA; (c) Net-degree centrality of cities in YRD UA; (d) Betweenness centrality of cities in YRD UA.

Figure 5.
Subgroups of cities in YRD UA.

Figure 6.
Interaction intensity of cities within YRD UA (a) calculated by inter-city passenger-flow big data; (b) calculated by traditional gravity model.
Figure 6.
Interaction intensity of cities within YRD UA (a) calculated by inter-city passenger-flow big data; (b) calculated by traditional gravity model.


Table 1.
Examples of the online retrieval bus passenger-flow data.
| Origin | Destination | Coach Type | Departure Time | Remaining Tickets |
|---|---|---|---|---|
| Shanghai | Wuxi | Large | 10:00 | 10 |
| Suqian | Hangzhou | Large | 15:20 | 18 |
| Yancheng | Ningbo | Medium | 21:15 | 5 |
| ⋮ | ⋮ | ⋮ | ⋮ | ⋮ |
© 2018 by the authors. Licensee MDPI, Basel, Switzerland. This article is an open access article distributed under the terms and conditions of the Creative Commons Attribution (CC BY) license (http://creativecommons.org/licenses/by/4.0/).
Share and Cite
MDPI and ACS Style
Han, J.; Liu, J. Urban Spatial Interaction Analysis Using Inter-City Transport Big Data: A Case Study of the Yangtze River Delta Urban Agglomeration of China. Sustainability 2018, 10, 4459. https://doi.org/10.3390/su10124459
AMA Style
Han J, Liu J. Urban Spatial Interaction Analysis Using Inter-City Transport Big Data: A Case Study of the Yangtze River Delta Urban Agglomeration of China. Sustainability. 2018; 10(12):4459. https://doi.org/10.3390/su10124459
Chicago/Turabian StyleHan, Ji, and Jiabin Liu. 2018. "Urban Spatial Interaction Analysis Using Inter-City Transport Big Data: A Case Study of the Yangtze River Delta Urban Agglomeration of China" Sustainability 10, no. 12: 4459. https://doi.org/10.3390/su10124459
Note that from the first issue of 2016, this journal uses article numbers instead of page numbers. See further details here.