Interurban Consumption Flows of Urban Agglomeration in the Middle Reaches of the Yangtze River: A Network Approach


1
Institute of Regional and Urban-Rural Development, Wuhan University, Wuhan 430072, China
2
Institute for the Development of Central China, Wuhan University, Wuhan 430072, China
3
School of Economics and Management, Tongji University, Shanghai 200092, China
4
School of Social Education, Shanghai Conservatory of Music, Shanghai 200031, China
5
Institute for Global Innovation and Development, East China Normal University, Shanghai 200062, China
6
School of Urban and Regional Sciences, East China Normal University, Shanghai 2000241, China
7
Institute of Eco-Chongming, East China Normal University, Shanghai 200062, China
*
Authors to whom correspondence should be addressed.
Sustainability 2019, 11(1), 268; https://doi.org/10.3390/su11010268
Submission received: 8 December 2018
/
Revised: 22 December 2018
/
Accepted: 29 December 2018
/
Published: 8 January 2019
(This article belongs to the Special Issue Building Regional Sustainability in Urban Agglomeration: Theories, Methodologies, and Applications)
Abstract
:Network analysis through the lens of traffic flows is becoming the focus of urban-region research in the context of globalization. This study examines the network relationship among 31 cities in the middle reaches of the Yangtze River from the perspective of consumption flow that is serving as an increasingly important engine for China’s growth in general and regional momentum in particular. By tracing the directions and magnitudes of bank card transactions in 2016 as provided by Chinese UnionPay, this paper finds: (1) Three capital cities dominate both outward and inward flow networks and have net outflows, whereas others are featured with inward consumption flow; (2) Most interurban flows occur within provincial boundary, which leaves this whole region without a city-generating global impact; (3) Eight sub-networks composed of adjoining few cities can be further identified that have closer connections to the one containing capital city in that province. Based on these findings related to boundary effect, this paper concludes with a vision for more integrated consumption networks in the context of this region.
1. Introduction
Economic globalization as represented by the increasing but arguably asynchronous mobility of capital and labor since the 1980s has generated fundamental shifts in both production and consumption sides in post-Fordist societies. From a microscopic perspective, firms as the basic unit of production organization are triggered either by exogenous rising production costs at conventional metropolitan centers or their endogenous demands for greater environmental amenities in suburbia to move towards peripheral but emerging cities, from which production network between cities and connections with the rest of the world can be simultaneously identified for a metropolitan region. On the other hand, cities, under sweeping pressures for regeneration and branding, are becoming sites of consumption with rising household incomes and greater number of visitors. Even to the extent labor are less spatially mobile due to their material or emotional local ties as contrasted with the superior cross-border fluidity of capital flows, more frequent business, commuting, and tourist trips as well as the associated surging interurban consumptions within metropolitan boundaries are being witnessed for most growing regions and are being attached greater importance in local policy agendas.
Admittedly, consumption plays an increasingly important role in China’s economic growth as unprecedented people migrate into and flow between cities. From 2010 to 2017, with the level of urbanization increasing from 49.95% to 58.52%, the contribution rate of final consumption expenditure to GDP growth rose from 44.9% to 58.8%, and the proportion of total retail sales of social consumer goods to GDP increased from 38% to 44.28%. This trend was explicitly echoed by the report of the Nineteenth National Congress (Report of the Nineteenth National Congress of the Communist Party of China, http://cpc.people.com.cn/n1/2017/1028/c64094-29613660.html) pointing out that “the basic role of consumption in economic development should be strengthened” and at the same time putting forward the idea of “taking urban agglomeration as the main body to construct a coordinated structure of large, medium and small cities and towns.” This clearly suggests consumption, especially interurban consumption within metropolitan regions, will benefit China’s future economic development and deserves both policy and scholastic attention for China studies. As one of the key development areas as stipulated by the central government in the Main Functional Areas Plan (Notice of the State Council on Printing and Distributing the National Main Functional Area Plan, http://www.gov.cn/zhengce/content/2011-06/08/content_1441.htm), the urban agglomeration in the middle reaches of the Yangtze River joins the upstream and downstream areas, including 31 prefecture-level cities in Hunan, Hubei, and Jiangxi provinces. As historically major grain-producing and densely populated region, it is experiencing rapid urbanization and gradually releasing its enormous consumption capacity nowadays. Based on the analysis of the China UnionPay card consumption data in this region, this study will reveal the spatial characteristics of its interurban consumption network, which may not only suggest potentials for interurban network improvement and consumption promotion, but also provide important source of reference or comparison for other regions.
The structure of this paper is organized as follows: The second part is a literature review about the urban network and urban consumption. In the Section 3, we introduced the research area, data sources and research methods. The Section 4 is the analysis of urban consumption network system from the perspective of node, level and the clustering structure, and the final section is the conclusion.
2. Urban Network and Consumption Flow
The notion related to urban networks can be traced back to the idea of “garden city” originated by British social activist Ebenezer Howard (1898) [1]. In practice, however, that cities and towns are functionally posited as exclusive work or residence places not only give rise to immense commuting pressure between them, but also bring about social problems such as a lack of public spaces and a high crime rate. In response to this situation, the functions of cities and towns have gradually expanded and crossed the original administrative boundaries, forming “conurbation” and “regional city” as advocated by rationalist planners and geographers [2,3]. Christaller (1933) theorized this phenomenon and put forward the central geography theory to reveal the spatial hierarchical relationship between cities and towns [4]. In the 1960s, French scholar Gottmann (1961) termed the typology of urbanization in the northeastern United States as “Megalopolis” [5]. Since then, inter-city economic linkages at the regional scale have become prominent research themes. For example, Massey (1997) put forward the theory of the spatial division of labor to explain the spatial pattern and substantive relationship between cities [6]. On this basis, geographers such as Storper (1997) [7], from the perspective of institutional embeddedness, and Capello (2000) and Meijers (2005) and other economists from the perspective of economic performance [8,9], investigated the advantages of the production network.
However, most of the above studies on urban networks focus on the observed static outcomes with very few studies shedding light on the dynamic formation mechanism. In the context of globalization, Castells (1996) put forward the theory of “space of flows” [10], in which the “flow” as the edge and the “place” as the node jointly constructed the inter-city network pattern, and the interaction promoted the continuous evolution of the network pattern. Based on this theory, Taylor (2004) initiated a paradigm of interurban network analysis by mapping the locations of the headquarters and branches of selected multinational corporations to simulate the “flow” between them [11]. In a similar fashion, Hall and Pain (2006) further studies the commuting flow within eight mega city-regions in Western Europe [12] and combined it with the frequency of flights and trains and the headquarter-branch locations of advanced producer services companies to identify the overall network structures of these city-regions. Subsequently, many studies have been carried out to measure various “flows” between cities in different regions. Some scholars examined the urban network structure in China by applying the organizational links between headquarters and branches of multinational corporations as pioneered by Taylor [13,14]. Some studies have also analyzed the passenger and freight flows of inter-city transportation infrastructure, such as railways [15], highways [16], and aviation [17,18], while others discussed the impact of the Internet and information technology on urban network systems [19,20,21,22]. More recent studies are based on cooperative patents or publications, delving into the spatial and temporal patterns of innovation networks [23].
Although the above studies portray urban networks based on different types of “flows”, they either view cities as sites of concentration of production factors and enterprises, thus focusing on corporation connection, intelligence cooperation, or communication links between cities, which has little to do with broader social connections, or simply study the magnitude of traffic flow, leaving the nature of the “flow” largely unattended. With the development of cities and increasing mobility of people, consumption of local goods and services has become a new engine of urban development, and city is becoming a machine of entertainment [24,25]. Unlike the urban networks built through corporation, intelligence, or communication connections, the urban network based on consumption flows involves much wider societal subjects and conveys clearer information on the attributes of flow activities. Among very limited existing research on urban consumption in China, although some have noted the general trend of burgeoning urban consumption [26], some have analyzed the influence factors [27,28], some have identified its positive impact on industrial restructuring and upgrading through amenity building [29], this research almost exclusively focuses on the consumption within the city, and neglect the consumption “flow” between cities.
In sum, the current studies on urban networks are disproportionately based on flows of production factors such as enterprise, transportation, and knowledge without taking consumption flows into systematic consideration. This paper aims to fill in this research vacuum by examining the spatial structure of interurban consumption flows in the Yangtze River Middle Reaches urban agglomeration. With 31 prefecture-level and above cities included, an area of about 317,000 km2 and a total population of 121 million people, this region connects the West and East of China and occupies an important strategic position in promoting the integration of national economy. The rest of this paper starts from a brief description of analytical methods used in this study, and proceeds towards identification of node cities and their consumption flows, analysis of the overall flow structure, and division of city groups around the typology of flows. It concludes with implications of the network structure in the particular context of this region.
3. Analytical Framework
The data in this paper are collected from the China UnionPay credit and debit card consumption transaction records at 31 cities in the middle reaches of the Yangtze River. The city where the card is originally registered is the origin and the city where the card is actually used is the destination. The original transaction record is then organized into a 31 by 31 matrix where a total of 961 interurban consumption flows can be obtained. Even to the extent that the nature of consumption activities still remains vague within the scope of this paper, the aggregate magnitudes and distributional attributes of these consumption records arguably convey more concrete information regarding interurban network than simple passengers or commodity flows. Because interurban card consumption is featured with synchronous mobility of both people and money and implies substantive impacts on urban development, which also make interurban comparisons based on consumption flows relatively feasible. The period of the data used in this paper is 2016. In addition, this paper is also complemented by related data such as urban resident population, urban latitude and longitude coordinates, and the distances between cities. The data of urban resident population comes from China Urban Statistics Yearbook 2016; the latitude and longitude coordinates of cities, and the distance come from Baidu maps.
In this study, through the comprehensive use of social network analysis, dominant flow, and spatial analysis methods, the consumption network of urban agglomeration is analyzed from the perspective of nodes, hierarchy, and cluster structure. Centrality is an important part of social network analysis and the primary indicator for analyzing network characteristics. Centrality can reflect the central position and impact of cities in the network and can be divided into centrality degree and central potential. Centrality degree is the quantitative analysis of the central position of a single city in an urban network, while the central potential is the quantitative analysis of the central position of the entire urban network. In terms of centrality, since the consumption flows of cities in the middle reaches of the Yangtze River have two different directions of outflow and inflow, the degree of centrality can be divided into “InDegree” and “OutDegree” to judge the status and impact of a city’s inflows of consumption and outflows of consumption in the network.
where is the centrality degree; is the InDegree, indicating the amount of consumption of other cities into the city; is the OutDegree, indicating the amount of consumption of the city in other cities; and n is the number of cities in the network. Although this non-standardized index varies a great deal from city to city due to its sensitivity to city size, it is still relevant here to indicate the regional dominance of cities in terms of their inflow and outflow magnitudes.
where is the central potential of the overall network; is the largest centrality value in the urban network; and is the centrality value of city i in the network.
In addition to network nodes, an analysis of the network hierarchy is another important aspect of network system research. The dominant flow is a method that was proposed by Nystuen and Dacey in 1961 for analyzing urban hierarchical structures [30]. The method judges the status of the city in the urban system according to the flow direction of a city’s largest factor flow and the size of the city, identifies the most closely related and dependent urban agglomerations, and classifies cities into three types: dominant, sub-dominant, and subordinate city. According to the situation of the urban agglomeration in the middle reaches of the Yangtze River, this study divides the hierarchical structure of the urban network system with the consumption flow between cities and the urban population as indicators. According to the dominant flow theory, the dominant city refers to its largest consumption flow flowing to a smaller city in the urban system, and at least half of the smaller cities have their largest consumption flows into the city. A sub-dominant city refers to its largest consumption flow flowing to a dominant city, and at least half of the smaller cities have their second largest consumption flows into the city. The largest consumption flow of a subordinate city flows to a dominant or sub-dominant city, and no largest and second largest consumption flows of a smaller city flow into the city.
Based on the analysis of network nodes and network hierarchy, further study of the clustering structure of the network is an important aspect of network research. The cohesive subgroup is a common method used to analyze network structure. This method classifies members with relatively strong, close, direct, or positive relationships into a subset, thus dividing the entire network into several subsets. Members within the set have more close relationships than those outside the set. Cohesive subgroup analysis of urban network can reveal the internal sub-structure status of urban network to better understand the development of urban agglomeration network.
4. Analysis of Urban Agglomeration Consumption Network System
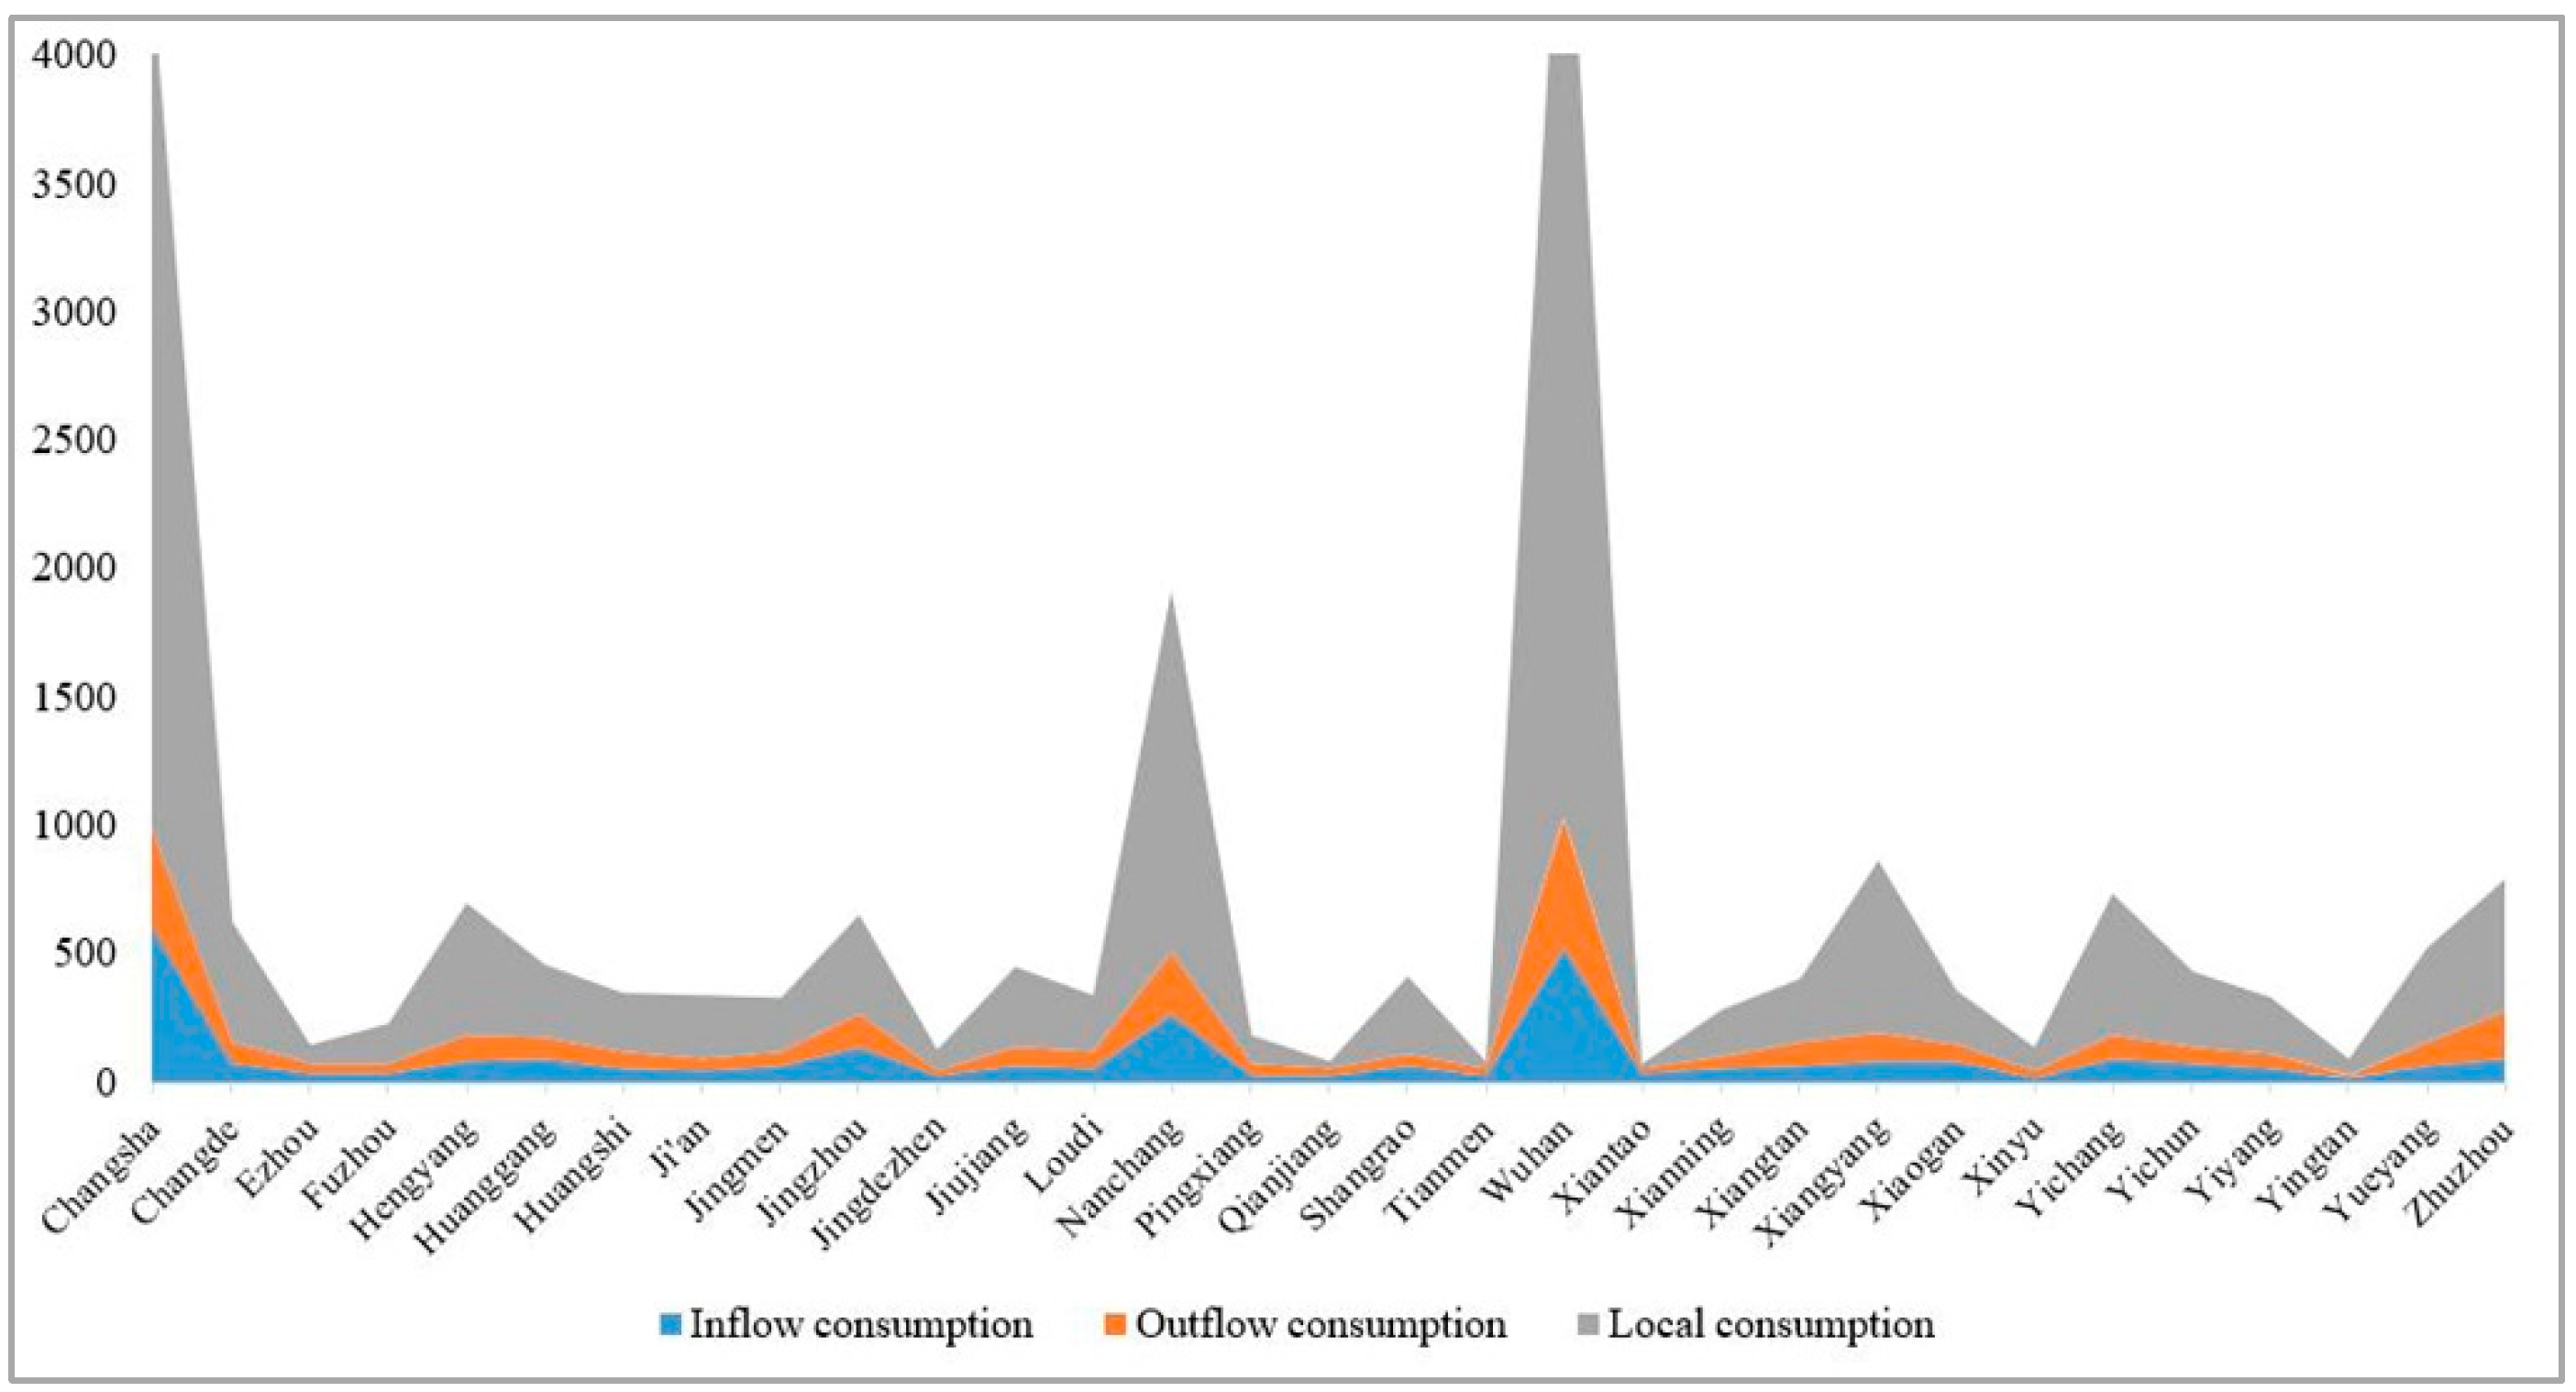
In the context of the new economic normal, with the transformation of China’s economic development mode, the role of consumption in stimulating economic growth has become more prominent, which not only affects the adjustment of urban economic structure, but also promotes inter-city linkages and even the evolution of the spatial organization of the entire urban agglomeration. In 2016, among the cities in the middle reaches of the Yangtze River, total consumption inflows, total outflows, and local consumption of the three provincial capital cities Wuhan, Changsha, and Nanchang were ahead of other cities. The total outflows and inflows of consumption in all cities were much lower than cities’ local consumption (Figure 1).
4.1. Network Nodes Analysis
From the perspective of network analysis, the city is the node of the consumption network, and the centrality of characterizing the importance of the node is the primary indicator of network analysis. Since interurban consumption flows are divided into two directions of inflows and outflows and have different values, the urban consumption connection forms a directed relationship network. Therefore, the centrality of the urban consumption network can be divided into InDegree and OutDegree. For each city, the city’s InDegree and OutDegree are sorted in order of high to low. The results are shown in Figure 2. From the OutDegree, the top five cities are Wuhan, Changsha, Nanchang, Zhuzhou, and Jingzhou, which shows that these five cities have more outflow consumption connections than other cities in the middle reaches of the Yangtze River. In addition, Wuhan has the most outflow consumption connections and the greatest impact. From the InDegree, the top five cities are Changsha, Wuhan, Nanchang, Jingzhou, and Zhuzhou, indicating that these five cities have more inflow consumption connections than other cities, and Changsha has the most inflow consumption connections and the greatest impact. Among these cities, Wuhan, Changsha, Nanchang, Zhuzhou, and Jingzhou are at the top of lists of OutDegree and InDegree, while Yingtan, Jingdezhen, and Xinyu have low rankings in the urban agglomeration. It can be seen that Wuhan, Changsha, Nanchang, Zhuzhou, and Jingzhou have higher mobility in consumption than other cities in the urban agglomeration. Overall, the consumption network of the urban agglomeration in the middle reaches of the Yangtze River has an outward central potential of 9.484% and an inward central potential of 11.891%, indicating that for the entire urban network, the inflow of consumption has greater central potential than the outflow of consumption.
The centrality is based on the quantity of consumption connections in the node city to analyze the status and impact of the node city in the network. By comparing the spending of consumption outflows and inflows of node cities, the characteristics of the consumption connections of the node cities can be known. This study used Out Consumption Flow (OCF) to represent the total consumption spending of the city in other cities, and In Consumption Flow (ICF) to represent the total consumption spending of other cities in the city. D-Value is used to express the net consumption spending in node cities; that is, the difference between outflow consumption spending and inflow consumption spending (Figure 3).
First, from the perspective of OCF, the OCF in Changsha, Wuhan, and Nanchang ranked in the top three in the middle reaches of the Yangtze River, and Jingzhou and Zhuzhou ranked fourth and fifth, respectively. Among the top ten cities in the urban agglomeration, six cities are from Hubei Province, three are from Hunan Province, and Nanchang is the only city in Jiangxi Province. This shows that the cities in Hubei Province have the most advantages in spending of consumption outflows, followed by Hunan and Jiangxi Province.
Second, from the perspective of ICF, Wuhan, Changsha, and Nanchang are the top three cities, with Zhuzhou and Jingzhou ranking fourth and fifth. The spending of inflows of four cities in Hubei Province ranks in the top ten, and five cities in Hunan Province rank in the top ten, while in Jiangxi Province, only the provincial capital city Nanchang ranked third. This reflects that Hunan Province has an advantage in the spending of inflows, followed by Hubei and Jiangxi Province.
Third, from the point of view of D-Value, the OCF of cities represents the external expansion of urban consumption, and the ICF reflects that cities attract consumption from other cities. Therefore, the D-Value calculated from the difference between the spending of the outflow and inflow is the result of the contrast between the urban outward consumption and the inward consumption. The positive value indicates that urban consumption is dominated by inward consumption, while the negative value indicates that urban consumption is dominated by outward consumption. It can be seen from Figure 3 that the outward consumption of Changsha has the greatest advantage in the urban agglomeration, followed by Nanchang and Wuhan. Although the spending of Shangrao’s outflows and inflows are not large, its outward consumption has a relatively significant advantage. Although Jingzhou and Zhuzhou rank high in the outward and inward consumption, their outward consumptions have no significant advantage over inward consumption; the D-Value of Zhuzhou is negative, which indicates that its inward consumption is far greater than that of outward consumption. Overall, D-Values of 20 cities in the urban agglomeration in the middle reaches of the Yangtze River are negative, which indicates that outward consumptions in most cities are less than inward consumptions. Among the top ten cities in the urban agglomeration, there are five cities in Hubei Province, only one in Hunan Province, and three in Jiangxi Province. This shows that Hubei has the largest number of cities with the advantage of inward consumption, followed by Jiangxi Province. Hunan Province has only one city, Changsha, which ranks in top ten, while other cities are weak.
4.2. Network Hierarchy Analysis
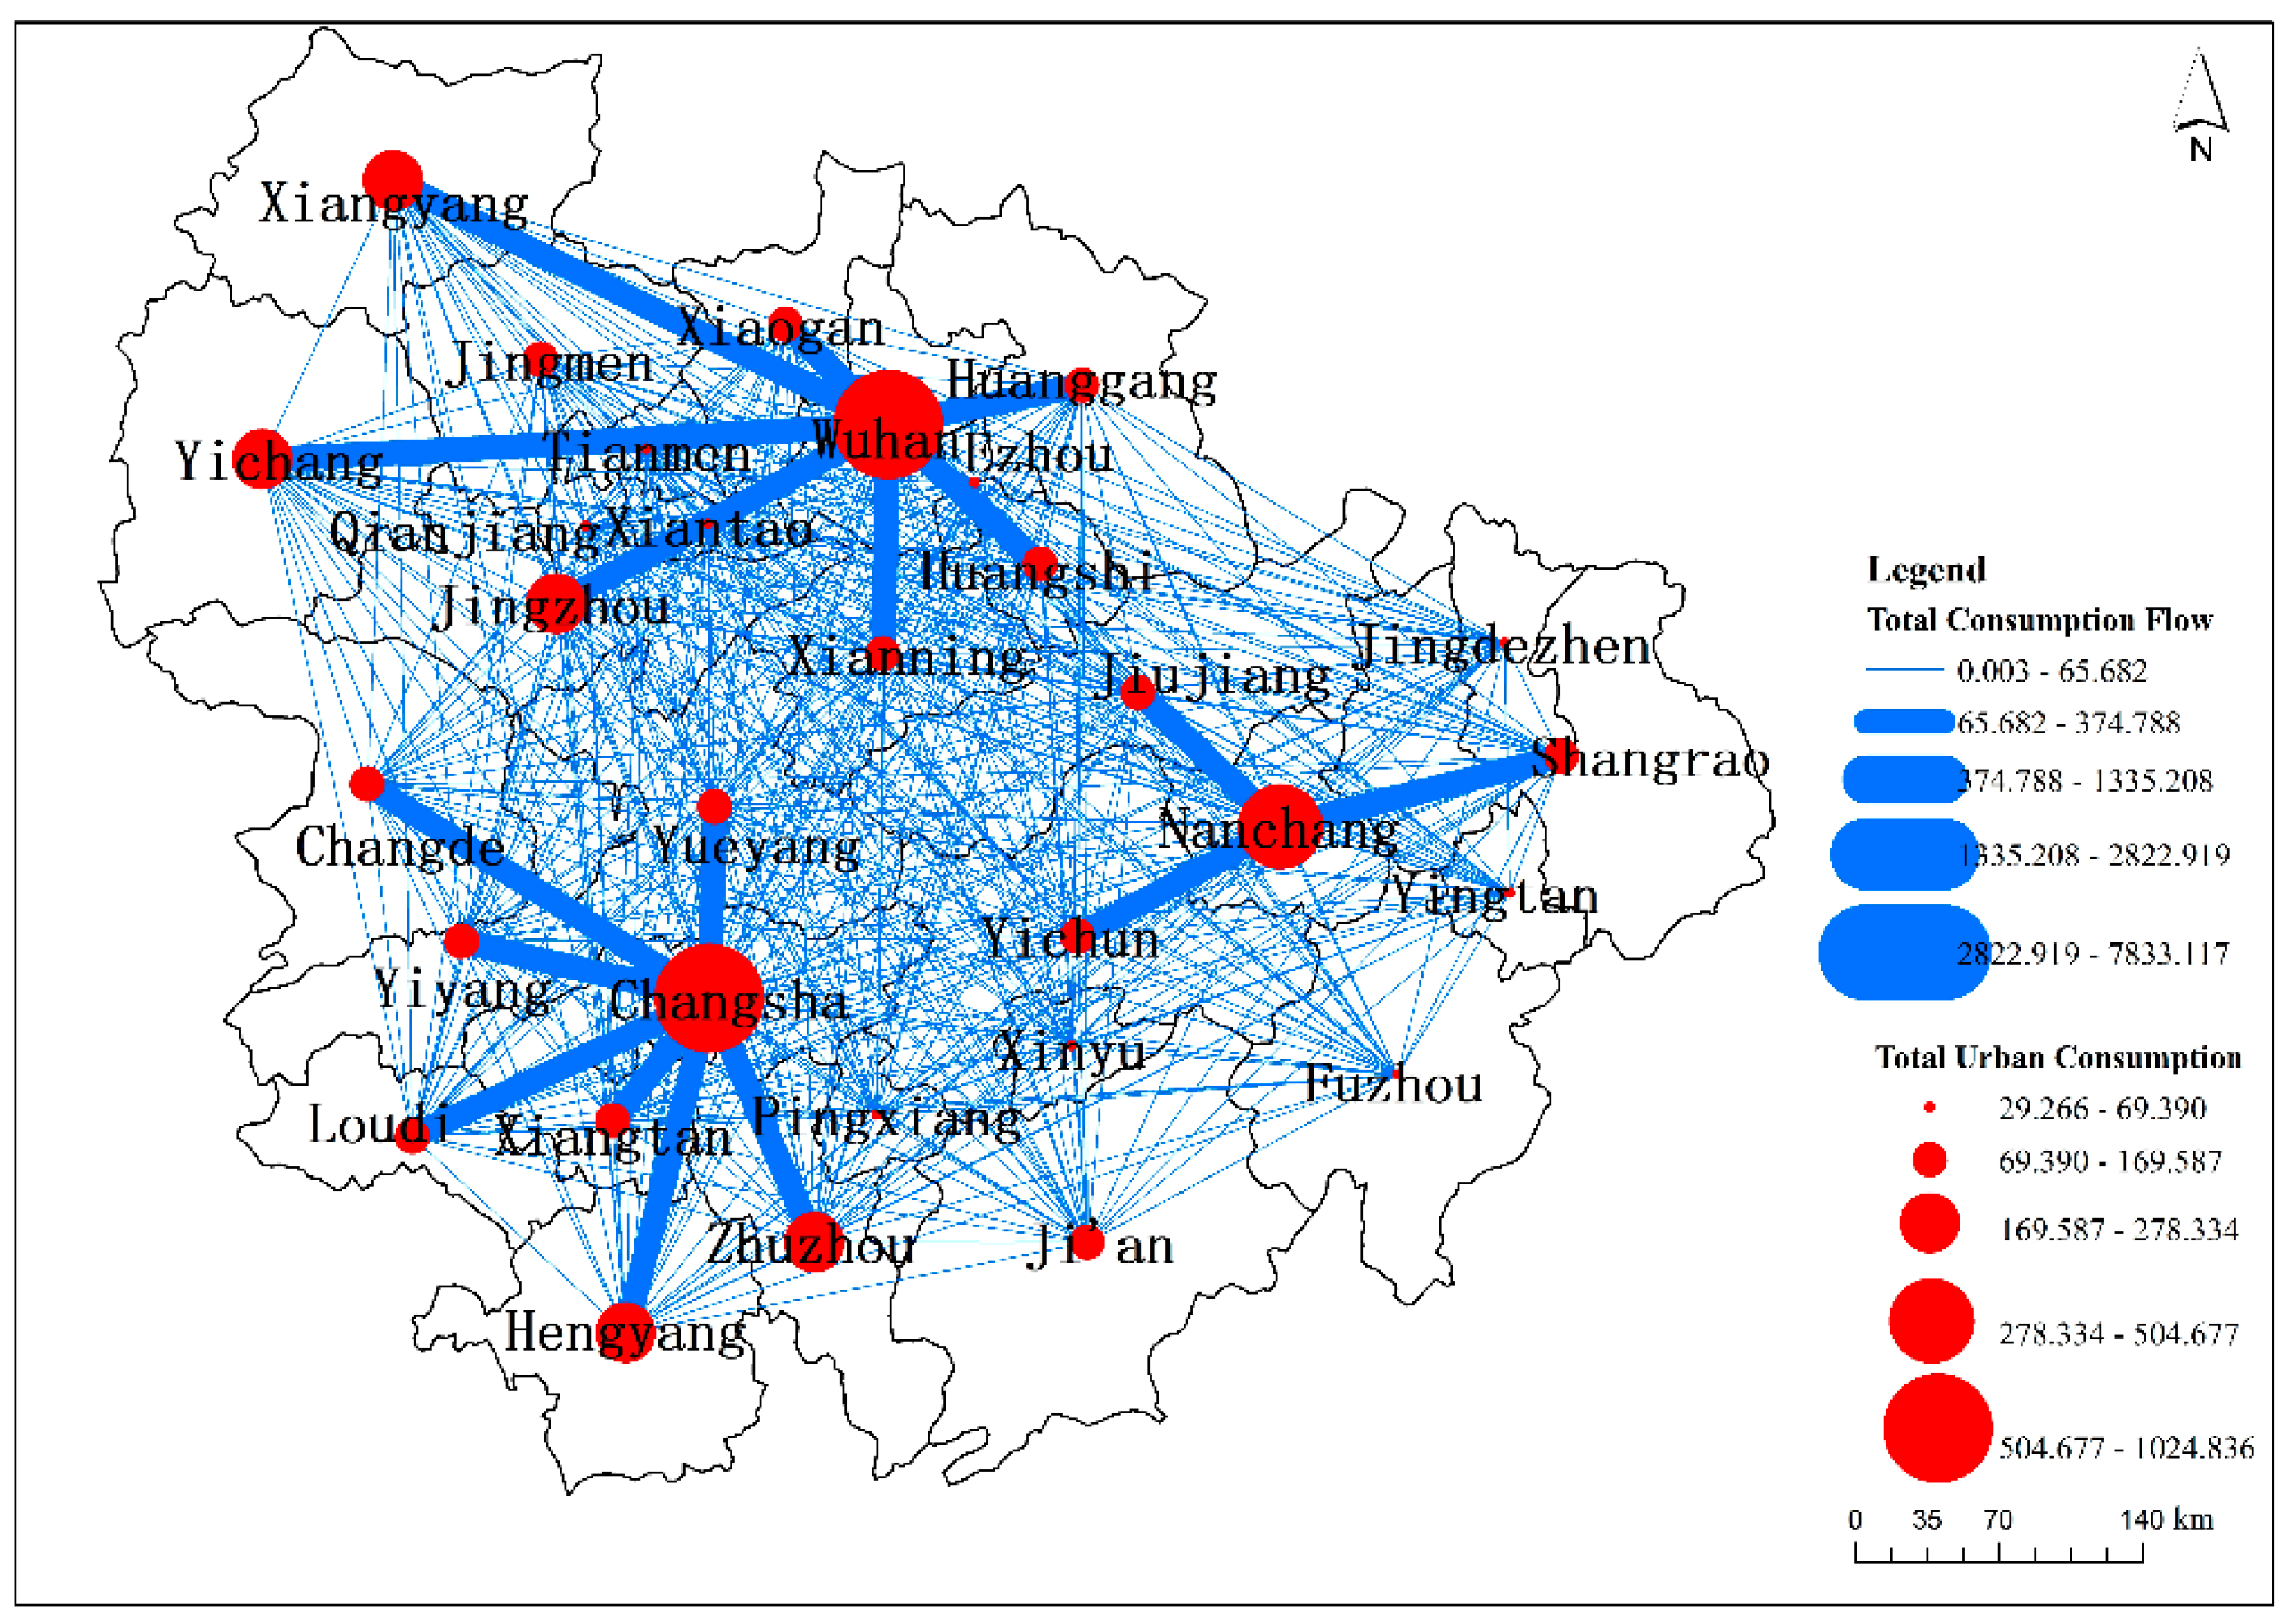
Based on node analysis, the network pattern formed by the consumption flow of the urban agglomeration is analyzed. To show the hierarchy of urban agglomeration’s consumption connection more clearly, the consumption connections among cities in the middle reaches of the Yangtze River are shown in Figure 4 and Figure 5. Cities in the middle reaches of the Yangtze River do not form a complete and continuous network but form several distinct agglomeration groups in space. The consumption network of the urban agglomeration has formed a radial spatial consumption sub-structure centered on Wuhan, Changsha, and Nanchang. In contrast, consumption connections within the sub-structure centered on Nanchang are weaker than the other two sub-structures. Within the three sub-structures, Wuhan, Changsha, and Nanchang have the strongest consumption links with other cities in their respective provinces, while the consumption links between other cities are weaker than links between cities and provincial capital cities. Overall, the consumption links within the sub-structure are relatively intensive, while the consumption links between the sub-structures are very limited; the spatial pattern of the consumption network presents obvious core-edge characteristics.
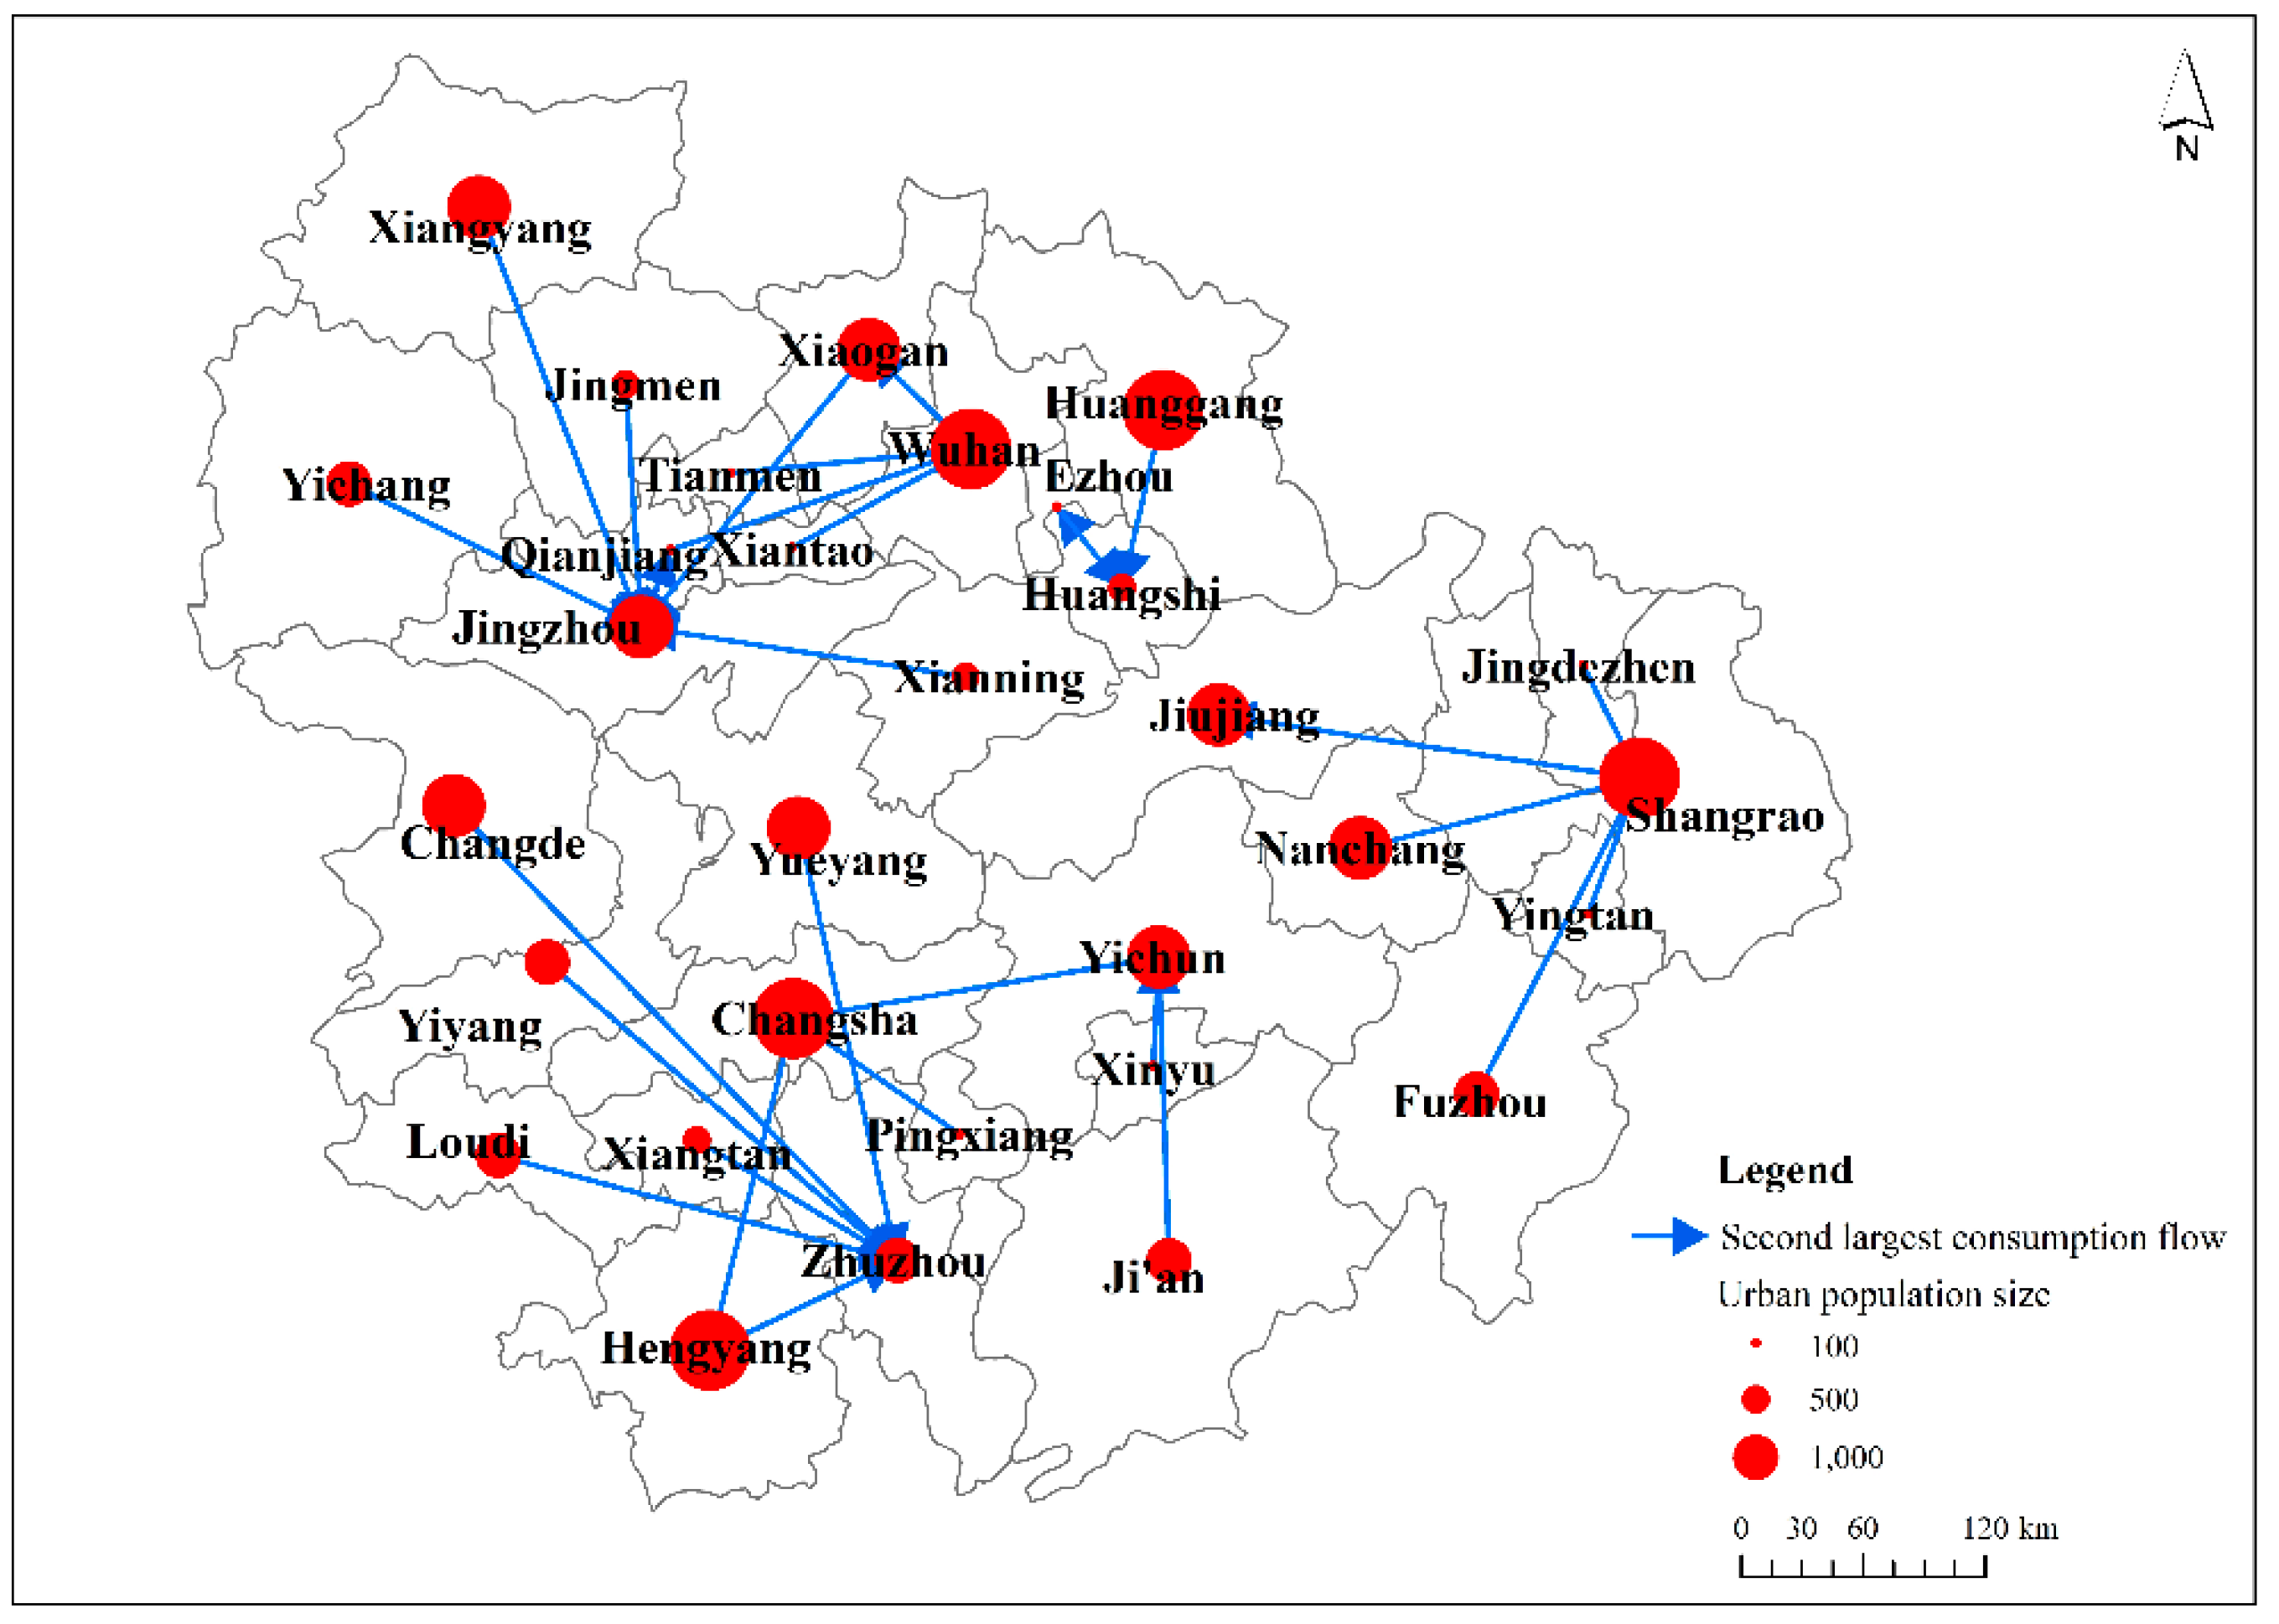
Furthermore, according to the dominant flow theory, by analyzing the largest and second largest consumption flows of the cities in the middle reaches of the Yangtze River, combined with the size of the urban resident population, cities can be divided into three levels, and the spatial flow direction of the largest and second largest consumption flows can be visualized (Figure 6 and Figure 7). First, the largest consumption flows of cities in the middle reaches of the Yangtze River have formed three relatively independent sub-structures in space. The largest consumption flows of cities are essentially absorbed by the provincial capital cities of their respective provinces. For instance, Wuhan accepted the largest consumption flows from nine cities including Ezhou, Huanggang, Huangshi, Jingmen, and Jingzhou, which have smaller populations than Wuhan; Changsha accepted the largest consumption flows from seven cities, including Changde, Hengyang, Zhuzhou, Loudi, and Xiangtan. Nanchang accepted the largest consumption flows from nine cities, such as Fuzhou, Ji’an, Jingdezhen, Jiujiang, and Pingxiang, and so on. It can be seen that the largest consumption flows absorbed by Wuhan, Changsha, and Nanchang do not exceed 90% of the total number of cities, which is not in line with the standards of dominant cities. The three cities only lead a dominant role in some areas, thus they are called the local dominant city and classified as cities in the highest level of the consumption network of the urban agglomeration. It is worth noting that Jingzhou has obtained the largest consumption flows of Tianmen, Xiantao, and Qianjiang, indicating that Jingzhou is a higher-level city in the consumption network except for the three provincial capital cities.
According to the second largest consumption flows in cities, it can be found that Jingzhou, Zhuzhou, and Shangrao have outstanding performances in absorbing the second largest consumption flows. For instance, Jingzhou absorbed the second largest consumption flows of Jingmen, Xianning, Xiangyang, Xiaogan, and Yichang; Zhuzhou absorbed the second largest consumption flows in six cities including Changde, Hengyang, Loudi, Xiangtan, Yiyang, and Yueyang; Shangrao absorbed the second largest consumption flows in five cities including Nanchang, Fuzhou, Jingdezhen, Jiujiang, and Yingtan. These three cities also failed to meet the criteria of sub-dominant cities, but they are still classified as the second level of the consumption network in the middle reaches of the Yangtze River, which is called local sub-dominant cities.
In addition, Hengyang absorbed the second largest consumption flows of Changsha and Zhuzhou, Huangshi absorbed the second largest consumption flows of Ezhou and Huanggang, and Yichun absorbed the second largest consumption flows of Ji’an and Xinyu. Xiaogan, Ezhou, Qianjiang, and Jiujiang all absorbed the second largest consumption flow of a city. As the quantity of the second largest consumption flows absorbed by these seven cities is relatively small, they are not classified as cities in the second level of the consumption network, but as subordinate cities in the third level with 18 other cities that do not absorb any largest or second consumption flows.
Through the hierarchical structure of the consumption network of the urban agglomeration in the middle reaches of the Yangtze River (Table 1), we can find some problems. First, from the overall perspective, there is a significant spatial discontinuity in the consumption network. Three spatial sub-structures have been formed around Wuhan, Changsha, and Nanchang. Within the sub-structure, the consumption connections are relatively close and have a relatively high intensity. The largest and second largest consumption flows are essentially flowing between cities in the same province, but the consumption connections between the three sub-structures are relatively sparse and the intensity of connections is low. Second, from the point of view of the node cities, there is no absolute dominant city in the consumption network of the middle reaches of the Yangtze River. Three provincial capital cities of Wuhan, Changsha, and Nanchang enjoy the dominant role in their own spatial clustering sub-structures. Consumption connections between three provincial capital cities are weak, and they do not play a role in the promotion of consumption linkages between the three sub-structures. Third, from the perspective of consumption flow, the largest consumption flow does not cross the provincial boundaries, and it occurs between cities in the same province. Only a few second largest consumption flows occur between different provincial cities. For example, Yichun and Pingxiang, which belong to Jiangxi Province, have their second largest consumption flows, flowing to Changsha. This may be because Yichun and Pingxiang are adjacent to Changsha. Geographical and transportation advantages play important roles in establishing consumption connections. This phenomenon indicates that Changsha’s consumption influence has broken through the provincial border in a certain extent and has played a role in promoting consumption in a few neighboring cities in another province. As far as the whole urban agglomeration is concerned, inter-city consumption connections across administrative boundaries are still very rare. There is still a long way to go to establish a complete and integrated consumption network.
4.3. Network Cluster Structure Analysis
Based on the analysis of the hierarchy of the consumption network of the urban agglomeration, the cluster structure of cities is further researched by means of cohesive subgroup analysis. The urban agglomeration in the middle reaches of the Yangtze River can be divided into three levels. The first level is composed of the entire urban agglomeration, and the second level consists of four subgroups. The third level consists of eight subgroups, as shown in the Table 2.
In addition, the density values among the eight subgroups on the third level show the closeness of the connections between the subgroups of the urban agglomeration (Table 2). Subgroups based on the urban directed consumption network also form a directed relationship network. From the perspective of the cohesive subgroup where the local dominant city is, the first subgroup headed by Changsha has the closest connection with the second and fifth subgroups of Hunan Province, and is closely related to the fourth subgroup containing Nanchang and the eighth subgroup containing Wuhan. It is worth noting that the density of contact between the first subgroup headed by Changsha and the fourth subgroup containing Nanchang (0.500) is lower than the density of the latter’s association with the former (0.583). The fourth subgroup containing Nanchang has the closest consumption relationship with the third subgroup belonging to the same province of Jiangxi, is more closely related to the consumption of the first subgroup headed by Changsha and has a lower level of consumption with other subgroups. It is worth noting that the connection density of the third subgroup headed by Yingtan to the fourth subgroup containing Nanchang (0.542) is lower than that of the latter to the former (0.625). The eighth subgroup containing Wuhan is most closely related to the sixth and seventh subgroups of the same province of Hubei, and the consumption links with the fifth and first subgroups belonging to Hunan Province are relatively close. The consumption of the eighth subgroup containing Wuhan to the seventh subgroup is higher than the reverse consumption connection. From the perspective of subgroups of other cities, there is high density consumption connection between the second and fifth subgroups of Hunan Province (0.750), but consumption connection between the sixth and seventh subgroups of Hubei Province is very low (0.000).
From the spatial clustering structure of the consumption network presented by cohesive subgroups, following conclusions can be drawn. First, from an overall point of view, cities within the subgroup are adjacent and belong to the same province. It can be seen that distance and administrative boundaries are important factors influencing the intensity of consumption connections between cities. Second, from subgroups of local dominant cities, subgroups of Wuhan, Changsha, and Nanchang are most closely related to the consumption of other subgroups in their respective provinces. In terms of connections among subgroups of the three local dominant cities, Wuhan and Changsha, Changsha and Nanchang have relatively close consumption connections, while Nanchang and Wuhan have relatively fewer connections. Third, from the perspective of other subgroups, in addition to the lower consumption connection between the sixth and seventh subgroups belonging to Hubei Province, the consumption connections between the cohesive subgroups belonging to the same province are relatively close, while the consumption connections between the subgroups belonging to different provinces are relatively few.
5. Conclusions
Based on the China UnionPay card consumption data, this study examined the consumption connections between 31 cities in the middle reaches of the Yangtze River and the formed network system from the perspective of consumption flow. The main findings are as follows. First, Wuhan, Changsha, Nanchang, Jingzhou, and Zhuzhou dominate both the outflow and inflow consumption links of the network. Except Changsha, Nanchang, Wuhan, Shangrao, and Xiaogan, most cities have greater inflow than outflow consumption. The network of inflow consumption is more centralized than the outflow one. Second, the overall interurban network consists of three radial sub-structures centered on Wuhan, Changsha, and Nanchang respectively, with the one around Nanchang weakest, which means no global dominant city in the middle reaches of the Yangtze River. Finally, the urban agglomeration can be further divided into eight cohesive subgroups without crossing provincial boundaries. Each subgroup has the closest connection with the one containing the capital city and closer connections with other subgroups in the same province.
Apart from the fresh perspective of interurban card-based consumption flow that distinguishes this paper from most existing network studies centering on flows of production factors, the revealed network typology may also convey to us potential problems and future vision on regional integration in the particular context of this region. In the absence of globally dominant cities, the spatial structure of the consumption network in the middle reaches of the Yangtze River is evidently composed of three more internally integrated sub-structures centered on Wuhan, Changsha, and Nanchang without trespassing the boundaries between three provinces. Given fierce competition for economic performances between places on all administrative ranks in China, place-based fragmentation has admittedly been an outstanding barrier against a more integrated national market and more efficient economic organization. Although the crystal boundary effect as uncovered from both the network and cohesive subgroup analysis may be attributed to natural reasons such as physical distance, taste preference, or resource endowment as consumption flow may face fewer policy restrictions and institutional barriers than commodity trade, it is in the particular context of this region and China’s recent transformation that a more integrated consumption structure can be expected in the future.
As China has listed regional integration as one of its policy visions in central level decision-making agenda, traditional hinterland regions such as the middle reaches of the Yangtze River starts to receive serious policy attention. Its densely populated cities as well as non-substitutable geographical significance in connecting the surrounding sections of China help to escalate the development of urban agglomeration in this region and the metropolis of Wuhan up to the level national strategy. A series of actions including major regional infrastructure construction for faster transportation and regular regional council meeting to ensure policy coherency have been undertaken to build a more inter-connected region and even provide pivotal support to wider integration along the Yangtze River. As current discrete networks are being gradually extended into overlapping ones in more recent years, cities such as Wuhan and its networked region also starts to reinforce each other in economic development with their national rankings significantly rising. By building broader hinterland for cities, consumption flow is also expected to help sustain Chinese economic development into the future.
Author Contributions
L.W. and W.Y. performed the data analyses, drafted and revised the manuscript; Y.Y, and C.L. contributed equally to data acquisition and design of the study.
Funding
This work was supported by the Major program of the Chinese National Social Science Foundation (No. 18ZDA040); National Science Foundation of China (NSFC) Funded Projects for Distinguished Young Scholars [No. 41501141]; Wuhan University Research Fund for Young Scholar Teams in Humanities & Social Sciences [No. WHU2016024]; Wuhan University Humanities and Social Sciences Independent Research Project [No. 2018QN089].
Acknowledgments
The authors are grateful to the anonymous referees who provided valuable comments and suggestions to significantly improve the quality of the paper.
Conflicts of Interest
The authors declare no conflict of interest.
References
- Howard, E. The Garden City of Tomorrow; The Commercial Press: Beijing, China, 2011. [Google Scholar]
- Geddes, P. Cities in Evolution; Williams & Norgate Ltd.: London, UK, 1915. [Google Scholar]
- Mumford, L. City Development; Harcourt, Brace and Company: New York, NY, USA, 1945. [Google Scholar]
- Christaler, W. Principles of the Central Centre in Southern Germany; The Commercial Press: Beijing, China, 1998. [Google Scholar]
- Gottmann, J. Megalopolis: The Urbanized Northeastern Seaboard of the United States. Econ. Geogr. 1964, 39, 183–184. [Google Scholar]
- Massey, D.S.; Espinosa, K.E. What’s driving Mexico-U.S. migration? A theoretical, empirical, and policy analysis. Am. J. Soc. 1997, 102, 939–999. [Google Scholar] [CrossRef]
- Storper, M. The city: Centre of economic reflexivity. Serv. Ind. J. 1997, 17, 1–27. [Google Scholar] [CrossRef]
- Capello, R. The city network paradigm: Measuring urban network externalities. Urban Stud. 2000, 37, 1925–1945. [Google Scholar] [CrossRef]
- Meijers, E. Polycentric urban regions and the quest for synergy: Is a network of cities more than the sum of the parts? Urban Stud. 2005, 42, 765–781. [Google Scholar] [CrossRef]
- Castells, M. Rise of the Network Society: The Information Age: Economy, Society and Culture; Blackwell Publishers: Oxford, UK, 1996. [Google Scholar]
- Taylor, P.J. Hierarchical tendencies amongst world cities: A global research proposal. Cities 1997, 14, 323–332. [Google Scholar] [CrossRef]
- Hall, P.; Pain, K. The polycentric metropolis: Learning from mega-city regions in Europe. J. Am. Plan. Assoc. 2008, 74, 384–385. [Google Scholar]
- Jin, Z. The network structure of Chinese transnational cities based on enterprise parent-child connection: Taking the connection between Chinese and Korean cities as an example. Geogr. Res. 2010, 29, 1670–1682. [Google Scholar]
- Tang, Z.; Li, T. Comparative study of urban system in the Yangtze River Delta region and the middle reaches of the Yangtze River: An analysis method based on Enterprise Association Network. Urban Plan. Forum 2014. [Google Scholar] [CrossRef]
- Huang, J.; Zhong, Y. Railway passenger transport connections and their spatial pattern evolution in urban agglomerations in the middle reaches of the Yangtze River. World Reg. Study 2016, 25, 72–81. [Google Scholar]
- Wang, H.; Miao, C.; Niu, H.; Yuan, Z. Passenger transport connection and its spatial pattern in central cities of China. Geogr. Res. 2016, 35, 745–756. [Google Scholar]
- Zhu, H. Research on Chinese urban functional network based on air passenger flow. Econ. Geogr. 2014, 34, 59–63. [Google Scholar]
- Lao, X.; Shen, T.; Yang, Y.; Zhang, Y. Study on the measurement of economic linkages of urban agglomerations in the middle reaches of the Yangtze River: A Social Network Analysis based on Gravity Model. Urban Stud. 2016, 23, 91–98. [Google Scholar]
- Wang, M.; Gao, F. Spatial logic of the network: Interpretation of changes in the world urban system in the information age. Urban Plan. Int. 2007, 22, 36–41. [Google Scholar]
- Zhen, F.; Wang, B.; Chen, Y. The characteristics of China’s urban network based on cyber social space: A case study of Sina Weibo. Acta Geogr. 2012, 67, 1031–1043. [Google Scholar]
- Xi, G.; Zhen, F.; Zhang, M.; Yin, G.; Jiang, J. Study on the spatial-temporal evolution of network consumption and the characteristics of regional linkages: A case study of Jingdong mall. Sci. Geogr. Sin. 2015, 35, 1372–1380. [Google Scholar]
- Deng, C.; Song, X.; Xie, B.; Li, M.; Zhong, X. Analysis of network connections in the middle reaches of Yangtze River urban agglomeration based on Baidu Tieba data. Geogr. Res. 2018, 37, 1181–1192. [Google Scholar]
- Zhou, C.; Gang, Z.; Zhong, X. Research on China’s urban innovation network structure and innovation capability. Geogr. Res. 2017, 36, 1297–1308. [Google Scholar]
- Clark, T. The City as an Entertainment Machine; Elsevier: Amsterdam, The Netherlands, 2010. [Google Scholar]
- Glaeser, E.L. Triumph of the city. Pan Macmillan 2012, 5, 97–100. [Google Scholar]
- Zhao, Y.; Zhang, J. Research on urban consumption transformation in China. Mod. Urban Res. 2010, 25, 19–24. [Google Scholar]
- Tia, Q.; Ma, J.; Gao, T. Analysis of regional differences in influencing factors of urban residents’ consumption in China. Manag. World 2008. [Google Scholar] [CrossRef]
- Jiao, Z. Research on spatial distribution and spatial correlation of urban consumption in China. Econ. Geogr. 2013, 33, 41–46. [Google Scholar]
- Wang, N. Local consumptionism, urban comfort and industrial structure optimization: Industrial transformation and upgrading from the perspective of consumption sociology. Soc. Stud. 2014, 24–48. [Google Scholar]
- Riddell, J.B.; Harvey, M.E. The Urban System in the Migration Process: An Evaluation of Step-Wise Migration in Sierra Leone. Econ. Geogr. 1972, 48, 14. [Google Scholar] [CrossRef]
Figure 1.
Consumption situation of urban agglomeration in the middle reaches of the Yangtze River in 2016.
Figure 1.
Consumption situation of urban agglomeration in the middle reaches of the Yangtze River in 2016.

Figure 2.
The centrality of consumption network of the middle reaches of the Yangtze River.

Source: Using data of the China UnionPay credit and debit card consumption transaction records; the results were obtained by the UCINET network analysis integration software.
Figure 3.
The consumption characteristics of top 10 cities in the middle reaches of the Yangtze River.
Figure 3.
The consumption characteristics of top 10 cities in the middle reaches of the Yangtze River.

Source: Using data of the China UnionPay credit and debit card consumption transaction records; the results of D-Value were derived from the differences between OCF and ICF.
Figure 4.
Consumption spatial linkage of urban agglomeration in the middle reaches of the Yangtze River.
Figure 4.
Consumption spatial linkage of urban agglomeration in the middle reaches of the Yangtze River.

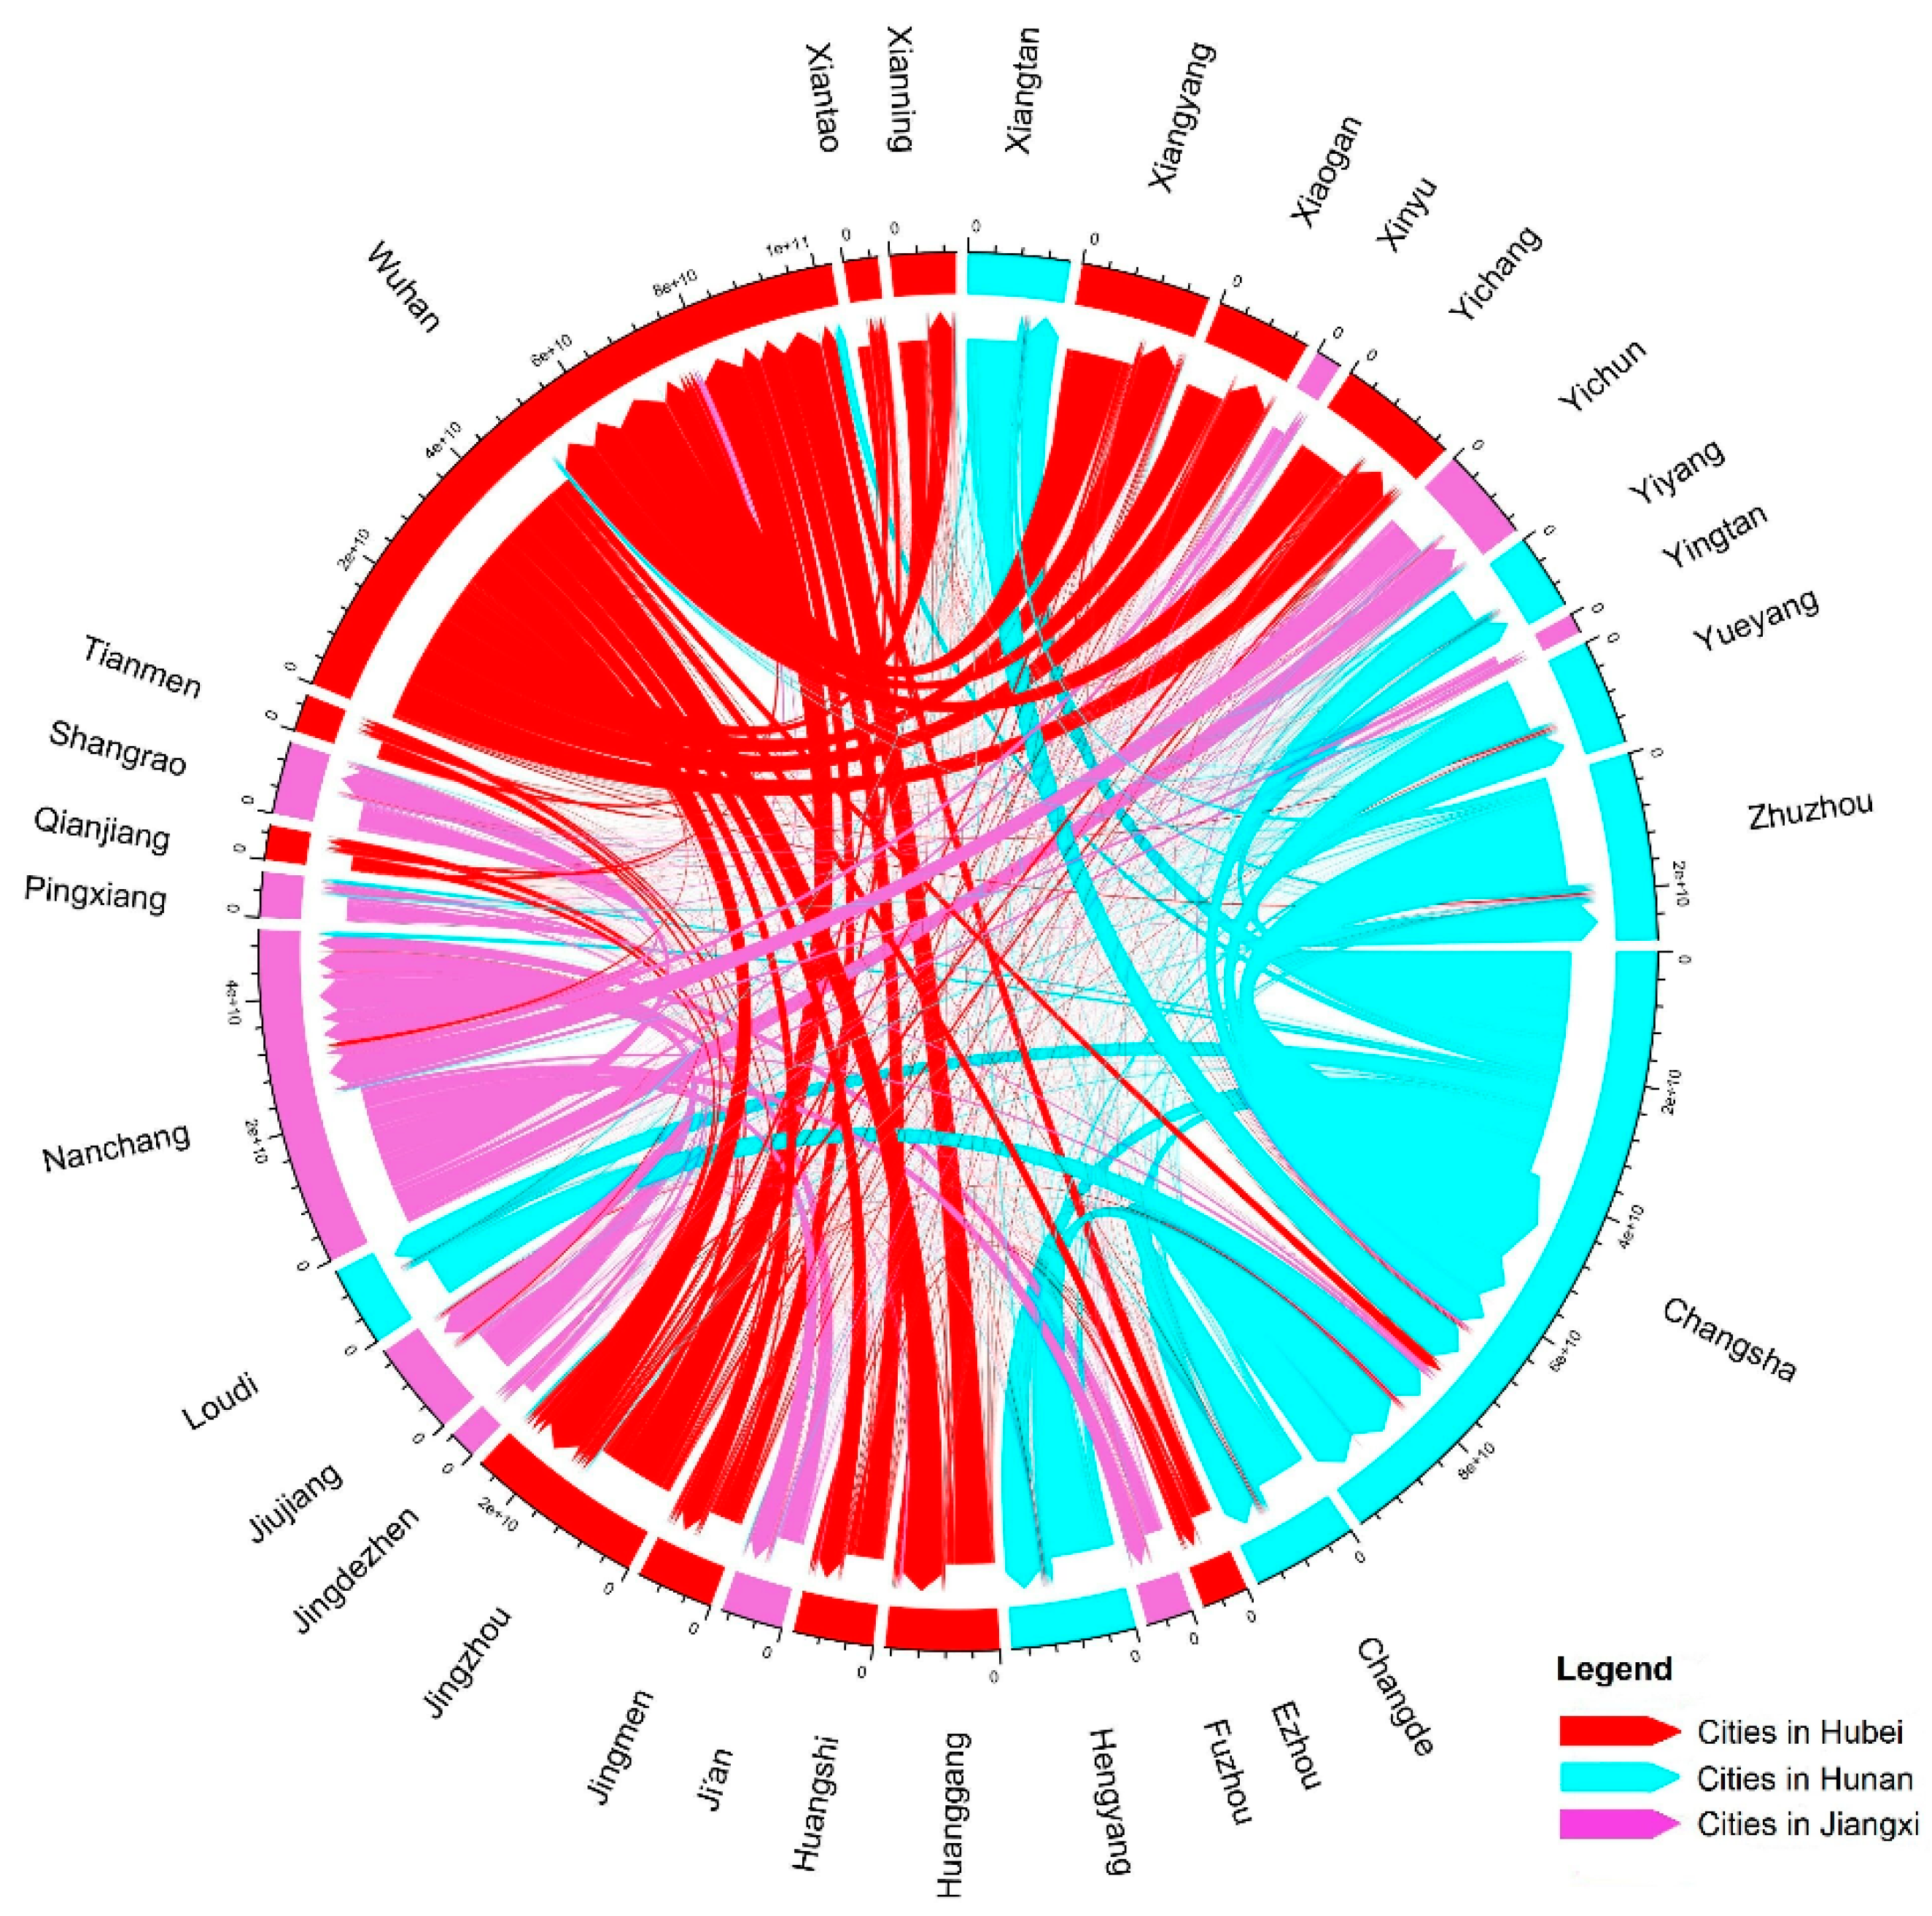
Figure 5.
Chord graph of consumption flows of cities in the middle reaches of the Yangtze River.

Figure 6.
The largest consumption flows of urban agglomeration in the middle reaches of the Yangtze River.
Figure 6.
The largest consumption flows of urban agglomeration in the middle reaches of the Yangtze River.

Figure 7.
Second largest consumption flows of urban agglomeration in the middle reaches of the Yangtze River.
Figure 7.
Second largest consumption flows of urban agglomeration in the middle reaches of the Yangtze River.


Table 1.
Hierarchical structure of consumption network of the middle reaches of the Yangtze River.
| Consumption Network Level | City Type | City |
|---|---|---|
| First level | Locally dominant city | Wuhan, Changsha, Nanchang |
| Second level | Local sub-dominant city | Jingzhou, Zhuzhou, Shangrao |
| Third level | Subordinate city | Hubei province: Xiaogan, Huangshi, Huanggang, Ezhou, Jingmen, Tianmen, Xiantao, Qianjiang, Xianning, Xiangyang, Yichang; Hunan province: Changde, Hengyang, Xiangtan, Yiyang, Loudi, Yueyang; Jiangxi province: Jingdezhen, Yingtan, Fuzhou, Jiujiang, Yichun, Xinyu, Pingxiang, Ji’an |
Table 2.
Network cohesive subgroup analysis of the urban agglomeration in the middle reaches of the Yangtze River.
Table 2.
Network cohesive subgroup analysis of the urban agglomeration in the middle reaches of the Yangtze River.
| Cohesive Subgroup | 1 | 2 | 3 | 4 | 5 | 6 | 7 | 8 |
|---|---|---|---|---|---|---|---|---|
| 1. Changsha-Zhuzhou | 1.00 | 1.00 | 0.13 | 0.50 | 1.00 | 0.00 | 0.21 | 0.50 |
| 2. Loudi-Xiangtan-Hengyang-Yiyang | 1.00 | 0.75 | 0.00 | 0.00 | 0.75 | 0.00 | 0.00 | 0.08 |
| 3. Yingtan-Fuzhou-Ji’an-Jingdezhen | 0.13 | 0.00 | 0.08 | 0.54 | 0.00 | 0.00 | 0.00 | 0.00 |
| 4. Xinyu-Yichun-Shangrao-Nanchang-Jiujiang-Pingxiang | 0.58 | 0.00 | 0.63 | 0.77 | 0.00 | 0.00 | 0.02 | 0.17 |
| 5. Changde-Yueyang | 1.00 | 0.75 | 0.00 | 0.00 | 1.00 | 0.00 | 0.00 | 0.67 |
| 6. Tianmen-Xiantao-Qianjiang | 0.00 | 0.00 | 0.00 | 0.00 | 0.00 | 0.33 | 0.00 | 0.78 |
| 7. Yichang-Xiaogan-Ezhou-Xianning-Huangshi-Huanggang-Pangyang | 0.29 | 0.00 | 0.00 | 0.02 | 0.00 | 0.00 | 0.69 | 0.81 |
| 8. Jingzhou-Wuhan-Jingmen | 0.50 | 0.08 | 0.00 | 0.11 | 0.67 | 0.78 | 0.71 | 1.00 |
Source: Using data of the China UnionPay credit and debit card consumption transaction records; the results were obtained by the UCINET network analysis integration software.
© 2019 by the authors. Licensee MDPI, Basel, Switzerland. This article is an open access article distributed under the terms and conditions of the Creative Commons Attribution (CC BY) license (http://creativecommons.org/licenses/by/4.0/).
Share and Cite
MDPI and ACS Style
Wang, L.; Yang, W.; Yuan, Y.; Liu, C. Interurban Consumption Flows of Urban Agglomeration in the Middle Reaches of the Yangtze River: A Network Approach. Sustainability 2019, 11, 268. https://doi.org/10.3390/su11010268
AMA Style
Wang L, Yang W, Yuan Y, Liu C. Interurban Consumption Flows of Urban Agglomeration in the Middle Reaches of the Yangtze River: A Network Approach. Sustainability. 2019; 11(1):268. https://doi.org/10.3390/su11010268
Chicago/Turabian StyleWang, Lei, Wenyi Yang, Yueyun Yuan, and Chengliang Liu. 2019. "Interurban Consumption Flows of Urban Agglomeration in the Middle Reaches of the Yangtze River: A Network Approach" Sustainability 11, no. 1: 268. https://doi.org/10.3390/su11010268
Note that from the first issue of 2016, this journal uses article numbers instead of page numbers. See further details here.