Assessment of the Effects of Climate Change on Evapotranspiration with an Improved Elasticity Method in a Nonhumid Area


1
Institute of Soil and Water Conservation, Northwest A&F University, Yangling 712100, China
2
College of Water Resources and Architectural Engineering, Northwest A&F University, Yangling 712100, China
3
Department of Watershed Sciences, Utah State University, Logan, UT 84322, USA
4
National Engineering Research Center of Water Saving and Irrigation Technology at Yangling, Yangling 712100, China
5
Biosphere 2, University of Arizona, Tucson, AZ 85623, USA
6
Department of Hydrology and Water Resources, University of Arizona, Tucson, AZ 85721, USA
*
Authors to whom correspondence should be addressed.
Sustainability 2018, 10(12), 4589; https://doi.org/10.3390/su10124589
Submission received: 30 October 2018
/
Revised: 29 November 2018
/
Accepted: 1 December 2018
/
Published: 4 December 2018
(This article belongs to the Special Issue Assessment, Mitigation and Restoration of Ecosystems in a Changing World)
Abstract
:Climatic elasticity is a crucial metric to assess the hydrological influence of climate change. Based on the Budyko equation, this study performed an analytical derivation of the climatic elasticity of evapotranspiration (ET). With this derived elasticity, it is possible to quantitatively separate the impacts of precipitation, air temperature, net radiation, relative humidity, and wind speed on ET in a watershed. This method was applied in the Wuding River Watershed (WRW), located in the center of the Yellow River Watershed of China. The estimated rate of change in ET caused by climatic variables is −10.69 mm/decade, which is close to the rate of change in ET (−8.06 mm/decade) derived from observable data. The accurate estimation with the elasticity method demonstrates its reliability. Our analysis shows that ET in the WRW had a significant downward trend, but the ET ratio in the WRW has increased continually over the past 52 years. Decreasing precipitation is the first-order cause for the reduction of ET, and decreasing net radiation is the secondary cause. Weakening wind speed also contributed to this reduction. In contrast, regional warming led to an increase in ET that partly offset the negative contributions from other climatic variables. Moreover, reforestation can affect the energy budget of a watershed by decreasing albedo, compensating for the negative influence of global dimming. The integrated effect from precipitation and temperature can affect the energy budget of a watershed by causing a large fluctuation in winter albedo.
1. Introduction
Climate change has brought about profound influences on global and regional environments [1,2,3]. Hydrological processes are one of the aspects most easily affected by climate change [4,5]. Assessing the hydrological effects of climate change is meaningful to water resource management and environmental construction [6,7]. Numerous studies have shown various effects of climate change on different components of hydrological processes [8,9,10]. Evapotranspiration () is a fundamental process in the hydrometeorological system and a hub in Earth’s planetary energy budget and water cycle [11]. Accounting for approximately 65% of annual precipitation and 60% of net radiation over land, ET dynamics can directly affect water resource availability in a region, especially in nonhumid areas [12] (p. 195). In such areas, small variations in climatic variables (e.g., precipitation) can easily result in large disturbances in hydrological processes [13,14]. In addition, ET is closely related to drought in nonhumid areas [15,16].
Because of the importance of ET, it is necessary to quantitatively assess changes in ET in response to given changes in climatic variables. Modeling techniques have been adopted to address this kind of question [17,18,19]. Based on the Budyko equation, in which ET in a watershed is determined mainly by the available energy and water supply [20,21], various methods have been proposed [22,23,24]. One common method, an elasticity method based on the Budyko equation, has been applied to assess the hydrological effect of climate change in numerous studies [25,26,27]. With simplified parameters and a clear physical theoretical foundation, these methods have achieved in-depth understanding of the mechanism by which climate change affects hydrological processes. However, limitations still exist for applications of the elasticity method, which assumes that water storage does not change in a watershed over an application period. This assumption is often very difficult to satisfy due to the lack of sufficient observations, and this method is usually used at an annual timescale, which makes it hard to attain a water balance status [28].
Most studies utilize the elasticity method to investigate climatic elasticity related to pan evapotranspiration or potential evapotranspiration [29,30,31]. Due to the lack of observable ET data or credible ET products, this method is limited in its ability to assess climatic elasticity of ET. Several studies have focused merely on the effects of precipitation, potential evapotranspiration, and temperature on ET [32,33]. However, other climatic variables besides precipitation and temperature are undergoing significant change as well [34,35], and these could also have some effect on ET. Thus, an assessment including different climatic variables is necessary to study the comprehensive influence of climate change on ET.
In consideration of the above problems, the objective of this study is to assess and separate the effects of different climatic variables on ET. First, we derive the climatic elasticity of ET related to precipitation and based on the Budyko equation, particularly as it meets its water balance assumption. Second, we describe the change in as a function of changes in net radiation, relative humidity, air temperature, and wind speed. Finally, we describe the change in ET as a function of precipitation, net radiation, relative humidity, air temperature, and wind speed, to further separate the contribution from each climatic variable.
2. Methods and Materials
2.1. The Elasticity Method Based on the Budyko Equation
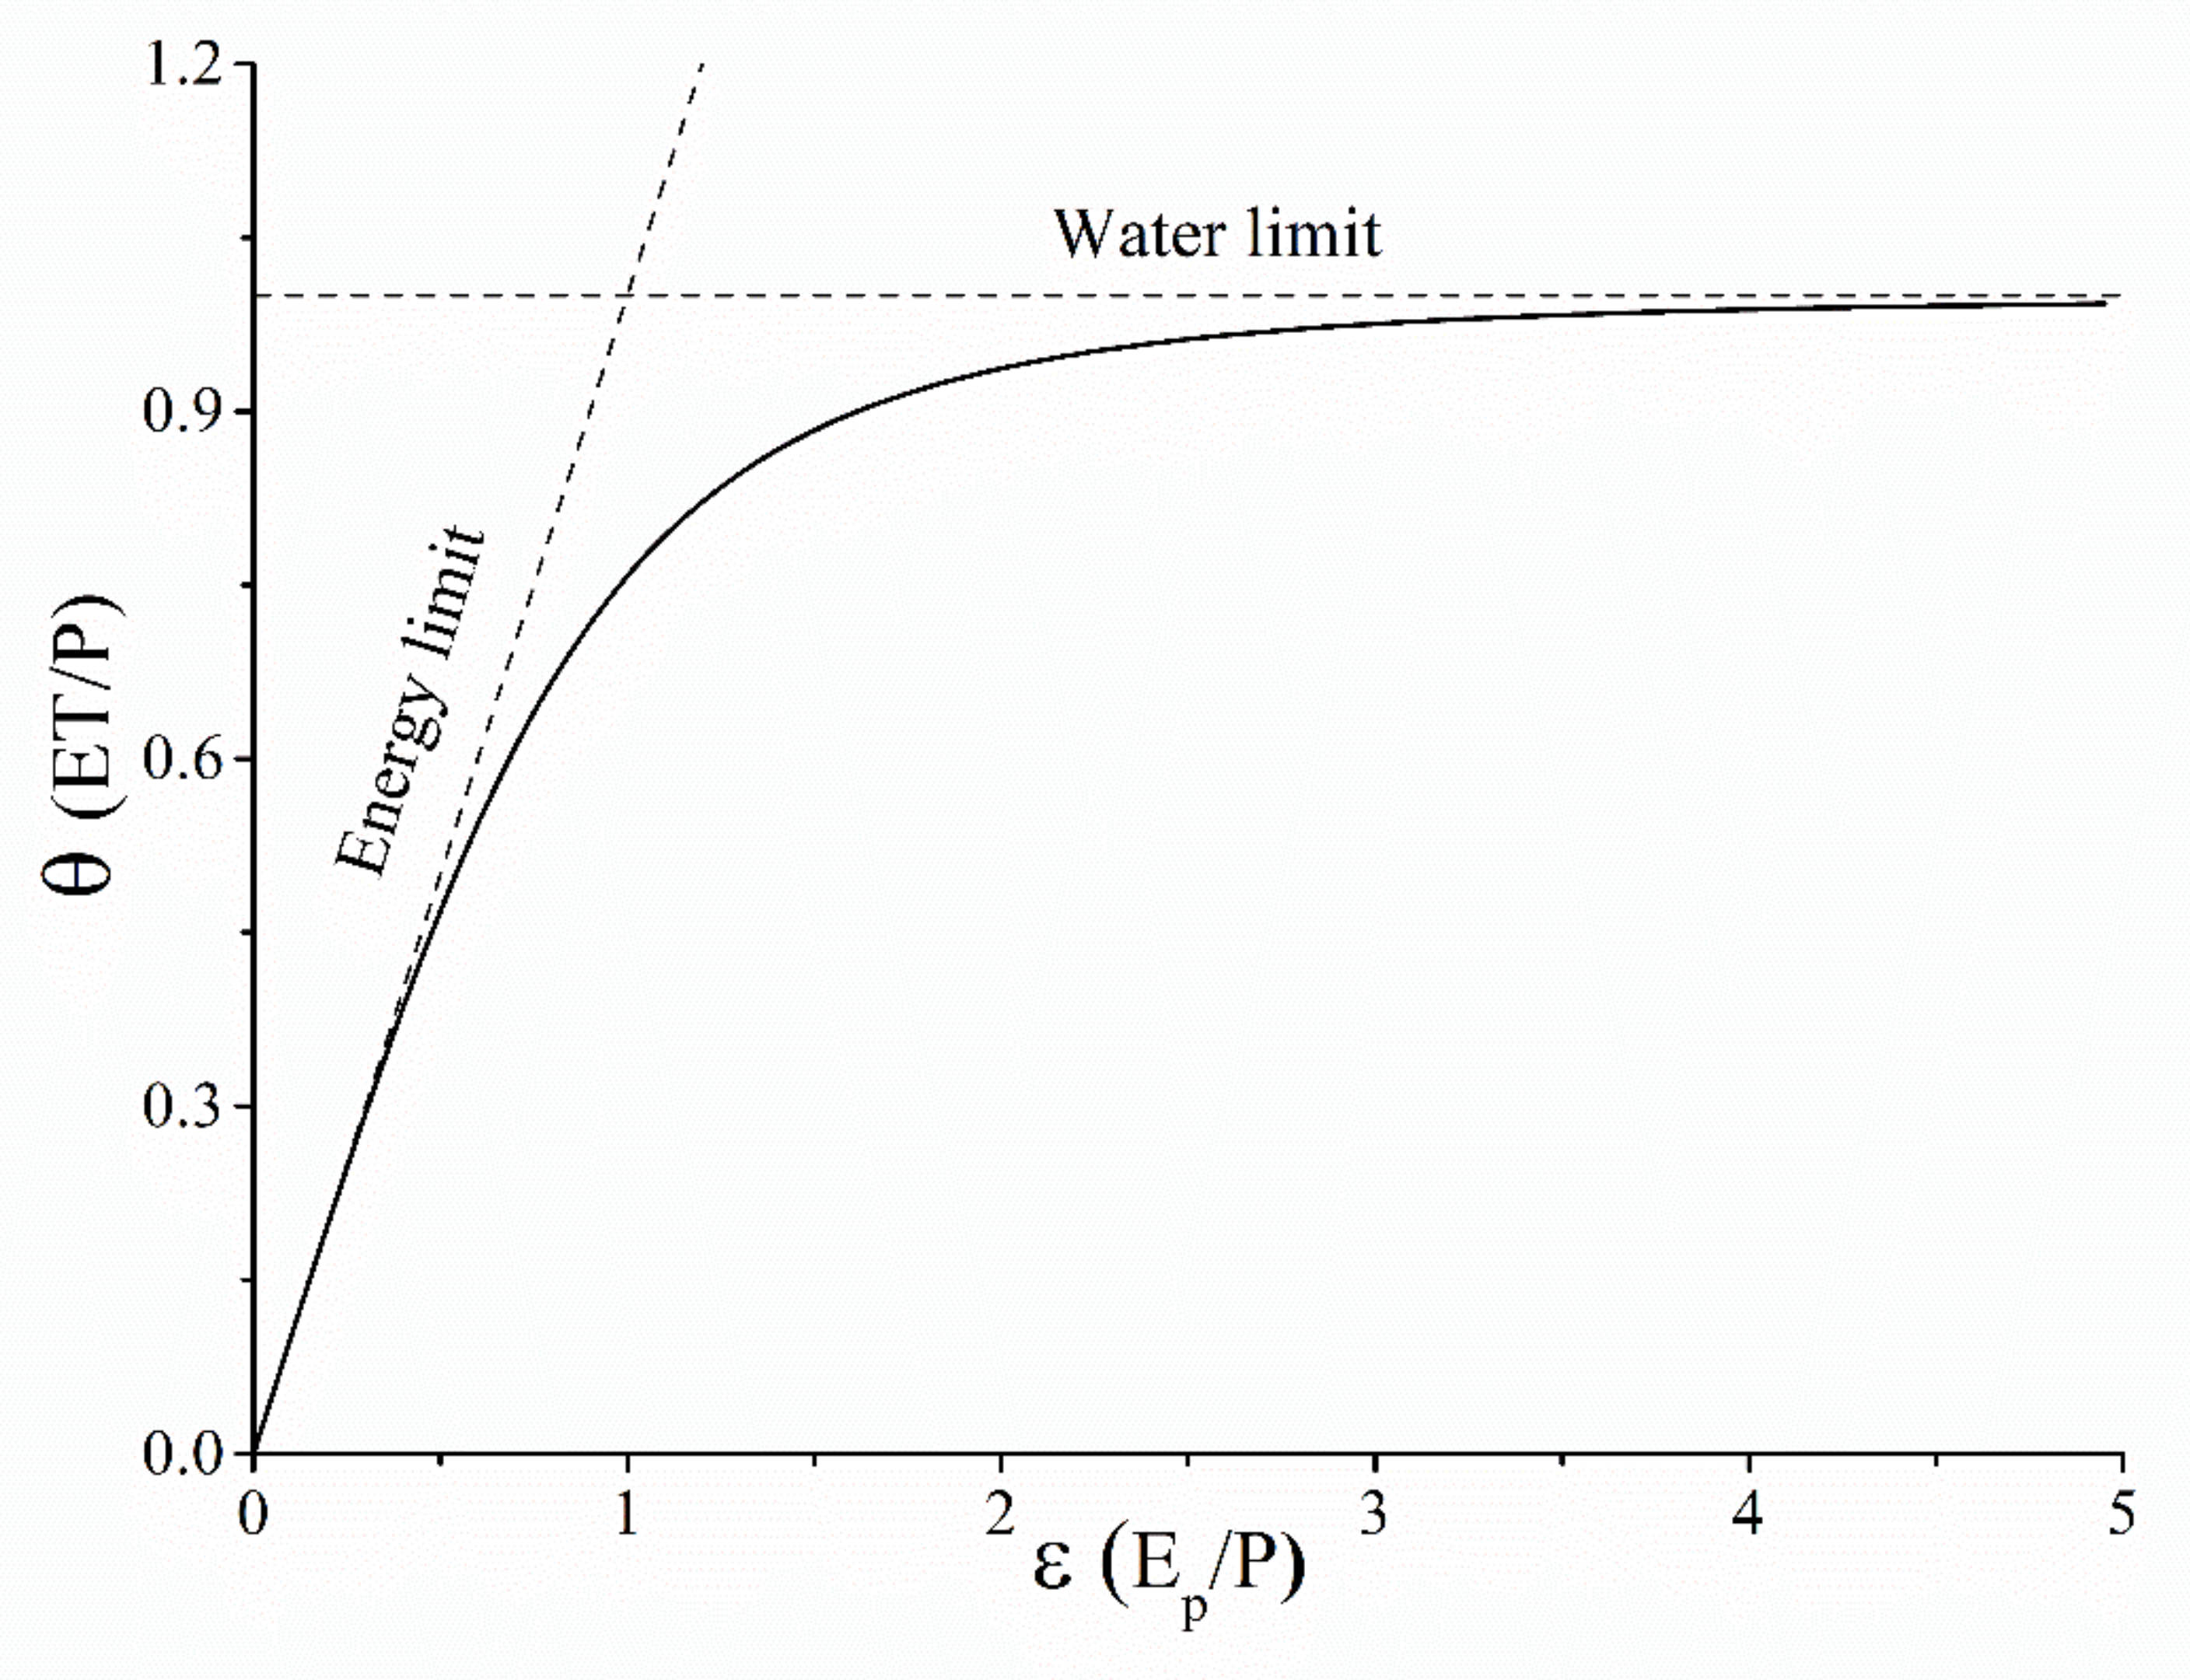
The Budyko equation describes how precipitation () is partitioned into and runoff () in a watershed, assuming that changes in water storage are negligible over the long term [20,21]. The ET ratio (), the ratio of ET to precipitation, is controlled principally by the aridity index (), the ratio of potential evapotranspiration to precipitation, on a long-term timescale. For humid watersheds (), is controlled predominantly by the energy supply (), while for nonhumid watersheds (), it is controlled mainly by the water supply (), as shown in Figure 1. Different functional forms of the Budyko equation have been developed by many researchers [27,29,32]. One of the most widely used forms, the Choudhury–Yang framework (CY hereafter), was selected for this study [33,36]. , , and were used as inputs for the CY framework:
where is the Budyko parameter that represents the average state of watershed characteristics.
Based on Equation (1), the climatic elasticity of can be obtained:
The terms in parentheses in Equation (2) are called elasticities.
where and are elasticities related to and .
Similarly, the impact of climatic variables on can be estimated:
The terms in the parentheses below are called climatic elasticities of
Equation (5) can be simplified as:
where , , , are elasticities of related to , , , and .
Substituting Equation (6) into Equation (3), the climatic elasticities of can be derived:
where the climatic elasticity of can be calculated with mean annual values of climatic variables (, , , , , ).
2.2. Calculation of
In this study, was estimated with the Penman–Monteith method recommended by the Food and Agriculture Organization (FAO) of the United Nations in its Irrigation and Drainage Paper No. 56 (FAO56-PM) [37]. The equation of this method is expressed as:
where is the daily potential evapotranspiration (mm day−1), is the air temperature at 2 m height (°C), is the net radiation at the surface of vegetation (MJ m−2 day−1), is the soil heat flux density (MJ m−2 day−1), is the wind speed at 2 m height (m s−1), is the saturation vapor pressure (kPa), is the actual vapor pressure (kPa), is the slope of the saturation vapor pressure–temperature curve (kPa °C−1), and is the psychrometric constant (kPa °C−1).
The meteorological parameters used to calculate in this study include air temperature, relative humidity, wind speed, and sunshine duration. These daily data were obtained from 12 meteorological stations. Using air temperature data, was determined with the equation for the relationship between saturation vapor pressure and air temperature, and was also computed. was calculated from the relative humidity data. The daily wind speed data measured at 10 m height were transformed to . Because there were no radiation stations within the study area, the two coefficients in the Angstrom formula were regressed from observed solar radiation data to calculate solar radiation [37]. These observed data were obtained from the closest radiation station outside the study area. With these two coefficients, the solar radiation was calculated from the observations of sunshine duration.
2.3. Study Area
With a total area of 0.64 million km2 and a population of 104.2 million, the Loess Plateau plays an essential role in the social development of China [38]. As this area has the most severe soil erosion in the world, the government puts a lot of effort into controlling soil erosion and improving the environment, while simultaneously maintaining economic growth. Meanwhile, this water-limited, environmentally fragile area is vulnerable to climate change at different spatiotemporal scales [39]. The development of society and climate change has produced a large burden on the water resources of this area. For this study, a typical watershed in the Loess Plateau, the Wuding River Watershed (WRW), was selected to investigate how and why ET changes in the past 52 years as the climate (Figure 2).
Covering an area of approximately 30,261 km2, the WRW, located at 37.04°–39.03° N and 108.04°–110.57° E, is in the center of the Loess Plateau in China. The Wuding River is a first-order tributary of the Yellow River (Figure 2). Streamflow data for this study came from the Baijiachuan gauge, which is located 100 km upstream from the outlet of the WRW and has a drainage area accounting for 98% of the WRW. The WRW is in the arid and semi-arid temperate continental climate zone, with average annual precipitation of 405 mm, mean annual temperature of 8.0 °C, and potential evaporation of 1007 mm, based on the period 1960–2011. The WRW is affected by the East Asian monsoon, and about 75% of the annual rainfall occurs from June through September and is characterized by a significant number of heavy rain events [40]. The topography is a typical loess hilly/gullied landscape with elevation ranging from 579 m to 1824 m.
2.4. Data Sources
2.4.1. Hydro-Meteorological Data
Monthly streamflow data from gauges located in the main stream and first-order tributaries in the WRW were obtained from the Yellow River Hydrological Bureau. Only data covering at least 50 years were used in this study; data from eight stations met this criterion. Thus, all streamflow data used in this study covered the period 1960–2011. For this period, daily meteorological data from 12 stations in and around the WRW were obtained from the National Meteorological Information Center, China Meteorological Administration (http://data.cma.cn/). These meteorological data included precipitation, air temperature, relative humidity, wind speed, solar radiation, and sunshine duration. We used the nonparametric Mann–Kendall (MK) test to detect the significance of temporal trends with a 95% confidence interval [41].
2.4.2. Satellite Remote Sensing Data
Monthly ET data over the past 30 years (1982–2011), generated by the Max Planck Institute for Biogeochemistry [11], were employed to study the relationship between ET and precipitation. These ET data were used to verify the ET derived from the water balance equation in this study. The ET data were produced by upscaling the high-quality ET observation data from the current global network of eddy covariance towers (FLUXNET), using a machine-learning algorithm called the model tree ensemble (MTE) [42]. The MTE constructed a set of different tree structures that were used jointly for decision trees. This ensemble method has been shown to outperform the single-tree method that independently presents recursive stratification [43]. The MTE was trained with geospatial information from satellite remote sensing and surface meteorological data. This ET product from the Max Planck Institute has been extensively used for ET studies at global and regional scales [44,45]. Hereafter it is referred to as .
The latest GRACE (Gravity Recovery & Climate Experiment) data, JPL-RL05.1, provided by the JPL (Jet Propulsion Laboratory, Pasadena, CA, USA) of NASA (National Aeronautics and Space Administration, Washington, DC, USA), were used to explore the terrestrial water storage change in this study [46]. These data cover the period from 2002 to 2011 at monthly time steps.
To analyze the relationship between vegetation and ET, this study selected the Global Inventory Modeling and Mapping Studies NDVI (Normalized Difference Vegetation Index) 3rd generation dataset (NDVI3g) for the WRW [47]. The NDVI3g covers the period from 1982 to 2011 at a 0.083 degree spatial resolution and a semi-monthly time step, consistent with other NDVI products. The maximum value composite method was used to obtain the monthly and annual NDVI values [48].
To probe the change in albedo in the study area, an albedo product called the Global Land Surface Satellite for the period of 1981 through 2011 was obtained from the Global Land Cover Facility at the University of Maryland [49] (p. 159). Furthermore, MODIS (Moderate Resolution Imaging Spectroradiometer) snow cover data obtained from NASA were utilized in this study.
3. Results
3.1. Temporal Change in Precipitation
Precipitation has a considerable effect on ET in a watershed, especially in nonhumid areas. A clear understanding of precipitation change is one of the prerequisites to assessing its influence on ET. An anomaly of annual precipitation over the period of 1960 through 2011 in the WRW is shown in Figure 3. It is noticeable that starting in the 1980s, the negative anomaly (red bars) became more frequent than the positive anomaly (blue bars), indicating more frequent drought in the WRW. The magnitude and duration of the continuous negative anomaly years became larger and longer as well. In addition, precipitation in the WRW had a downward trend (dashed line) of 13 mm per decade over the past 52 years, although it failed to pass the MK test at the 95% confidence interval.
Decreasing precipitation and longer-lasting and higher-intensity drought can affect the hydrological processes in this nonhumid watershed at different levels, especially for ET, accounting for most of the total precipitation. For a preliminary exploration of the impact of precipitation change on ET, an independent ET dataset () [11] covering the period 1982–2011 was used to obtain the relationship between them. The R-squared values of correlation coefficients between precipitation and ET for 1982–1996 (first 15 years) and 1997–2011 (second 15 years) are 0.48 (p < 0.001) and 0.23 (p < 0.001), respectively, implying a weakening dominant impact of precipitation on ET. Therefore, it is necessary to quantitatively assess the response of ET to change in precipitation.
3.2. Temporal Change in
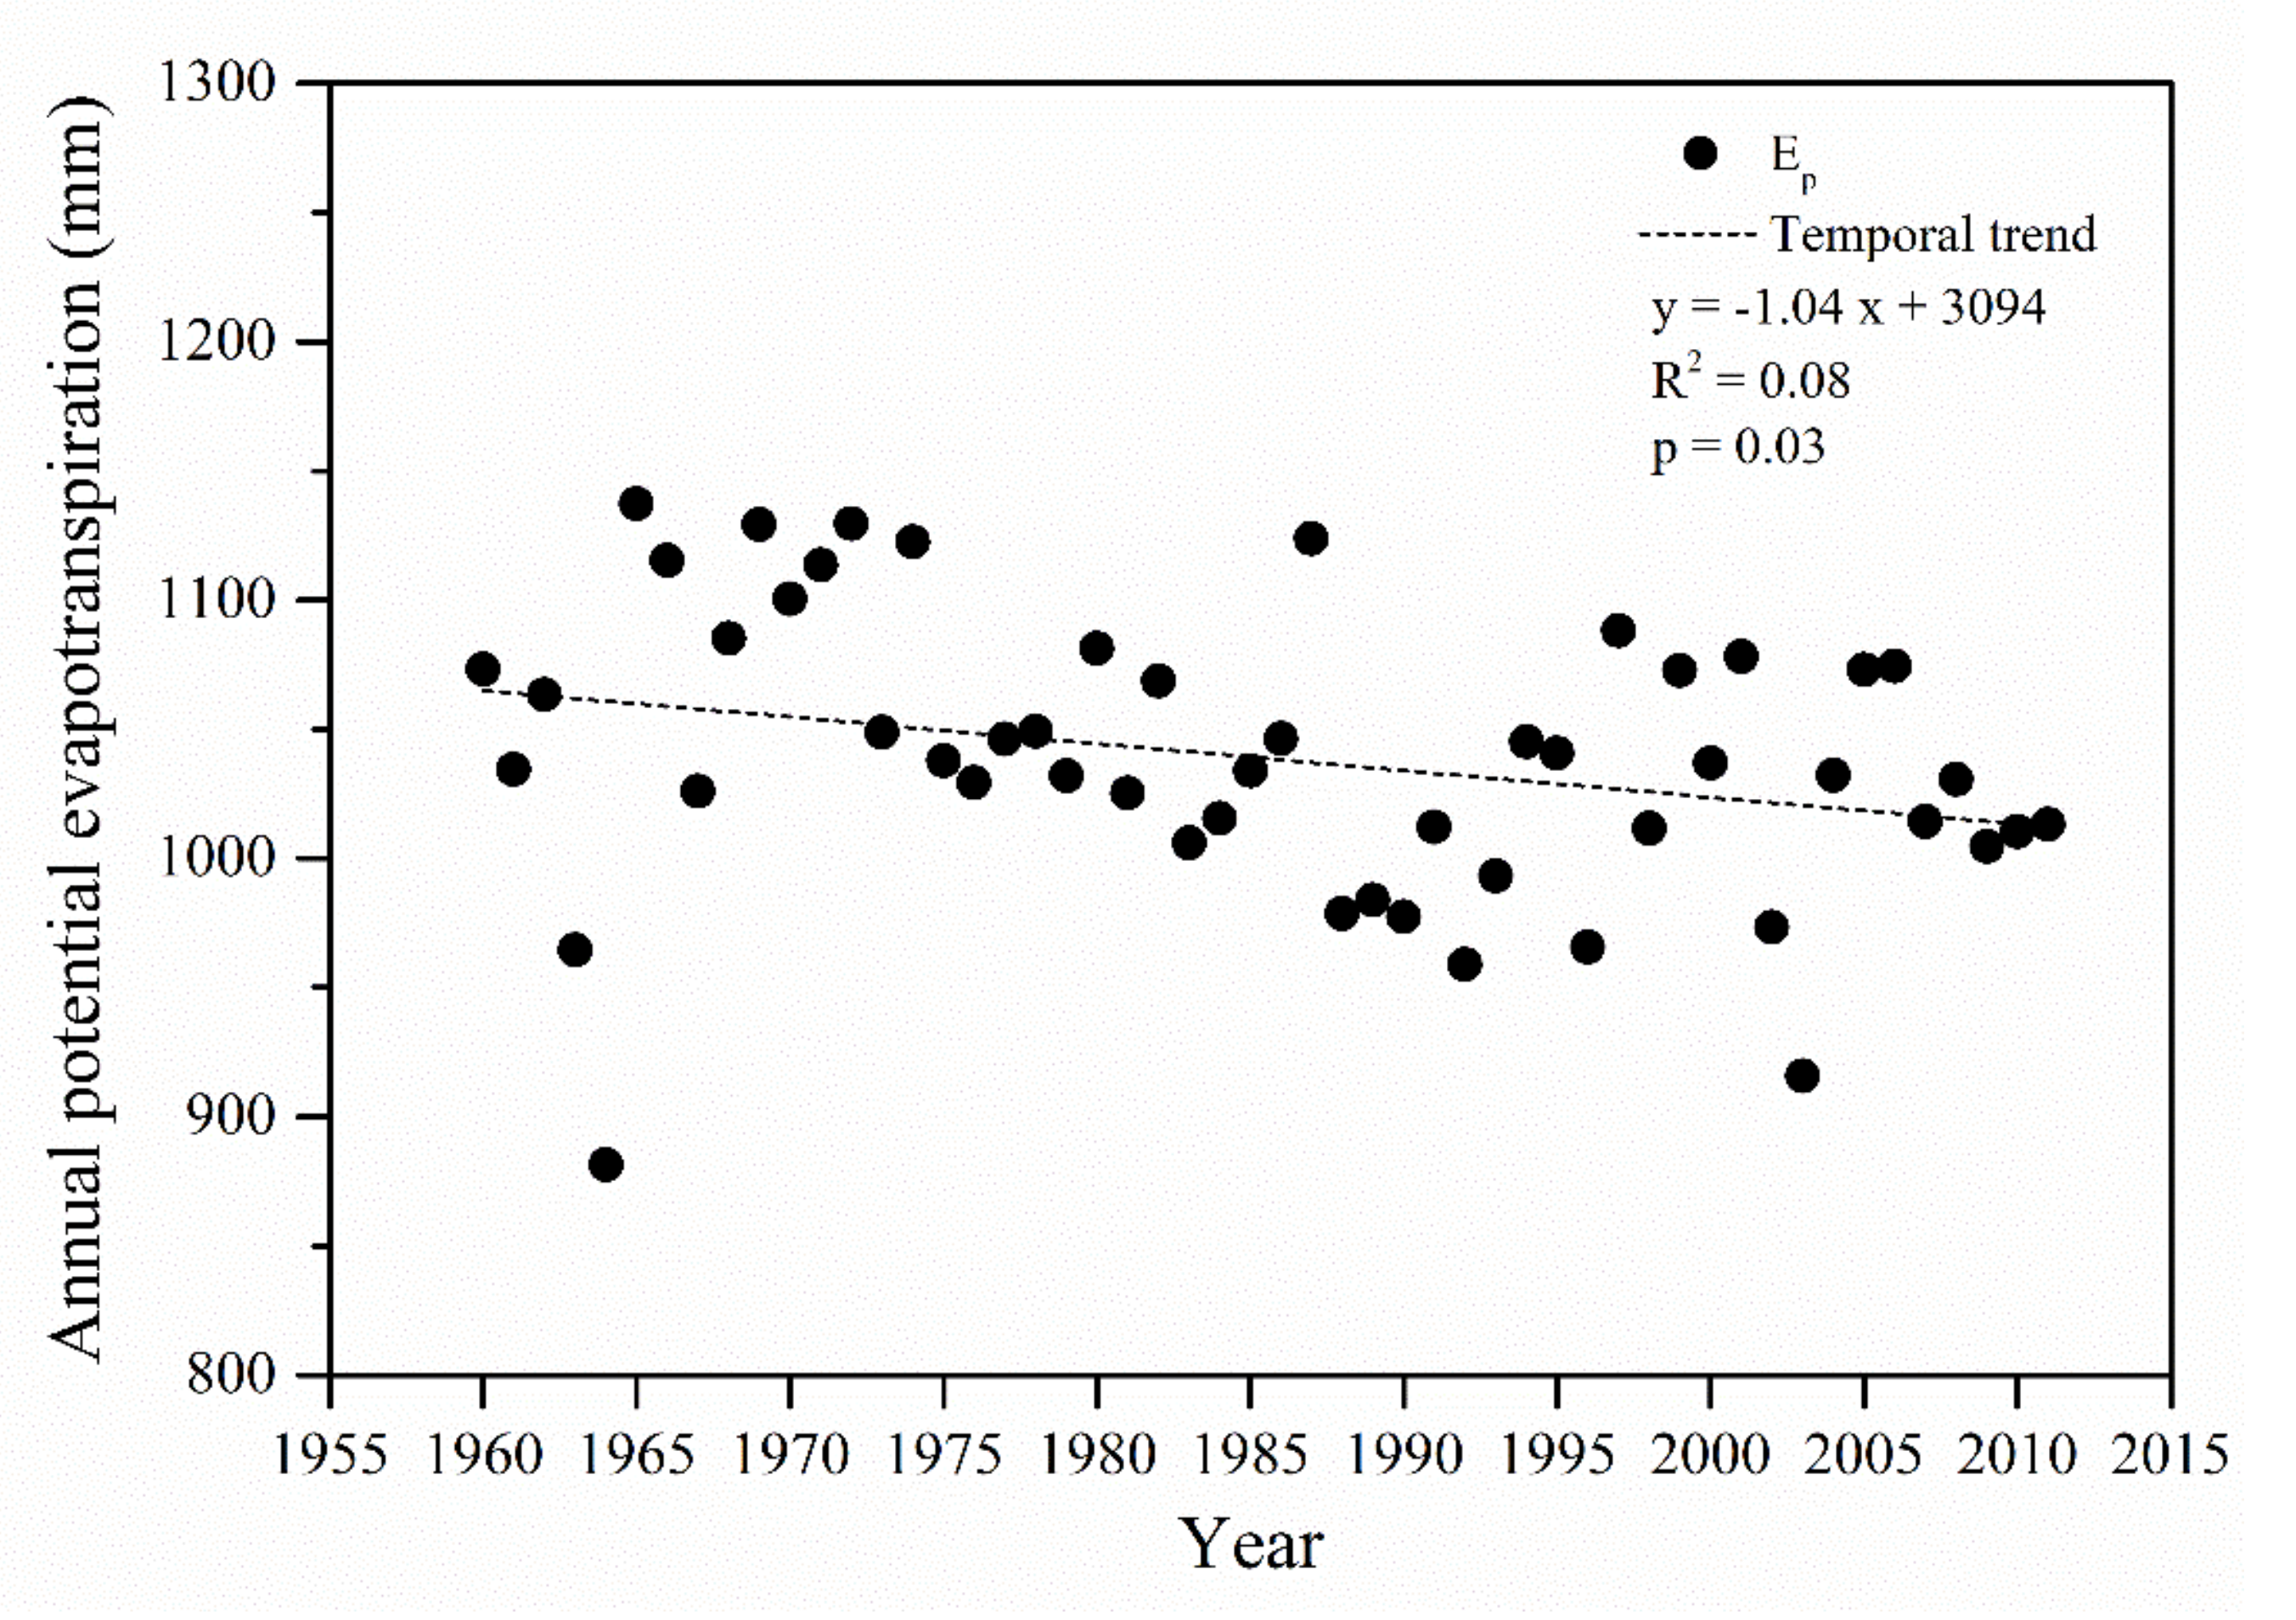
represents the energy supply that maintains the ET in a watershed under the Budyko equation. Climate change causes redistribution in different components of the energy budget in a watershed, which induces changes in and ET. The temporal variation of annual is shown in Figure 4. Annual showed a significant downward trend at the 95% confidence interval in the MK trend test, and a decline of 10 mm per decade over the past 52 years. Moreover, the analysis of the annual cycle demonstrates that declines occurred mainly from May to September, ranging from 6% to 10%. These inter- and intra-annual variations imply that the energy received by the WRW has decreased in the past years, which would exert a profound impact on the water–energy relationship and ET in the WRW.
The Budyko equation essentially reveals the relationship between the aridity index and the ET ratio . Considering the abovementioned remarkable changes in precipitation and , the variation of the aridity index in the WRW was additionally analyzed in this study. The aridity index shows an upward trend in the WRW in the past, indicating a drought trend consistent with previous research [3,40,48]. Furthermore, there is a significant inverse relationship between and precipitation, with an R-squared correlation coefficient of 0.25 (p < 0.001). Combined with the positive relationship between ET and precipitation, the mutual relationships among ET, , and precipitation in the WRW demonstrate the complementarity between ET and , which has been revealed by observational and theoretical studies [22,50,51].
3.3. Elasticity Analysis of Change
change is a result of comprehensive effects from various climatic variables [22,50]. The climatic variables used to derive in this study include air temperature, wind, relative humidity, and net radiation, all of which were obtained from or based on site observations. Variations in these climatic variables reflect different aspects of climate change in a watershed. An investigation of the alterations in these climatic variables would give an in-depth interpretation of the significant change in and ET. Figure 5 shows the temporal series of annual mean air temperature, wind speed, mean relative humidity, and net radiation. A significant upward trend was detected in mean air temperature in the WRW over the past 52 years, using the MK trend test (95% confidence level). This remarkable trend (0.3 °C per decade) is five times the global average temperature change [52], indicating a strong influence from climate change on the hydrological processes in the WRW. In contrast, wind speed, mean relative humidity, and net radiation showed significant downward trends, passing through the MK trend test at the 95% confidence level. Trends of these three variables are 0.06 m/s per decade, 0.7% per decade, and 0.2 MJ/m2 per decade, respectively.
Because significant changes have occurred in these climatic variables related to , it was necessary to assess their impact on . With the elasticity method, these variables are shown in descending order of degree of elasticities related to them: net radiation (0.61), mean air temperature (0.28), wind speed (0.22), and mean relative humidity (−0.49). The elasticity analysis indicates that the decrease in net radiation is the main reason for the notable reduction in in the WRW. Global dimming [53,54] is the direct driving force for the net radiation decrease, considering the significant downward trend in the observable sunshine duration in the WRW. Weakening wind is the secondary cause for the reduction in . In contrast, the change in mean air temperature and mean relative humidity neutralize the decreasing to a certain extent.
3.4. Temporal Variation of ET
ET is an important component in hydrological processes, especially in nonhumid areas, and it occupies a large portion of the limited water supply (precipitation). The water supply (precipitation) and energy supply () together shape the ET in a watershed. Considering the remarkable changes in precipitation and in the WRW, it is necessary to investigate the change in ET. In this study, we considered the watershed to attain a water balance status of approximately 13 years on a long-term timescale [32]. Thus, ET was derived by the water balance equation using a moving average method with a moving length of 13 years. The precipitation and streamflow data used to derive ET were obtained from observations.
Figure 6a shows the temporal change in ET in the WRW. There was a significant downward trend in ET, passing through the MK trend test at the 95% confidence interval. ET showed a noticeable upward trend after 2000, despite its general downward trend. Increasing vegetation cover accelerated by human activities is the main driver of this upward trend, which will be explained in the Section 4. For the sake of verification, data (green dashed line in Figure 6a) were used to validate the ET derived by the water balance equation. The similarity between these two datasets, of which R-squared is 0.6 (p < 0.001), indicates the validity of ET derived by the water balance equation with the moving average method.
The ET ratio describes the portion of precipitation allocated to ET in the Budyko equation, which is more meaningful than the quantity of ET when describing changes in hydrological processes in a watershed. Figure 6b demonstrates the temporal change in the ET ratio in the WRW. The significant upward trend (dashed line) of the ET ratio implies that the proportion of ET continued to increase over the 52 years (detected with the MK trend test at the 95% significance level), although the magnitude of ET showed a downward trend.
3.5. Elasticity of ET Related to Each Climatic Variable
To assess the climatic impact on ET individually, the elasticity of ET related to each climatic variable was obtained with the elasticity method in Section 2, namely, = 0.79, , , , . The values of these elasticities suggest that a 10% increase in , , , and will result in a 7.9%, 1.3%, 0.6%, and 0.5% increase in ET, and that a 10% increase in will induce a 1% reduction in ET. The magnitude of the elasticity related to , which is at least 6 times larger than that of the other climatic variables, implies that ET is more sensitive to precipitation in the WRW.
Combining the change rates of these climatic variables and the corresponding elasticities, their contributions to ET change can be estimated, namely, mm/decade, mm/decade, mm/decade, mm/decade, and mm/decade. Adding these components up, the total ET change caused by climatic variables is estimated to be −10.69 mm/decade, which is close to the ET change rate (−8.06 mm/decade) derived from observable data. This accurate estimation with the elasticity method shows its reliability. Furthermore, the estimated results indicate that decreasing precipitation is the main reason, and decreasing net radiation is the secondary reason for the reduction in ET. It should be noted that the weakening wind speed also contributes to this reduction. In contrast, regional warming led to an increase in ET in the WRW (1.00 mm/decade), which partly offset the negative contributions from the other climatic variables.
4. Discussion
Climate elasticity is an important method to assess hydrological responses to climate change. In this study, we derived the elasticities of ET related to different climatic variables. With the derived elasticities of ET, we investigated the mechanisms behind the significant decrease in ET in a nonhumid watershed. The results indicate that the remarkable changes in precipitation, air temperature, relative humidity, net radiation, and wind speed are closely related to the change in ET. The elasticities related to these climatic variables in descending order are: 0.79 (), 0.13 (), 0.06 (), 0.05 (), and −0.1 (). Moreover, the contribution of each variable to the change in ET was estimated, namely, −8.91 mm/decade (P), −2.53 mm/decade (), 1.00 mm/decade (), −0.62 mm/decade (), and 0.4 mm/decade (), respectively. We can see that the elasticity method can be used to quantitatively assess the hydrological impact of climate change. The results show that decreasing precipitation is the primary reason for the reduction in ET, and decreasing net radiation is the secondary reason. The weakening wind speed also contributes to the ET reduction. Clearly, regional warming (increasing ) and drying climate (deceasing ) lead to an increase in ET in the WRW. In summary, the elasticity analysis provides a quantitative understanding of the ET change in this nonhumid area under climate change.
ET in the WRW has shown a statistically significant downward trend over the past 52 years, whereas the ET ratio has shown a remarkable upward trend, meaning that ET has occupied an increasingly large proportion of the decreasing precipitation. The continuous increase in the ET ratio indicates the likelihood of reduction in streamflow and groundwater, as well as soil desiccation. This possibility has been proven by many studies in this area, which have demonstrated a continuing decrease in streamflow and groundwater, and the formation of a dry soil layer [55,56].
In spite of the general downward trend in ET, it should be pointed out that ET started to increase after 2000. This abrupt increase was tightly related to the GFGP (Grain for Green Project) conducted by the Chinese government [39]. Because the GFGP converted a large area of farmland to forest or grassland, vegetation cover in this area increased substantially. This remarkable increase in vegetation could have led to a redistribution of hydrological processes. The different components of the water budget over the period from 2002 to 2011 in the WRW are shown in Figure 7. In this period, runoff remained stable, and precipitation remained relatively steady even though it was lower in 2005. ET in the WRW shows an increasing trend, while the water storage anomaly derived from the GRACE dataset presents a decreasing trend. A significant negative correlation was detected between these two variables (p < 0.001), which implies that the growth of ET induced by reforestation is the main reason for the decrease in the water storage in the WRW over this period. Therefore, changing watershed characteristics induced by human activities are a nonnegligible factor for ET study.
Our analysis demonstrates that the water body area in the WRW has decreased from 0.8% to 0.6% over the last 25 years, which is quite insignificant in terms of the total area and its decline. In addition, the total urban area in the WRW has increased by only 0.1% (from 0.4% to 0.5%) in this underdeveloped region over the same period. Thus, the contribution of evaporation from these two land-use types to total ET in the WRW is not included in this study. This study concentrated on the influence of climatic variables on ET change on a long-term scale. The results of the elasticity analysis suggest that climatic impacts control ET change mainly on a long-term scale, including impacts from precipitation, net radiation, mean air temperature, relative humidity, and wind speed. However, the estimated ET change rate is smaller than that derived from observable data. A possible cause for this underestimation could be the absence of change in . Our study shows that the positive relationship between precipitation and ET has been weakening over the past years in this nonhumid area, implying the participation of other factors. Although decreasing precipitation is the first-order reason for the downward trend in ET in the WRW, with a contribution of about 66%, further research indicates that net radiation is another important factor causing ET change over the WRW. The contribution of net radiation to ET decline is approximately 30% of the contribution from precipitation. Based on analysis of sunshine duration, we found that global dimming is the main reason for the decreasing net radiation. Many studies have suggested that the reduction in pan evaporation in northwestern China can be attributed mainly to global dimming [53,54].
Besides global dimming, other factors affecting net radiation in the WRW should be considered. The annual and seasonal albedo of the WRW is shown in Figure 8a. The annual albedo obviously displays two different tendencies before and after 1999. Before 1999 it remains steady, except in 1989, and after 2000 it begins to decrease. The pattern of albedo in winter is clearly distinct from that in other seasons; in winter it stays nearly the same before 1999 and shows large fluctuations after 1999; the extreme value in 1989 in the annual series originates from the winter of this year. Meanwhile, the patterns of the other seasons are similar, all displaying downward trends after 1999. Given the reforestation introduced by the GFGP, it can be concluded that the rapid vegetation growth results in a decrease in albedo, and the same conclusion can be made based on the remarkable negative relevant relations between albedo and NDVI in summer (Figure 8b). The decreasing albedo induced by vegetation growth causes the watershed to receive more solar radiation and compensates for the negative effect of global dimming.
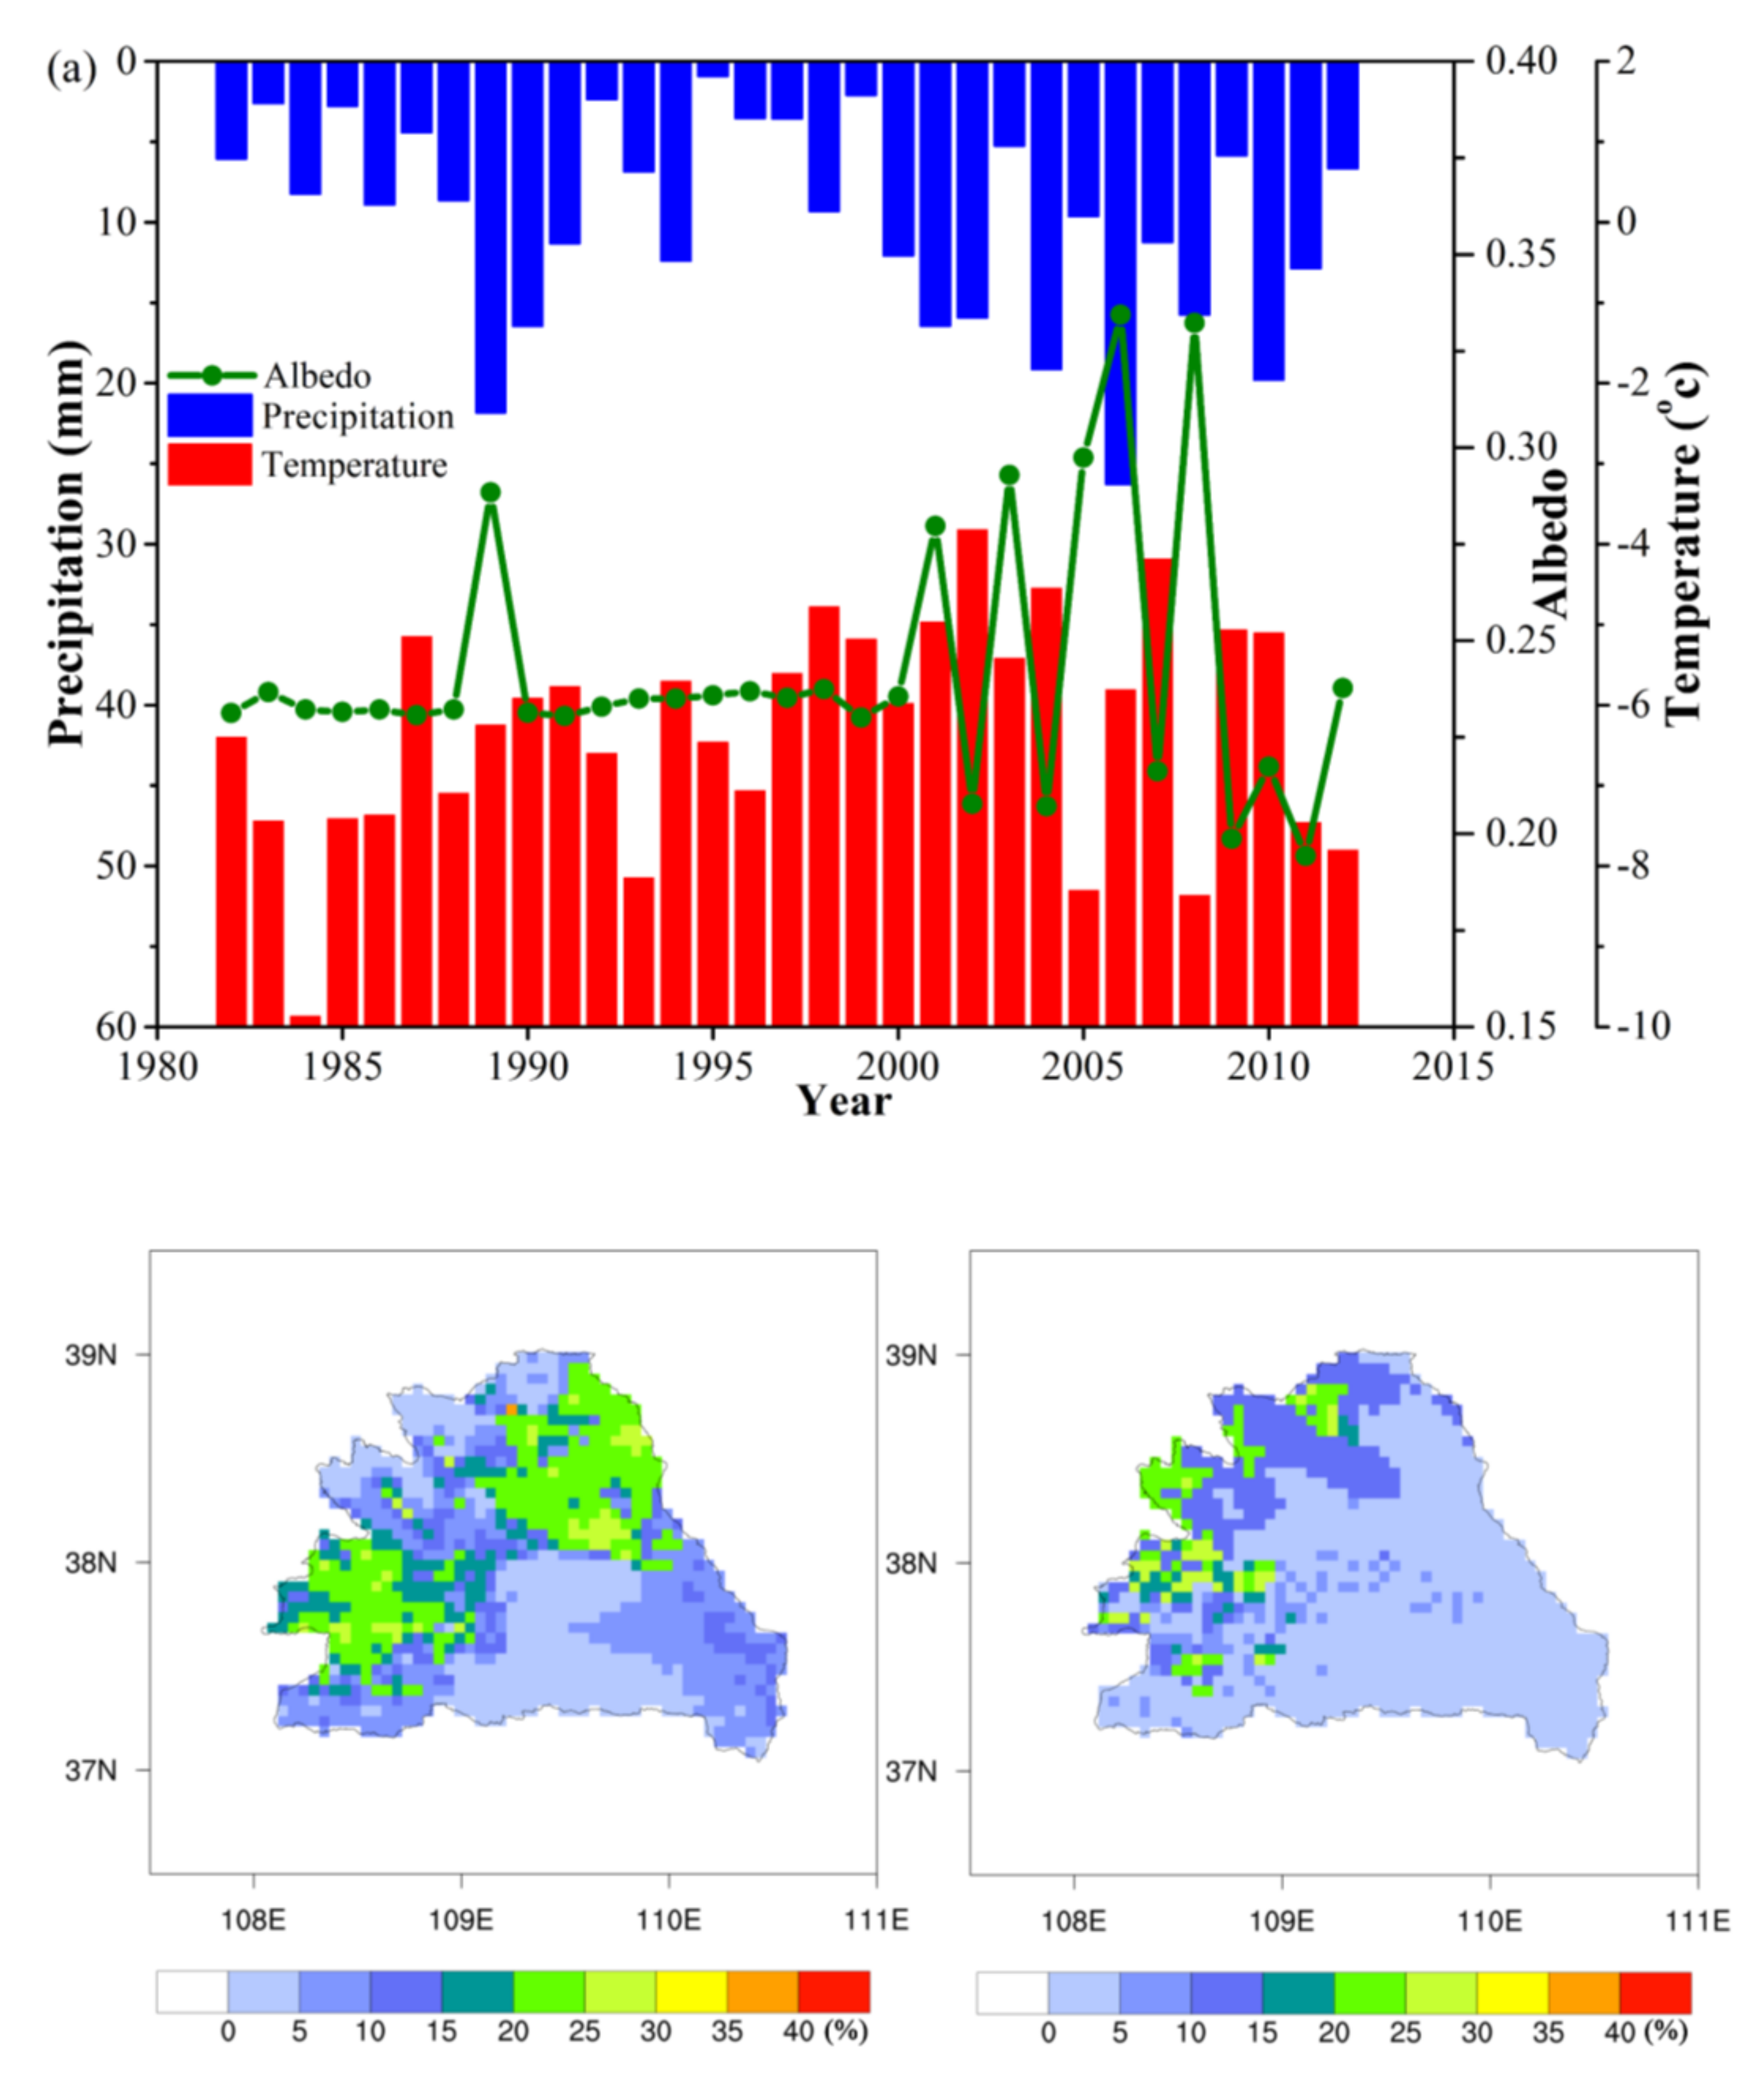
Regional warming can also alter the albedo. In Figure 9a, we compare the albedo in winter with winter precipitation. It is obvious that extreme snow cover caused the extreme albedo value in 1989. Winter precipitation increased significantly in this period and showed more severe interannual variation, which is the main reason for the increase and larger fluctuation in the winter albedo. Thus, years with heavy winter precipitation always correspond with a large albedo. However, there are some years in which this is not the case, for example 2004. When comparing the albedo in winter with winter temperature, we found that the albedo is also influenced by temperature in winter. Lower temperatures are conducive to snow conservation. Conversely, higher temperatures in winter result in the ablation of snow and lead to a lower albedo, even when there is a lot of snow. Figure 9b shows the spatial distribution of snow cover for two periods (2002–2004 and 2009–2011) in the WRW. The considerable difference between these two periods suggests that regional warming led to the decline in snow cover. In summary, both temporal and spatial analysis demonstrate that climate change can affect the energy budget of a watershed by changing albedo.
5. Conclusions
This study quantitatively assessed contributions from climatic variables to the change in ET in the WRW with the elasticity method based on the Budyko equation. The temporal changes in climatic variables related to ET were analyzed. Annual precipitation in the WRW decreased at a rate of 13 mm per decade, and its dominant impact on ET became weaker over time. The WRW was experiencing droughts with longer duration and higher magnitude. Annual showed a significant downward trend and declined by 10 mm per decade. The decline of occurred mainly from May to September. Our analysis indicates that the of the WRW had the highest sensitivity to net radiation, followed in descending order by mean relative humidity, mean air temperature, and wind speed. ET in the WRW generally presented a significant downward trend, despite its upward trend after 2000. The ratio of ET to precipitation has increased continually over the past 52 years. Decreasing precipitation was the first-order cause, and decreasing net radiation was the secondary cause for the reduction in ET. The weakening wind speed also contributed to this reduction. In contrast, regional warming led to an increase in ET, which partly offset the negative contributions from the other climatic variables. Further, reforestation can affect the energy budget of a watershed by decreasing albedo, which then compensates for the negative influence of global dimming. The combined effects of precipitation and temperature can affect the energy budget of a watershed by causing large fluctuation in winter albedo.
Author Contributions
L.T. conducted the modeling, performed the analysis, and drafted the manuscript; J.J. and P.W. designed the study, interpreted the results, and supervised the research; G.-y.N. contributed ideas during analysis and interpretation, and edited the paper.
Funding
This research was funded by the National Natural Science Foundation of China (No. 41571030, No. 91637209, No. 91737306), and it was also partially funded by Utah Agricultural Experiment Station.
Conflicts of Interest
The authors declare no conflict of interest.
References
- Elsner, M.M.; Cuo, L.; Voisin, N.; Deems, J.S.; Hamlet, A.F.; Vano, J.A.; Mickelson, K.E.B.; Lee, S.-Y.; Lettenmaier, D.P. Implications of 21st century climate change for the hydrology of Washington State. Clim. Chang. 2010, 102, 225–260. [Google Scholar] [CrossRef] [Green Version]
- Haddeland, I.; Heinke, J.; Biemans, H.; Eisner, S.; Flörke, M.; Hanasaki, N.; Konzmann, M.; Ludwig, F.; Masaki, Y.; Schewe, J.; et al. Global water resources affected by human interventions and climate change. Proc. Natl. Acad. Sci. USA 2014, 111, 3251–3256. [Google Scholar] [CrossRef] [PubMed]
- Piao, S.; Ciais, P.; Huang, Y.; Shen, Z.; Peng, S.; Li, J.; Zhou, L.; Liu, H.; Ma, Y.; Ding, Y.; et al. The impacts of climate change on water resources and agriculture in China. Nature 2010, 467, 43. [Google Scholar] [CrossRef] [PubMed]
- Chen, J.; Brissette, F.P.; Poulin, A.; Leconte, R. Overall uncertainty study of the hydrological impacts of climate change for a Canadian watershed. Water Resour. Res. 2011, 47. [Google Scholar] [CrossRef] [Green Version]
- Immerzeel, W.W.; van Beek, L.P.H.; Bierkens, M.F.P. Climate change will affect the Asian water towers. Science 2010, 328, 1382–1385. [Google Scholar] [CrossRef] [PubMed]
- Hagemann, S.; Chen, C.; Clark, D.B.; Folwell, S.; Gosling, S.N.; Haddeland, I.; Hanasaki, N.; Heinke, J.; Ludwig, F.; Voss, F.; et al. Climate change impact on available water resources obtained using multiple global climate and hydrology models. Earth Syst. Dyn. 2013, 4, 129–144. [Google Scholar] [CrossRef]
- Viviroli, D.; Archer, D.R.; Buytaert, W.; Fowler, H.J.; Greenwood, G.B.; Hamlet, A.F.; Huang, Y.; Koboltschnig, G.; Litaor, M.I.; López-Moreno, J.I.; et al. Climate change and mountain water resources: Overview and recommendations for research, management and policy. Hydrol. Earth Syst. Sci. 2011, 15, 471–504. [Google Scholar] [CrossRef]
- Bavay, M.; Grünewald, T.; Lehning, M. Response of snow cover and runoff to climate change in high Alpine catchments of Eastern Switzerland. Adv. Water Resour. 2013, 55, 4–16. [Google Scholar] [CrossRef]
- Green, T.R.; Taniguchi, M.; Kooi, H.; Gurdak, J.J.; Allen, D.M.; Hiscock, K.M.; Treidel, H.; Aureli, A. Beneath the surface of global change: Impacts of climate change on groundwater. J. Hydrol. 2011, 405, 532–560. [Google Scholar] [CrossRef]
- Sorg, A.; Bolch, T.; Stoffel, M.; Solomina, O.; Beniston, M. Climate change impacts on glaciers and runoff in Tien Shan (Central Asia). Nat. Clim. Chang. 2012, 2, 725. [Google Scholar] [CrossRef]
- Jung, M.; Reichstein, M.; Ciais, P.; Seneviratne, S.I.; Sheffield, J.; Goulden, M.L.; Bonan, G.; Cescatti, A.; Chen, J.; de Jeu, R.; et al. Recent decline in the global land evapotranspiration trend due to limited moisture supply. Nature 2010, 467, 951. [Google Scholar] [CrossRef] [PubMed]
- Bonan, G. Ecological Climatology: Concepts and Applications, 3rd ed.; Cambridge University Press: New York, NY, USA, 2016; p. 195. ISBN 978-1-107-61905-0. [Google Scholar]
- Huo, Z.; Dai, X.; Feng, S.; Kang, S.; Huang, G. Effect of climate change on reference evapotranspiration and aridity index in arid region of China. J. Hydrol. 2013, 492, 24–34. [Google Scholar] [CrossRef]
- Montenegro, A.; Ragab, R. Hydrological response of a Brazilian semi-arid catchment to different land use and climate change scenarios: A modelling study. Hydrol. Process. 2010, 24, 2705–2723. [Google Scholar] [CrossRef]
- Chen, H.; Sun, J. Changes in drought characteristics over China using the standardized precipitation evapotranspiration index. J. Clim. 2015, 28, 5430–5447. [Google Scholar] [CrossRef]
- Das, P.K.; Dutta, D.; Sharma, J.R.; Dadhwal, V.K. Trends and behaviour of meteorological drought (1901-2008) over Indian region using standardized precipitation-evapotranspiration index. Int. J. Climatol. 2016, 36, 909–916. [Google Scholar] [CrossRef]
- Dias, L.C.P.; Macedo, M.N.; Costa, M.H.; Coe, M.T.; Neill, C. Effects of land cover change on evapotranspiration and streamflow of small catchments in the Upper Xingu River Basin, Central Brazil. J. Hydrol. Reg. Stud. 2015, 4, 108–122. [Google Scholar] [CrossRef]
- Valipour, M.; Gholami Sefidkouhi, M.A.; Raeini-Sarjaz, M. Selecting the best model to estimate potential evapotranspiration with respect to climate change and magnitudes of extreme events. Agric. Water Manag. 2017, 180, 50–60. [Google Scholar] [CrossRef]
- Zhang, K.; Kimball, J.S.; Nemani, R.R.; Running, S.W.; Hong, Y.; Gourley, J.J.; Yu, Z. Vegetation greening and climate change promote multidecadal rises of global land evapotranspiration. Sci. Rep. 2015, 5, 15956. [Google Scholar] [CrossRef] [PubMed]
- Rouholahnejad Freund, E.; Kirchner, J.W. A Budyko framework for estimating how spatial heterogeneity and lateral moisture redistribution affect average evapotranspiration rates as seen from the atmosphere. Hydrol. Earth Syst. Sci. 2017, 21, 217–233. [Google Scholar] [CrossRef] [Green Version]
- Westhoff, M.; Zehe, E.; Archambeau, P.; Dewals, B. Does the Budyko curve reflect a maximum-power state of hydrological systems? A backward analysis. Hydrol. Earth Syst. Sci. 2016, 20, 479–486. [Google Scholar] [CrossRef]
- Greve, P.; Gudmundsson, L.; Orlowsky, B.; Seneviratne, S.I. A two-parameter Budyko function to represent conditions under which evapotranspiration exceeds precipitation. Hydrol. Earth Syst. Sci. 2016, 20, 2195–2205. [Google Scholar] [CrossRef] [Green Version]
- Koppa, A.; Gebremichael, M. A framework for validation of remotely sensed precipitation and evapotranspiration based on the Budyko hypothesis. Water Resour. Res. 2017, 53, 8487–8499. [Google Scholar] [CrossRef]
- Koster, R.D.; Suarez, M.J. A simple framework for examining the interannual variability of land surface moisture fluxes. J. Clim. 1999, 12, 1911–1917. [Google Scholar] [CrossRef]
- Gao, G.; Fu, B.; Wang, S.; Liang, W.; Jiang, X. Determining the hydrological responses to climate variability and land use/cover change in the Loess Plateau with the Budyko framework. Sci. Total Environ. 2016, 557–558, 331–342. [Google Scholar] [CrossRef] [PubMed]
- Konapala, G.; Mishra, A.K. Three-parameter-based streamflow elasticity model: Application to MOPEX basins in the USA at annual and seasonal scales. Hydrol. Earth Syst. Sci. 2016, 20, 2545–2556. [Google Scholar] [CrossRef]
- Zhang, S.; Yang, H.; Yang, D.; Jayawardena, A.W. Quantifying the effect of vegetation change on the regional water balance within the Budyko framework. Geophys. Res. Lett. 2016, 43, 1140–1148. [Google Scholar] [CrossRef]
- Yao, J.; Mao, W.; Yang, Q.; Xu, X.; Liu, Z. Annual actual evapotranspiration in inland river catchments of China based on the Budyko framework. Stoch. Environ. Res. Risk. Assess. 2017, 31, 1409–1421. [Google Scholar] [CrossRef]
- Sun, S.; Chen, H.; Ju, W.; Song, J.; Zhang, H.; Sun, J.; Fang, Y. Effects of climate change on annual streamflow using climate elasticity in Poyang Lake Basin, China. Theor. Appl. Climatol. 2013, 112, 169–183. [Google Scholar] [CrossRef]
- Sun, Y.; Tian, F.; Yang, L.; Hu, H. Exploring the spatial variability of contributions from climate variation and change in catchment properties to streamflow decrease in a mesoscale basin by three different methods. J. Hydrol. 2014, 508, 170–180. [Google Scholar] [CrossRef]
- Wang, W.; Shao, Q.; Yang, T.; Peng, S.; Xing, W.; Sun, F.; Luo, Y. Quantitative assessment of the impact of climate variability and human activities on runoff changes: A case study in four catchments of the Haihe River basin, China. Hydrol. Process. 2013, 27, 1158–1174. [Google Scholar] [CrossRef]
- Jiang, C.; Xiong, L.; Wang, D.; Liu, P.; Guo, S.; Xu, C.-Y. Separating the impacts of climate change and human activities on runoff using the Budyko-type equations with time-varying parameters. J. Hydrol. 2015, 522, 326–338. [Google Scholar] [CrossRef]
- Xu, X.; Yang, D.; Yang, H.; Lei, H. Attribution analysis based on the Budyko hypothesis for detecting the dominant cause of runoff decline in Haihe basin. J. Hydrol. 2014, 510, 530–540. [Google Scholar] [CrossRef]
- McInnes, K.L.; Erwin, T.A.; Bathols, J.M. Global Climate Model projected changes in 10 m wind speed and direction due to anthropogenic climate change. Atmos. Sci. Lett. 2011, 12, 325–333. [Google Scholar] [CrossRef] [Green Version]
- Young, I.R.; Zieger, S.; Babanin, A.V. Global trends in wind speed and wave height. Science 2011, 332, 451–455. [Google Scholar] [CrossRef] [PubMed]
- Roderick, M.L.; Farquhar, G.D. A simple framework for relating variations in runoff to variations in climatic conditions and catchment properties. Water Resour. Res. 2011, 47. [Google Scholar] [CrossRef] [Green Version]
- Allen, R.G.; Pereira, L.S.; Raes, D.; Smith, M.J.F. Crop Evapotranspiration-Guidelines for Computing Crop Water Requirements-FAO Irrigation and Drainage Paper 56; FAO: Rome, Italy, 1998; Volume 300, p. D05109. [Google Scholar]
- Zhao, G.; Mu, X.; Wen, Z.; Wang, F.; Gao, P. Soil erosion, conservation, and eco-environment changes in the Loess Plateau of China. Land Degrad. Dev. 2013, 24, 499–510. [Google Scholar] [CrossRef]
- Fan, X.; Ma, Z.; Yang, Q.; Han, Y.; Mahmood, R.; Zheng, Z. Land use/land cover changes and regional climate over the Loess Plateau during 2001–2009. Part I: Observational evidence. Clim. Chang. 2015, 129, 427–440. [Google Scholar] [CrossRef]
- Li, Z.; Zheng, F.-L.; Liu, W.-Z.; Flanagan, D.C. Spatial distribution and temporal trends of extreme temperature and precipitation events on the Loess Plateau of China during 1961–2007. Quat. Int. 2010, 226, 92–100. [Google Scholar] [CrossRef]
- Hamed, K.H. Trend detection in hydrologic data: The Mann-Kendall trend test under the scaling hypothesis. J. Hydrol. 2008, 349, 350–363. [Google Scholar] [CrossRef]
- Jung, M.; Reichstein, M.; Bondeau, A. Towards global empirical upscaling of FLUXNET eddy covariance observations: Validation of a model tree ensemble approach using a biosphere model. Biogeosciences 2009, 6, 2001–2013. [Google Scholar] [CrossRef]
- Dietterich, T.G. An experimental comparison of three methods for constructing ensembles of decision trees: Bagging, boosting, and randomization. Mach. Learn. 2000, 40, 139–157. [Google Scholar] [CrossRef]
- Fisher, J.B.; Melton, F.; Middleton, E.; Hain, C.; Anderson, M.; Allen, R.; McCabe, M.F.; Hook, S.; Baldocchi, D.; Townsend, P.A.; et al. The future of evapotranspiration: Global requirements for ecosystem functioning, carbon and climate feedbacks, agricultural management, and water resources. Water Resour. Res. 2017, 53, 2618–2626. [Google Scholar] [CrossRef] [Green Version]
- Li, X.; He, Y.; Zeng, Z.; Lian, X.; Wang, X.; Du, M.; Jia, G.; Li, Y.; Ma, Y.; Tang, Y.; et al. Spatiotemporal pattern of terrestrial evapotranspiration in China during the past thirty years. Agric. For. Meteorol. 2018, 259, 131–140. [Google Scholar] [CrossRef]
- Jacob, T.; Wahr, J.; Pfeffer, W.T.; Swenson, S. Recent contributions of glaciers and ice caps to sea level rise. Nature 2012, 482, 514. [Google Scholar] [CrossRef] [PubMed]
- Ibrahim, Y.; Balzter, H.; Kaduk, J.; Tucker, C. Land degradation assessment using residual trend analysis of GIMMS NDVI3g, soil moisture and rainfall in Sub-Saharan West Africa from 1982 to 2012. Remote Sens. 2015, 7, 5471–5494. [Google Scholar] [CrossRef]
- Zhang, B.; Wu, P.; Zhao, X.; Wang, Y.; Gao, X. Changes in vegetation condition in areas with different gradients (1980–2010) on the Loess Plateau, China. Environ. Earth Sci. 2013, 68, 2427–2438. [Google Scholar] [CrossRef]
- Liang, S.; Zhang, X.; Xiao, Z.; Cheng, J.; Liu, Q.; Zhao, X. Global LAnd Surface Satellite (GLASS) Products: Algorithms, Validation and Analysis, 1st ed.; Springer Science & Business Media: New York, NY, USA, 2013; p. 158. ISBN 978. [Google Scholar]
- Han, S.; Hu, H.; Yang, D.; Tian, F. A complementary relationship evaporation model referring to the Granger model and the advection-aridity model. Hydrol. Process. 2011, 25, 2094–2101. [Google Scholar] [CrossRef]
- Zuo, H.; Chen, B.; Wang, S.; Guo, Y.; Zuo, B.; Wu, L.; Gao, X. Observational study on complementary relationship between pan evaporation and actual evapotranspiration and its variation with pan type. Agric. For. Meteorol. 2016, 222, 1–9. [Google Scholar] [CrossRef]
- Root, T.L.; Price, J.T.; Hall, K.R.; Schneider, S.H.; Rosenzweig, C.; Pounds, J.A. Fingerprints of global warming on wild animals and plants. Nature 2003, 421, 57. [Google Scholar] [CrossRef]
- Yang, H.; Yang, D. Derivation of climate elasticity of runoff to assess the effects of climate change on annual runoff. Water Resour. Res. 2011, 47. [Google Scholar] [CrossRef] [Green Version]
- Yang, H.; Yang, D. Climatic factors influencing changing pan evaporation across China from 1961 to 2001. J. Hydrol. 2012, 414–415, 184–193. [Google Scholar] [CrossRef]
- Wang, Y.; Shao, M.A.; Zhu, Y.; Liu, Z. Impacts of land use and plant characteristics on dried soil layers in different climatic regions on the Loess Plateau of China. Agric. For. Meteorol. 2011, 151, 437–448. [Google Scholar] [CrossRef]
- Zhang, X.; Zhang, L.; Zhao, J.; Rustomji, P.; Hairsine, P. Responses of streamflow to changes in climate and land use/cover in the Loess Plateau, China. Water Resour. Res. 2008, 44. [Google Scholar] [CrossRef] [Green Version]
Figure 1.
Diagram of the Budyko equation. The 1:1 line demonstrates the limitation by available energy (), and the horizontal dashed line demonstrates the limitation by available water ( ). (the ET ratio) is the ratio of evapotranspiration ( ) to precipitation ( ). (the aridity index) is the ratio of potential evapotranspiration ( ) to .

Figure 2.
Location of the Wuding River Watershed (WRW) (right) in the Loess Plateau of China (left), with its streams (asterisk shows the river outlet).
Figure 2.
Location of the Wuding River Watershed (WRW) (right) in the Loess Plateau of China (left), with its streams (asterisk shows the river outlet).

Figure 3.
Annual precipitation anomaly in the Wuding River Watershed from 1960 to 2011; the dashed line denotes its temporal trend.
Figure 3.
Annual precipitation anomaly in the Wuding River Watershed from 1960 to 2011; the dashed line denotes its temporal trend.

Figure 4.
Temporal changes in annual (potential evapotranspiration) in the Wuding River Watershed from 1960 to 2011; the dashed line denotes its temporal trend.
Figure 4.
Temporal changes in annual (potential evapotranspiration) in the Wuding River Watershed from 1960 to 2011; the dashed line denotes its temporal trend.

Figure 5.
Temporal changes in the climatic variables related to (potential evapotranspiration) calculation in the Wuding River Watershed from 1960 to 2011: (a) mean air temperature; (b) wind speed; (c) relative humidity; (d) net radiation. Dashed lines denote the temporal trends of these variables.
Figure 5.
Temporal changes in the climatic variables related to (potential evapotranspiration) calculation in the Wuding River Watershed from 1960 to 2011: (a) mean air temperature; (b) wind speed; (c) relative humidity; (d) net radiation. Dashed lines denote the temporal trends of these variables.

Figure 6.
(a) Temporal changes in evapotranspiration (ET) in the Wuding River Watershed (WRW); green dashed line denotes temporal changes in the (independent ET data obtained by the model tree ensemble method); (b) temporal changes in ET ratio (ratio of ET to precipitation) in the WRW. Here ET was derived by the water balance equation using a moving average method with a moving length of 13 years. Black dashed lines denote the temporal trend.
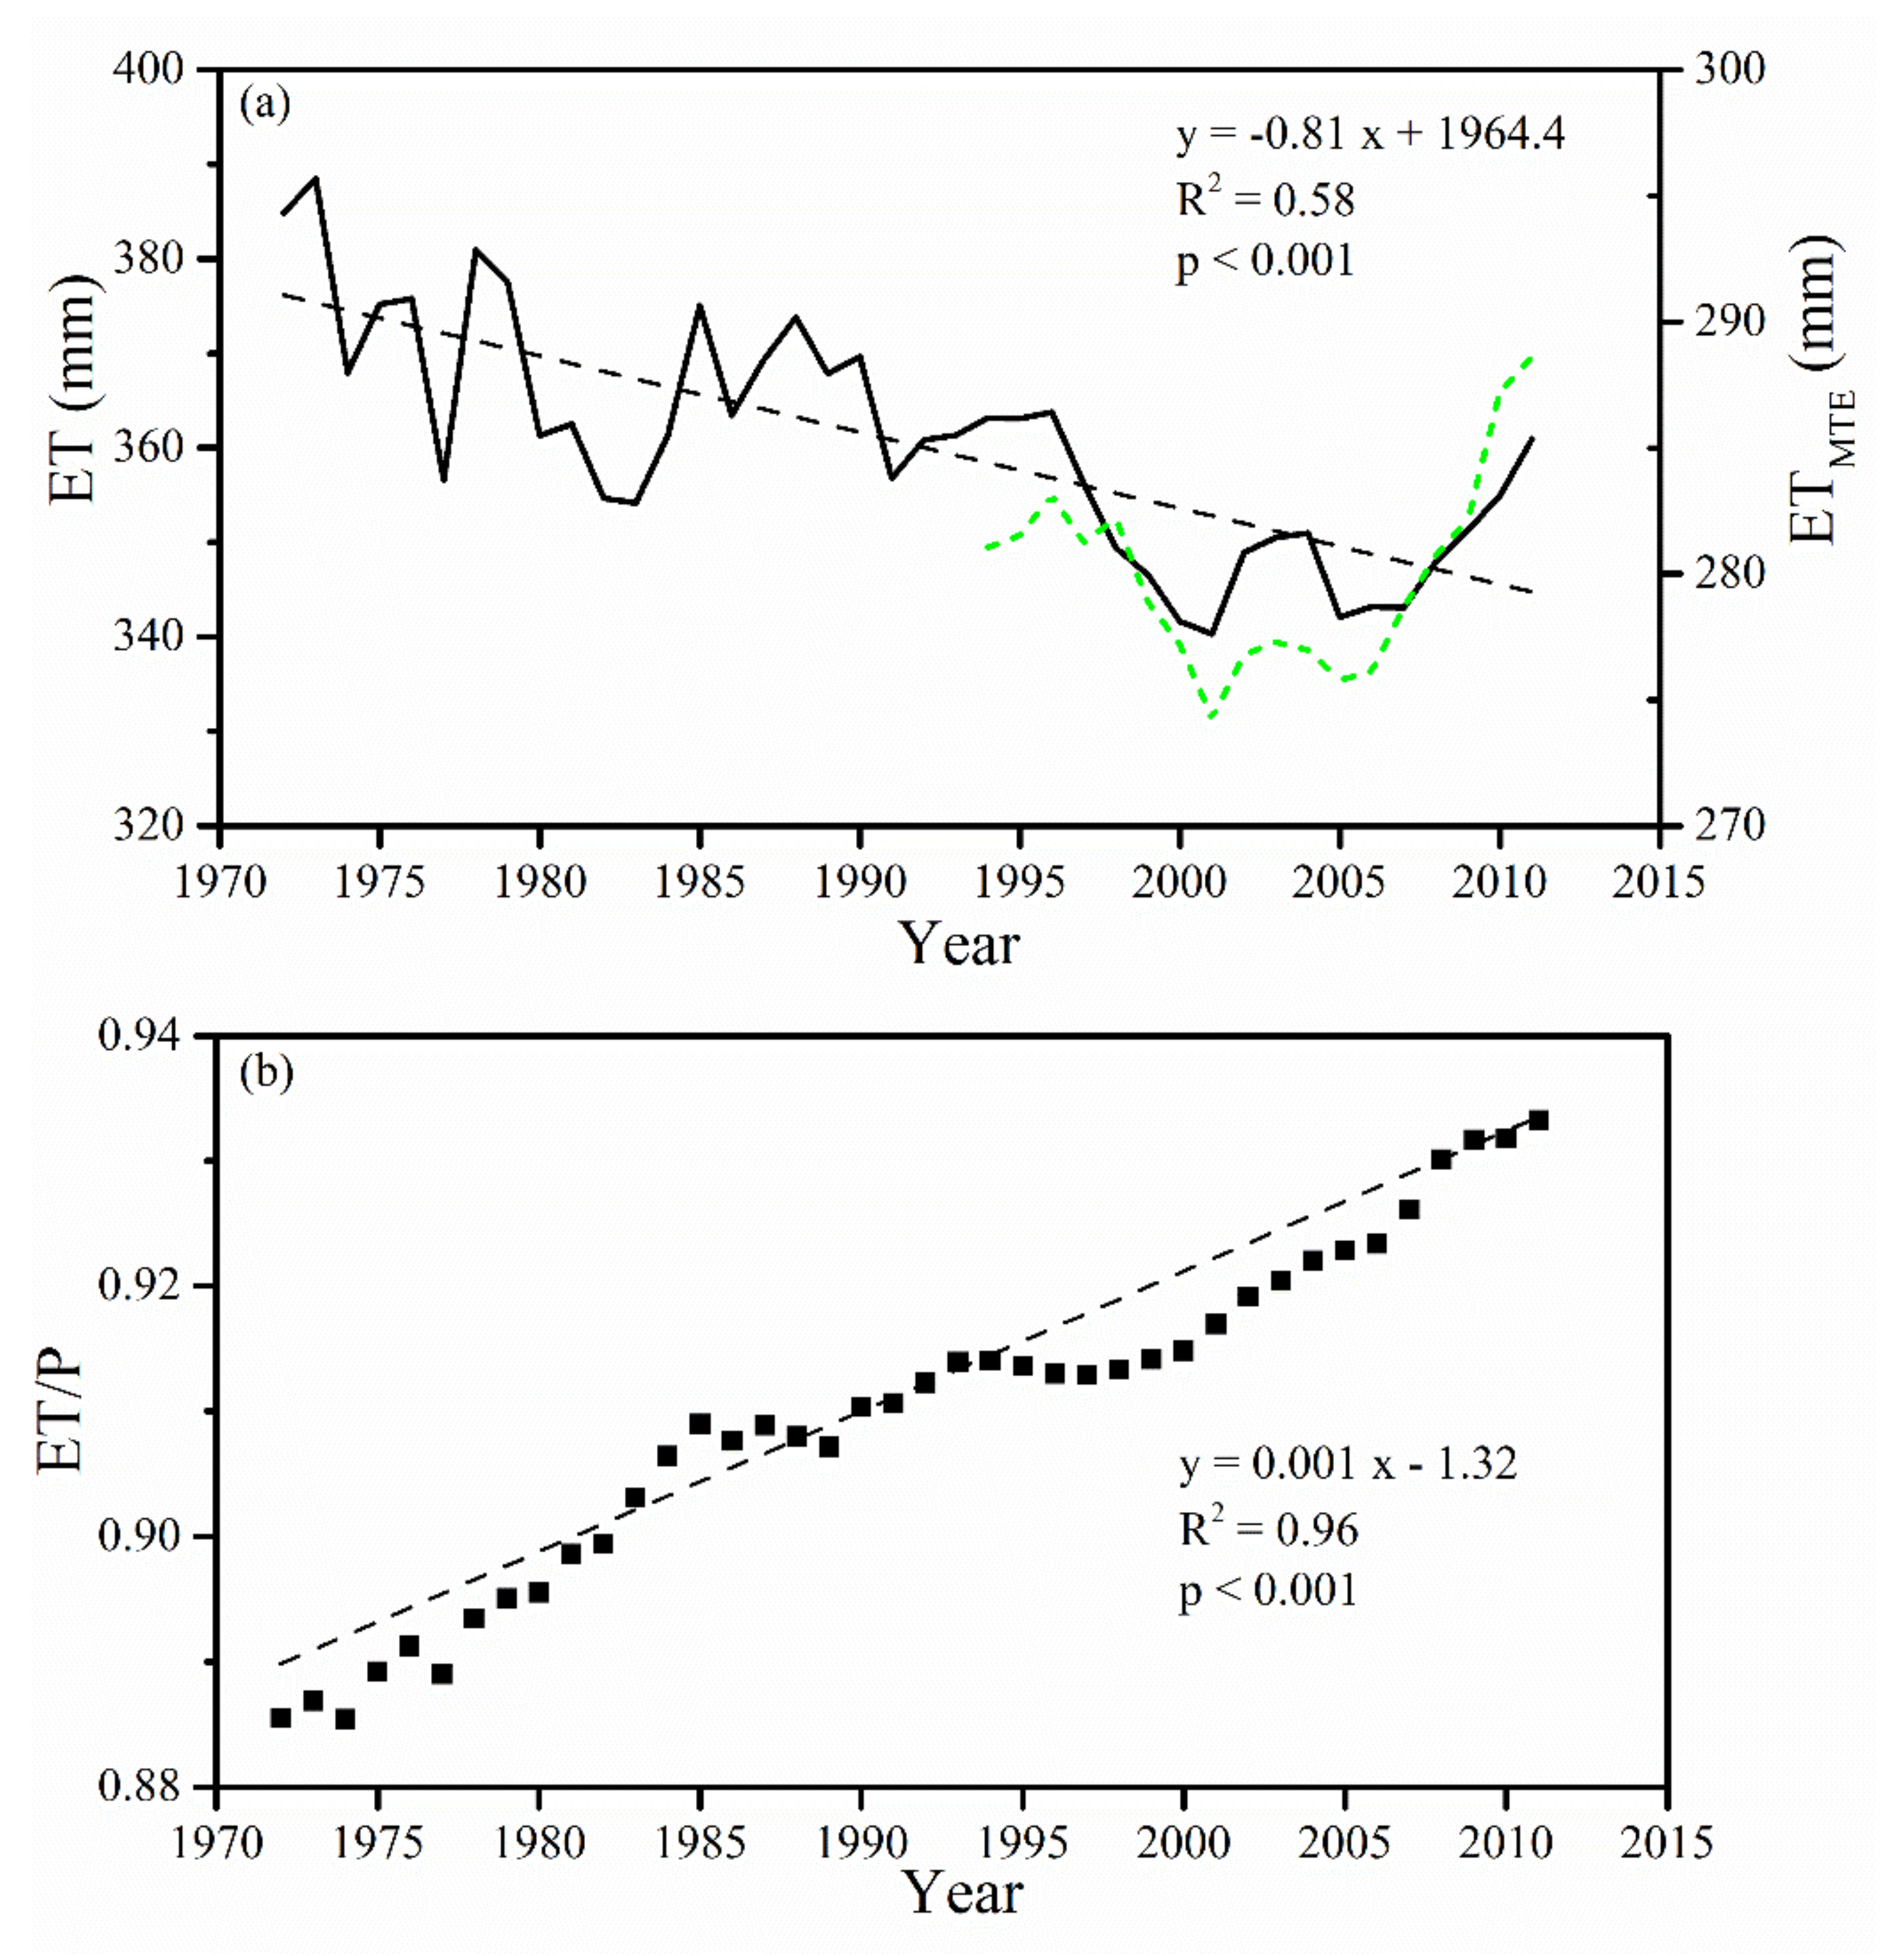
Figure 7.
Temporal changes in water storage anomaly (WSA), precipitation, streamflow, and evapotranspiration (ET) in the Wuding River Watershed over the period from 2002 through 2011.
Figure 7.
Temporal changes in water storage anomaly (WSA), precipitation, streamflow, and evapotranspiration (ET) in the Wuding River Watershed over the period from 2002 through 2011.

Figure 8.
(a) Annual and seasonal time series of albedo in the Wuding River Watershed (WRW) over the period from 1982 through 2011; (b) Temporal changes in summer normalized difference vegetation index (NDVI) and summer albedo in the WRW over the period from 2000 through 2011.
Figure 8.
(a) Annual and seasonal time series of albedo in the Wuding River Watershed (WRW) over the period from 1982 through 2011; (b) Temporal changes in summer normalized difference vegetation index (NDVI) and summer albedo in the WRW over the period from 2000 through 2011.
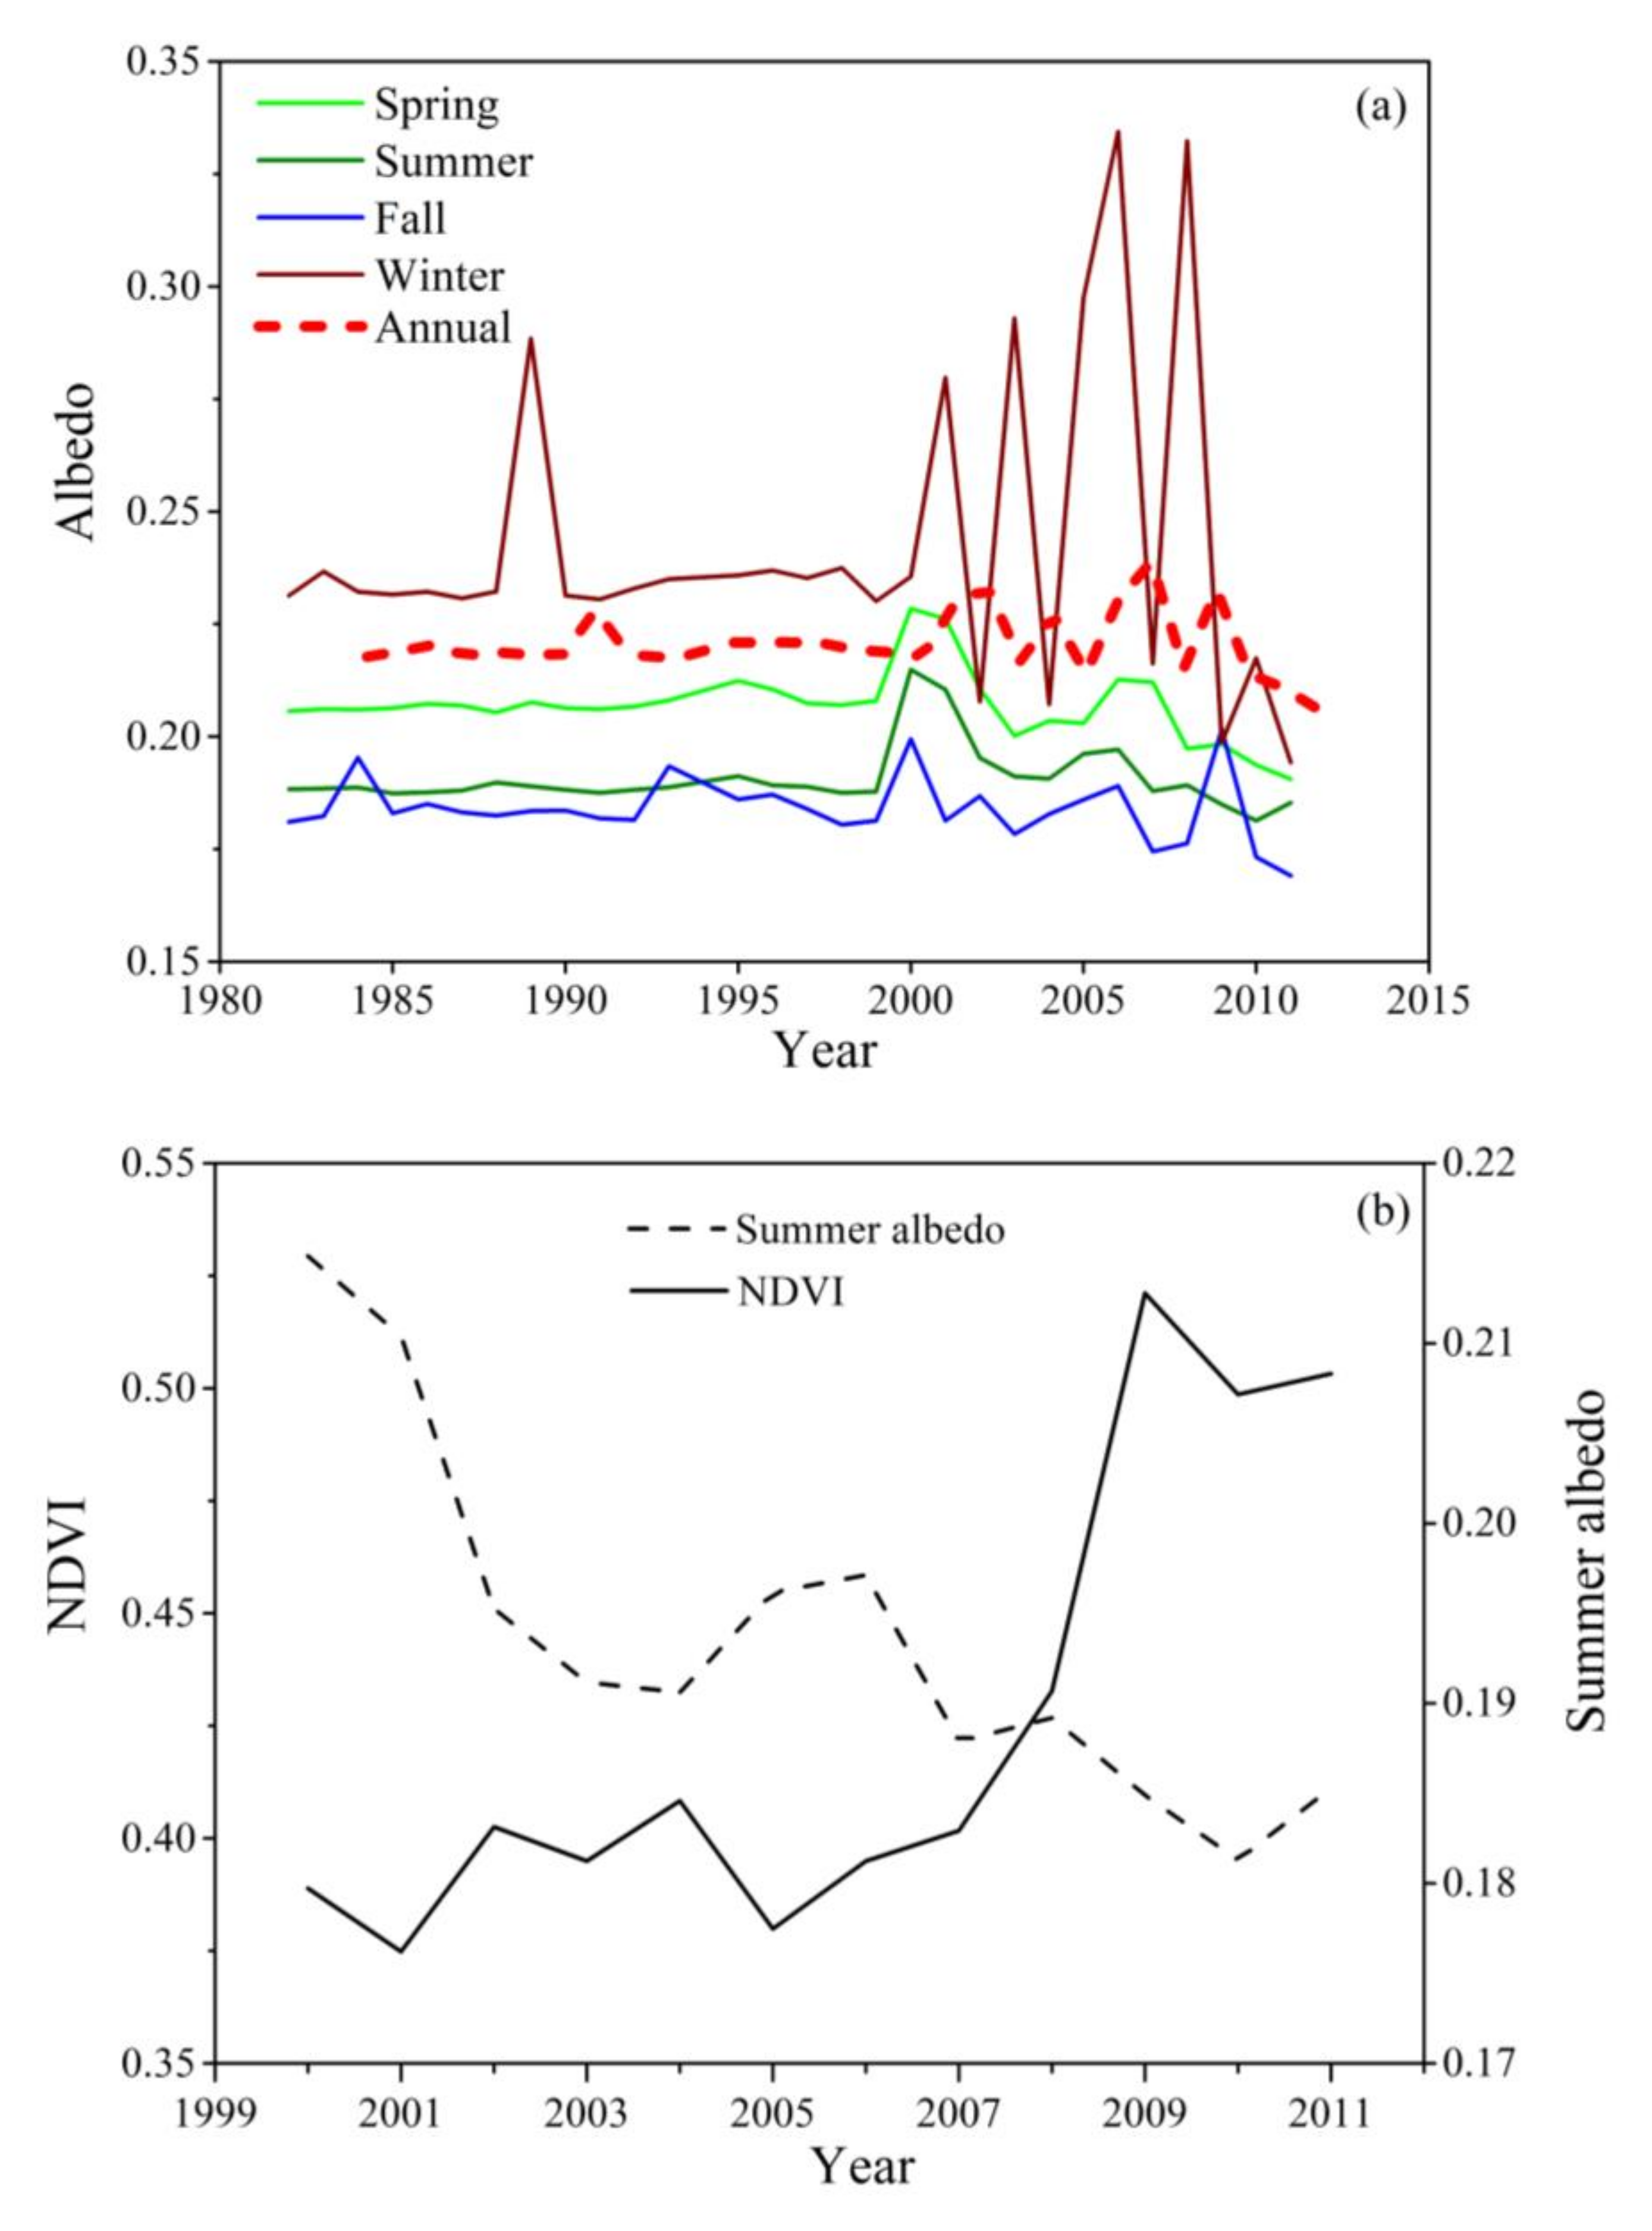
Figure 9.
(a) Temporal changes in precipitation, temperature, and albedo in winter in the Wuding River Watershed (WRW) over the period 1982–2012; (b) spatial distribution of average snow cover extent over the period 2002–2004 (left) and 2009–2011 (right) in the WRW.
Figure 9.
(a) Temporal changes in precipitation, temperature, and albedo in winter in the Wuding River Watershed (WRW) over the period 1982–2012; (b) spatial distribution of average snow cover extent over the period 2002–2004 (left) and 2009–2011 (right) in the WRW.

© 2018 by the authors. Licensee MDPI, Basel, Switzerland. This article is an open access article distributed under the terms and conditions of the Creative Commons Attribution (CC BY) license (http://creativecommons.org/licenses/by/4.0/).
Share and Cite
MDPI and ACS Style
Tian, L.; Jin, J.; Wu, P.; Niu, G.-y. Assessment of the Effects of Climate Change on Evapotranspiration with an Improved Elasticity Method in a Nonhumid Area. Sustainability 2018, 10, 4589. https://doi.org/10.3390/su10124589
AMA Style
Tian L, Jin J, Wu P, Niu G-y. Assessment of the Effects of Climate Change on Evapotranspiration with an Improved Elasticity Method in a Nonhumid Area. Sustainability. 2018; 10(12):4589. https://doi.org/10.3390/su10124589
Chicago/Turabian StyleTian, Lei, Jiming Jin, Pute Wu, and Guo-yue Niu. 2018. "Assessment of the Effects of Climate Change on Evapotranspiration with an Improved Elasticity Method in a Nonhumid Area" Sustainability 10, no. 12: 4589. https://doi.org/10.3390/su10124589
Note that from the first issue of 2016, this journal uses article numbers instead of page numbers. See further details here.